Embed Size (px)
Citation preview
8/8/2019 4900 Altitude
http://slidepdf.com/reader/full/4900-altitude 1/78
Exercise at High AltitudeExercise at High Altitude
PED 4900PED 4900
8/8/2019 4900 Altitude
http://slidepdf.com/reader/full/4900-altitude 2/78
Gas Exchange at Sea LevelGas Exchange at Sea Level
Air has weight
Its weight is related to barometric pressure
8/8/2019 4900 Altitude
http://slidepdf.com/reader/full/4900-altitude 3/78
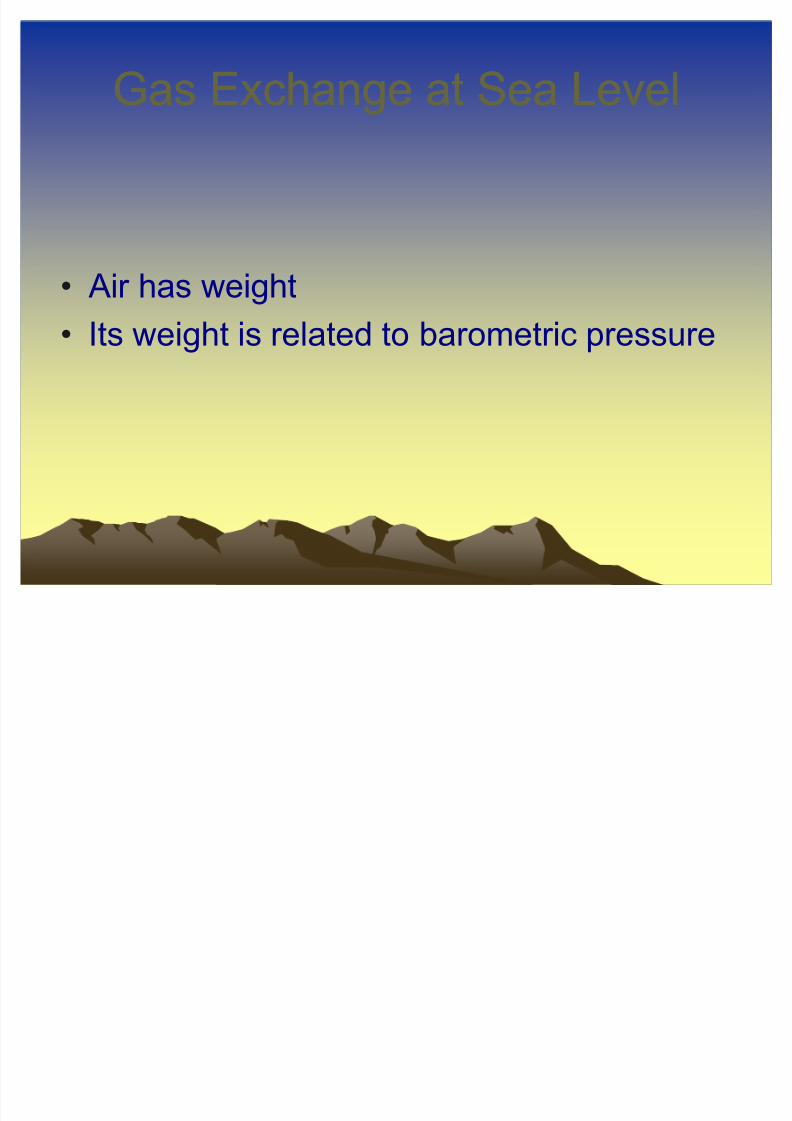
Dalton's Law
The total pressure of a mixture of gases equals the sum of the partial pressures of the individual gases in the mixture.
8/8/2019 4900 Altitude
http://slidepdf.com/reader/full/4900-altitude 4/78
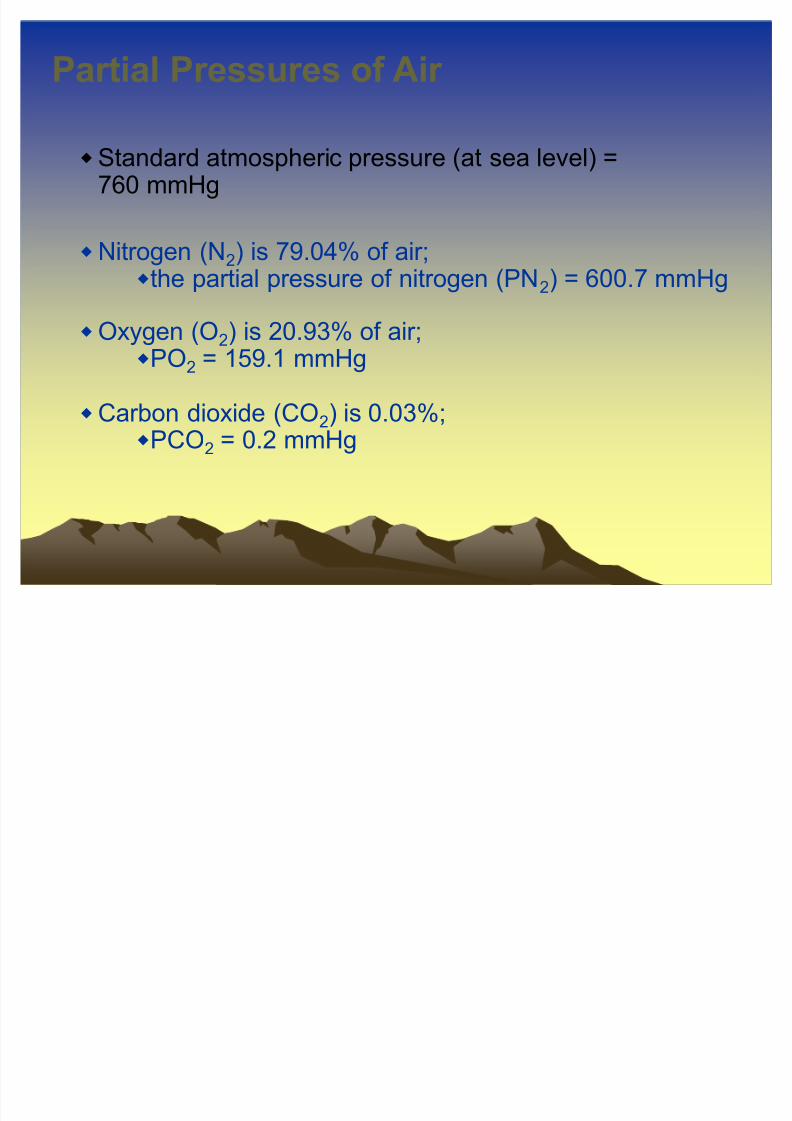
Partial Pressures of Air
Standard atmospheric pressure (at sea level) =760 mmHg
Nitrogen (N2) is 79.04% of air;
the partial pressure of nitrogen (PN2) = 600.7 mmHg
Oxygen (O2) is 20.93% of air;PO2 = 159.1 mmHg
Carbon dioxide (CO2) is 0.03%;PCO2 = 0.2 mmHg
8/8/2019 4900 Altitude
http://slidepdf.com/reader/full/4900-altitude 5/78
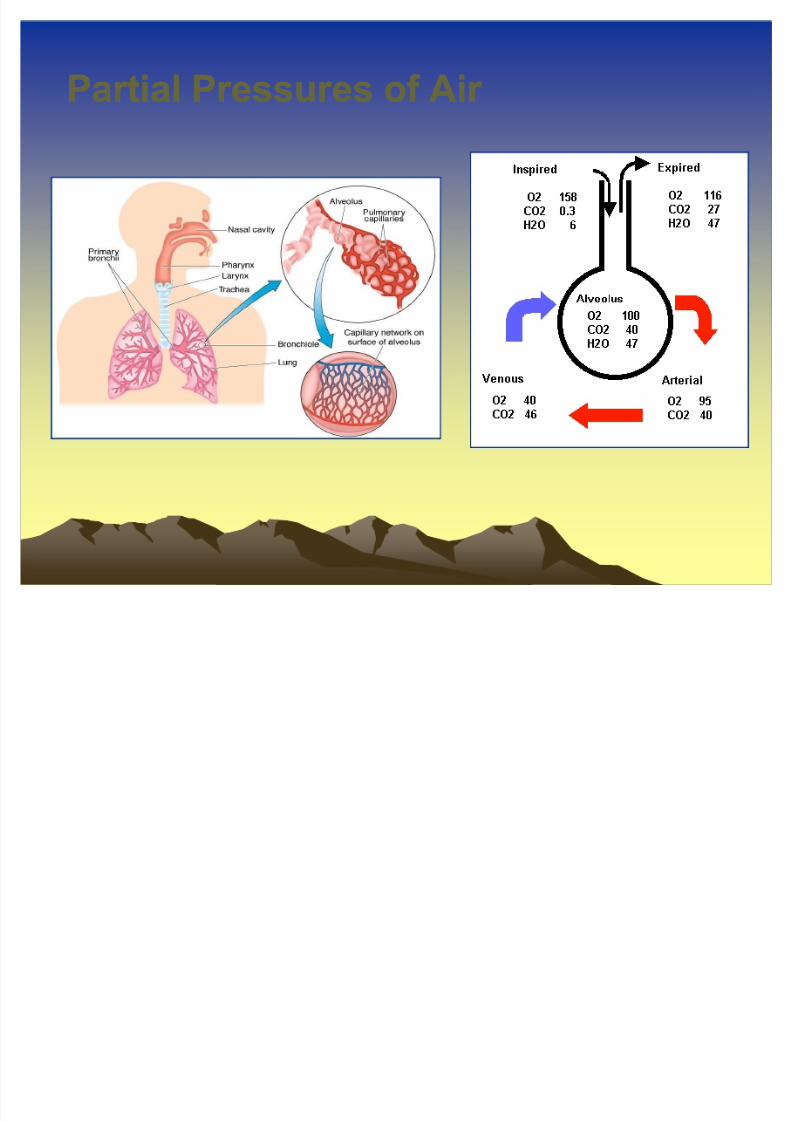
Partial Pressures of Air Partial Pressures of Air
8/8/2019 4900 Altitude
http://slidepdf.com/reader/full/4900-altitude 6/78
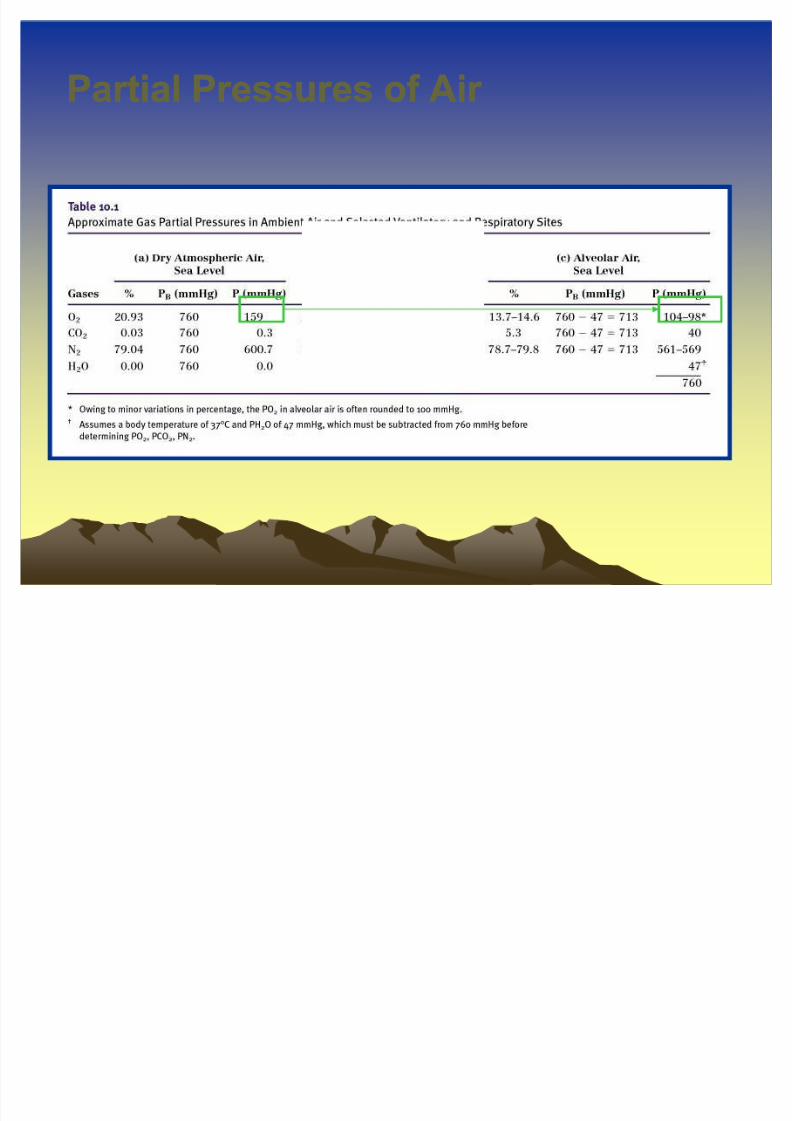
Partial Pressures of Air Partial Pressures of Air
8/8/2019 4900 Altitude
http://slidepdf.com/reader/full/4900-altitude 7/78
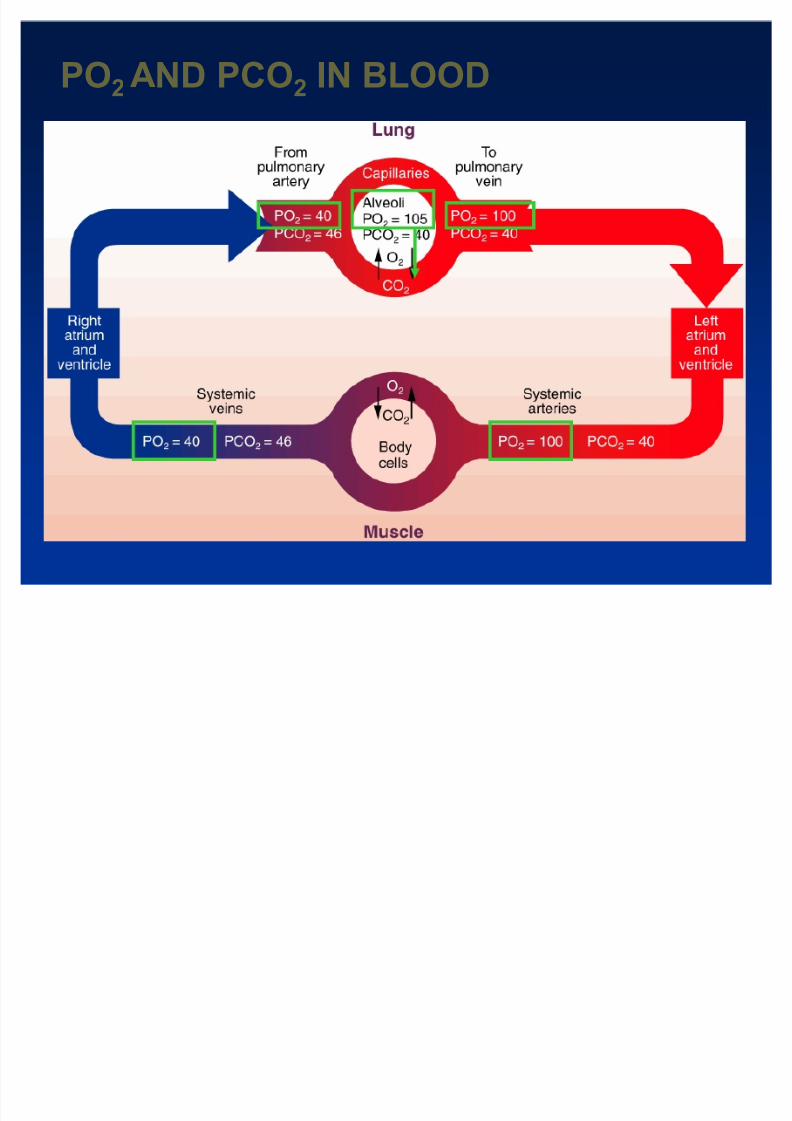
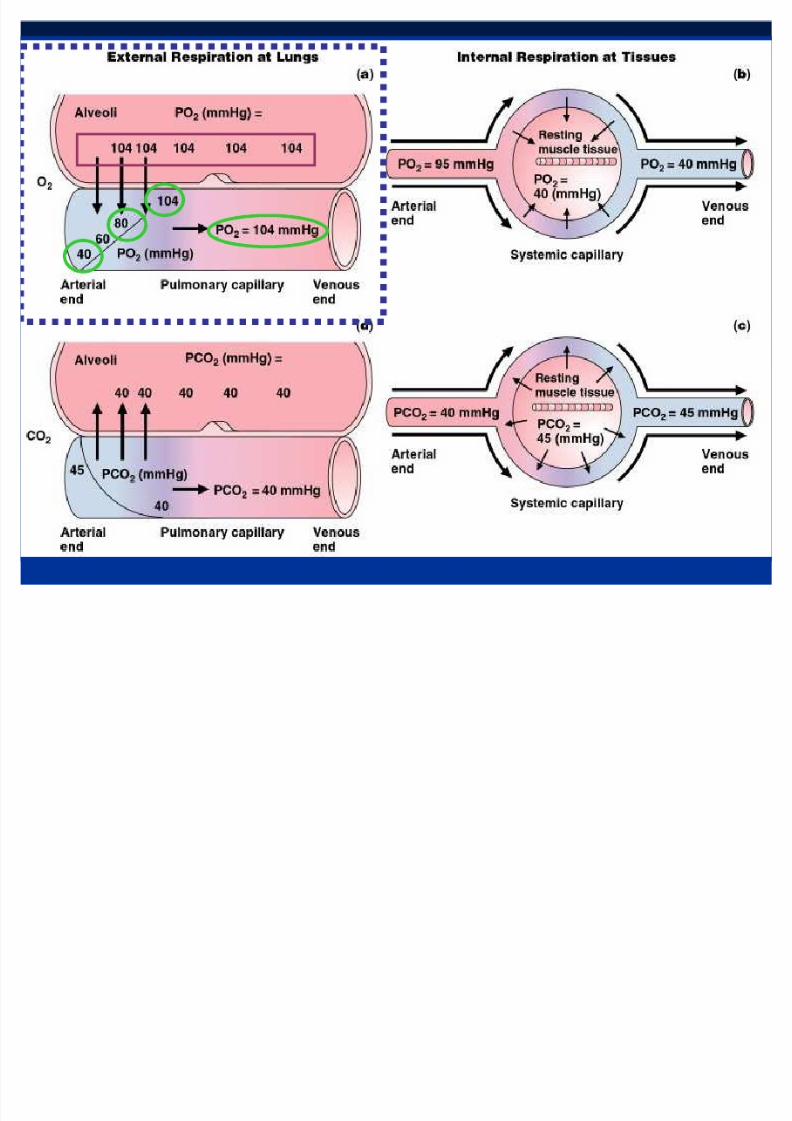
PO2 AND PCO2 IN BLOOD
8/8/2019 4900 Altitude
http://slidepdf.com/reader/full/4900-altitude 8/78
8/8/2019 4900 Altitude
http://slidepdf.com/reader/full/4900-altitude 9/78
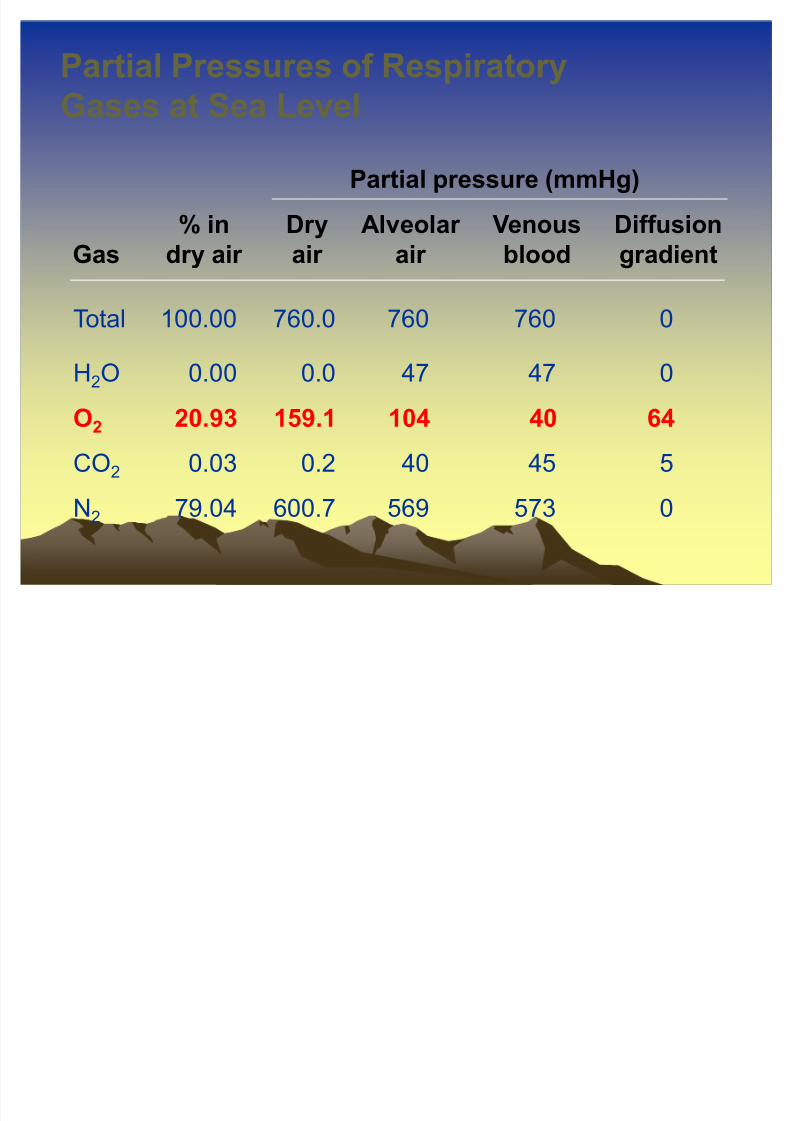
Partial Pressures of Respiratory
Gases at Sea Level
Total 100.00 760.0 760 760 0
H2O 0.00 0.0 47 47 0
O2 20.93 159.1 104 40 64
CO2 0.03 0.2 40 45 5
N2 79.04 600.7 569 573 0
Partial pressure (mmHg)
% in Dry Alveolar Venous Diffusion
Gas dry air air air blood gradient
8/8/2019 4900 Altitude
http://slidepdf.com/reader/full/4900-altitude 10/78
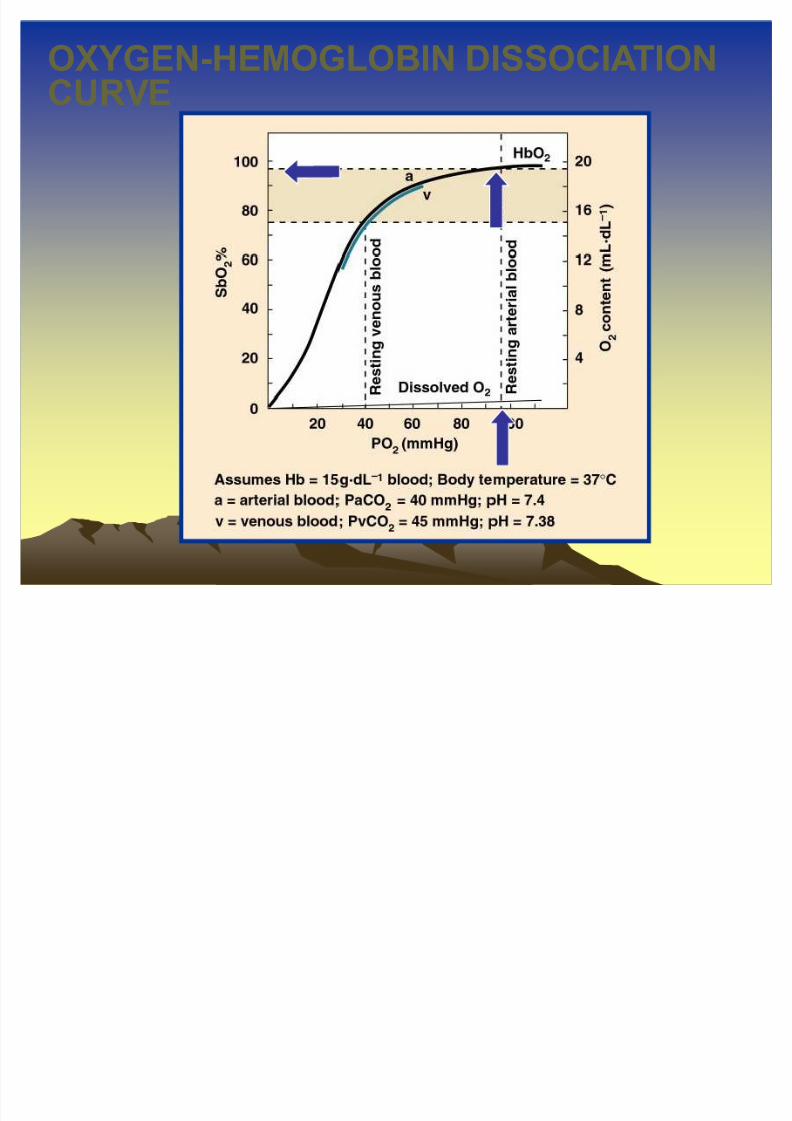
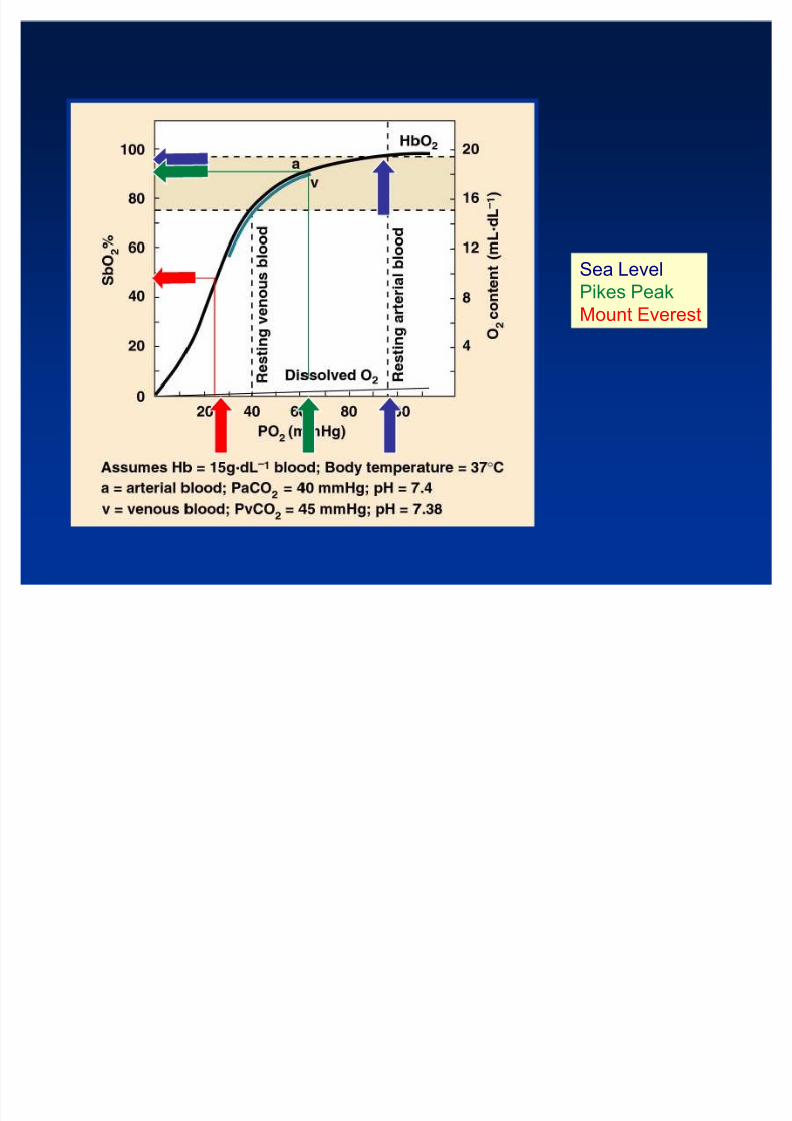
OXYGEN-HEMOGLOBIN DISSOCIATIONCURVE
8/8/2019 4900 Altitude
http://slidepdf.com/reader/full/4900-altitude 11/78
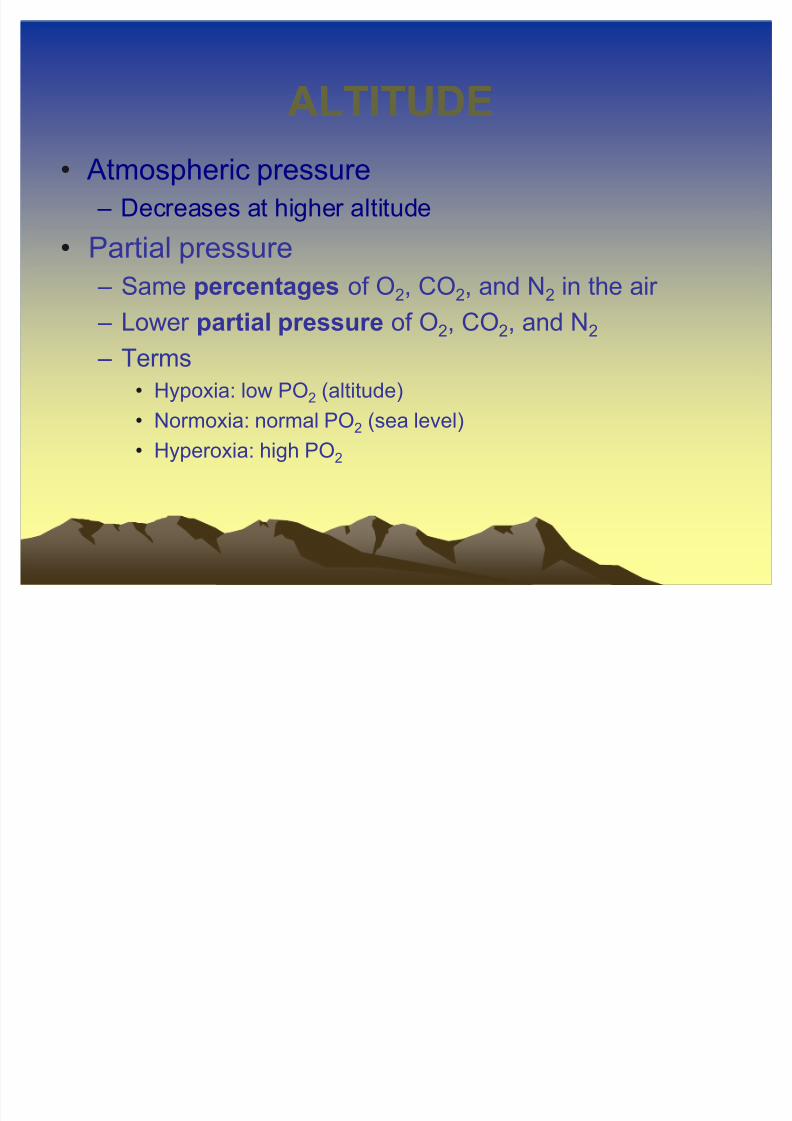
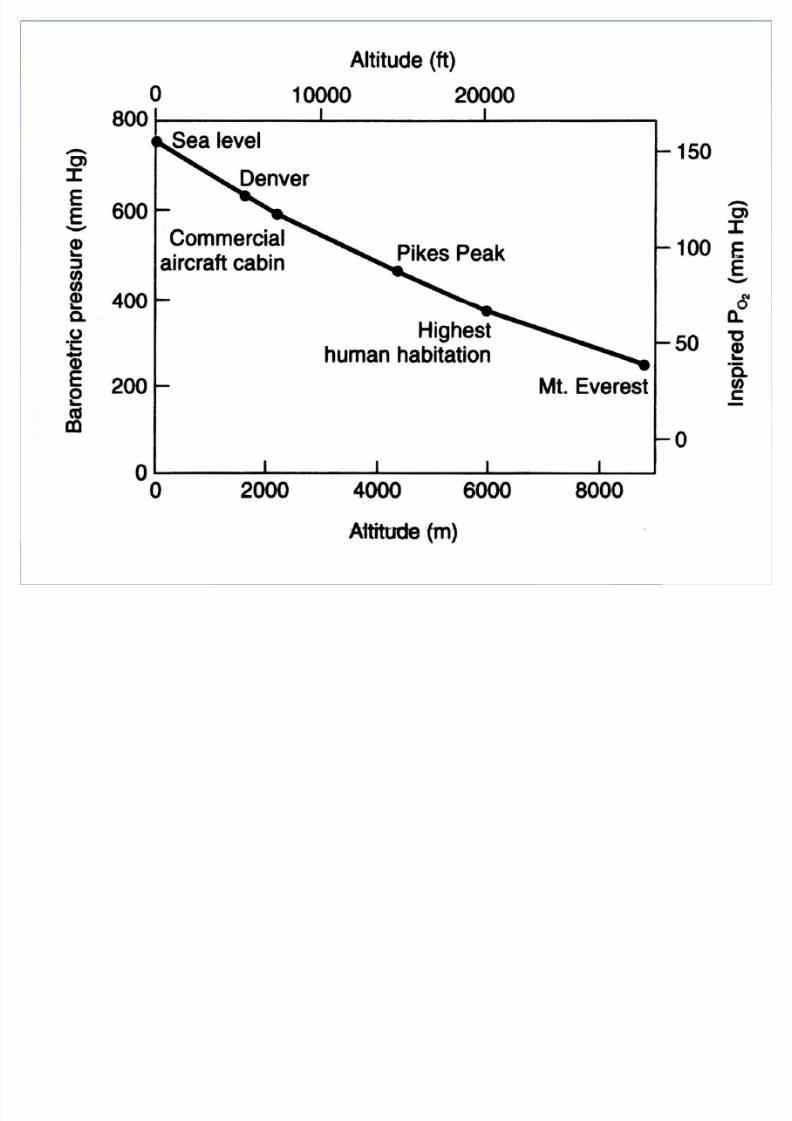
ALTITUDEALTITUDE
Atmospheric pressure
± Decreases at higher altitude
Partial pressure
± Same percentages of O2, CO2, and N2 in the air
± Lower partial pressure of O2, CO2, and N2
± Terms
Hypoxia: low PO2 (altitude)
Normoxia: normal PO2 (sea level)
Hyperoxia: high PO2
8/8/2019 4900 Altitude
http://slidepdf.com/reader/full/4900-altitude 12/78
Conditions at AltitudeConditions at Altitude
Reduced PO2
Reduced air temperature
Low humidity
Increased solar radiation
8/8/2019 4900 Altitude
http://slidepdf.com/reader/full/4900-altitude 13/78
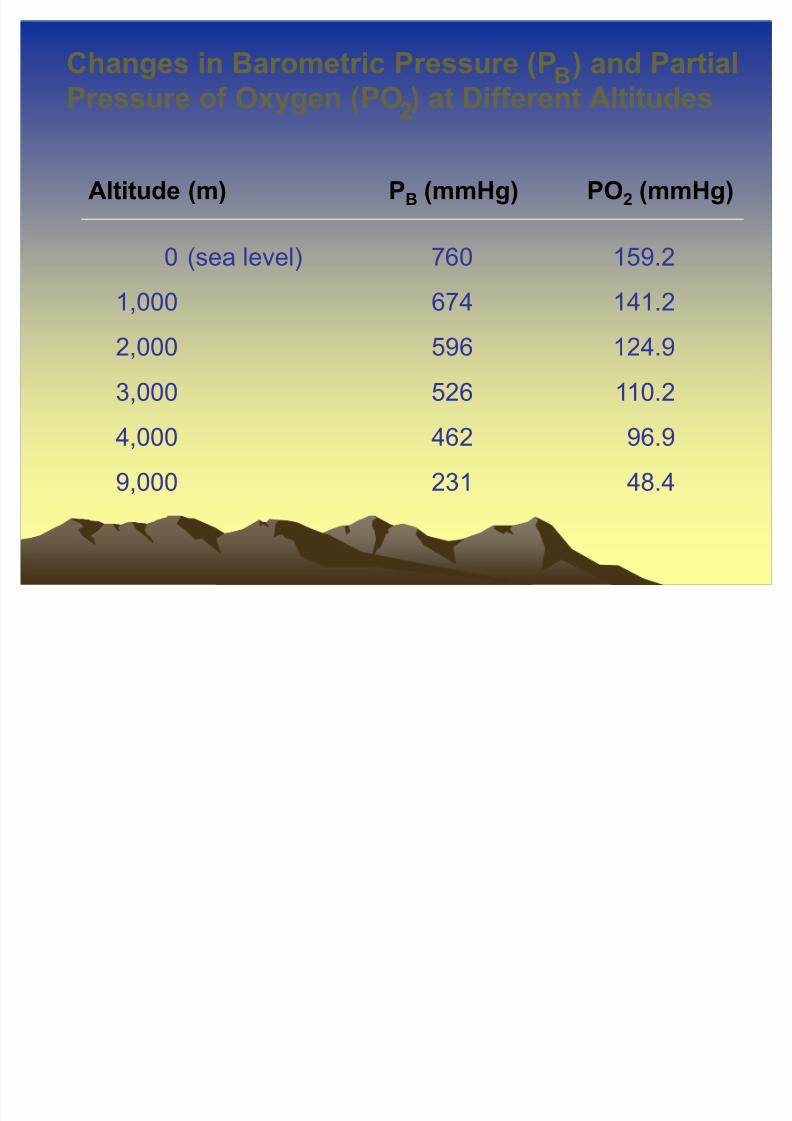
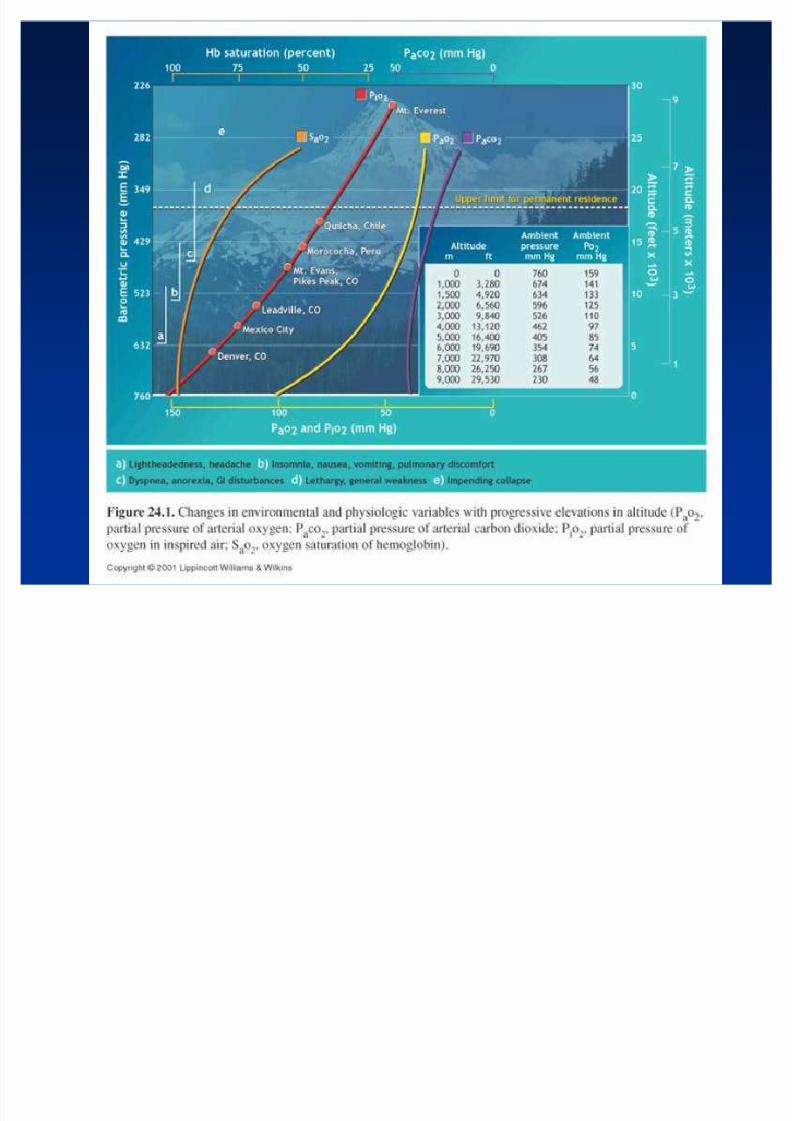
Changes in Barometric Pressure (P ) and Partial
Pressure of Oxygen (PO ) at Different Altitudes2
B
0 (sea level) 760 159.2
1,000 674 141.2
2,000 596 124.9
3,000 526 110.2
4,000 462 96.9
9,000 231 48.4
Altitude (m) PB (mmHg) PO2 (mmHg)
8/8/2019 4900 Altitude
http://slidepdf.com/reader/full/4900-altitude 14/78
8/8/2019 4900 Altitude
http://slidepdf.com/reader/full/4900-altitude 15/78
8/8/2019 4900 Altitude
http://slidepdf.com/reader/full/4900-altitude 16/78
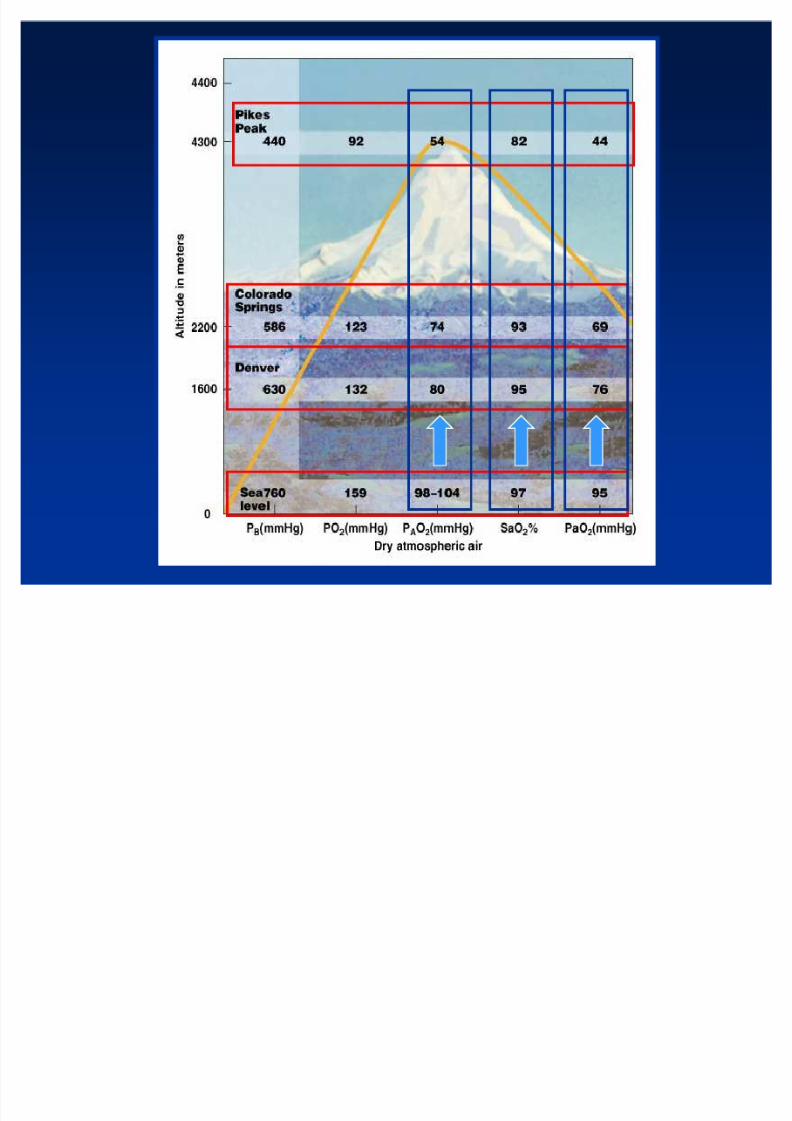
Sea LevelPikes Peak
Mount Everest
8/8/2019 4900 Altitude
http://slidepdf.com/reader/full/4900-altitude 17/78
8/8/2019 4900 Altitude
http://slidepdf.com/reader/full/4900-altitude 18/78
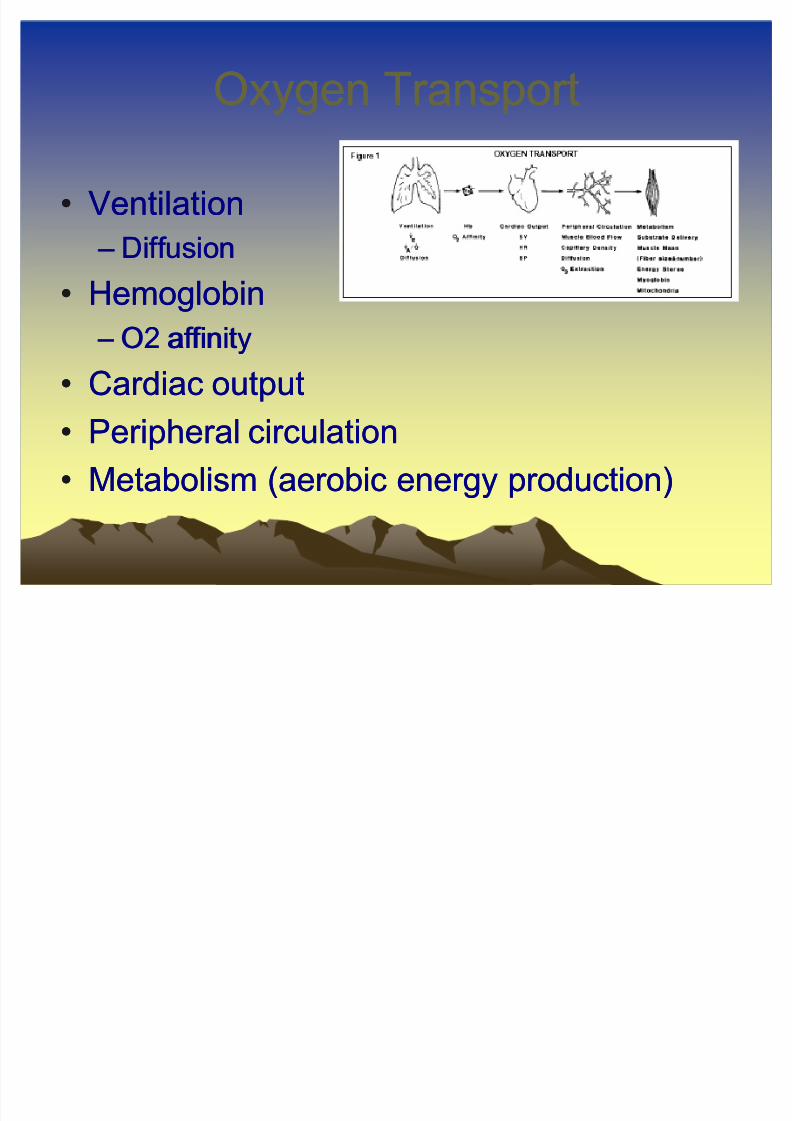
Oxygen TransportOxygen Transport
VentilationVentilation
± ± DiffusionDiffusion
HemoglobinHemoglobin
± ± O2 affinityO2 affinity
Cardiac outputCardiac output
Peripheral circulationPeripheral circulation
Metabolism (aerobic energy production)Metabolism (aerobic energy production)
8/8/2019 4900 Altitude
http://slidepdf.com/reader/full/4900-altitude 19/78
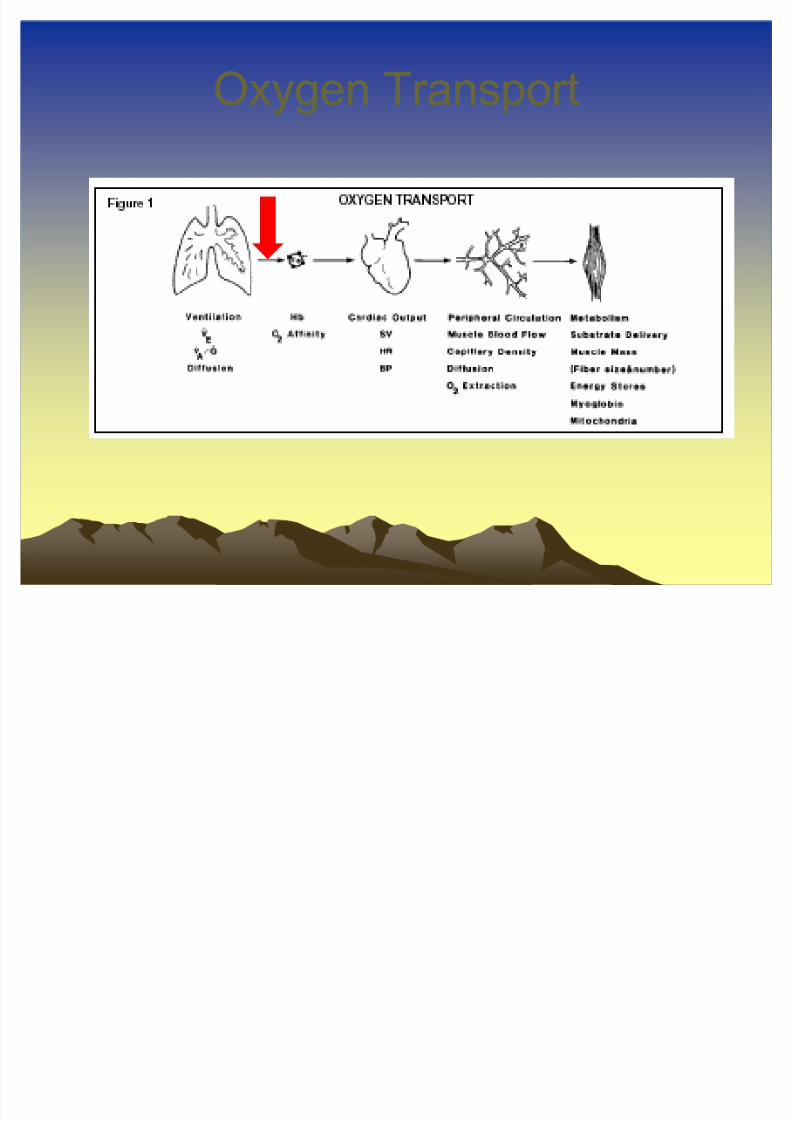
Oxygen TransportOxygen Transport
8/8/2019 4900 Altitude
http://slidepdf.com/reader/full/4900-altitude 20/78
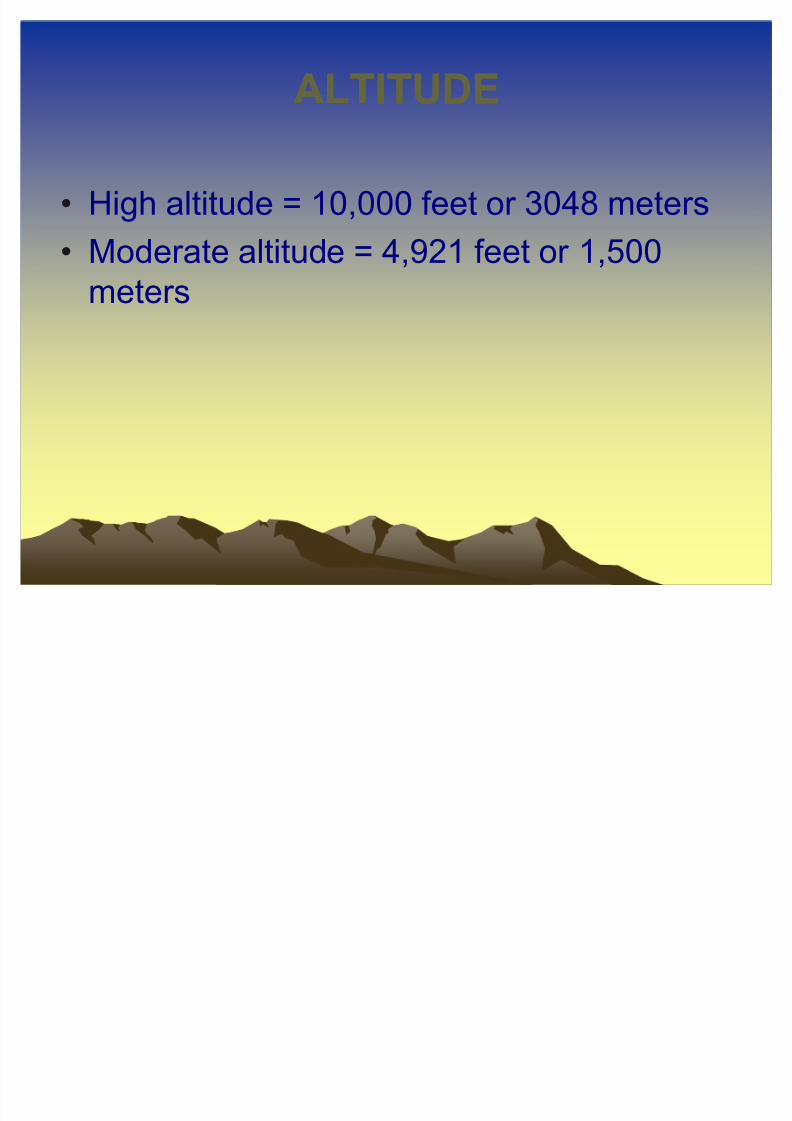
ALTITUDEALTITUDE
High altitude = 10,000 feet or 3048 meters
Moderate altitude = 4,921 feet or 1,500
meters
8/8/2019 4900 Altitude
http://slidepdf.com/reader/full/4900-altitude 21/78
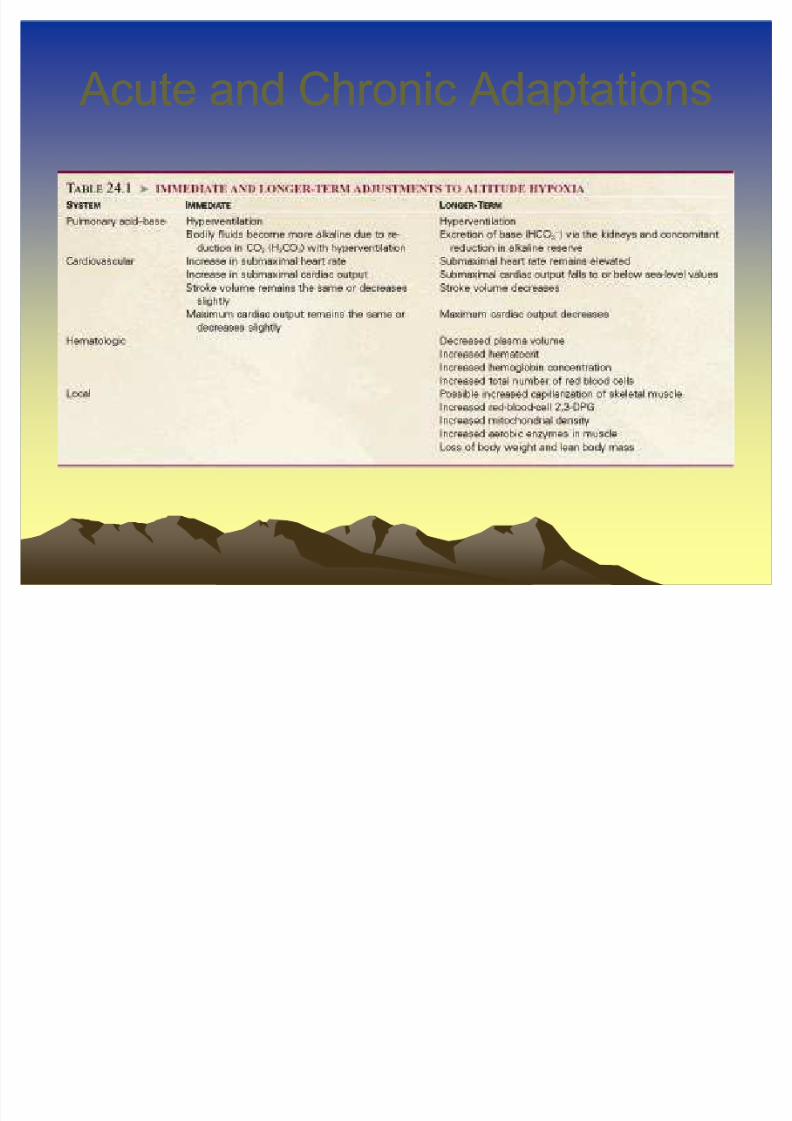
Acute and Chronic Adaptations Acute and Chronic Adaptations
8/8/2019 4900 Altitude
http://slidepdf.com/reader/full/4900-altitude 22/78
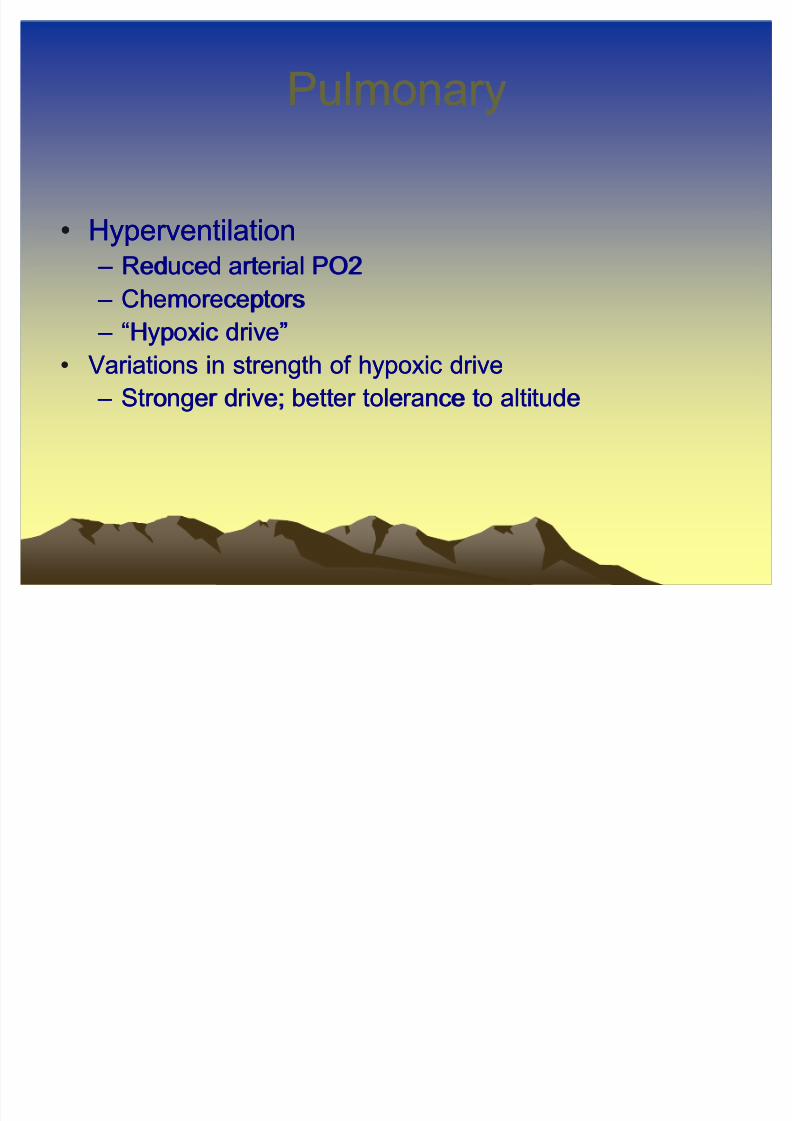
PulmonaryPulmonary
HyperventilationHyperventilation
± ± Reduced arterial PO2Reduced arterial PO2 ± ± ChemoreceptorsChemoreceptors
± ± ³Hypoxic drive´³Hypoxic drive´
Variations in strength of hypoxic driveVariations in strength of hypoxic drive
± ± Stronger drive; better tolerance to altitudeStronger drive; better tolerance to altitude
8/8/2019 4900 Altitude
http://slidepdf.com/reader/full/4900-altitude 23/78
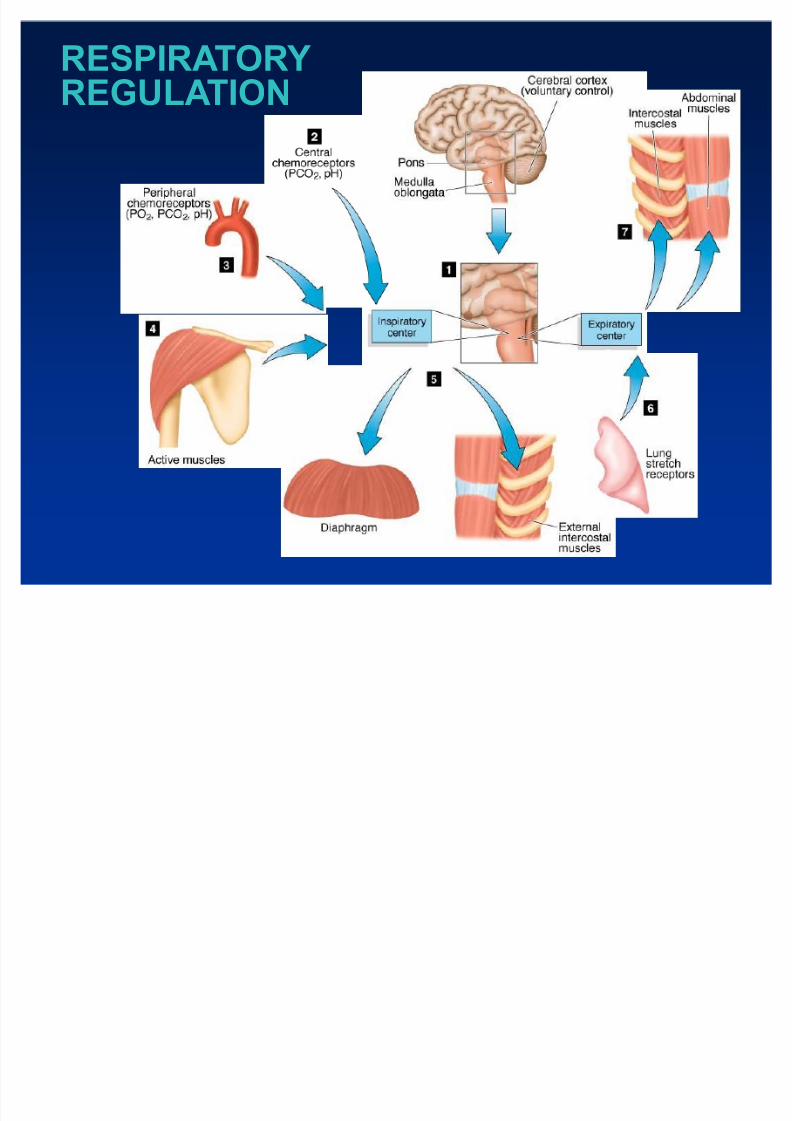
RESPIRATOR Y REGULATION
8/8/2019 4900 Altitude
http://slidepdf.com/reader/full/4900-altitude 24/78
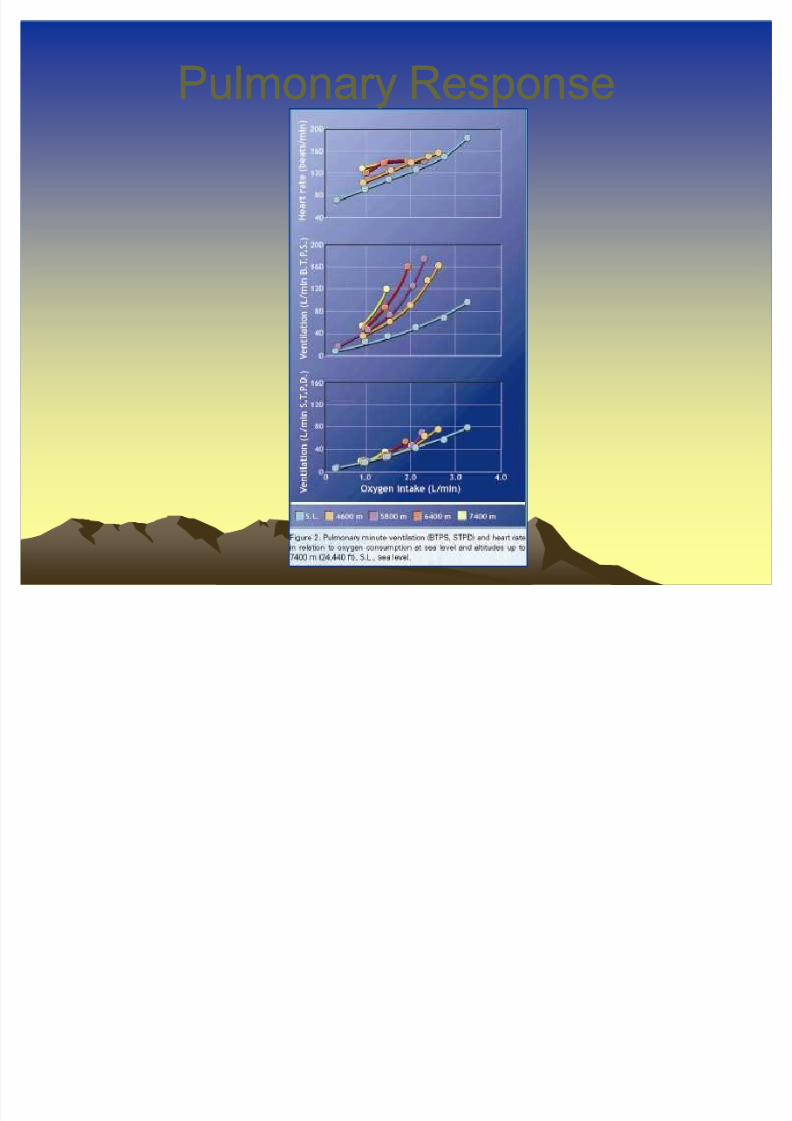
Pulmonary ResponsePulmonary Response
8/8/2019 4900 Altitude
http://slidepdf.com/reader/full/4900-altitude 25/78
PulmonaryPulmonary
Hyperventilation leads to reduced CO2 in thealveoli
More CO2 diffuses out of the blood This increases the pH of the blood
CO2 + H20 H2CO3 HCO3 + H (acid)
³Respiratory alkalosis´.
Kidneys excrete more HCO3 The decreases the buffering of HCO3 and
increases the acid level (lowers the pH)
8/8/2019 4900 Altitude
http://slidepdf.com/reader/full/4900-altitude 26/78
PulmonaryPulmonary
Lower PO2 inside the alveoli
Less O2 saturation in the blood
Also, lower PO2 in the blood
Less pressure gradient at the muscles
8/8/2019 4900 Altitude
http://slidepdf.com/reader/full/4900-altitude 27/78
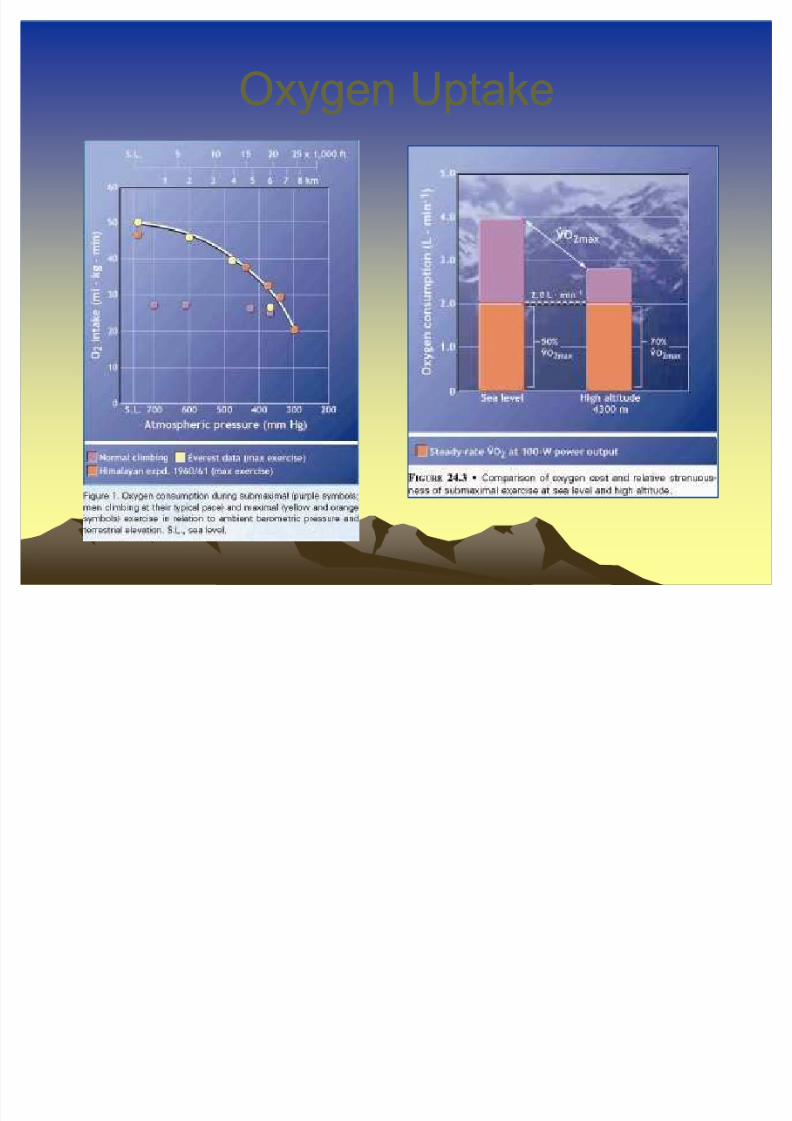
Oxygen UptakeOxygen Uptake
8/8/2019 4900 Altitude
http://slidepdf.com/reader/full/4900-altitude 28/78
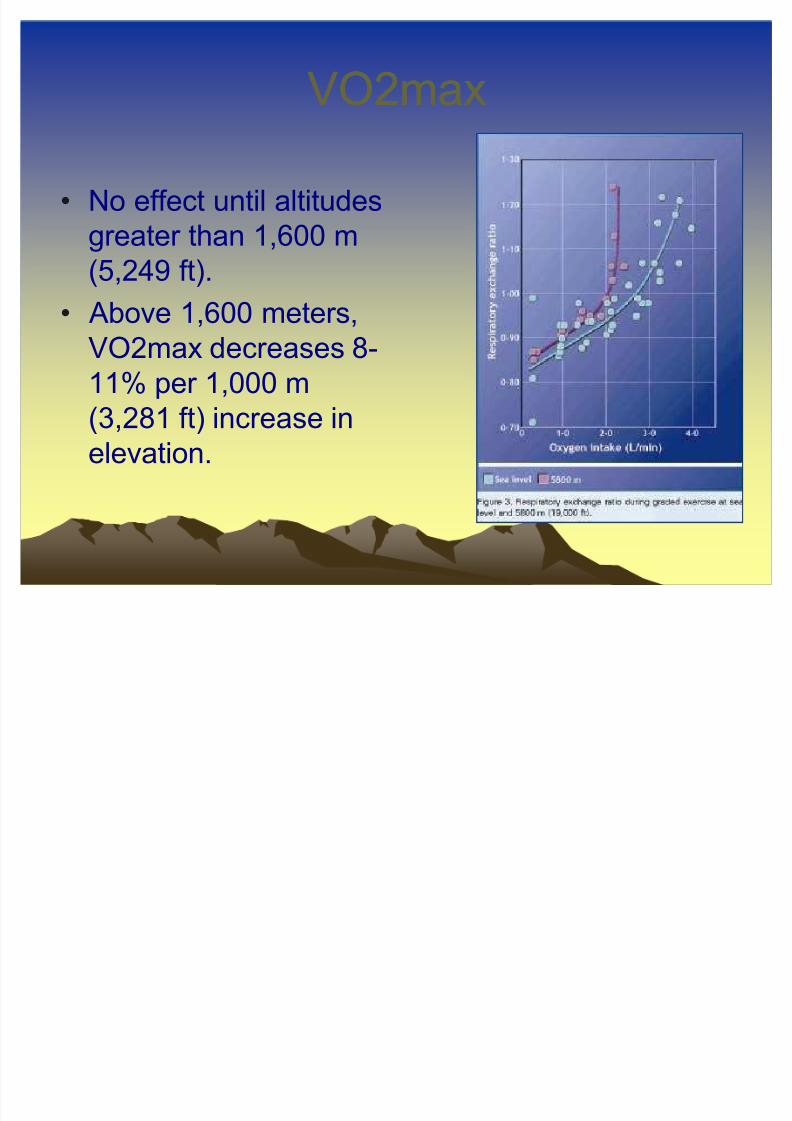
VO2maxVO2max
No effect until altitudes
greater than 1,600 m
(5,249 ft). Above 1,600 meters,
VO2max decreases 8-
11% per 1,000 m
(3,281 ft) increase inelevation.
8/8/2019 4900 Altitude
http://slidepdf.com/reader/full/4900-altitude 29/78
8/8/2019 4900 Altitude
http://slidepdf.com/reader/full/4900-altitude 30/78
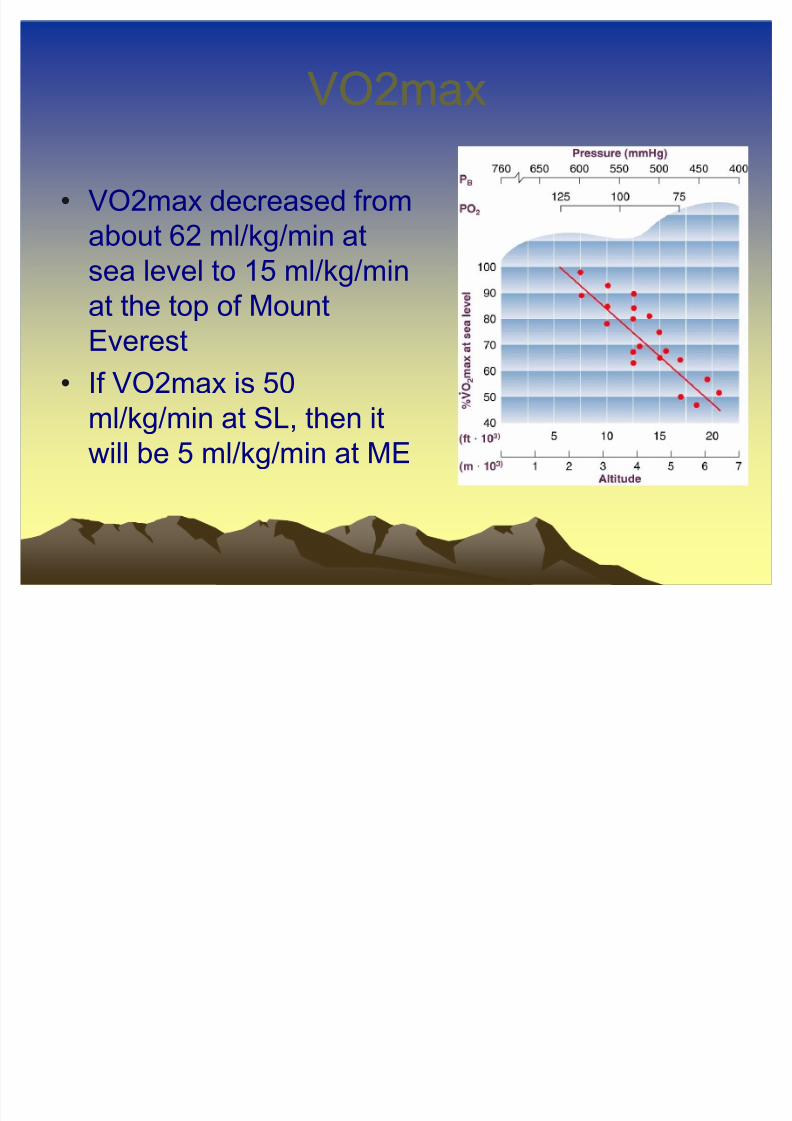
VO2maxVO2max
VO2max decreased from
about 62 ml/kg/min at
sea level to 15 ml/kg/minat the top of Mount
Everest
If VO2max is 50
ml/kg/min at SL, then itwill be 5 ml/kg/min at ME
8/8/2019 4900 Altitude
http://slidepdf.com/reader/full/4900-altitude 31/78
8/8/2019 4900 Altitude
http://slidepdf.com/reader/full/4900-altitude 32/78
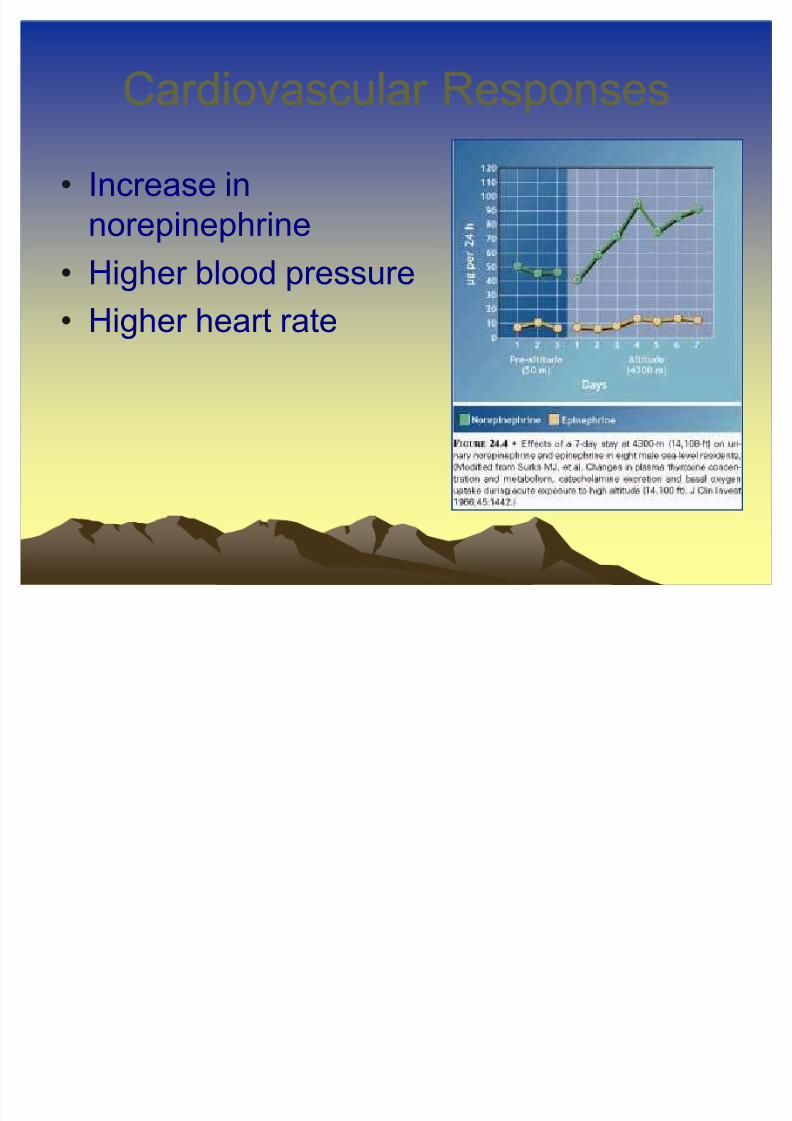
Cardiovascular ResponsesCardiovascular Responses
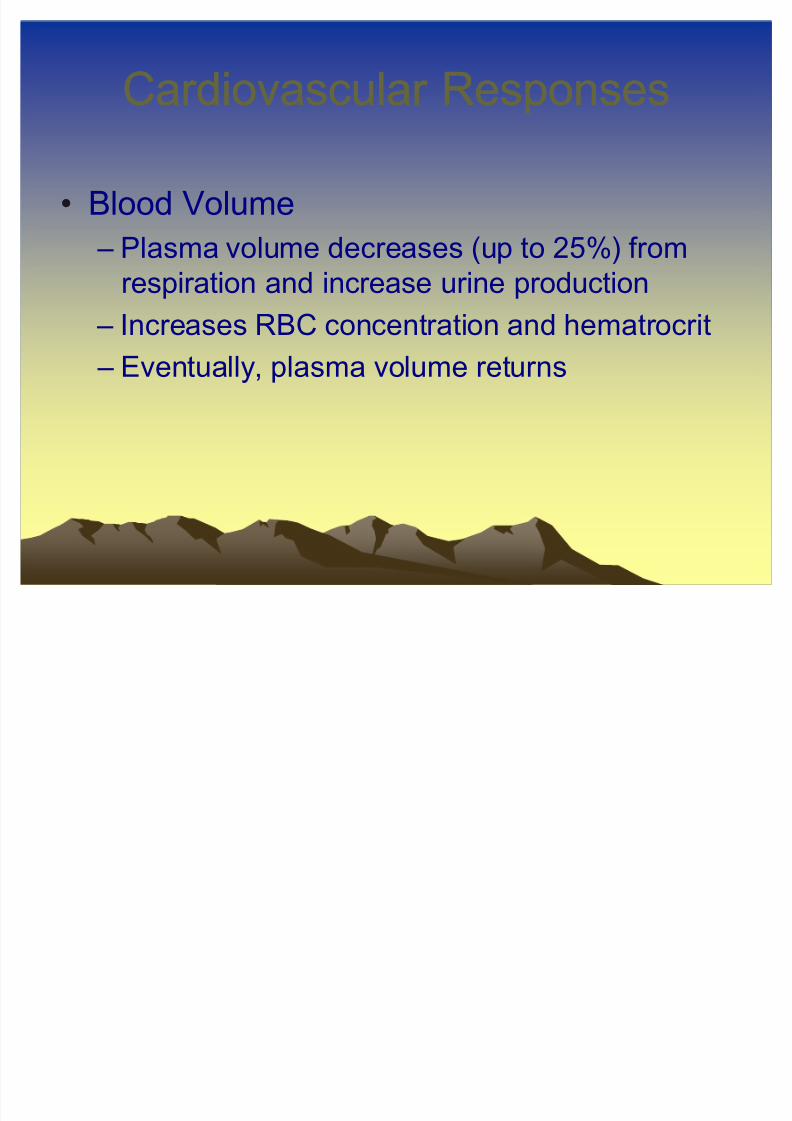
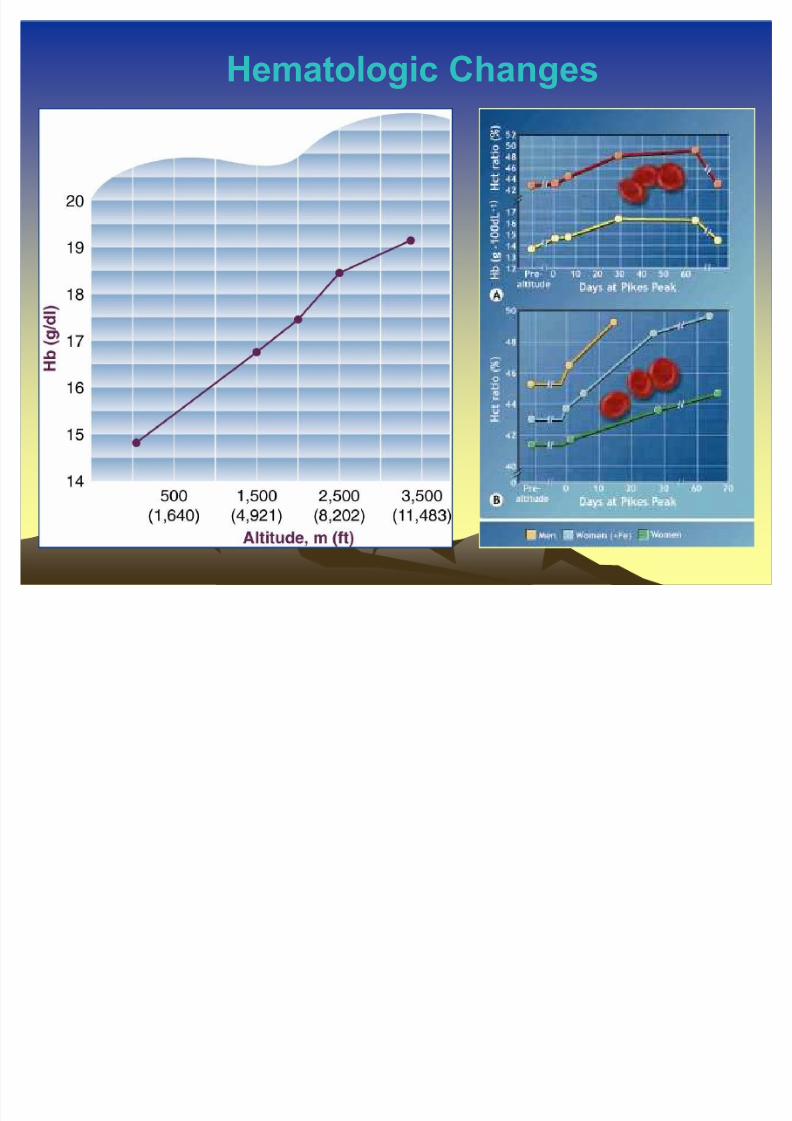
Blood Volume
± Plasma volume decreases (up to 25%) from
respiration and increase urine production ± Increases RBC concentration and hematrocrit
± Eventually, plasma volume returns
8/8/2019 4900 Altitude
http://slidepdf.com/reader/full/4900-altitude 33/78
8/8/2019 4900 Altitude
http://slidepdf.com/reader/full/4900-altitude 34/78
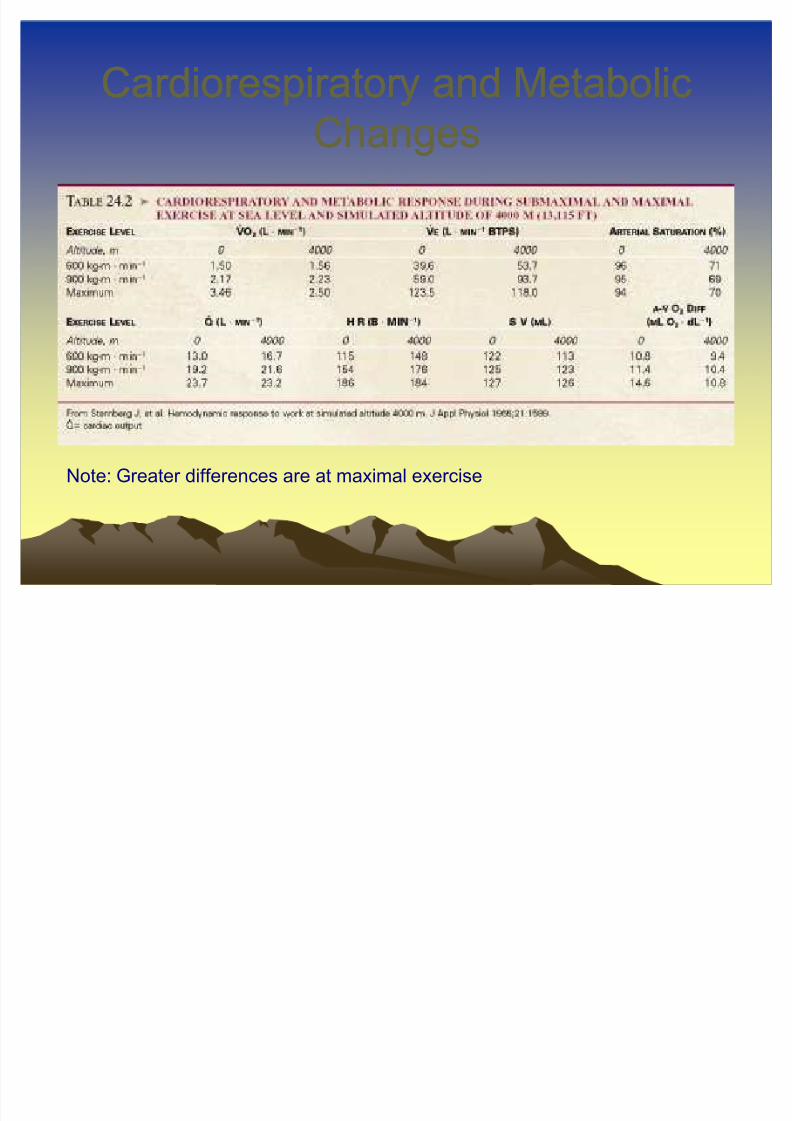
Cardiorespiratory and MetabolicCardiorespiratory and Metabolic
ChangesChanges
Note: Greater differences are at maximal exercise
8/8/2019 4900 Altitude
http://slidepdf.com/reader/full/4900-altitude 35/78
Metabolic DifferencesMetabolic Differences
Increase in anaerobic energy
8/8/2019 4900 Altitude
http://slidepdf.com/reader/full/4900-altitude 36/78
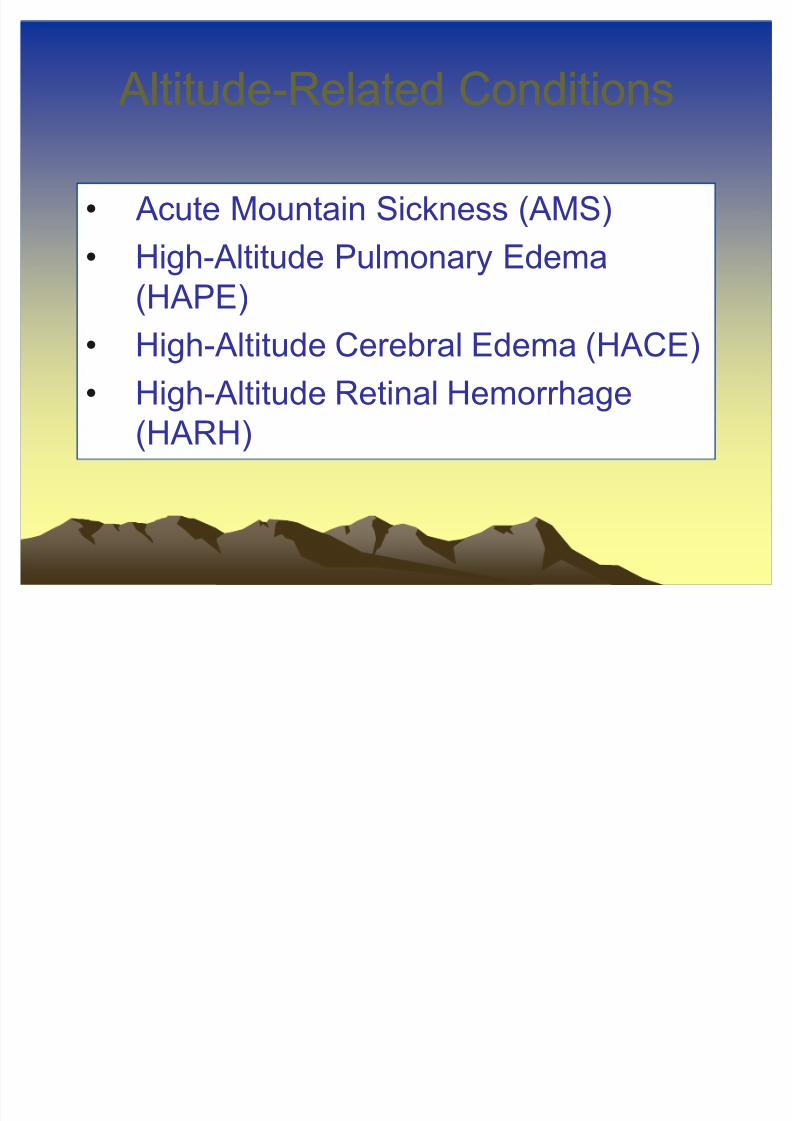
Altitude Altitude--Related ConditionsRelated Conditions
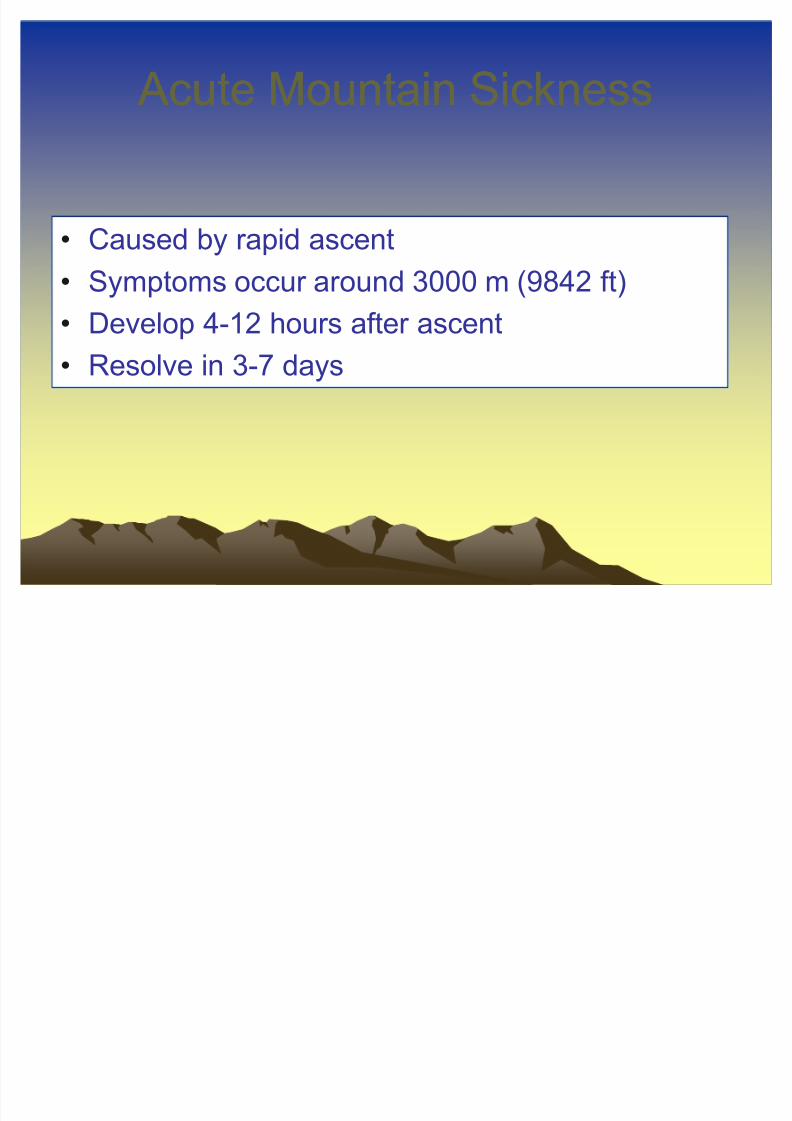
Acute Mountain Sickness (AMS)
High-Altitude Pulmonary Edema
(HAPE)
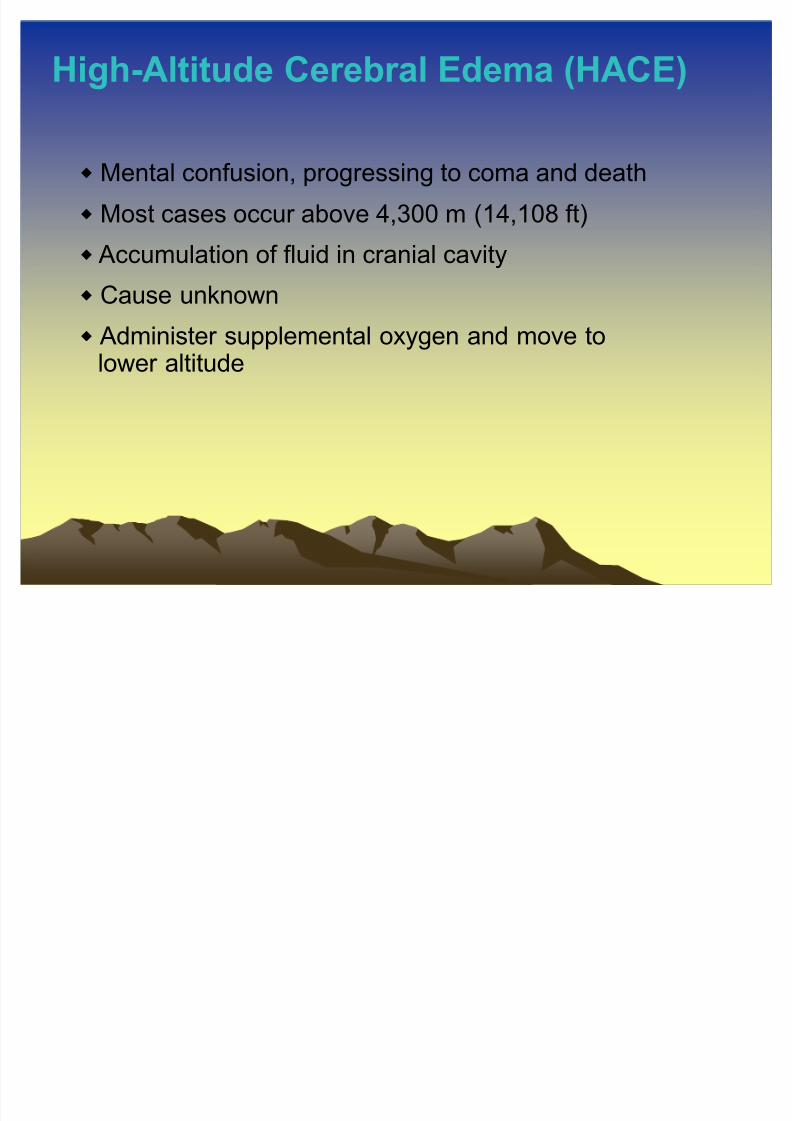
High-Altitude Cerebral Edema (HACE)
High-Altitude Retinal Hemorrhage
(HARH)
8/8/2019 4900 Altitude
http://slidepdf.com/reader/full/4900-altitude 37/78
8/8/2019 4900 Altitude
http://slidepdf.com/reader/full/4900-altitude 38/78
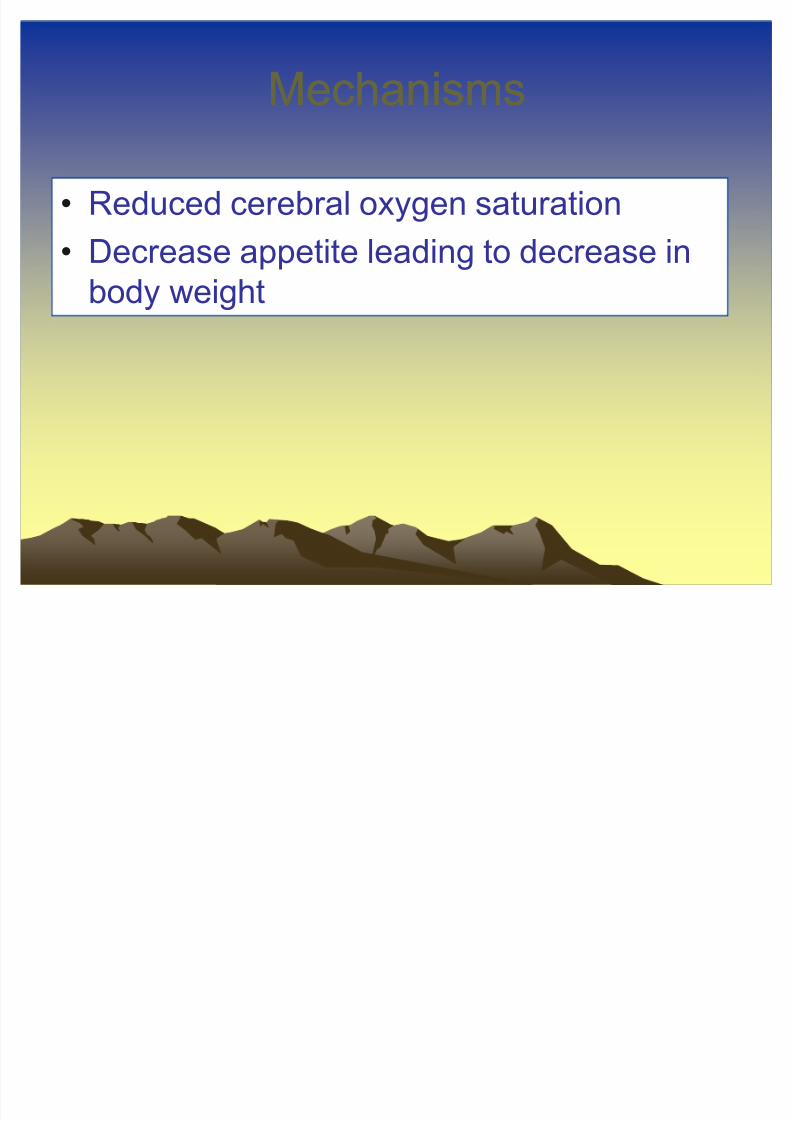
MechanismsMechanisms
Reduced cerebral oxygen saturation
Decrease appetite leading to decrease in
body weight
8/8/2019 4900 Altitude
http://slidepdf.com/reader/full/4900-altitude 39/78
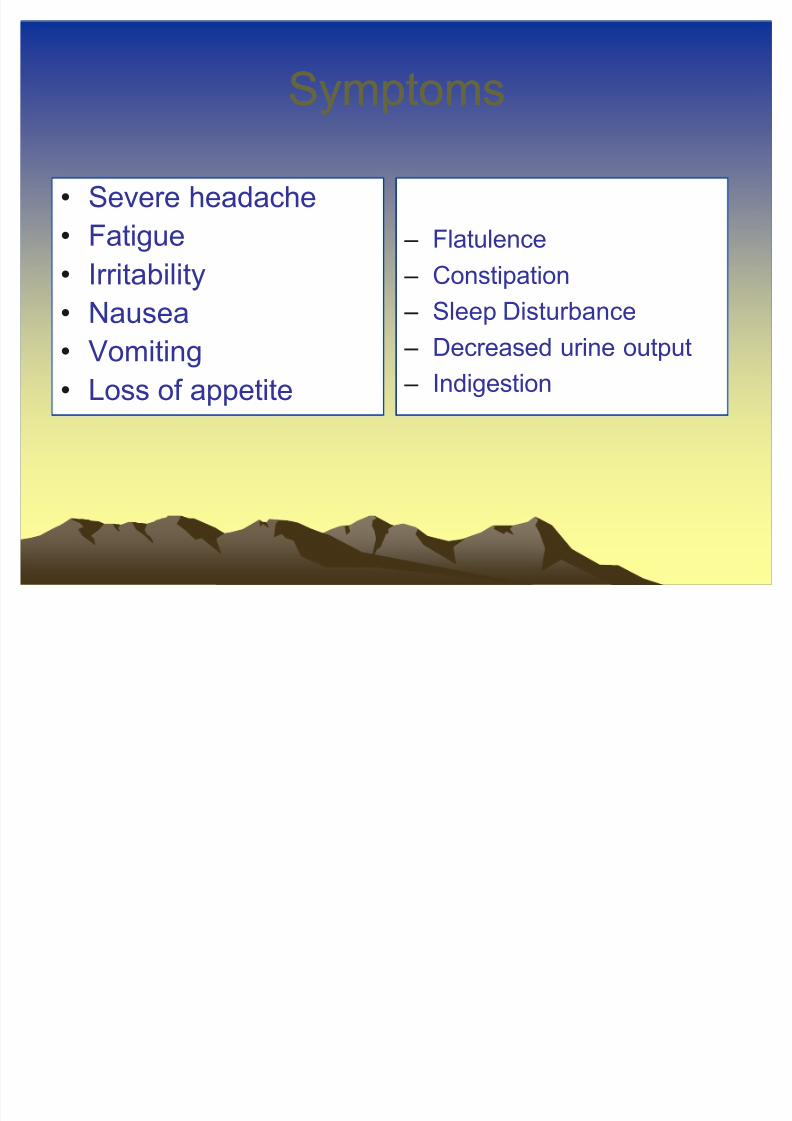
SymptomsSymptoms
Severe headache
Fatigue
Irritability Nausea
Vomiting
Loss of appetite
± Flatulence
± Constipation ± Sleep Disturbance
± Decreased urine output
± Indigestion
8/8/2019 4900 Altitude
http://slidepdf.com/reader/full/4900-altitude 40/78
8/8/2019 4900 Altitude
http://slidepdf.com/reader/full/4900-altitude 41/78
PreventionPrevention
Gradual ascent
Diet rich in carbohydrates
Exercise
Diamox- counteracts fluid retention
8/8/2019 4900 Altitude
http://slidepdf.com/reader/full/4900-altitude 42/78
HighHigh--Altitude Pulmonary Edema Altitude Pulmonary Edema
Caused by rapid ascent
Symptoms occur within 12-96 hours
Fluid accumulation in the brain and lungs AMS symptoms present along with ³rales´ or
wheezing
8/8/2019 4900 Altitude
http://slidepdf.com/reader/full/4900-altitude 43/78
8/8/2019 4900 Altitude
http://slidepdf.com/reader/full/4900-altitude 44/78
TreatmentTreatment
Descent
Supplemental O2
Medications
8/8/2019 4900 Altitude
http://slidepdf.com/reader/full/4900-altitude 45/78
PreventionPrevention
Ascending slowly
Climbing & sleeping at low altitudes
Limiting physical ability Avoiding cold exposure
Making visits brief as possible
8/8/2019 4900 Altitude
http://slidepdf.com/reader/full/4900-altitude 46/78
HighHigh--Altitude Cerebral Edema Altitude Cerebral Edema
Caused by rapid ascent
Extreme form of AMS
Can be fatal; fluid accumulation in the brain ± Vasodilation of cerebral vessels
± Tissue hypoxia
Differentiate by symptoms
± Lack of consciousness & coordination
Prevention same as AMS
8/8/2019 4900 Altitude
http://slidepdf.com/reader/full/4900-altitude 47/78
8/8/2019 4900 Altitude
http://slidepdf.com/reader/full/4900-altitude 48/78
8/8/2019 4900 Altitude
http://slidepdf.com/reader/full/4900-altitude 49/78
HighHigh--Altitude Retinal Hemorrhage Altitude Retinal Hemorrhage
All climbers experience if above 6700 m.
Blood pressure surges during exercise
cause ruptures in retinal capillaries.
8/8/2019 4900 Altitude
http://slidepdf.com/reader/full/4900-altitude 50/78
8/8/2019 4900 Altitude
http://slidepdf.com/reader/full/4900-altitude 51/78
Acclimatization to Altitude
Decrease plasma volume
Increase hematocrit and RBCs
Possible increase in capillarization
Increase in 2, 3-DPG
Increase mitochondrial density
Increase in aerobic enzymes
Loss of body weight and lean body mass
8/8/2019 4900 Altitude
http://slidepdf.com/reader/full/4900-altitude 52/78
Hematologic Changes
8/8/2019 4900 Altitude
http://slidepdf.com/reader/full/4900-altitude 53/78
8/8/2019 4900 Altitude
http://slidepdf.com/reader/full/4900-altitude 54/78
Cellular ChangesCellular Changes
Increase capillarization
Increase myoglobin
Increase mitochondria Increase 2, 3-diphosphoglycerate (2, 3-
DPG)
8/8/2019 4900 Altitude
http://slidepdf.com/reader/full/4900-altitude 55/78
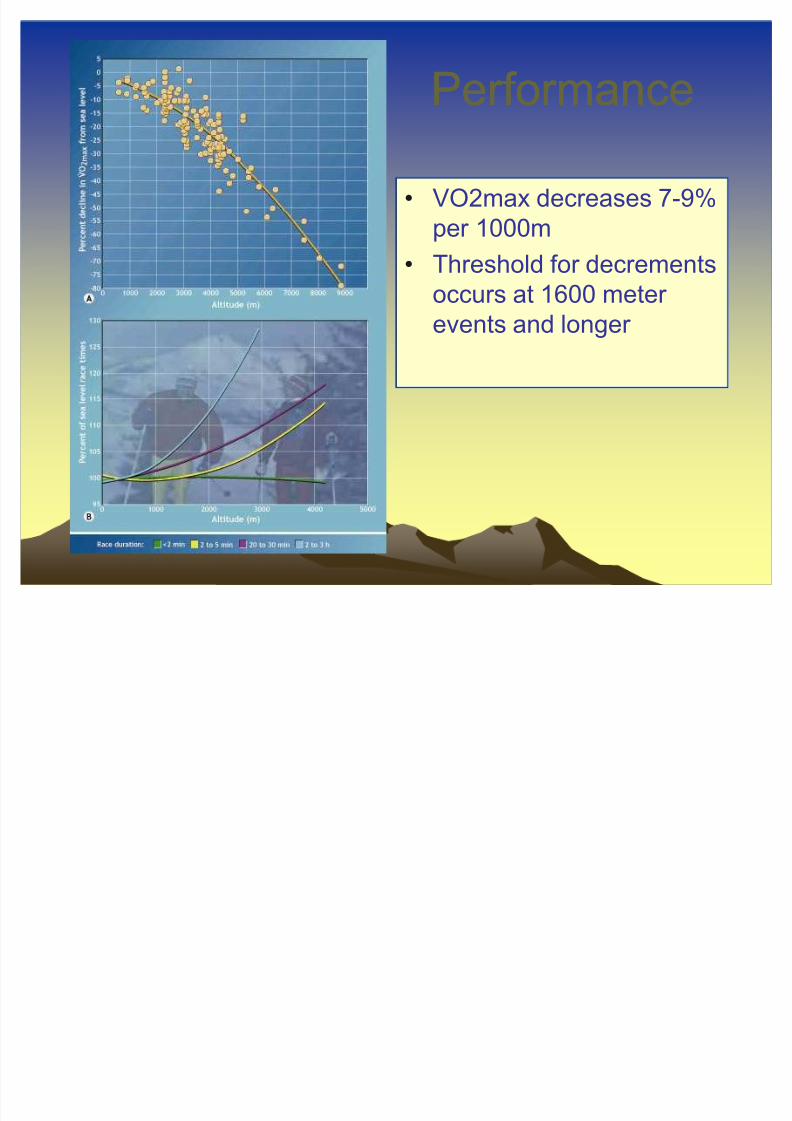
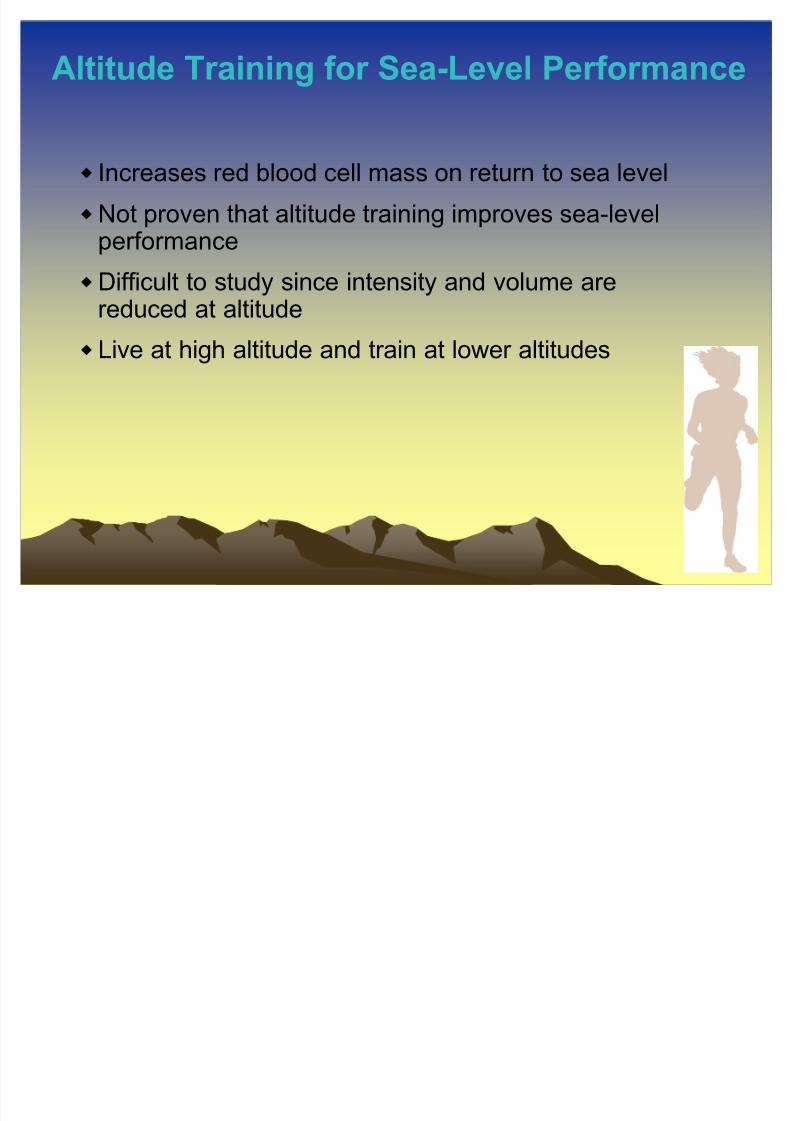
PerformancePerformance
VO2max decreases 7-9%
per 1000m
Threshold for decrements
occurs at 1600 meter events and longer
8/8/2019 4900 Altitude
http://slidepdf.com/reader/full/4900-altitude 56/78
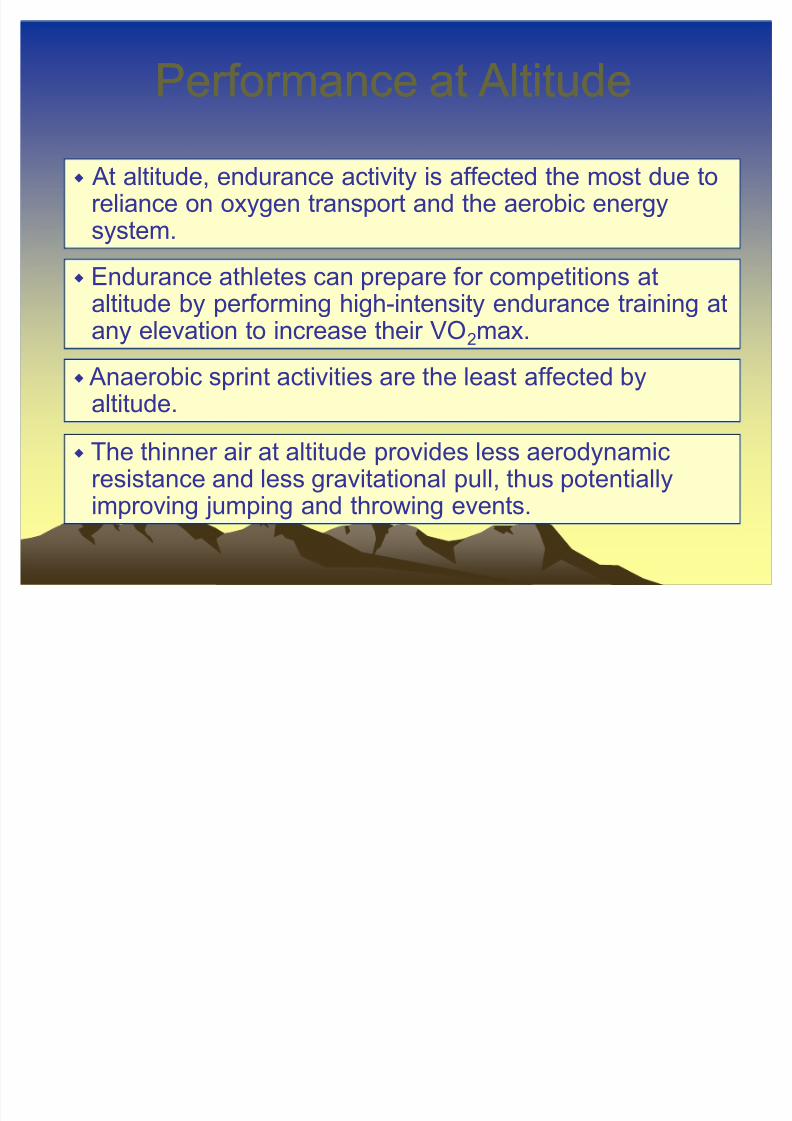
At altitude, endurance activity is affected the most due toreliance on oxygen transport and the aerobic energysystem.
Performance at AltitudePerformance at Altitude
Anaerobic sprint activities are the least affected byaltitude.
The thinner air at altitude provides less aerodynamicresistance and less gravitational pull, thus potentiallyimproving jumping and throwing events.
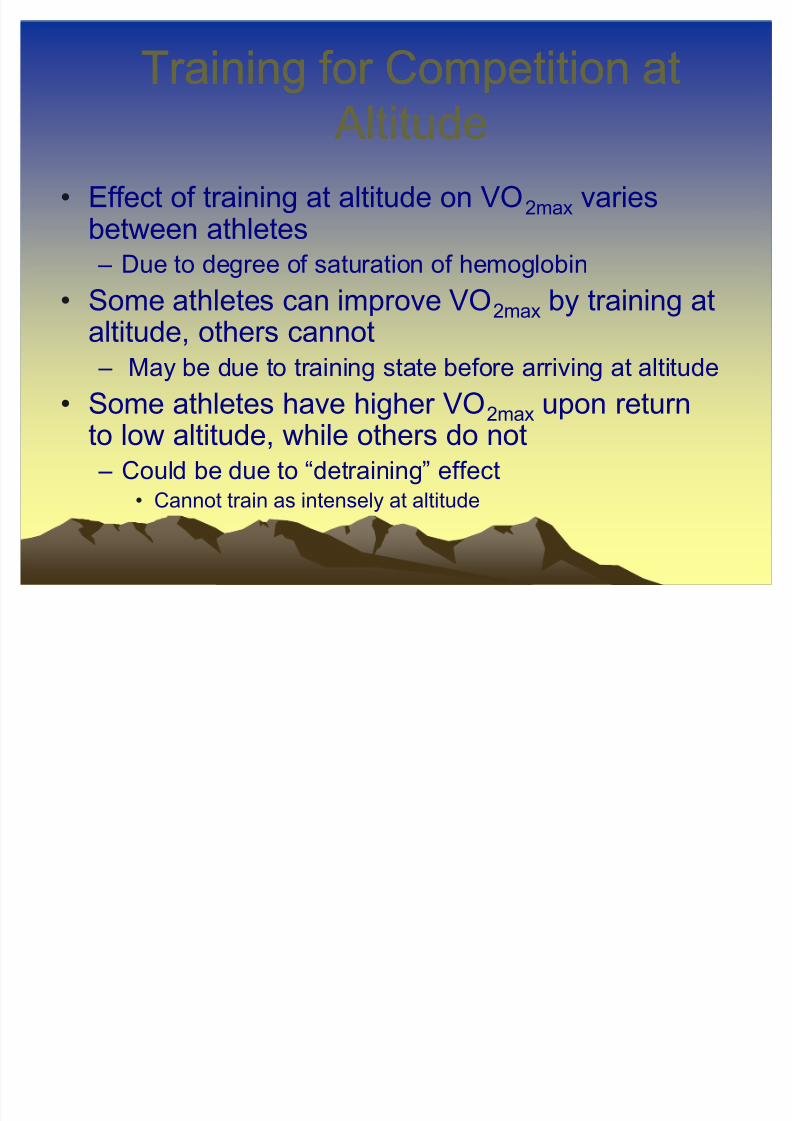
Endurance athletes can prepare for competitions ataltitude by performing high-intensity endurance training atany elevation to increase their VO2max.
8/8/2019 4900 Altitude
http://slidepdf.com/reader/full/4900-altitude 57/78
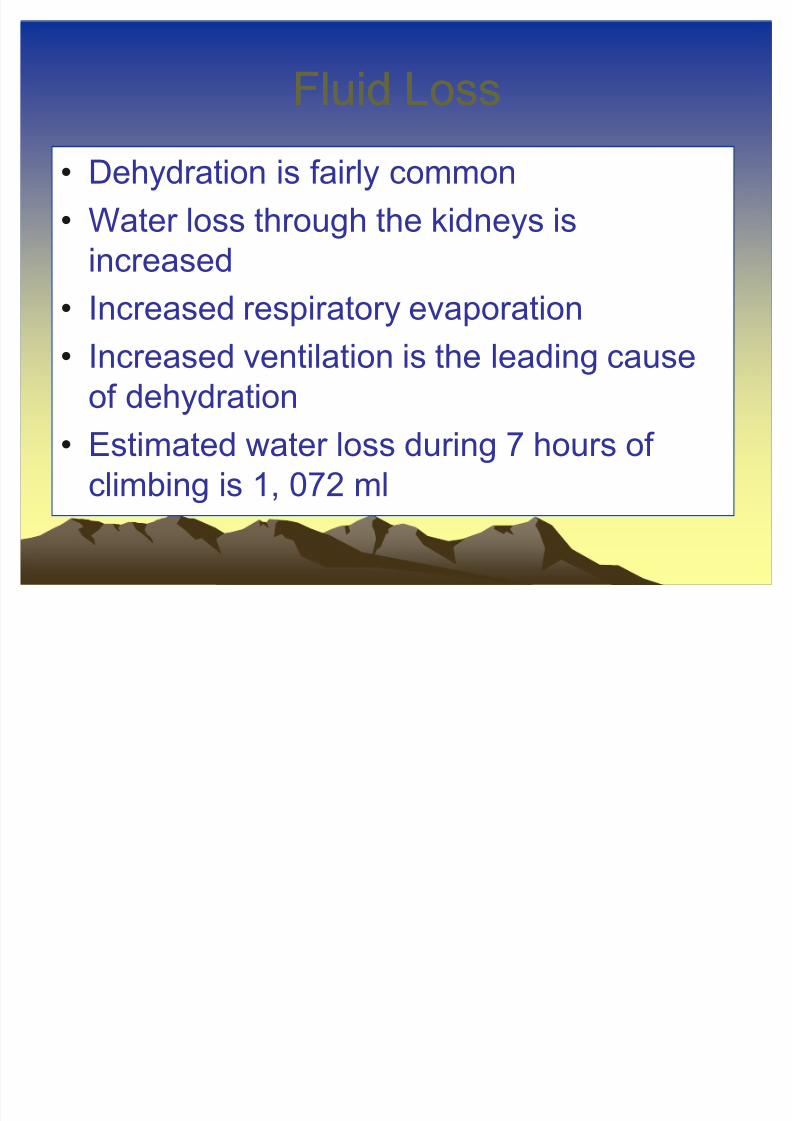
Fluid LossFluid Loss
Dehydration is fairly common
Water loss through the kidneys is
increased
Increased respiratory evaporation
Increased ventilation is the leading cause
of dehydration
Estimated water loss during 7 hours of
climbing is 1, 072 ml
8/8/2019 4900 Altitude
http://slidepdf.com/reader/full/4900-altitude 58/78
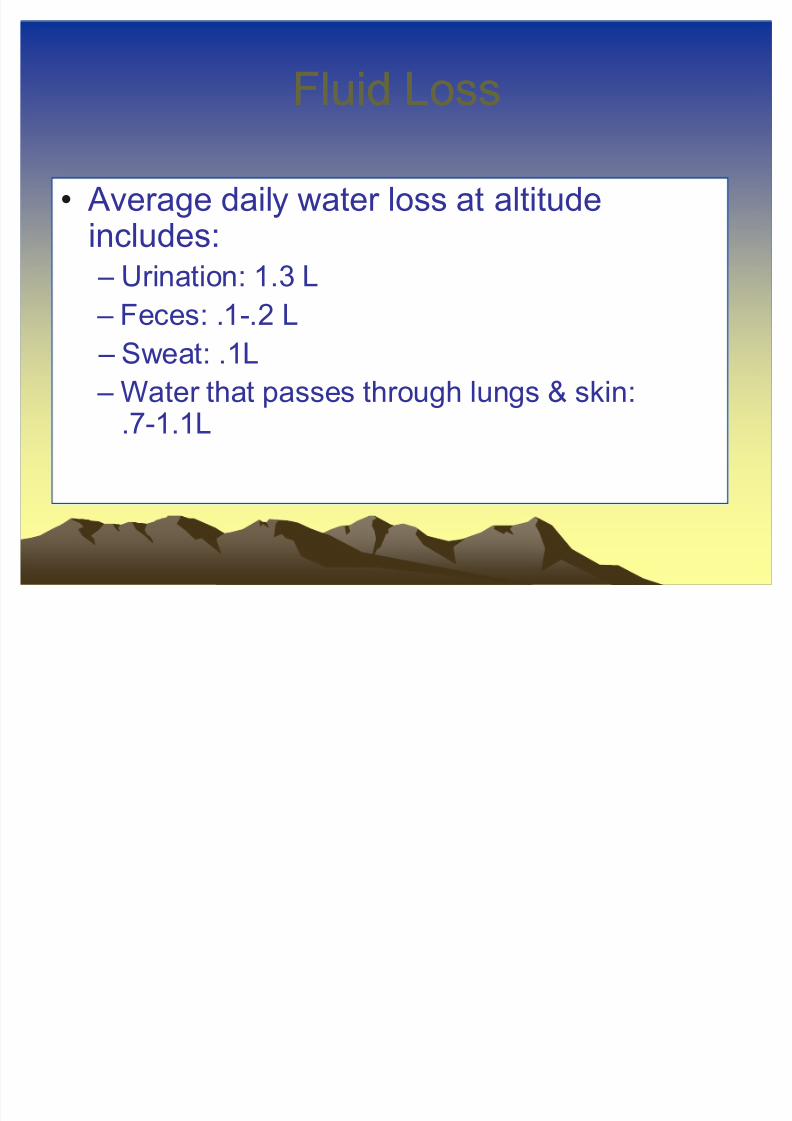
Fluid LossFluid Loss
Average daily water loss at altitudeincludes:
± Urination: 1.3 L ± Feces: .1-.2 L
± Sweat: .1L
± Water that passes through lungs & skin:
.7-1.1L
8/8/2019 4900 Altitude
http://slidepdf.com/reader/full/4900-altitude 59/78
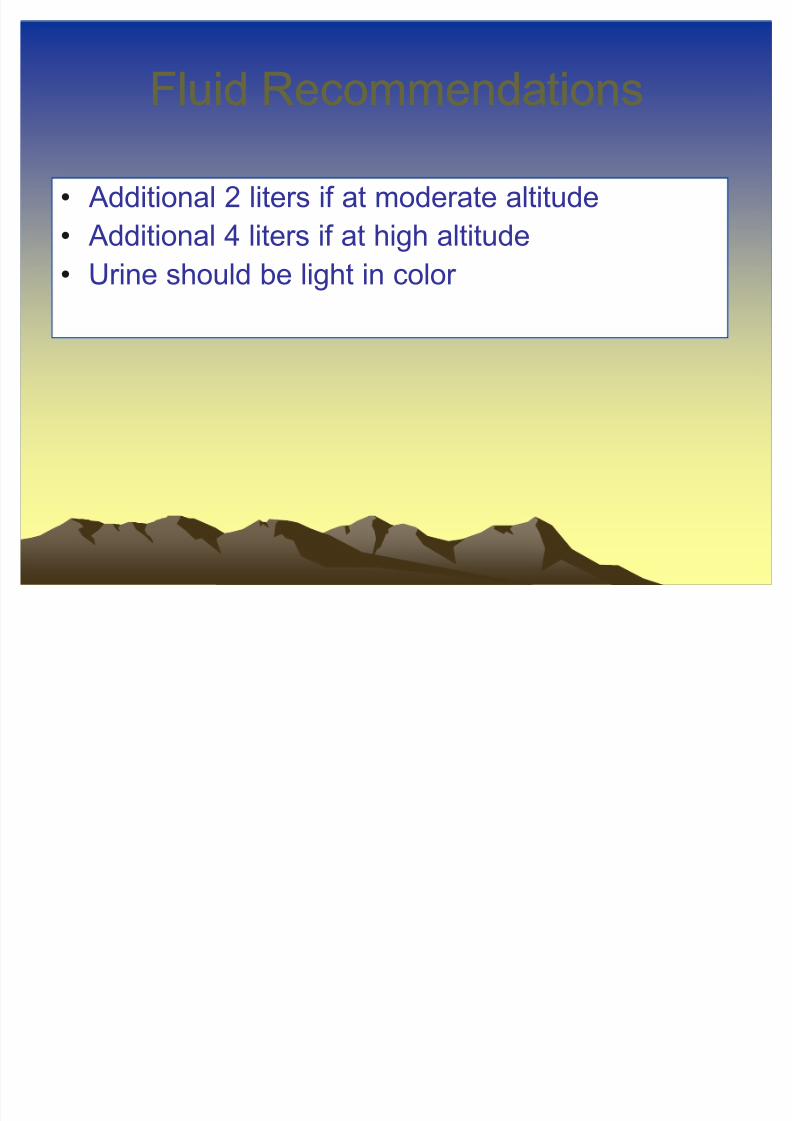
Fluid RecommendationsFluid Recommendations
Additional 2 liters if at moderate altitude
Additional 4 liters if at high altitude
Urine should be light in color
8/8/2019 4900 Altitude
http://slidepdf.com/reader/full/4900-altitude 60/78
8/8/2019 4900 Altitude
http://slidepdf.com/reader/full/4900-altitude 61/78
General Nutrition HintsGeneral Nutrition Hints
Gradually increase calories as activity increases
Plan one pot meals that cook in 15 minutes
Drink 3-5 L of water per day Drink frequently
Know that it takes 15 minutes to melt snow towater and 10-15 minutes to boil water
Increase carbohydrate intake drastically Avoid alcohol
8/8/2019 4900 Altitude
http://slidepdf.com/reader/full/4900-altitude 62/78
8/8/2019 4900 Altitude
http://slidepdf.com/reader/full/4900-altitude 63/78
8/8/2019 4900 Altitude
http://slidepdf.com/reader/full/4900-altitude 64/78
8/8/2019 4900 Altitude
http://slidepdf.com/reader/full/4900-altitude 65/78
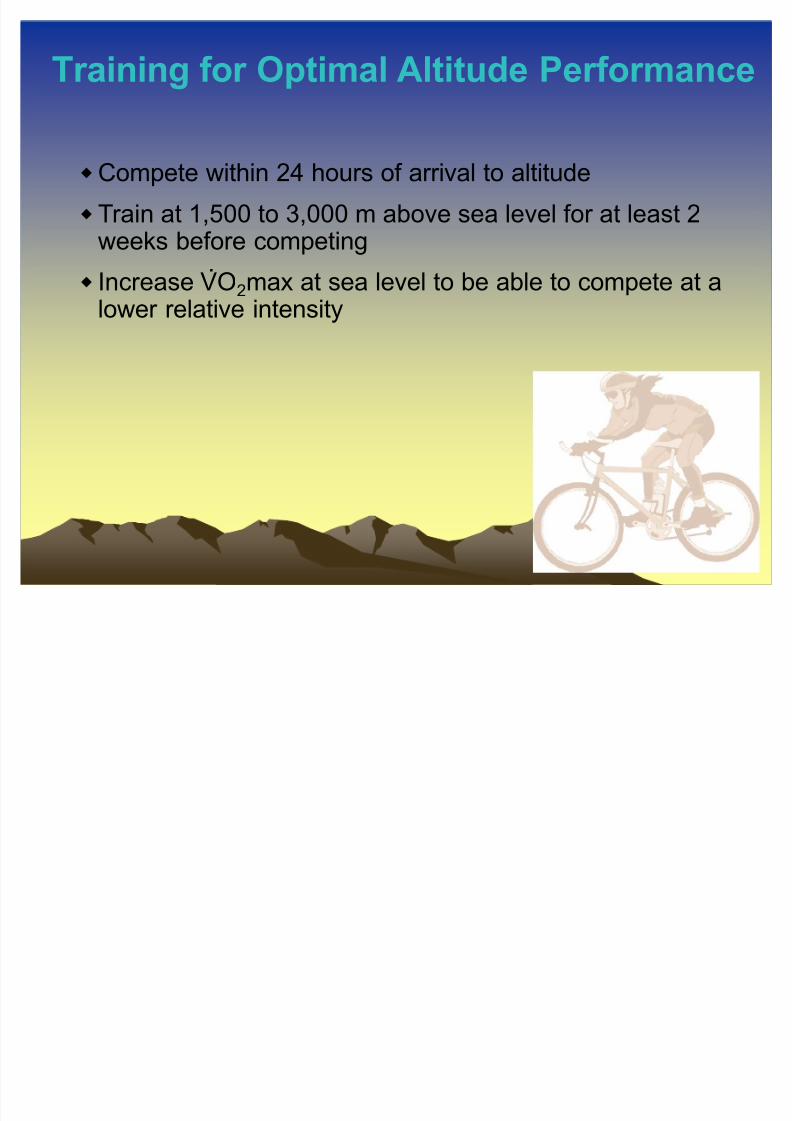
Training for Optimal Altitude Performance
Compete within 24 hours of arrival to altitude
Train at 1,500 to 3,000 m above sea level for at least 2weeks before competing
Increase VO2max at sea level to be able to compete at alower relative intensity
.
8/8/2019 4900 Altitude
http://slidepdf.com/reader/full/4900-altitude 66/78
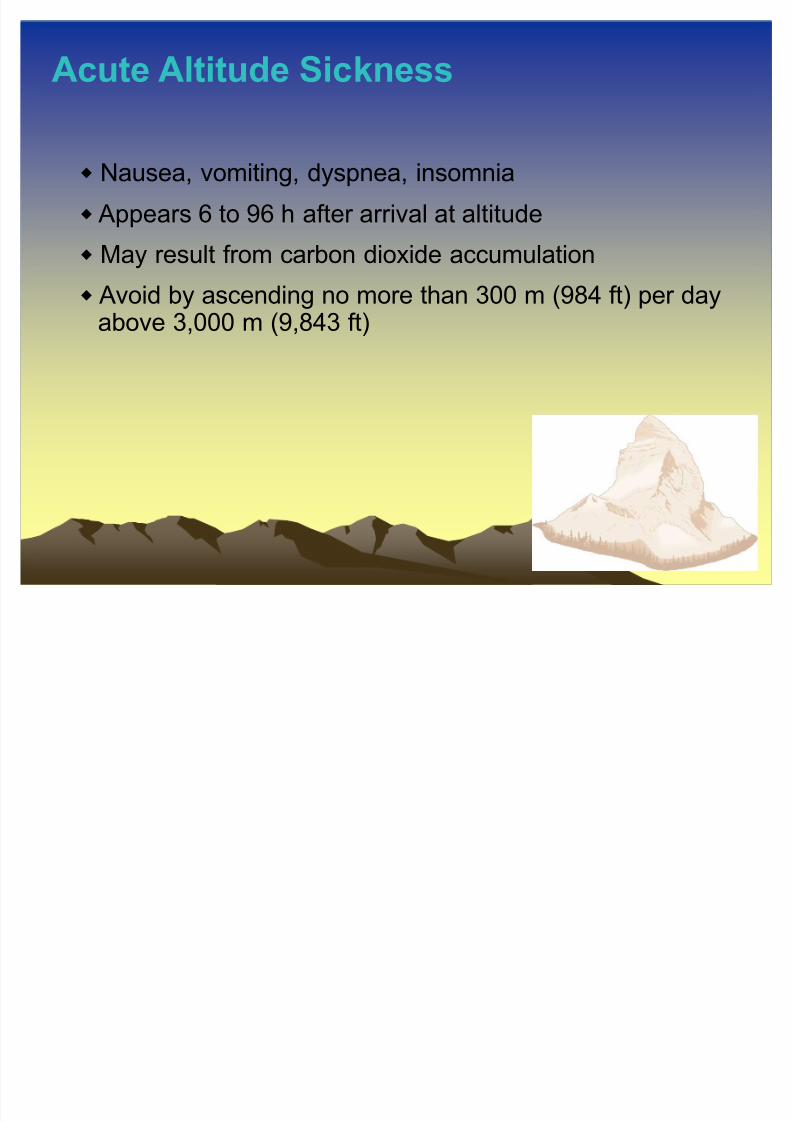
Acute Altitude Sickness
Nausea, vomiting, dyspnea, insomnia
Appears 6 to 96 h after arrival at altitude
May result from carbon dioxide accumulation
Avoid by ascending no more than 300 m (984 ft) per dayabove 3,000 m (9,843 ft)
8/8/2019 4900 Altitude
http://slidepdf.com/reader/full/4900-altitude 67/78
High-Altitude Pulmonary Edema (HAPE)
Shortness of breath, excessive fatigue, blue lips andfingernails, mental confusion
Occurs after rapid ascent above 2,700 m (8,858 ft)
Accumulation of fluid in the lungs which interferes withair movement
Cause unknown
Administer supplemental oxygen and move to lower
altitude
8/8/2019 4900 Altitude
http://slidepdf.com/reader/full/4900-altitude 68/78
Eff t f Altit dEff t f Altit d
8/8/2019 4900 Altitude
http://slidepdf.com/reader/full/4900-altitude 69/78
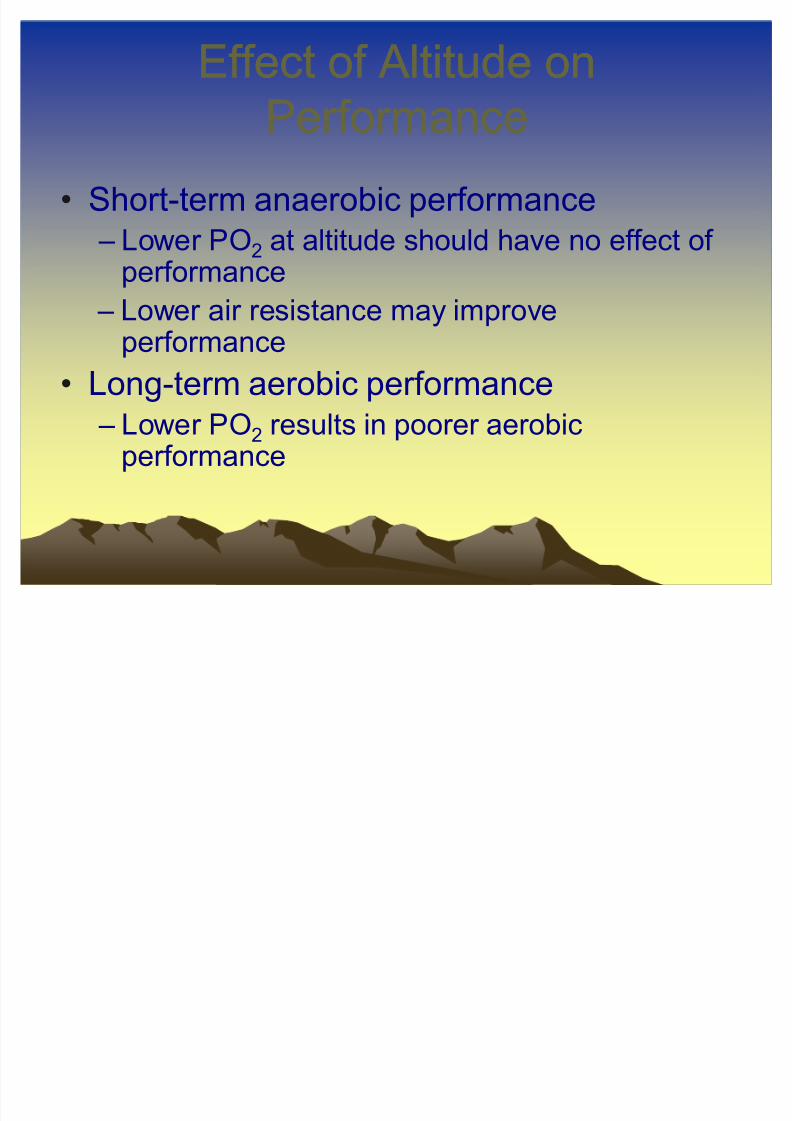
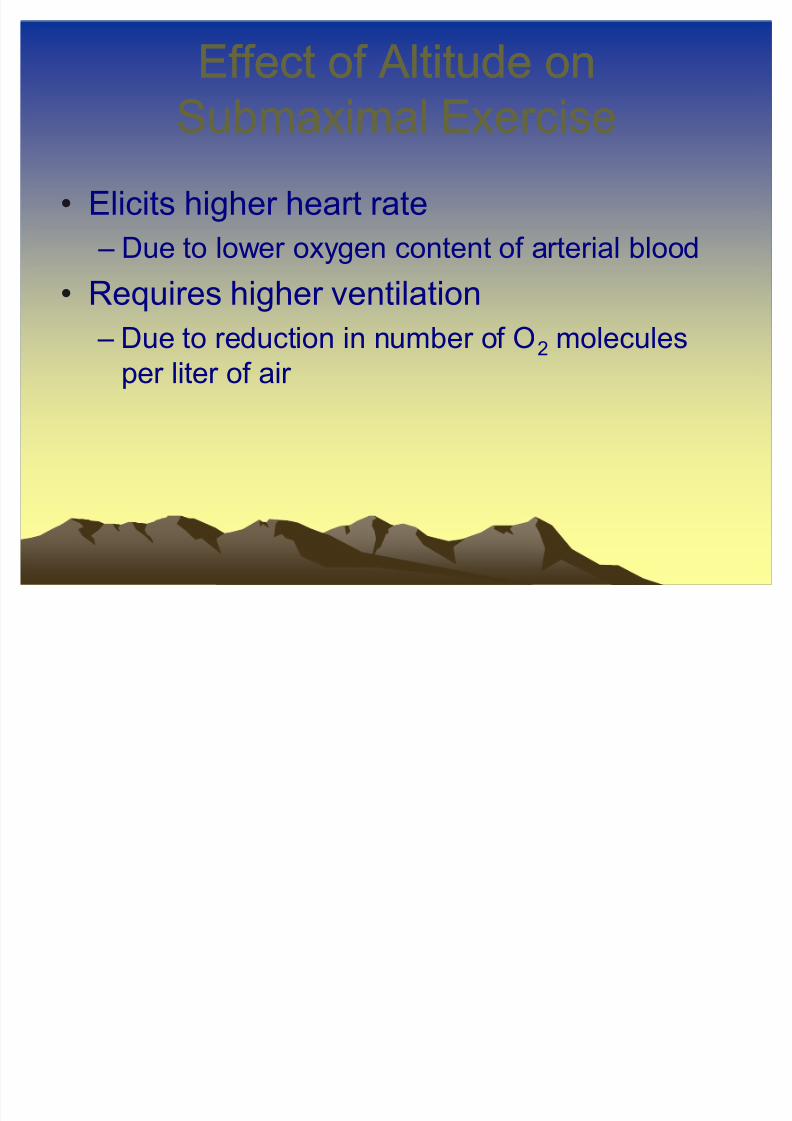
Effect of Altitude onEffect of Altitude on
PerformancePerformance
Short-term anaerobic performance
± Lower PO2 at altitude should have no effect of
performance ± Lower air resistance may improveperformance
Long-term aerobic performance
± Lower PO2 results in poorer aerobicperformance
8/8/2019 4900 Altitude
http://slidepdf.com/reader/full/4900-altitude 70/78
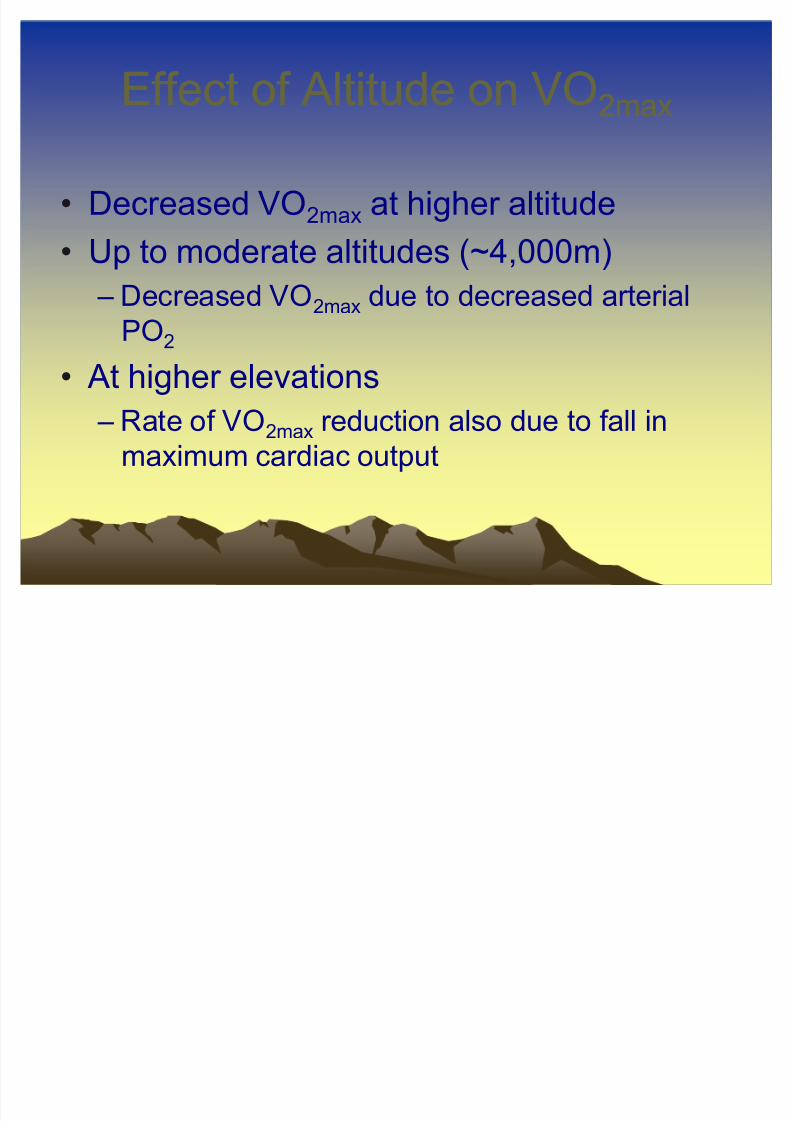
Effect of Altitude on VOEffect of Altitude on VO2max2max
Decreased VO2max at higher altitude
Up to moderate altitudes (~4,000m)
± Decreased VO2max due to decreased arterialPO2
At higher elevations
± Rate of VO2max reduction also due to fall inmaximum cardiac output
Ch i VOCh i VO WithWith
8/8/2019 4900 Altitude
http://slidepdf.com/reader/full/4900-altitude 71/78
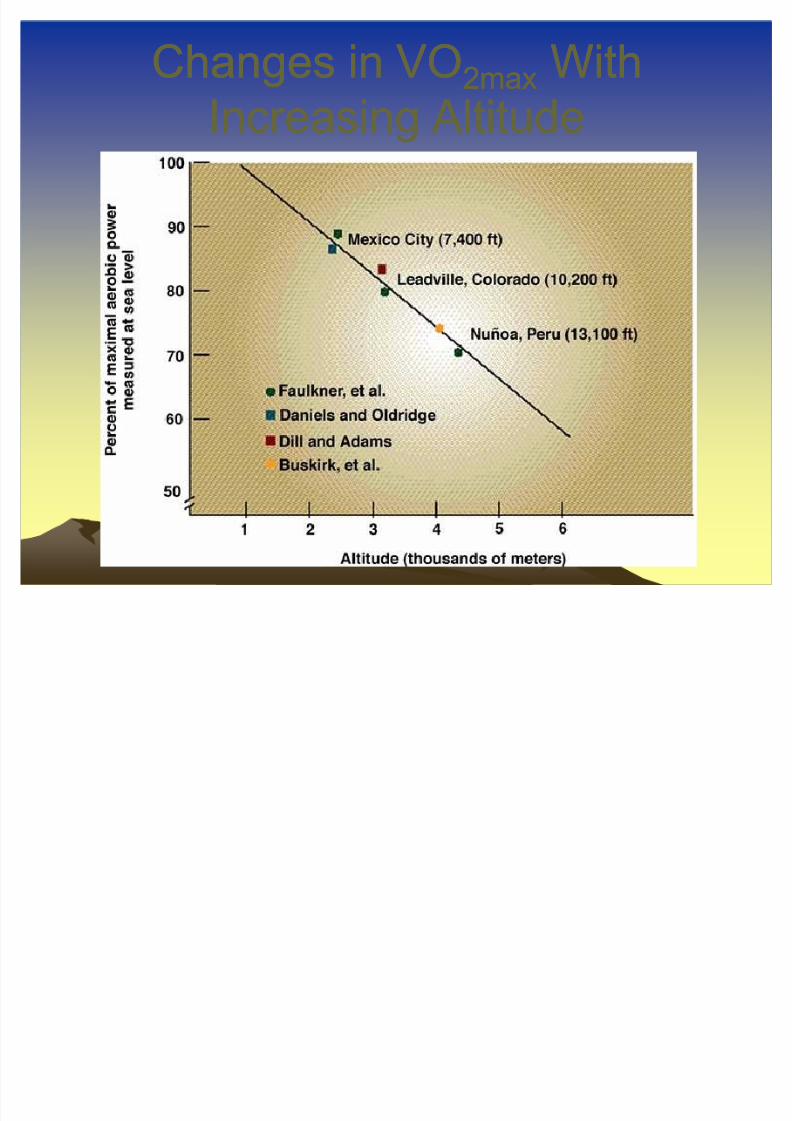
Changes in VOChanges in VO2max2max WithWith
Increasing AltitudeIncreasing Altitude
8/8/2019 4900 Altitude
http://slidepdf.com/reader/full/4900-altitude 72/78
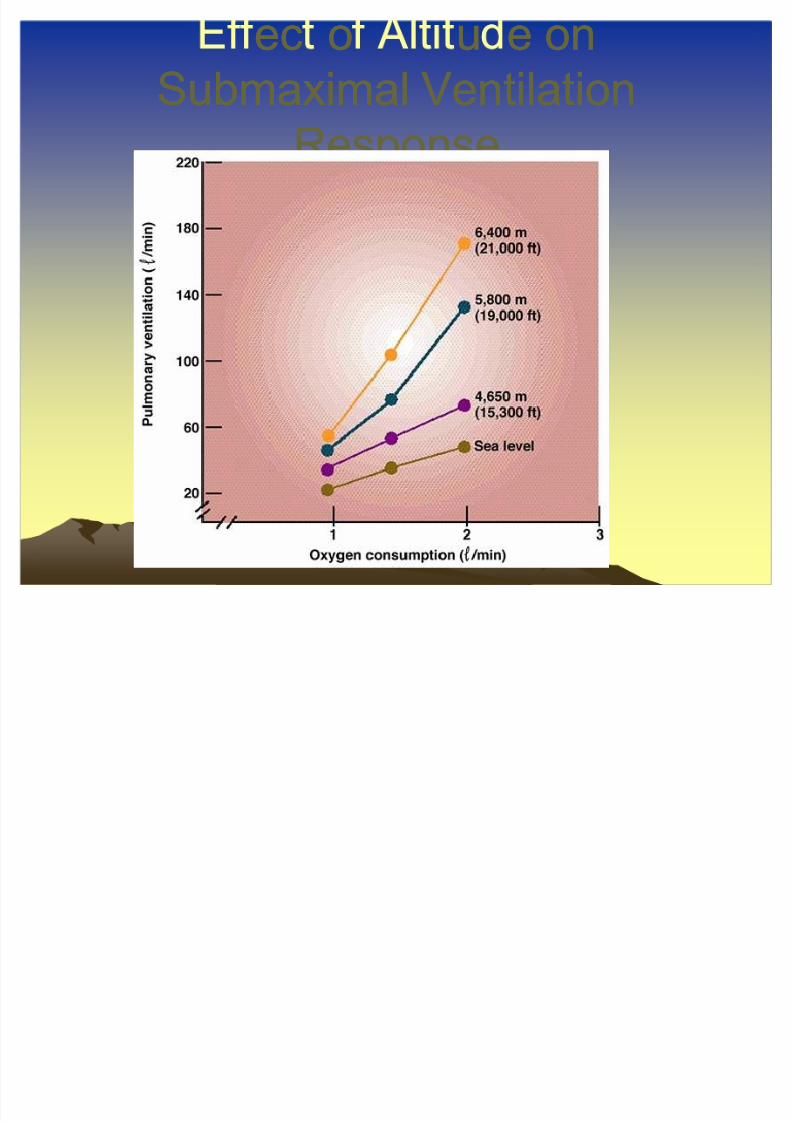
ec o u e onec o u e on
8/8/2019 4900 Altitude
http://slidepdf.com/reader/full/4900-altitude 73/78
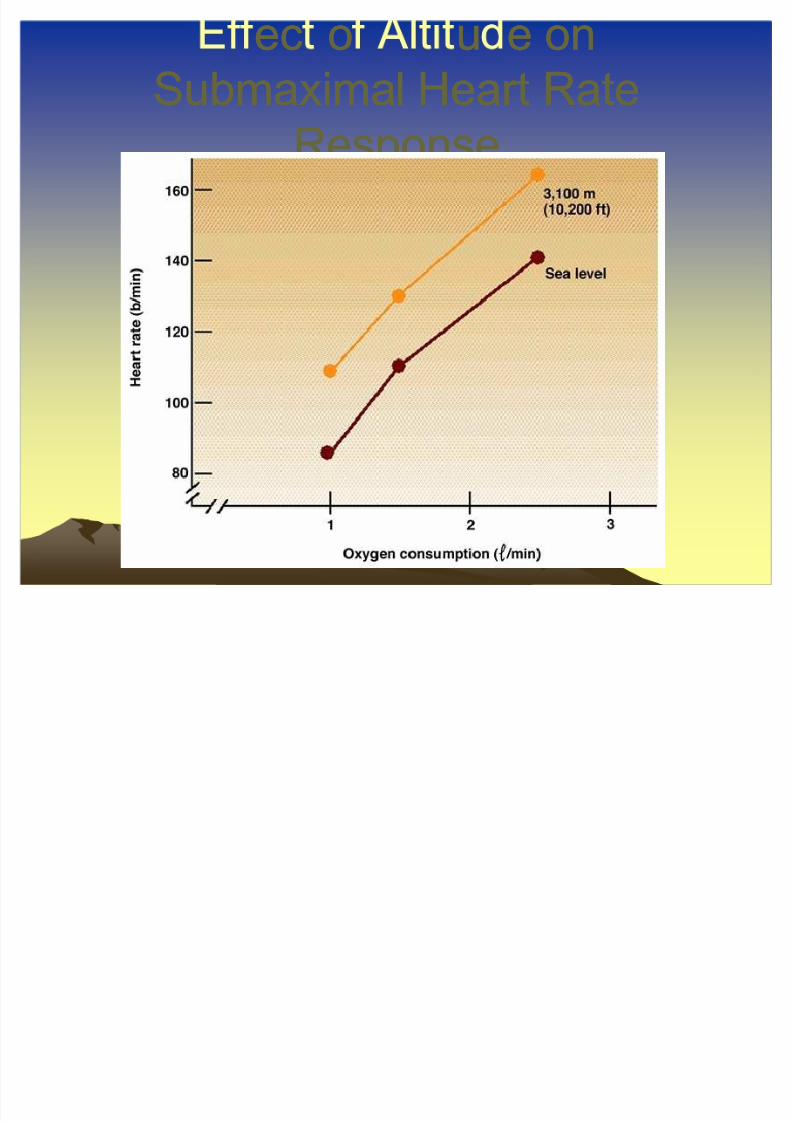
Submaximal Heart RateSubmaximal Heart Rate
ResponseResponse
8/8/2019 4900 Altitude
http://slidepdf.com/reader/full/4900-altitude 74/78
8/8/2019 4900 Altitude
http://slidepdf.com/reader/full/4900-altitude 75/78
Adaptation to High Altitude Adaptation to High Altitude
Production of more red blood cells
± Counter desaturation caused by lower PO2
In those who grew up at altitude ± Have complete adaptations in arterial oxygen
content and VO2max
In those recently arriving at altitude ± Adaptations are less complete
8/8/2019 4900 Altitude
http://slidepdf.com/reader/full/4900-altitude 76/78
8/8/2019 4900 Altitude
http://slidepdf.com/reader/full/4900-altitude 77/78
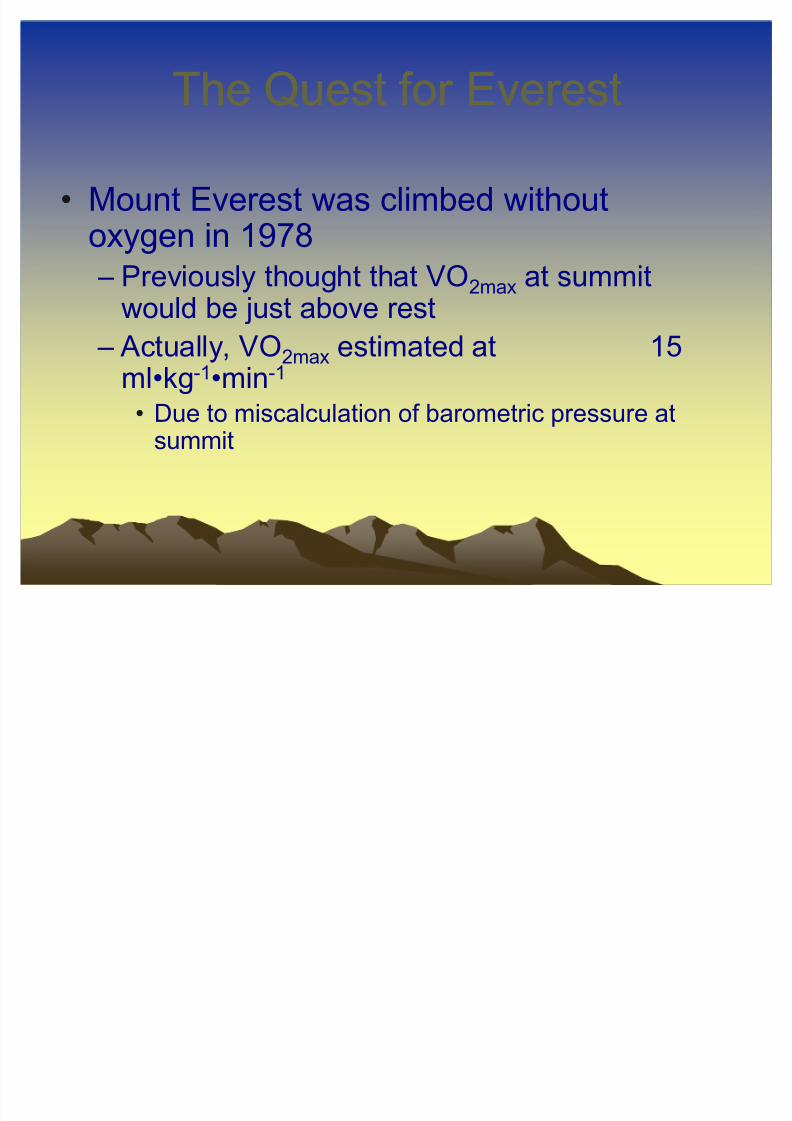
The Quest for EverestThe Quest for Everest
Mount Everest was climbed withoutoxygen in 1978
± Previously thought that VO2max at summitwould be just above rest
± Actually, VO2max estimated at 15mlkg-1min-1
Due to miscalculation of barometric pressure atsummit
8/8/2019 4900 Altitude
http://slidepdf.com/reader/full/4900-altitude 78/78


![Hr 4900 Promesa[1]](https://img.pdfslide.net/doc/110x75/577c820a1a28abe054af3202/hr-4900-promesa1.jpg)