Embed Size (px)
Citation preview
4th HMD Symposium
Life Expectancy and Lifespan Equality:A Dynamic Long run Relationship
Jose Manuel Aburto, Ugofilippo Basellini, Søren Kjærgaard& James W. Vaupel
23rd May 2017
IntroductionMethods & Data
Results
Introduction
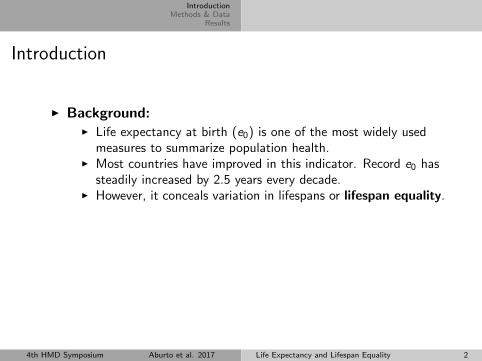
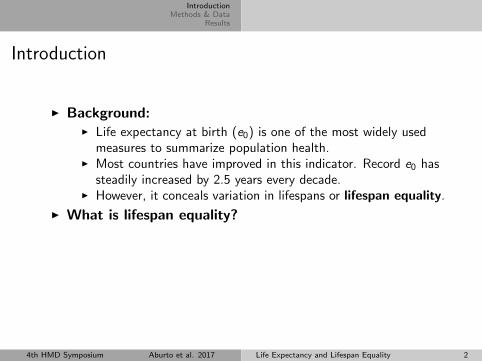
I Background:I Life expectancy at birth (e0) is one of the most widely used
measures to summarize population health.I Most countries have improved in this indicator. Record e0 has
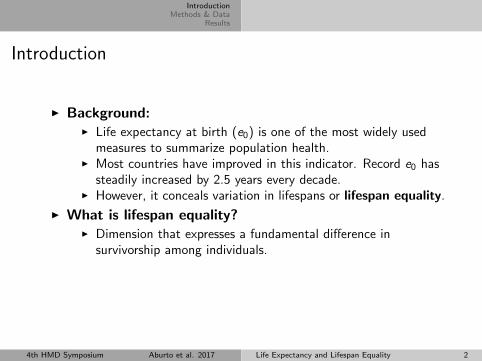
steadily increased by 2.5 years every decade.I However, it conceals variation in lifespans or lifespan equality.
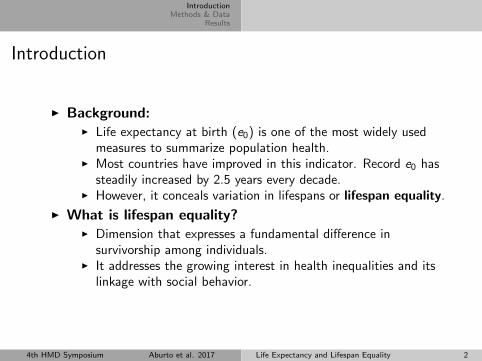
I What is lifespan equality?
I Dimension that expresses a fundamental difference insurvivorship among individuals.
I It addresses the growing interest in health inequalities and itslinkage with social behavior.
4th HMD Symposium Aburto et al. 2017 Life Expectancy and Lifespan Equality 2
IntroductionMethods & Data
Results
Introduction
I Background:I Life expectancy at birth (e0) is one of the most widely used
measures to summarize population health.I Most countries have improved in this indicator. Record e0 has
steadily increased by 2.5 years every decade.I However, it conceals variation in lifespans or lifespan equality.
I What is lifespan equality?I Dimension that expresses a fundamental difference in
survivorship among individuals.
I It addresses the growing interest in health inequalities and itslinkage with social behavior.
4th HMD Symposium Aburto et al. 2017 Life Expectancy and Lifespan Equality 2
IntroductionMethods & Data
Results
Introduction
I Background:I Life expectancy at birth (e0) is one of the most widely used
measures to summarize population health.I Most countries have improved in this indicator. Record e0 has
steadily increased by 2.5 years every decade.I However, it conceals variation in lifespans or lifespan equality.
I What is lifespan equality?I Dimension that expresses a fundamental difference in
survivorship among individuals.I It addresses the growing interest in health inequalities and its
linkage with social behavior.
4th HMD Symposium Aburto et al. 2017 Life Expectancy and Lifespan Equality 2
IntroductionMethods & Data
Results
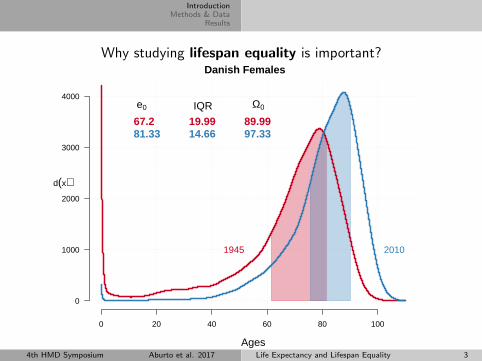
Why studying lifespan equality is important?
Ages
Danish Females
0 20 40 60 80 100
0
1000
2000
3000
4000
d(x)
e0
67.281.33
IQR
19.9914.66
Ω0
89.9997.33
1945 2010
Source: HMD4th HMD Symposium Aburto et al. 2017 Life Expectancy and Lifespan Equality 3
IntroductionMethods & Data
Results
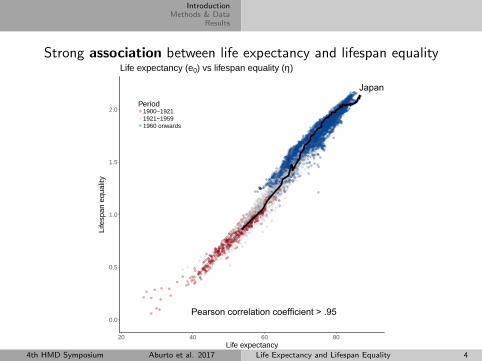
Strong association between life expectancy and lifespan equality
0.0
0.5
1.0
1.5
2.0
20 40 60 80Life expectancy
Life
span
equ
ality
Period1900−19211921−19591960 onwards
Life expectancy (e0) vs lifespan equality (η)
Japan
Pearson correlation coefficient > .95
4th HMD Symposium Aburto et al. 2017 Life Expectancy and Lifespan Equality 4
IntroductionMethods & Data
Results
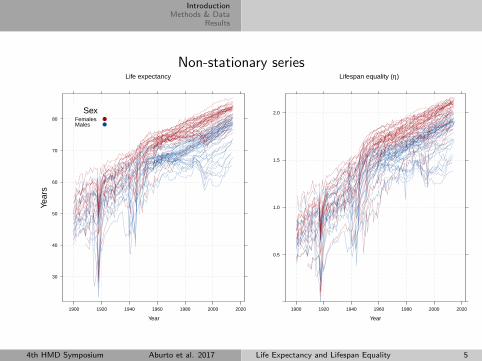
Non-stationary seriesLife expectancy
Year
Year
s
30
40
50
60
70
80
1900 1920 1940 1960 1980 2000 2020
SexFemalesMales
Lifespan equality (η)
Year
0.5
1.0
1.5
2.0
1900 1920 1940 1960 1980 2000 2020
4th HMD Symposium Aburto et al. 2017 Life Expectancy and Lifespan Equality 5
IntroductionMethods & Data
Results
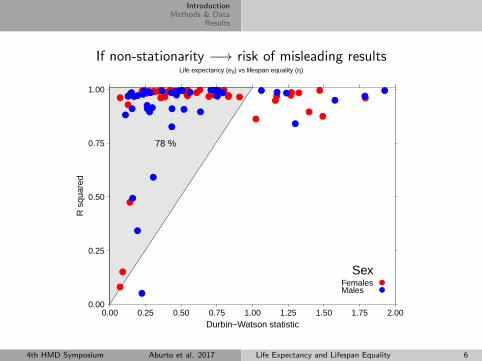
If non-stationarity −→ risk of misleading resultsLife expectancy (e0) vs lifespan equality (η)
Durbin−Watson statistic
R s
quar
ed
0.00
0.25
0.50
0.75
1.00
0.00 0.25 0.50 0.75 1.00 1.25 1.50 1.75 2.00
78 %
SexFemalesMales
4th HMD Symposium Aburto et al. 2017 Life Expectancy and Lifespan Equality 6
IntroductionMethods & Data
Results
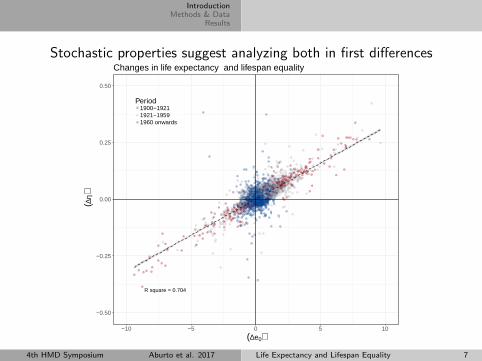
Stochastic properties suggest analyzing both in first differences
R square = 0.704
−0.50
−0.25
0.00
0.25
0.50
−10 −5 0 5 10
(∆e0)
(∆η)
Period1900−19211921−19591960 onwards
Changes in life expectancy and lifespan equality
4th HMD Symposium Aburto et al. 2017 Life Expectancy and Lifespan Equality 7
IntroductionMethods & Data
Results
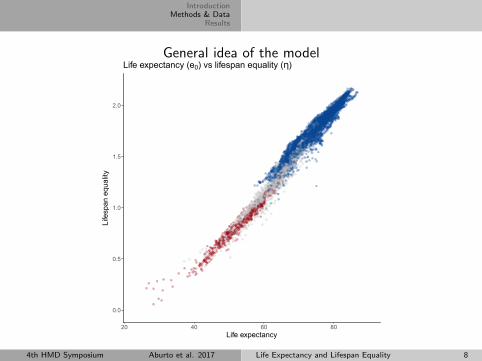
General idea of the model
0.0
0.5
1.0
1.5
2.0
20 40 60 80Life expectancy
Life
span
equ
ality
Life expectancy (e0) vs lifespan equality (η)
4th HMD Symposium Aburto et al. 2017 Life Expectancy and Lifespan Equality 8
IntroductionMethods & Data
Results
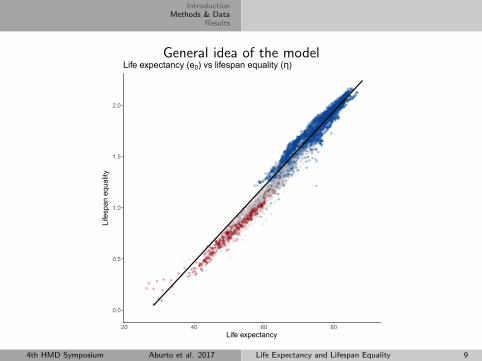
General idea of the model
0.0
0.5
1.0
1.5
2.0
20 40 60 80Life expectancy
Life
span
equ
ality
Life expectancy (e0) vs lifespan equality (η)
4th HMD Symposium Aburto et al. 2017 Life Expectancy and Lifespan Equality 9
IntroductionMethods & Data
Results
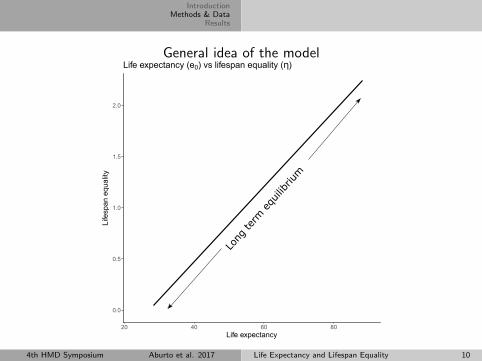
General idea of the model
0.0
0.5
1.0
1.5
2.0
20 40 60 80Life expectancy
Life
span
equ
ality
Life expectancy (e0) vs lifespan equality (η)
Long
term
equ
ilibriu
m
4th HMD Symposium Aburto et al. 2017 Life Expectancy and Lifespan Equality 10
IntroductionMethods & Data
Results
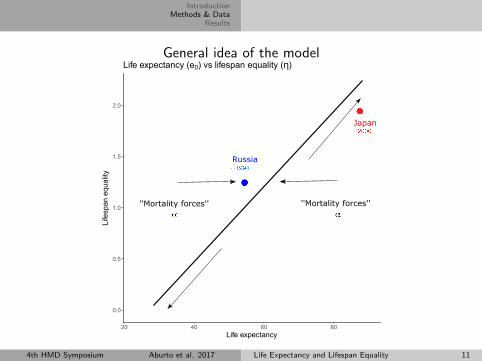
General idea of the model
0.0
0.5
1.0
1.5
2.0
20 40 60 80Life expectancy
Life
span
equ
ality
Life expectancy (e0) vs lifespan equality (η)
Japan
Russia
''Mortality forces''''Mortality forces''
4th HMD Symposium Aburto et al. 2017 Life Expectancy and Lifespan Equality 11
IntroductionMethods & Data
Results
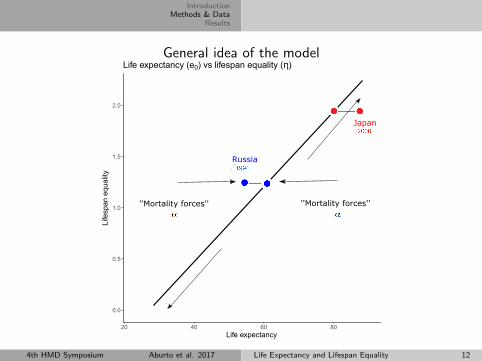
General idea of the model
0.0
0.5
1.0
1.5
2.0
20 40 60 80Life expectancy
Life
span
equ
ality
Life expectancy (e0) vs lifespan equality (η)
Japan
Russia
''Mortality forces''''Mortality forces''
4th HMD Symposium Aburto et al. 2017 Life Expectancy and Lifespan Equality 12
IntroductionMethods & Data
Results
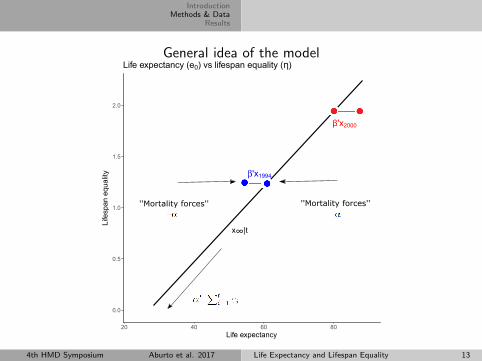
General idea of the model
0.0
0.5
1.0
1.5
2.0
20 40 60 80Life expectancy
Life
span
equ
ality
Life expectancy (e0) vs lifespan equality (η)
''Mortality forces''''Mortality forces''
β'x1994
β'x2000
x∞|t
4th HMD Symposium Aburto et al. 2017 Life Expectancy and Lifespan Equality 13
IntroductionMethods & Data
Results
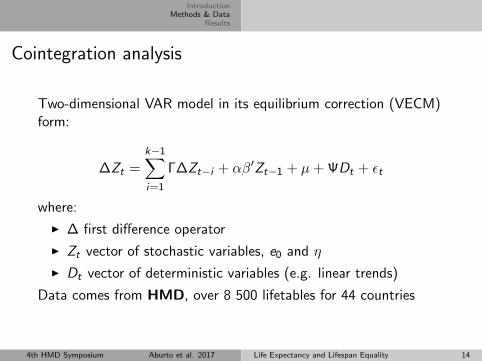
Cointegration analysis
Two-dimensional VAR model in its equilibrium correction (VECM)form:
∆Zt =k−1∑i=1
Γ∆Zt−i + αβ′Zt−1 + µ+ ΨDt + εt
where:
I ∆ first difference operator
I Zt vector of stochastic variables, e0 and η
I Dt vector of deterministic variables (e.g. linear trends)
Data comes from HMD, over 8 500 lifetables for 44 countries
4th HMD Symposium Aburto et al. 2017 Life Expectancy and Lifespan Equality 14
IntroductionMethods & Data
Results
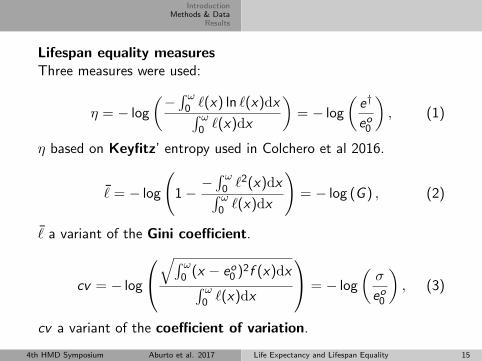
Lifespan equality measuresThree measures were used:
η = − log
(− ∫ ω0 `(x) ln `(x)dx∫ ω0 `(x)dx
)= − log
(e†
eo0
), (1)
η based on Keyfitz’ entropy used in Colchero et al 2016.
¯ = − log
(1−−∫ ω0 `2(x)dx∫ ω0 `(x)dx
)= − log (G ) , (2)
¯ a variant of the Gini coefficient.
cv = − log
√∫ ω
0 (x − eo0 )2f (x)dx∫ ω0 `(x)dx
= − log
(σ
eo0
), (3)
cv a variant of the coefficient of variation.
4th HMD Symposium Aburto et al. 2017 Life Expectancy and Lifespan Equality 15
IntroductionMethods & Data
Results
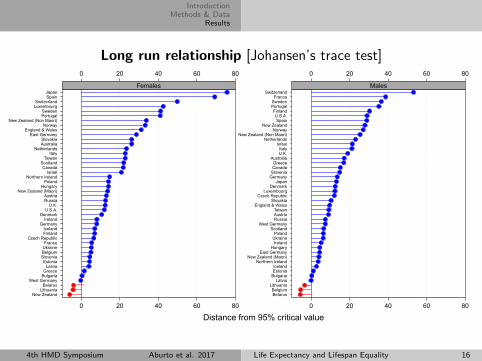
Long run relationship [Johansen’s trace test]
New ZealandLithuania
BelarusWest Germany
BulgariaGreece
LatviaEstonia
SloveniaBelgiumUkraineFrance
Czech RepublicFinlandIceland
GermanyIreland
DenmarkU.S.A.
U.K.RussiaAustria
New Zealand (Maori)Hungary
PolandNorthern Ireland
IsraelCanada
ScotlandTaiwan
ItalyNetherlands
AustraliaSlovakia
East GermanyEngland & Wales
NorwayNew Zealand (Non Maori)
PortugalSweden
LuxembourgSwitzerland
SpainJapan
Distance from 95% critical value
0 20 40 60 80
0 20 40 60 80
Females
0 20 40 60 80
BelarusBelgium
LithuaniaLatvia
BulgariaEstoniaIceland
Northern IrelandNew Zealand (Maori)
East GermanyHungary
IrelandUkrainePoland
ScotlandWest Germany
RussiaAustriaTaiwan
England & WalesSlovakia
Czech RepublicLuxembourg
DenmarkJapan
GermanySloveniaCanadaGreece
AustraliaU.K.Italy
IsraelNetherlands
New Zealand (Non Maori)Norway
New ZealandSpain
U.S.A.Finland
PortugalSwedenFrance
Switzerland
0 20 40 60 80
Males
4th HMD Symposium Aburto et al. 2017 Life Expectancy and Lifespan Equality 16
IntroductionMethods & Data
Results
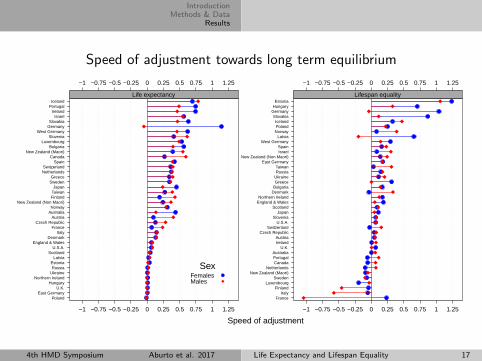
Speed of adjustment towards long term equilibrium
Speed of adjustment
−1 −0.75 −0.5 −0.25 0 0.25 0.5 0.75 1 1.25
PolandEast Germany
U.K.Hungary
Northern IrelandUkraineRussia
EstoniaLatvia
ScotlandU.S.A.
England & WalesDenmark
ItalyFrance
Czech RepublicAustria
AustraliaNorway
New Zealand (Non Maori)FinlandTaiwanJapan
SwedenGreece
NetherlandsSwitzerland
SpainCanada
New Zealand (Maori)Bulgaria
LuxembourgSlovenia
West GermanyGermanySlovakia
IsraelIreland
PortugalIceland
−1 −0.75 −0.5 −0.25 0 0.25 0.5 0.75 1 1.25
Life expectancy
−1 −0.75 −0.5 −0.25 0 0.25 0.5 0.75 1 1.25
FranceItaly
FinlandLuxembourg
SwedenNew Zealand (Maori)
NetherlandsCanadaPortugalAustralia
U.K.IrelandAustria
Czech RepublicSwitzerland
U.S.A.Slovenia
JapanScotland
England & WalesNorthern Ireland
DenmarkBulgariaGreeceUkraineRussiaTaiwan
East GermanyNew Zealand (Non Maori)
IsraelSpain
West GermanyLatvia
NorwayPolandIceland
SlovakiaGermanyHungaryEstonia
−1 −0.75 −0.5 −0.25 0 0.25 0.5 0.75 1 1.25
Lifespan equality
SexFemalesMales
4th HMD Symposium Aburto et al. 2017 Life Expectancy and Lifespan Equality 17
IntroductionMethods & Data
Results
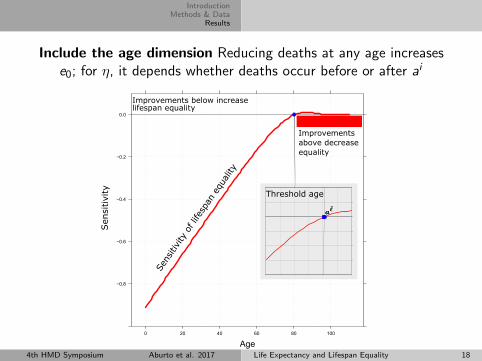
Include the age dimension Reducing deaths at any age increasese0; for η, it depends whether deaths occur before or after ai
Age
−0.8
−0.6
−0.4
−0.2
0.0
0 20 40 60 80 100
Sens
itivity
of l
ifesp
an e
qual
ity
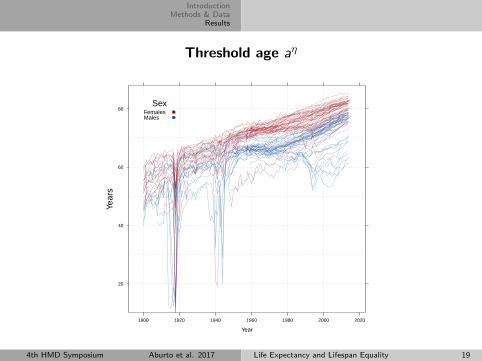
Threshold age
Sen
sitivi
tyImprovements below increase lifespan equality
Improvements above decrease equality
4th HMD Symposium Aburto et al. 2017 Life Expectancy and Lifespan Equality 18
IntroductionMethods & Data
Results
Threshold age aη
Year
Year
s
20
40
60
80
1900 1920 1940 1960 1980 2000 2020
SexFemalesMales
4th HMD Symposium Aburto et al. 2017 Life Expectancy and Lifespan Equality 19
IntroductionMethods & Data
Results
Decomposition method
Model of continuous change: analysis based on the assumptionthat covariates change continuously along an actual orhypothetical dimension.[Horiuchi et al 2008 Demography; Caswell 2010 Journal of Ecology]
The effect of the i-th age group death rate on the change in e0and η from period t to t + 1 can be calculated as
ci =
∫ mi (t+1)
mi (t)
∂e0(t)
∂mi (t)dmi (t) (4)
Then we calculated contributions below and above the thresholdage to changes in life expectancy and lifespan equality.
4th HMD Symposium Aburto et al. 2017 Life Expectancy and Lifespan Equality 20
IntroductionMethods & Data
Results
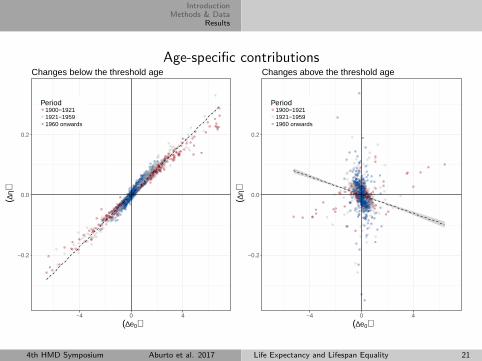
Age-specific contributions
−0.2
0.0
0.2
−4 0 4
(∆e0)
(∆η)
Period1900−19211921−19591960 onwards
Changes below the threshold age
−0.2
0.0
0.2
−4 0 4
(∆e0)
(∆η)
Period1900−19211921−19591960 onwards
Changes above the threshold age
4th HMD Symposium Aburto et al. 2017 Life Expectancy and Lifespan Equality 21
IntroductionMethods & Data
Results
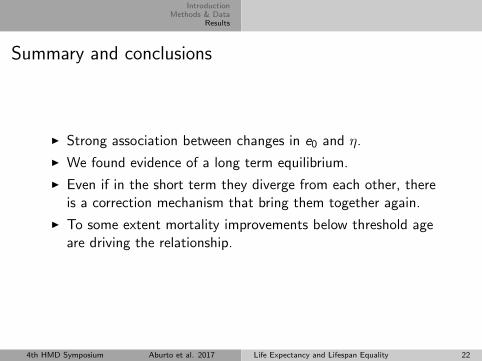
Summary and conclusions
I Strong association between changes in e0 and η.
I We found evidence of a long term equilibrium.
I Even if in the short term they diverge from each other, thereis a correction mechanism that bring them together again.
I To some extent mortality improvements below threshold ageare driving the relationship.
4th HMD Symposium Aburto et al. 2017 Life Expectancy and Lifespan Equality 22
IntroductionMethods & Data
Results
Thanks for your attention.
Comments and/or questions?
4th HMD Symposium Aburto et al. 2017 Life Expectancy and Lifespan Equality 23
IntroductionMethods & Data
Results
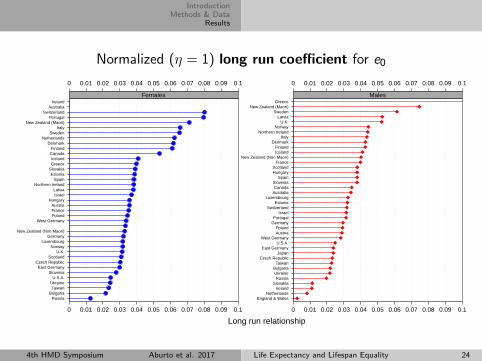
Normalized (η = 1) long run coefficient for e0
Long run relationship
0 0.01 0.02 0.03 0.04 0.05 0.06 0.07 0.08 0.09 0.1
RussiaBulgaria
TaiwanUkraineU.S.A.
SloveniaEast Germany
Czech RepublicScotland
U.K.Norway
LuxembourgGermany
New Zealand (Non Maori)
West GermanyPolandFranceAustria
HungaryIsraelLatvia
Northern IrelandSpain
EstoniaSlovakiaGreeceIceland
CanadaFinland
DenmarkNetherlands
SwedenItaly
New Zealand (Maori)Portugal
SwitzerlandAustralia
Ireland
0 0.01 0.02 0.03 0.04 0.05 0.06 0.07 0.08 0.09 0.1
Females
0 0.01 0.02 0.03 0.04 0.05 0.06 0.07 0.08 0.09 0.1
England & WalesNetherlands
IrelandSlovakia
RussiaUkraineBulgaria
TaiwanCzech Republic
JapanEast Germany
U.S.A.West Germany
AustriaPoland
GermanyPortugal
IsraelSwitzerland
EstoniaLuxembourg
AustraliaCanada
SloveniaSpain
HungaryScotland
FranceNew Zealand (Non Maori)
IcelandFinland
DenmarkItaly
Northern IrelandNorway
U.K.Latvia
SwedenNew Zealand (Maori)
Greece
0 0.01 0.02 0.03 0.04 0.05 0.06 0.07 0.08 0.09 0.1
Males
4th HMD Symposium Aburto et al. 2017 Life Expectancy and Lifespan Equality 24
IntroductionMethods & Data
Results
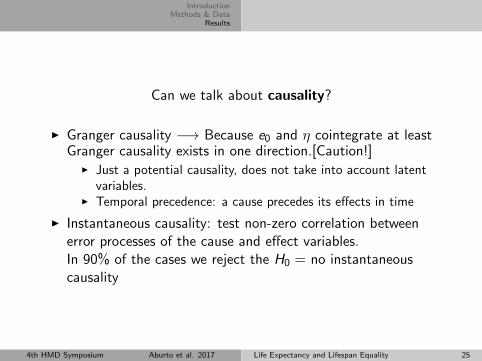
Can we talk about causality?
I Granger causality −→ Because e0 and η cointegrate at leastGranger causality exists in one direction.[Caution!]
I Just a potential causality, does not take into account latentvariables.
I Temporal precedence: a cause precedes its effects in time
I Instantaneous causality: test non-zero correlation betweenerror processes of the cause and effect variables.In 90% of the cases we reject the H0 = no instantaneouscausality
4th HMD Symposium Aburto et al. 2017 Life Expectancy and Lifespan Equality 25
IntroductionMethods & Data
Results
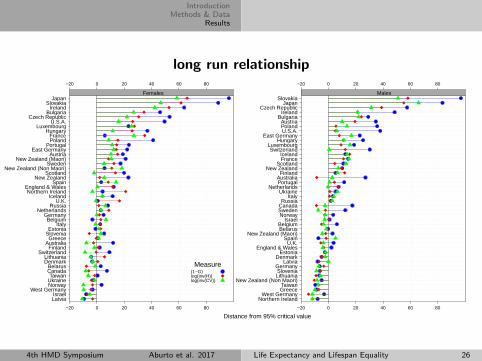
long run relationship
Distance from 95% critical value
−20 0 20 40 60 80
LatviaIsrael
West GermanyNorwayUkraineTaiwan
CanadaBelarus
DenmarkLithuania
SwitzerlandFinland
AustraliaGreece
SloveniaEstonia
ItalyBelgium
GermanyNetherlands
RussiaU.K.
IcelandNorthern Ireland
England & WalesSpain
New ZealandScotland
New Zealand (Non Maori)Sweden
New Zealand (Maori)Austria
East GermanyPortugal
PolandFrance
HungaryLuxembourg
U.S.A.Czech Republic
BulgariaIreland
SlovakiaJapan
−20 0 20 40 60 80
Females
−20 0 20 40 60 80
Northern IrelandWest Germany
GreeceTaiwan
New Zealand (Non Maori)LithuaniaSlovenia
GermanyLatvia
DenmarkEstonia
England & WalesU.K.
SpainNew Zealand (Maori)
BelarusBelgium
IsraelNorwaySwedenCanadaRussia
ItalyUkraine
NetherlandsPortugalAustralia
FinlandNew Zealand
ScotlandFranceIceland
SwitzerlandLuxembourg
HungaryEast Germany
U.S.A.PolandAustria
BulgariaIreland
Czech RepublicJapan
Slovakia
−20 0 20 40 60 80
Males
Measure(1−G)log(inv(H))log(inv(CV))
4th HMD Symposium Aburto et al. 2017 Life Expectancy and Lifespan Equality 26