Embed Size (px)
Citation preview
International Journal of Computer Engineering and Technology (IJCET), ISSN 0976 – 6367(Print),
ISSN 0976 – 6375(Online) Volume 3, Issue 2, July- September (2012), © IAEME
35
FRACTAL IMAGE COMPRESSION SCHEME USING
BIOGEOGRAPHY BASED OPTIMIZATION ON COLOR IMAGES Hitashi
1 and Sugandha Sharma
2
1 Research Scholar, Indo Global College, Punjab (India)
2 Deptt. of CSE, Indo Global College, Punjab (India)
ABSTRACT
The main problem with fractal image compression is that it takes a lot of computational
time for searching blocks (domain block and range block) and then compares these
blocks. There are many optimization techniques which are used to improve efficiency of
fractal image compression. Some of these are particle swarm optimization, ant colony
optimization and biogeography based optimization. In this paper the technique of
biogeography based optimization (BBO) is applied for fractal image compression
(FIC).With the help of this evolutionary algorithm effort is made to reduce the search
complexity of matching between range block and domain block. The main drawback of
FIC is that it involves more computational time due to global search. In order to improve
the computational time and also the satisfactory quality of the decoded image, BBO
algorithm is proposed. Investigational outcome show that the BBO is a better method
than the traditional comprehensive search method in terms of encoding time. Results are
calculated from wavelet based fractal image compression than BBO is applied over it to
decrease the encode time and get better visual quality of image. In this type of
compression first color image is split into three matrixes R, G, B and then compression is
applied over individual matrix. These matrixes are then merged together after
compression to reconstruct the compressed image. In this paper compression time
(encoding time) of fractal image compression is reduced which is applied over color
image.
Keywords: fractal image compression, biogeography based optimization (BBO),
encoding time, suitability index variables (sivs).
INTERNATIONAL JOURNAL OF COMPUTER ENGINEERING &
TECHNOLOGY (IJCET)
ISSN 0976 – 6367(Print)
ISSN 0976 – 6375(Online)
Volume 3, Issue 2, July- September (2012), pp. 35-46
© IAEME: www.iaeme.com/ijcet.html
Journal Impact Factor (2011): 1.0425 (Calculated by GISI)
www.jifactor.com
IJCET
© I A E M E
International Journal of Computer Engineering and Technology (IJCET), ISSN 0976 – 6367(Print),
ISSN 0976 – 6375(Online) Volume 3, Issue 2, July- September (2012), © IAEME
36
1. INTRODUCTION
To a resolution of 1024 X 1024 images, for example, each pixel RGB of three color
channels, namely, the need is for 8X3 bit. If it is not through the compression process, so
that an ordinary image will occupy about 3MB of storage space. Resolution images of
such storage, then every 1,000 images and the required storage space will reach about
3GB and if you need the network in a picture, assuming second transmission 5 KB, then
such a picture of the transmission will need about 600 seconds. This massive storage
space and slow speeds are not for the modem computer is intolerable.
Compression and decompression tools of digital image has become a significant aspect in
the storing and transferring of digital image. The compression offers a means to reduce
the cost of storage and increase the speed of transmission. Image compression is used to
minimize the size in bytes of a graphics file without degrading the quality of the image.
There are two types of image compression is present. They are lossy and lossless. In
lossless compression, the reconstructed image after compression is numerically identical
to the original image. In lossy compression scheme, the reconstructed image contains
degradation relative to the original. Lossy technique causes image quality degradation in
each compression or decompression step. In general, lossy techniques provide for greater
compression ratios than lossless techniques i.e. Lossless compression gives good quality
of compressed images, but yields only less compression where as the lossy compression
techniques lead to loss of data with higher compression ratio. The approaches for lossless
image compression include variable-length encoding, Adaptive dictionary algorithms
such as LZW, bit-plane coding, lossless predictive coding, etc. The approaches for lossy
compression include lossy predictive coding and transform coding. Transform coding,
which applies a Fourier-related transform such as DCT and Wavelet Transform such as
DWT are the most commonly used approach . Over the past few years, a variety of
powerful and sophisticated Fractal image compression schemes for image compression
have been developed and implemented. The iteration function system provides a better
quality in the images. Most of the methods in use can be classified under the head of
lossy compression. This implies that the reconstructed image is always an estimate of the
original image. Fractal image coding introduced by Barnsley and Jacquin is the outcome
of the study of the iterated function system developed in the last decade [1]. Because of
its high compression ratio and simple decompression method, many researchers have
done a lot of research on it. But the main drawback of their work can be related to large
computational time for image compression.
The science of biogeography can be traced to the work of nineteenth century
naturalists such as Alfred Wallace [4] and Charles Darwin [5]. In the early 1960s, Robert
MacArthur and Edward Wilson began working together on mathematical models of
biogeography, their work culminating with the classic 1967 publication The Theory of
Island Biogeography [6].
Mathematical models of biogeography describe how species migrate from one
island to another, how new species arise, and how species become extinct. The term
“island” here is used descriptively rather than literally. That is, an island is any habitat
that is geographically isolated from other habitats. We therefore use the more generic
International Journal of Computer Engineering and Technology (IJCET), ISSN 0976 – 6367(Print),
ISSN 0976 – 6375(Online) Volume 3, Issue 2, July- September (2012), © IAEME
37
term “habitat” in this paper [4]. Geographical areas that are well suited as residences for
biological species are said to have a high habitat suitability index (HSI) [4]. Features that
correlate with HSI include such factors as rainfall, diversity of vegetation, diversity of
topographic features, land area and temperature. The variables that characterize
habitability are called suitability index variables (sivs). Habitats with a high HSI tend to
have a large number of species, while those with a low HSI have a small number of
species. Habitats with a high HSI have a low species immigration rate because they are
already nearly saturated with species. Therefore, high HSI habitats are more static in their
species distribution than low HSI habitats. By the same token, high HSI habitats have a
high emigration rate; the large number of species on high HSI islands has many
opportunities to emigrate to neighboring habitats. Habitats with a low HSI have a high
species immigration rate because of their sparse populations. However if a habitat’s HSI
remains low, then the species that reside there will tend to go extinct, which will further
open the way for additional immigration. Due to this, low HSI habitats are more dynamic
in their species distribution than high HSI habitats. A good solution is analogous to an
island with a high HSI, and a poor solution represents an island with a low HSI. High
HSI solutions resist change more than low HSI solutions [4].
The goals of this paper is to study BBO and apply it on fractal image compression
to reduce the compression time (encode time) and improve the picture quality. First give
a general presentation of the new optimization method called BBO. This is done by first
studying natural biogeography, and then generalizing it to obtain a general-purpose
optimization algorithm. Section 2 reviews the ideas and mathematics of fractal image
compression section 3 discusses biogeography and how BBO can be used to formulate a
general optimization algorithm, section 4 discuss algorithm which is applied over fractal
image compression to improve its efficiency( i.e. decrease encode time), section 5 and
section 6 discusses experimental result calculated over image. In this first color image is
split into three matrixes R, G, B and then compression is applied over individual matrix.
These matrixes are then merged together after compression to reconstruct the compressed
image.
2. FRACTAL IMAGE COMPRESSION
Fractal image compression is based on the local self-similarity property in a nature
images. The fundamental idea is coming from the Partitioned Iterated Function System
(PIFS). Suppose the original gray level image f is of size m * m. Let the range pool R be
defined as the set of all non-overlapping blocks of size n*n of the image f, which makes
up (m/n)2 blocks. For obeying the Contractive Mapping Fixed-Point Theorem, the
domain block must exceed the range block in length. Let the domain pool D be defined as
the set of all possible blocks of size 2n * 2n of the image f, which makes up (m-2n + 1)2
blocks. For m is 256 and n is 8, the range pool R is composed of (256/8) *(256/8) =1024
blocks of size 8 *8 and the domain pool D is composed of (256-16 + 1) *(256-16 + 1) =
58081 blocks of size 16*16. For each range block v from the R, the fractal affine
transformation is constructed by searching all of the domain blocks in the D to find the
most similar one and the parameters representing the fractal affine transformation will
form the fractal compression code for v. To execute the similarity measure between range
block and domain block, the size of the domain block must be first sub-sampled to 8*8
International Journal of Computer Engineering and Technology (IJCET), ISSN 0976 – 6367(Print),
ISSN 0976 – 6375(Online) Volume 3, Issue 2, July- September (2012), © IAEME
38
such that its size is the same as the range block v. Let u denote a sub-sampled domain
block. The similarity of two image blocks u and v of size n*n is measured by mean
square error (MSE) defined as
∑∑−
=
−
=
−=
1
0
21
0
),(),(1 n
j
m
i
jiKjiImn
MSE (1)
The primary tool used in describing images with iterated function systems is the affine
transformation. This transformation is used to express relations between different parts of
an image. Affine transformations can be described as combinations of rotations, scaling
and translations of coordinate axes in n-dimensional space [9]. For example, in two
dimensions a point (x, y) on the image can be represented by (xn, yn) under affine
transformation.
+
=
=
f
e
y
x
dc
ba
y
xww 11 )(x
(2)
In this paper wavelet based fractal image compression is used to compute result
over the color image. Wavelet transform is used to decompose the original image to
various frequency subbands in which the attributes can be extracted from the wavelet
coefficients belonging to different sub-bands. The distribution of wavelet coefficients
can be used in context-based multi scale classification of document image [9].
3. BIOGEOGRAPHY
Figure 1 illustrates a model of species abundance in a single habitat [4]. The immigration
rate λ and the emigration rate µ are functions of the number of species in the habitat.
Consider the immigration curve. The maximum possible immigration rate to the habitat is
I, which occurs when there are zero species in the habitat. As the number of species
increases, the habitat becomes more crowded, fewer species are able to successfully
survive immigration to the habitat, and the immigration rate decreases.
The largest possible number of species that the habitat can support is Smax at which point
the immigration rate becomes zero. Now consider the emigration curve. If there are no
species in the habitat then the emigration rate must be zero. As the number of species
increases, the habitat becomes more crowded, more species are able to leave the habitat
to explore other possible residences, and the emigration rate increases. The maximum
emigration rate is E, which occurs when the habitat contains the largest number of
species that it can support. The equilibrium number of species is S0 at which point the
immigration and emigration rates are equal. However, there may be occasional
excursions from S0 due to temporal effects. Positive excursions could be due to a sudden
spurt of immigration (caused, perhaps, by an unusually large piece of flotsam arriving
from a neighboring habitat), or a sudden burst of speciation (like a miniature Cambrian
explosion). Negative excursions from could be due to disease, the introduction of an
especially ravenous predator, or some other natural catastrophe [4].

International Journal of Computer Engineering and Technology (IJCET), ISSN 0976 – 6367(Print),
ISSN 0976 – 6375(Online) Volume 3, Issue 2, July- September (2012), © IAEME
39
Figure 1 Species model of a single habitat based on [4]
3.1 Biogeography-based optimization (BBO) in this section, we discuss how the
biogeography theory can be applied to optimization problems with a discrete domain.
3.1.1 Migration
Suppose that we have a problem and a population of candidate solutions that can be
represented as vectors of integers. Each integer in the solution vector is considered to be
an SIV. Further suppose that we have some way of assessing the goodness of the
solutions. Those solutions that are good are considered to be habitats with a high HSI,
and those that are poor are considered to be habitats with a low HSI. HSI is analogous to
“fitness” in other population-based optimization algorithms (GAs, for example). High
HSI solutions represent habitats with many species, and low HSI solutions represent
habitats with few species. We assume that each solution (habitat) has an identical species
curve (with E=1 for simplicity), but the S value represented by the solution depends on
its HSI. in Figure 2 represents a low HSI solution, while S2 represents a high HSI
solution. S1 in Fig. 2 represents a habitat with only a few species, while S2 represents a
habitat with many species. The immigration rate λ1 for S1 will, therefore, be higher than
the immigration rate λ2 for S2 . The emigration rate µ 1 for S1 will be lower than the
emigration rate µ 2 for S2. We use the emigration and immigration rates of each solution
to probabilistically share information between habitats [4]. With
Figure 2 Illustration of two candidate solutions to some problem. S1 is a relatively poor
solution, while S2 is a relatively good solution[4].
Probability Pmod, we modify each solution based on other solutions. If a given solution is
selected to be modified, then we use its immigration rate λ to probabilistically decide
whether or not to modify each suitability index variable (SIV) in that solution.
3.1.2 Mutation
Cataclysmic events can drastically change the HSI of a natural habitat. They can also
cause a species count to differ from its equilibrium value (unusually large flotsam
arriving from a neighboring habitat, disease, natural catastrophes, etc.). A habitat’s HSI
can, therefore, change suddenly due to apparently random events. We model this in BBO
as SIV mutation, and we use species count probabilities to determine mutation rates. By
looking at the equilibrium point on the species curve of Fig. 2, we see that low species
International Journal of Computer Engineering and Technology (IJCET), ISSN 0976 – 6367(Print),
ISSN 0976 – 6375(Online) Volume 3, Issue 2, July- September (2012), © IAEME
40
counts and high species counts both have relatively low probabilities. Medium species
counts have high probabilities because they are near the equilibrium point.
Each population member has an associated probability, which indicates the likelihood
that it was expected a priori to exist as a solution to the given problem. Very high HSI
solutions and very low HSI solutions are equally improbable. Medium HSI solutions are
relatively probable. If a given solution has a low probability , then it is surprising that it
exists as a solution. It is, therefore, likely to mutate to some other solution. Conversely, a
solution with a high probability is less likely to mutate to a different solution.
3.2 Differences among BBO and Other Population-Based Optimization Algorithms
In this section, we point out some of the characteristic of BBO. First, we note that
although BBO is a population-based optimization algorithm it does not involve
reproduction or the generation of “children.” This clearly distinguishes it from
reproductive strategies such as GAs and evolutionary strategies.
BBO also clearly differs from ACO, because ACO generates a new set of
solutions with each iteration. BBO, on the other hand, maintains its set of solutions from
one iteration to the next, relying on migration to probabilistically settle in those solutions.
BBO has the most in ordinary with strategies such as PSO and DE. In those
approaches, solutions are maintained from one iteration to the next, but each solution is
able to learn from its neighbors and adapt itself as the algorithm progresses. PSO
represents each solution as a point in space, and represents the change over time of each
solution as a velocity vector. However, PSO solutions do not change directly; it is rather
their velocities that change, and this indirectly results in position (solution) changes. DE
changes its solutions directly, but changes in a particular DE solution are based on
differences between other DE solutions. Also, DE is not biologically motivated. BBO can
be contrasted with PSO and DE in that BBO solutions are changed directly via migration
from other solutions (islands). That is, BBO solutions directly share their attributes
(SIVs) with other solutions. It is these differences between BBO and other population-
based optimization methods that may prove to be its strength.
4. IMPLEMENTATION OF BBO ALGORITHM IN FRACTAL IMAGE
COMPRESSION
The BBO algorithm in fractal image compression can be formally applied as:
1. Split color image into three different matrixes R, G, B and repeat step 2 to 11 on
all these three matrix.
2. Reduce the search space for FIC.
3. The classifier partition all of blocks in domain pool and range pool into 2 classes
according to wavelet coefficient.
4. Initialize the BBO parameters. This means deriving a method of mapping
problem solutions to SIVs and habitats
5. Initialize a random set of habitats, each habitat corresponding to a potential
solution
6. Define HSI, Smax, immigration rate (λ) and emigration rate (µ).
International Journal of Computer Engineering and Technology (IJCET), ISSN 0976 – 6367(Print),
ISSN 0976 – 6375(Online) Volume 3, Issue 2, July- September (2012), © IAEME
41
7. Calculate MSE in each iteration of every range block and domain block.
8. Calculate probability of each domain block and range block based on MSE of
each domain and range block.
9. If probability come above a predefined value immigrate that block in high HSI,
else in low HSI.
10. Goto step 6 for next iteration.
11. If no domain is left then:
(i) Stop the process.
Else:
(i) Go to step 6.
End
Pi(n + 1) = Pi(n) = r1(PHSIi− Xi) + r2((Hhsi) − Xi) (3)
Xi(n + 1) = Xi(n) + Pi(n + 1). (4)
The ith block is represented as Xj = (x1, x2, x3, · · · , xj). The best probability of each
domain and range block is recorded and represented as PHSIi = (PHSI1, PHSI2, PHSI3, ·
· · , PHSIj). The probability of the block among all the values in that iteration is
considered as Hhsi. The probability for block ‘i’ is represented as Pj = (P1, P2, P3, · · · ,
Pj). Based on equation (3), (4) species(in our case domains) can migrate to habitat having
high HSI. This is done on the basis of high probability value.[13]
5. IMPLEMENTATION OF BBO BASED FIC
In a typical run of the BBO, for every range block, an initial population of random values
which correspond to the top left coordinates of domain blocks and its isometry are
generated. Each random value corresponds to the location of the domain block and is
used to evaluate the domain block and find the MSE. The domain block with the
minimum MSE in the BBO is identified and its coordinates are noted as PHSI values.
Each Block keeps track of its coordinates in habitat which are associated with the fittest
solution it has achieved so far. The Pi domain of each block at iteration is updated
according to Eq.(5) .
Pi=�������� < ���� − 1�� ���� − 1���ℎ������� (5)
Where fi(n) is the Mean Squared error (MSE) value between the range block and selected
domain block in the present iteration. The probability and block value are updated using
Eq. (3) and Eq. (4) in each iteration. The application of BBO involves repeatedly
performing two steps: [13]
• The calculation of the objective function (MSE) for each of the block in the current
population ‘i’.
• The biogeography optimization then updates the block coordinates based on Eq. (3) and
Eq. (4)

International Journal of Computer Engineering and Technology (IJCET), ISSN 0976 – 6367(Print),
ISSN 0976 – 6375(Online) Volume 3, Issue 2, July- September (2012), © IAEME
42
6. SYSTEM INVESTIGATED
In this paper a RGB image of 512 x 512 x 3 size with true colors (16.7 million colors) is
considered. A Range block of size 4×4 and Domain blocks of size 8×8 are considered.
The domain blocks are mapped to the range block by affine transformations and the best
domain block is selected. The PSNR considered in this work are given by:
Table 1 Image compressed with FIC (wavelet Based)
Image Encode
Time(sec)
Compressed
image size(bytes)
Compression
Ratio
PSNR(db)
Jellyfish (775702 bytes) 473.469 22519 34.44 7.74
Tulips (620888 bytes) 377.819 38100 16.25 8.8979
Table 2 Image compressed with BBO applied on FIC
Image Encode
Time(sec)
Compressed Image
size(bytes)
Compression
Ratio
PSNR(db)
Jellyfish (775702
bytes)
179.753 30764 25.21 7.758
Tulips (620888
bytes)
185.439 40078 15.49 8.8843
7. RESULTS AND DISCUSSIONS
This work is carried out in MATLAB 7.10.0 version on Pentium-dual core processor with
1.86 GHz and 1 GB RAM and the original image is classical 512 x 512 x 3 jellyfish
(775702 bytes) and tulips (620888 bytes) image coded with 8 bits per pixel for individual
matrix of RGB (total 24 bits per pixel for all three matrix). A random population of
points is generated and each point is evaluated in the following manner. The point is
converted into its corresponding binary value and the first 16 bits are utilized to locate the
top left corner of domain block and next 3 bits are used to find the isometry to be applied
to the selected domain block. Table 2 shows the comparison of BBO based FIC with the
traditional exhaustive search method. It can be seen from the table that the visual quality
and encoding time with the proposed technique has been improved as compared with the
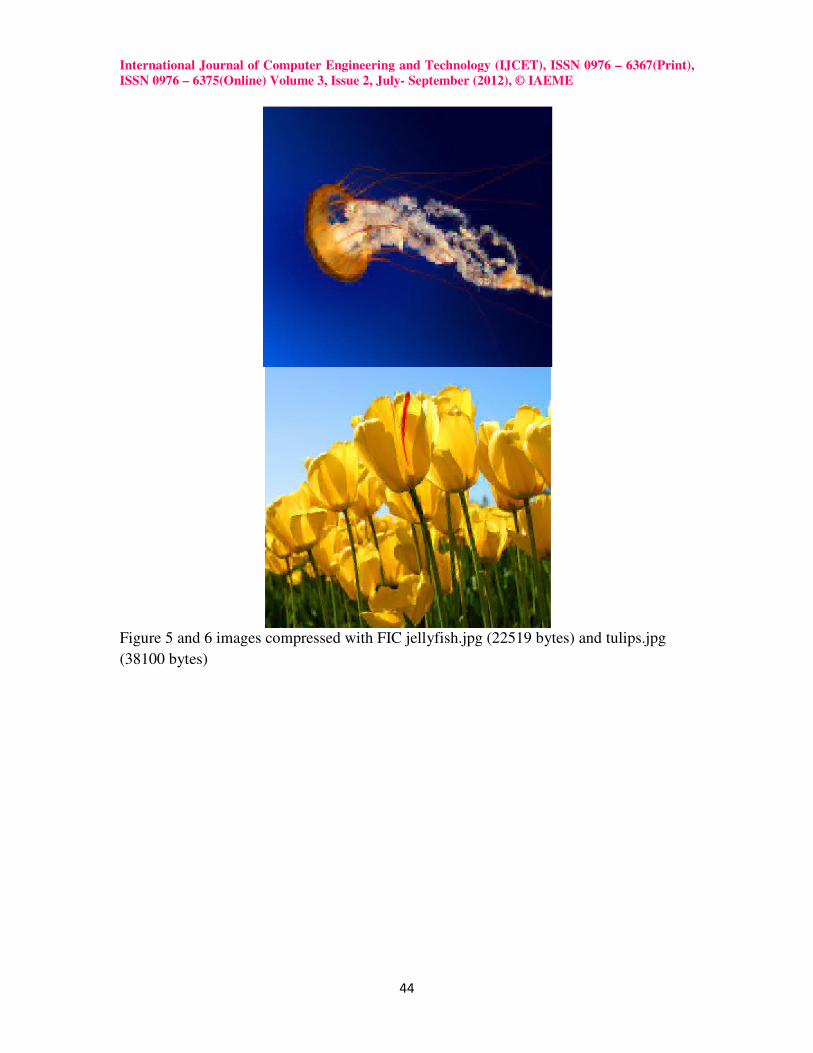
traditional method. Figure 7 and Figure 8 show the reconstructed images using FIC with
BBO as search algorithm along with the original images of jellyfish (775702 bytes) and
tulips (620888 bytes) after 32 iterations.
Note down visual quality of image is much better with BBO as compared to FIC.
Also encode time decreases after applying BBO optimization. Image compressed with
BBO optimization is much close to original one, but with FIC distortion comes in the
image. As mention in table size of images increases in case of bbo optimization over
fractal image compression but encode time tends to reduce and visual quality of image
increases and overall performance of proposed technique is better than fractal image
compression. PSNR values of proposed technique is also high than older technique.
International Journal of Computer Engineering and Technology (IJCET), ISSN 0976 – 6367(Print),
ISSN 0976 – 6375(Online) Volume 3, Issue 2, July- September (2012), © IAEME
43
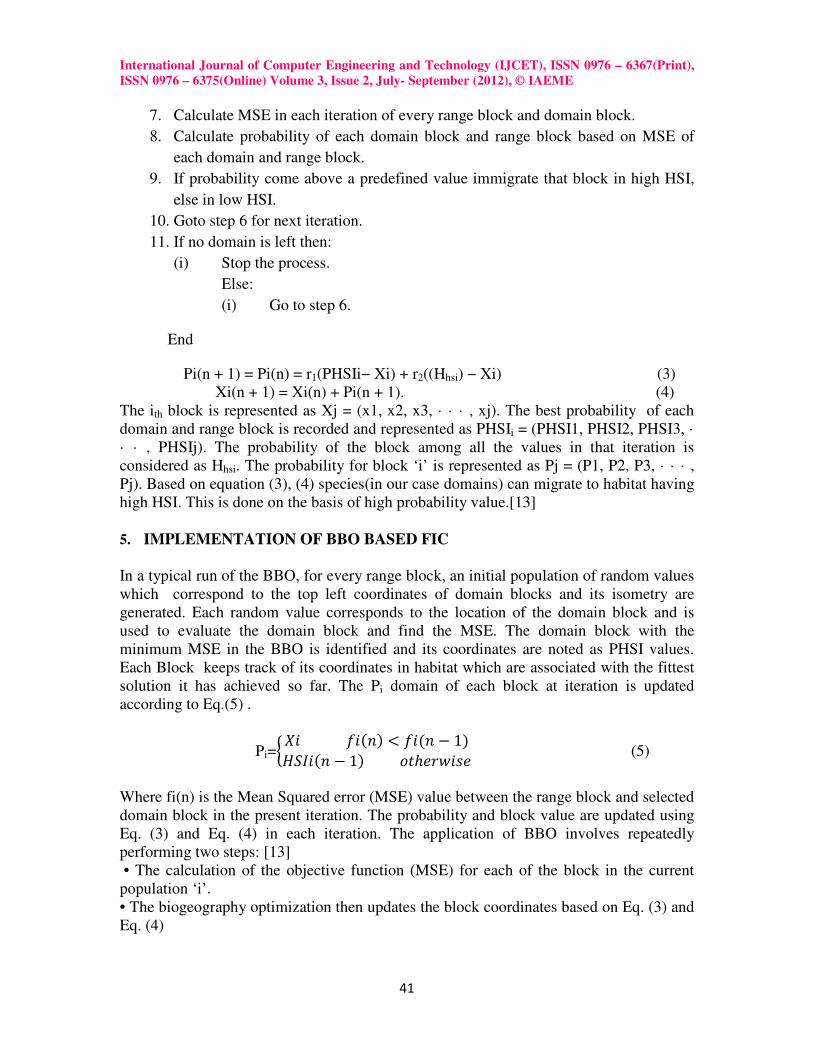
Figure 3 and 4 original images Jellyfish.jpg (775702 bytes) and tulips.jpg (620888 bytes)
International Journal of Computer Engineering and Technology (IJCET), ISSN 0976 – 6367(Print),
ISSN 0976 – 6375(Online) Volume 3, Issue 2, July- September (2012), © IAEME
44
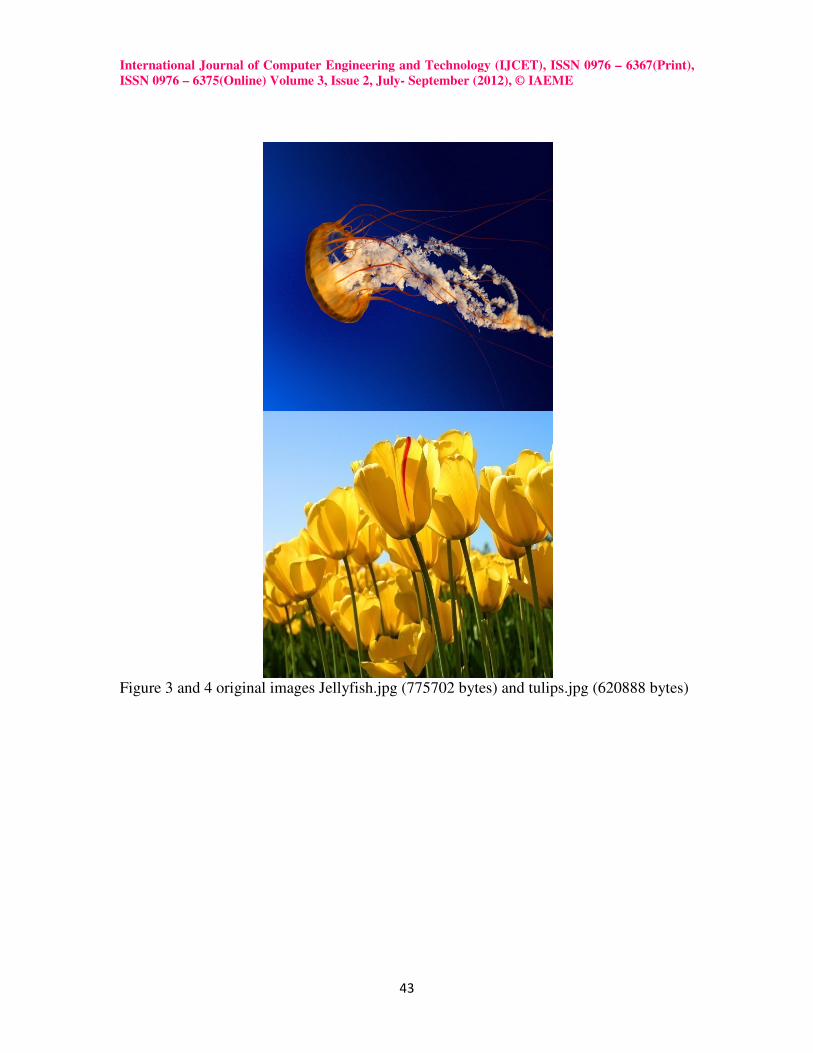
Figure 5 and 6 images compressed with FIC jellyfish.jpg (22519 bytes) and tulips.jpg
(38100 bytes)
International Journal of Computer Engineering and Technology (IJCET), ISSN 0976 – 6367(Print),
ISSN 0976 – 6375(Online) Volume 3, Issue 2, July- September (2012), © IAEME
45
Figure 7 and 8 compressed images after applying BBO on FIC jellyfish.jpg (30764 bytes)
and tulips.jpg (40078 bytes)
8. REFERENCES
[1]. M. Barnsley, A. Jacquin, “Application of recurrent iterated function system to
images,” Proceedings of SPIE 3, vol. 1001, pp.122–131, 1998.
[2]. D. Simon, “A Probabilistic Analysis of a Simplified Biogeography-Based
Optimization Algorithm,” IEEE, pp. 1604-1616, 2009.
[3]. J. Li and R. M. Gray, “Context-based multiscale classification of document
images using wavelet coefficient distributions,” IEEE Transactions on Image
Processing, vol. 9, pp. 1604-1616, 2000.
[4]. D. Simon, “Biogeography-Based Optimization,” IEEE, vol. 12, no. 6, pp. 702-
713, 2008.
[5]. Y. Chakrapani, K. Soundararajan, “Implementation of fractal image compression
employing particle swarm optimization,” World Journal of Modelling and
Simulation, vol. 6, no. 1, pp. 40-46, 2010.
[6]. Jacquin, “Fractal image coding a review,” IEEE, vol. 81, pp. 212–223, 1993.
[7]. Wallace, “The Geographical Distribution of Animals,” Boston, MA: Adamant
Media Corporation, pp. 201-206, 2005.
[8]. Jacquin, “Image coding based on a fractal theory of iterated contractive image
transformation,” IEEE Transactions on Image Processing, pp.18–30, 1992.
[9]. Y. Lin and W. Chen, “Fast Search Strategies for Fractal Image Compression,”
JISE 28, pp. 17-30, 2012.
[10]. Y. Chakrapani, K. Soundararajan, “Implementation of fractal image compression
employing artificial neural Networks,” World Journal of Modelling and Simulation,
pp. 287-295, 2008.
[11]. K.Uma, P.Geetha palanisamy and P.Geetha poornachandran”Comparison of
Image Compression using GA, ACO and PSO techniques “, IEEE-International
International Journal of Computer Engineering and Technology (IJCET), ISSN 0976 – 6367(Print),
ISSN 0976 – 6375(Online) Volume 3, Issue 2, July- September (2012), © IAEME
46
Conference on Recent Trends in Information Technology, ICRTIT pp. 815-820,
2011.
[12]. Y. Yancong , P. Ruidong “Fast Fractal Coding Based on Dividing of Image”,
IEEE, pp.1-4 , 2010 .
[13]. C. M. Kung, W. S. Yang, C. C. Ku, C. Y. Wang “Fast Fractal Image Compression
Base on Block Property” International Conference on Advanced Computer Theory
and Engineering IEEE,pp:477-481,2008.
[14]. T. K. Truong, J. H. Jeng, I. S. Reed, P. C. Lee, and A. Li. “A fast encoding
algorithm for fractal image compression using the dct inner poduct”. IEEE
Transaction on Images Processing, 9(4):529–535, 2000.
[15]. T. K. Truong, C. M. Kung, J. H. Jeng, and M. L. Hsieh. “Fast fractal image
compression using spatial correlation”. Chaos Solitons Fractals, 22(5): pp: 1071–
1076, 2004.
[16]. E. Zhao, D. Liu “Fractal Image Compression Methods: A Review” Proceedings of
the Third International Conference on Information Technology and Applications
(ICITA’05) IEEE, pp: 756 - 759 vol.1, 2005.