Embed Size (px)
Citation preview
Transportation Cost and Benefit Analysis II – Barrier Effect Victoria Transport Policy Institute (www.vtpi.org)
24 April 2018 www.vtpi.org/tca/tca0513.pdf
Page 5.13-1
5.13 Barrier Effect This chapter describes the barrier effect (also called “severance”), which refers to delays that
roads and traffic cause to nonmotorized travel. This indicates the benefits that can result from
strategies that improve mobility for nonmotorized travel by reducing traffic impacts.
5.13.1 Chapter Index 5.13 Barrier Effect ................................................................................................... 1
5.13.2 Definitions ............................................................................................ 1 5.13.3 Discussion ........................................................................................... 1
Evaluating Non-motorized Mobility ....................................................... 4 Quantifying the Barrier Effect ............................................................... 6
5.13.4 Estimates ............................................................................................. 6 Summary Table .................................................................................... 6
5.13.5 Variability ............................................................................................. 9 5.13.6 Equity and Efficiency Issues ................................................................ 9 5.13.7 Conclusions ......................................................................................... 9
Automobile Cost Range ....................................................................... 9 5.13.8 Information Resources ......................................................................... 11
5.13.2 Definitions The Barrier Effect (also called severance) refers to delays, discomfort and lack of access
that vehicle traffic imposes on nonmotorized modes (pedestrians and cyclists).1 Severance
usually focuses on the impacts of new or wider highways, while the barrier effect takes
into account the impacts of vehicle traffic.
5.13.3 Discussion Roads and vehicle traffic tend to create a barrier to pedestrian and cyclist travel.2 The
barrier effect is equivalent to traffic congestion costs (most traffic congestion cost
estimates exclude impacts on nonmotorized travel). In addition to travel delays, vehicle
traffic imposes crash risk and pollution on nonmotorized travelers. The barrier effect
reflects a degradation of the nonmotorized travel environment. This is not to imply that
drivers intentionally cause harm, but rather that such impacts are unavoidable when,
heavy and hard vehicles traveling at high speed share space with vulnerable road users.
Although it could be argued that impacts are symmetrical, because nonmotorized modes
cause traffic delays to motorists, pedestrians and cyclists impose minimal risk, noise and
dust on motorists so the costs they bear are inherently greater then the costs they impose.3
1 J. Stanley and A. Rattray (1978), “Social Severance” in The Valuation of Social Cost, Allen and Unwin;
B.S. Hoyle and R.D. Knowles, Modern Transport Geography, Belhaven Press (London), p. 62. 2 J.M. Clark and B.J. Hutton (1991), The Appraisal of Community Severance, Transport Research
Laboratory (www.trl.co.uk), Report #135; Julian Hine and John Russel (1993), “Traffic Barriers and
Pedestrian Crossing Behavior,” Journal of Transport Geography, Vol. 1 No. 4,
(www.elsevier.com/locate/jtrangeo), pp. 230-239. 3 Damages resulting when motorists hit pedestrians and cyclists are considered accident costs, but not costs
people bear when they change route or mode to avoid crash risk. The barrier effect represents such costs.
Transportation Cost and Benefit Analysis II – Barrier Effect Victoria Transport Policy Institute (www.vtpi.org)
24 April 2018 www.vtpi.org/tca/tca0513.pdf
Page 5.13-2
Barrier effect costs be illustrated by considering the impacts wider roads and increased
motor vehicle traffic volumes and speeds have on local travel activity. Until the 1950s
walking and bicycling was common for daily travel, but since then many of these trips
shifted to automobile travel. Although many factors contribute to these shifts, an
important one is the increased difficutly of walking and cycling on local streets due to
higher traffic volumes and speeds. Narrow streets with lower traffic speeds and volumes
are easy to cross, wider streets with higher traffic volumes and speeds cause discomfort
and delay. For example, a survey of Austin, Texas residents investigated factors affecting
their food store transport decisions.4 The study found that busy roads create a significant
barrier to walking which often causes shoppers to drive to nearby stores:
One important factor besides distance is the quality of the connection between residential
and commercial areas, in particular whether residents would have to cross a busy arterial to
reach the store. In the focus groups, residents of several neighborhoods stressed this
problem. Travis Heights residents, for example, like to walk to the shops in their
neighborhood but cited South Congress Avenue as a dangerous obstacle and expressed their
desire for more pedestrian-friendly elements such as a traffic island or a longer light at the
crosswalks. Said one Travis Heights resident: “Getting back and forth across Congress is not
a simple thing any more.” Old West Austin residents, who do not have to cross an arterial to
reach most local businesses but would have to cross an arterial to reach Whole Foods and
several other popular destinations, expressed similar concerns: “You can’t go across Lamar
[Blvd.]. You can’t go across Sixth Street. I mean you can, but you’re taking your life into
your hands.” One resident’s strategy for crossing the street is to “run like hell.”
Whether or not pedestrians feel comfortable walking around local shopping areas is also an
important factor, suggesting that design and pedestrian infrastructure can influence the
choice to walk. One Cherrywood resident said, “When you get there, there’s no place for
pedestrians. It’s all parking lot.” Another added, “I usually drive. The fact is, the only real
concentration of retail we have is an automobile-oriented shopping center.” A third
complained that “there’s no back way into it.” Zilker residents said they don’t feel safe
walking along their commercial arterial, despite the sidewalk: “You’ve got the car speeding
past on one side … and if you want to get to the business, you have to walk through the
parking lot where the cars are milling around.” The unattractive environment also makes a
difference: “Lamar Boulevard is just an ugly street and it’s really busy…it’s really hard for
people to walk,” one Zilker resident said.
The barrier effect imposes indirect costs by reducing the viability of nonmotorized travel,
which reduces accessibility for non-drivers, and causes shifts from nonmotorized to
motorized travel which increases external costs such as traffic congestion, parking costs
and pollution emissions. It tends to be inequitable because disadvantaged populations
tend to bear a disproportionate share of this cost since they often depend heavily on
nonmotorized transport. Studies indicate that many people would like to walk and bicycle
more but are constrained, in part, by heavy roadway traffic.5
4 Susan L. Handy and Kelly J. Clifton (2001), “Local Shopping as a Strategy for Reducing Automobile
Travel,” Transportation, Vol. 28, No. 4, pp. 317–346. 5 Robert Davis (1992), Death in the Streets, Leading Edge (North Yorkshire), 1992, p. 156.
Transportation Cost and Benefit Analysis II – Barrier Effect Victoria Transport Policy Institute (www.vtpi.org)
24 April 2018 www.vtpi.org/tca/tca0513.pdf
Page 5.13-3
Jacobsen, Racioppi and Rutter examine the impact of vehicle traffic on levels of walking
and bicycling based on a comprehensive review of medical, public health, city planning,
public administration and traffic engineering technical literature.6 The analysis indicates
that real and perceived danger and discomfort imposed by motor vehicle traffic
discourages walking and bicycling activity. Observed evidence indicates an inverse
correlation between traffic volumes and speeds and levels of walking and cycling. They
conclude that reducing vehicle traffic speed and volume are likely to improve public
health by increasing walking and bicycling activity.
These negative health impacts are measured by Jerrett, et al., who found a significant
positive association between traffic density on neighboorhood streets and children’s
chances of being overweight in Southern California communities.7 The impacts were
particularly large for increased traffic exposure within 150 meters of children’s homes.
The effect translates into about a 5% increase in the average body mass index (BMI)
attained at age 18. The researchers hypothesize two factors that explain this positive
association between traffic density and increased body weight. First and most directly,
traffic around the home may creates a sense of danger among parents and children that
inhibits walking and cycling activity. Second, traffic air pollution reduces lung function
and increases asthma, which reduces children’s exercise capacity.
These impacts tend to be particularly large for the following groups and under the
following circumstances:
For children, who are less able to judge suitable crossing gaps.
For people with physical disabilities, including most seniors, who tend to be slower
crossing streets.
Where major, high speed highways cross a village or town.
In developing countries, where a major portion of residents rely on walking and
cycling, and pedestrian accommodation (sidewalks, crosswalks, traffic speed
enforcement) is often lacking.8
6 Peter L. Jacobsen, F. Racioppi and H. Rutter (2009), “Who Owns The Roads? How Motorised Traffic
Discourages Walking And Bicycling,” Injury Prevention, Vol. 15, Issue 6, pp. 369-373;
http://injuryprevention.bmj.com/content/15/6/369.full.html. 7 Michael Jerret, et al. (2010), “Automobile Traffic Around The Home And Attained Body Mass Index: A
Longitudinal Cohort Study Of Children Aged 10–18 Years,” Preventive Medicine, Vol. 50, Supplement 1,
January 2010, pp. S50-S58; at www.activelivingresearch.org/resourcesearch/journalspecialissues. 8 Anurag Behar (2011) India’s Road-Building Rage: Symbolic Of Where India Is Going Is The Way We’ve
Been Building Roads To Prosperity Which Are Also Our Roads To Perdition, Other Sphere, Live Mint
(www.livemint.com); at www.livemint.com/2011/01/26204034/India8217s-roadbuilding-ra.html?h=B#.
Transportation Cost and Benefit Analysis II – Barrier Effect Victoria Transport Policy Institute (www.vtpi.org)
24 April 2018 www.vtpi.org/tca/tca0513.pdf
Page 5.13-4
Evaluating Non-motorized Mobility
Various tools can be used to evaluate nonmotorized conditions. The Pedestrian Road
Safety Audit Guidelines and Prompt Lists describes methods for evaluating walkability.9
Multi-modal Level-of-Service (LOS) standards quantify walking and cycling
conditions.10
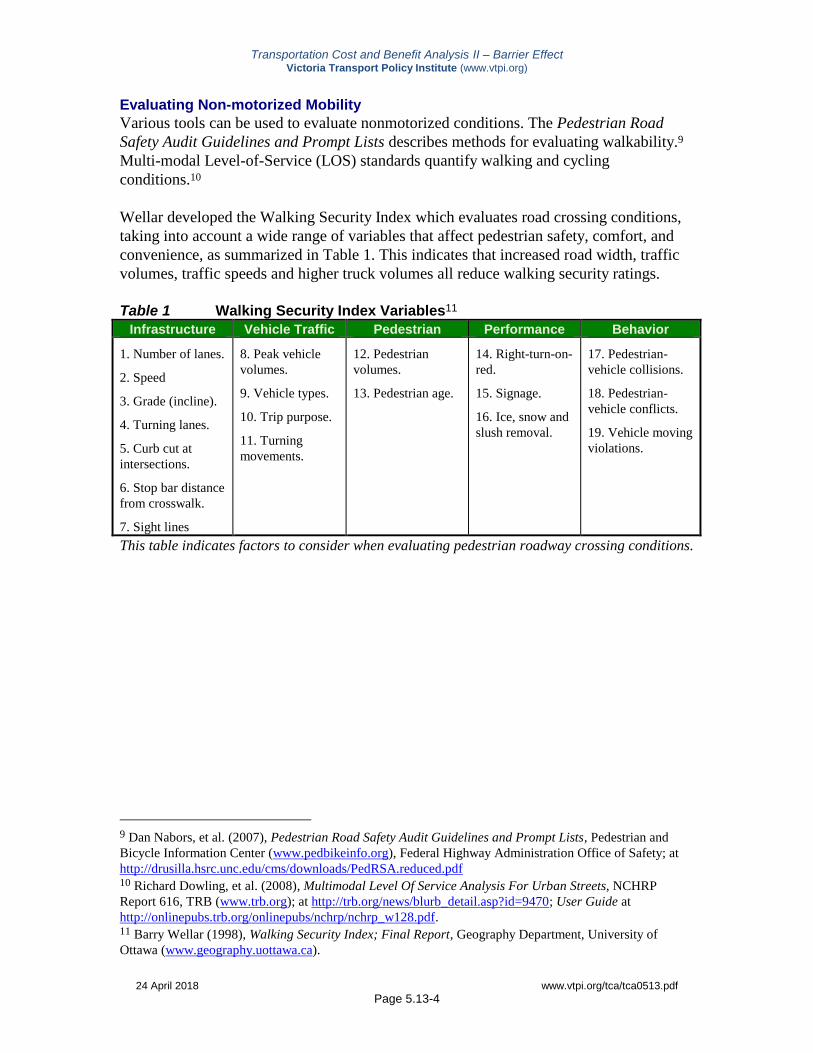
Wellar developed the Walking Security Index which evaluates road crossing conditions,
taking into account a wide range of variables that affect pedestrian safety, comfort, and
convenience, as summarized in Table 1. This indicates that increased road width, traffic
volumes, traffic speeds and higher truck volumes all reduce walking security ratings.
Table 1 Walking Security Index Variables11
Infrastructure Vehicle Traffic Pedestrian Performance Behavior
1. Number of lanes.
2. Speed
3. Grade (incline).
4. Turning lanes.
5. Curb cut at
intersections.
6. Stop bar distance
from crosswalk.
7. Sight lines
8. Peak vehicle
volumes.
9. Vehicle types.
10. Trip purpose.
11. Turning
movements.
12. Pedestrian
volumes.
13. Pedestrian age.
14. Right-turn-on-
red.
15. Signage.
16. Ice, snow and
slush removal.
17. Pedestrian-
vehicle collisions.
18. Pedestrian-
vehicle conflicts.
19. Vehicle moving
violations.
This table indicates factors to consider when evaluating pedestrian roadway crossing conditions.
9 Dan Nabors, et al. (2007), Pedestrian Road Safety Audit Guidelines and Prompt Lists, Pedestrian and
Bicycle Information Center (www.pedbikeinfo.org), Federal Highway Administration Office of Safety; at
http://drusilla.hsrc.unc.edu/cms/downloads/PedRSA.reduced.pdf 10 Richard Dowling, et al. (2008), Multimodal Level Of Service Analysis For Urban Streets, NCHRP
Report 616, TRB (www.trb.org); at http://trb.org/news/blurb_detail.asp?id=9470; User Guide at
http://onlinepubs.trb.org/onlinepubs/nchrp/nchrp_w128.pdf. 11 Barry Wellar (1998), Walking Security Index; Final Report, Geography Department, University of
Ottawa (www.geography.uottawa.ca).
Transportation Cost and Benefit Analysis II – Barrier Effect Victoria Transport Policy Institute (www.vtpi.org)
24 April 2018 www.vtpi.org/tca/tca0513.pdf
Page 5.13-5
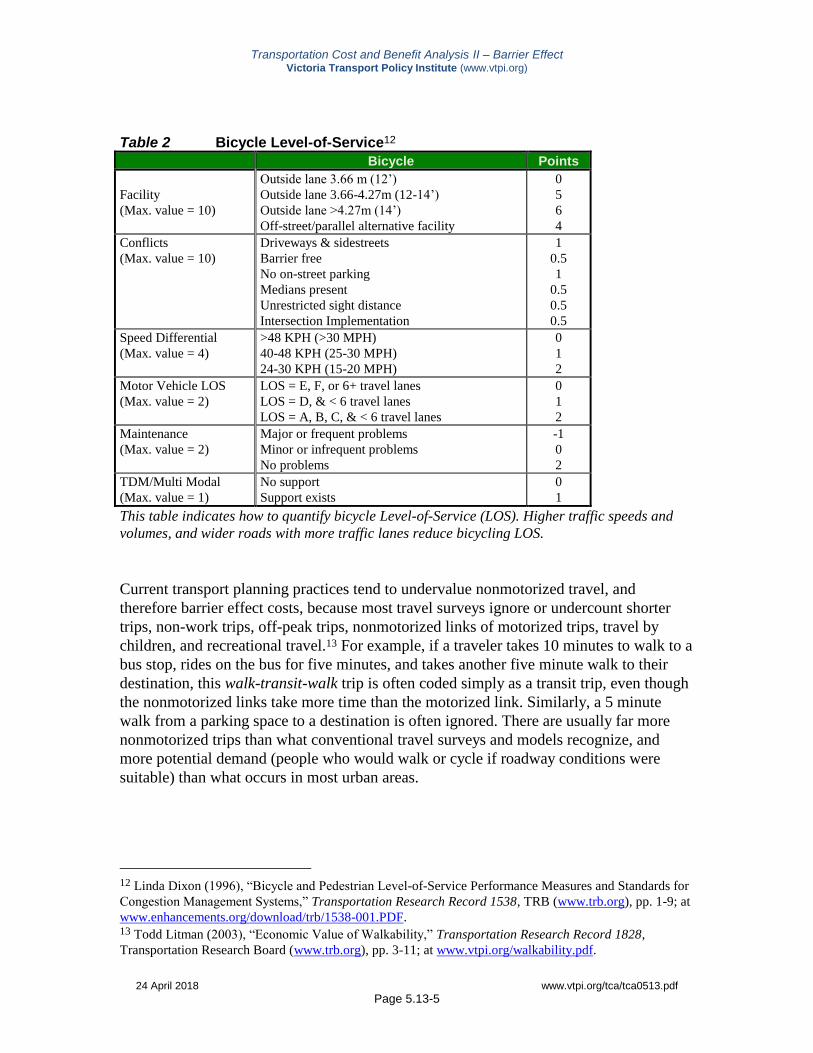
Table 2 Bicycle Level-of-Service12
Bicycle Points
Facility
(Max. value = 10)
Outside lane 3.66 m (12’)
Outside lane 3.66-4.27m (12-14’)
Outside lane >4.27m (14’)
Off-street/parallel alternative facility
0
5
6
4
Conflicts
(Max. value = 10)
Driveways & sidestreets
Barrier free
No on-street parking
Medians present
Unrestricted sight distance
Intersection Implementation
1
0.5
1
0.5
0.5
0.5
Speed Differential
(Max. value = 4)
>48 KPH (>30 MPH)
40-48 KPH (25-30 MPH)
24-30 KPH (15-20 MPH)
0
1
2
Motor Vehicle LOS
(Max. value = 2)
LOS = E, F, or 6+ travel lanes
LOS = D, & < 6 travel lanes
LOS = A, B, C, & < 6 travel lanes
0
1
2
Maintenance
(Max. value = 2)
Major or frequent problems
Minor or infrequent problems
No problems
-1
0
2
TDM/Multi Modal
(Max. value = 1)
No support
Support exists
0
1
This table indicates how to quantify bicycle Level-of-Service (LOS). Higher traffic speeds and
volumes, and wider roads with more traffic lanes reduce bicycling LOS.
Current transport planning practices tend to undervalue nonmotorized travel, and
therefore barrier effect costs, because most travel surveys ignore or undercount shorter
trips, non-work trips, off-peak trips, nonmotorized links of motorized trips, travel by
children, and recreational travel.13 For example, if a traveler takes 10 minutes to walk to a
bus stop, rides on the bus for five minutes, and takes another five minute walk to their
destination, this walk-transit-walk trip is often coded simply as a transit trip, even though
the nonmotorized links take more time than the motorized link. Similarly, a 5 minute
walk from a parking space to a destination is often ignored. There are usually far more
nonmotorized trips than what conventional travel surveys and models recognize, and
more potential demand (people who would walk or cycle if roadway conditions were
suitable) than what occurs in most urban areas.
12 Linda Dixon (1996), “Bicycle and Pedestrian Level-of-Service Performance Measures and Standards for
Congestion Management Systems,” Transportation Research Record 1538, TRB (www.trb.org), pp. 1-9; at
www.enhancements.org/download/trb/1538-001.PDF. 13 Todd Litman (2003), “Economic Value of Walkability,” Transportation Research Record 1828,
Transportation Research Board (www.trb.org), pp. 3-11; at www.vtpi.org/walkability.pdf.
Transportation Cost and Benefit Analysis II – Barrier Effect Victoria Transport Policy Institute (www.vtpi.org)
24 April 2018 www.vtpi.org/tca/tca0513.pdf
Page 5.13-6
Quantifying the Barrier Effect
Both the Swedish14 and the Danish15 roadway investment evaluation models incorporate
methods for quantifying barrier effects on specific lengths of roadway. Both involve two
steps. First, a barrier factor is calculated based on traffic volumes, average speed, share of
trucks, number of pedestrian crossings, and length of roadway under study. Second, the
demand for crossing is calculated (assuming no barrier existed) based on residential,
commercial, recreation, and municipal destinations within walking and bicycling distance
of the road. The Swedish model also adjusts the number of anticipated trips based on
whether the road is in a city, suburb, or rural area, and the ages of local residents.
Russell and Hine recommend that the barrier effect be evaluated using “crossing ratios,”
which is the number of pedestrians who cross a road as a portion of total pedestrian flow
along that segment.16 This crossing ratio is considered inversely related to the barrier
effect, although other factors may also influence such behavior. The barrier effect also
applies to animals.17
5.13.4 Estimates All values are in U.S. dollars unless otherwise indicated.
Summary Table
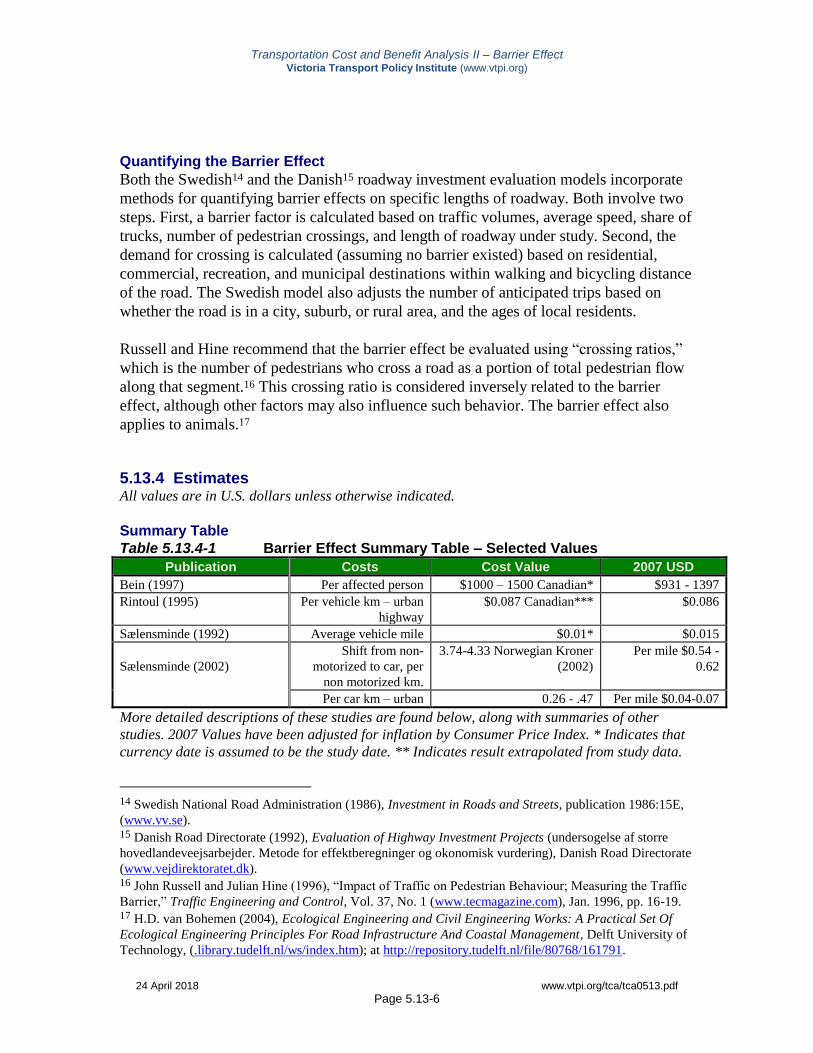
Table 5.13.4-1 Barrier Effect Summary Table – Selected Values
Publication Costs Cost Value 2007 USD
Bein (1997) Per affected person $1000 – 1500 Canadian* $931 - 1397
Rintoul (1995) Per vehicle km – urban
highway
$0.087 Canadian*** $0.086
Sælensminde (1992) Average vehicle mile $0.01* $0.015
Sælensminde (2002)
Shift from non-
motorized to car, per
non motorized km.
3.74-4.33 Norwegian Kroner
(2002)
Per mile $0.54 -
0.62
Per car km – urban 0.26 - .47 Per mile $0.04-0.07
More detailed descriptions of these studies are found below, along with summaries of other
studies. 2007 Values have been adjusted for inflation by Consumer Price Index. * Indicates that
currency date is assumed to be the study date. ** Indicates result extrapolated from study data.
14 Swedish National Road Administration (1986), Investment in Roads and Streets, publication 1986:15E,
(www.vv.se). 15 Danish Road Directorate (1992), Evaluation of Highway Investment Projects (undersogelse af storre
hovedlandeveejsarbejder. Metode for effektberegninger og okonomisk vurdering), Danish Road Directorate
(www.vejdirektoratet.dk). 16 John Russell and Julian Hine (1996), “Impact of Traffic on Pedestrian Behaviour; Measuring the Traffic
Barrier,” Traffic Engineering and Control, Vol. 37, No. 1 (www.tecmagazine.com), Jan. 1996, pp. 16-19. 17 H.D. van Bohemen (2004), Ecological Engineering and Civil Engineering Works: A Practical Set Of
Ecological Engineering Principles For Road Infrastructure And Coastal Management, Delft University of
Technology, (.library.tudelft.nl/ws/index.htm); at http://repository.tudelft.nl/file/80768/161791.
Transportation Cost and Benefit Analysis II – Barrier Effect Victoria Transport Policy Institute (www.vtpi.org)
24 April 2018 www.vtpi.org/tca/tca0513.pdf
Page 5.13-7
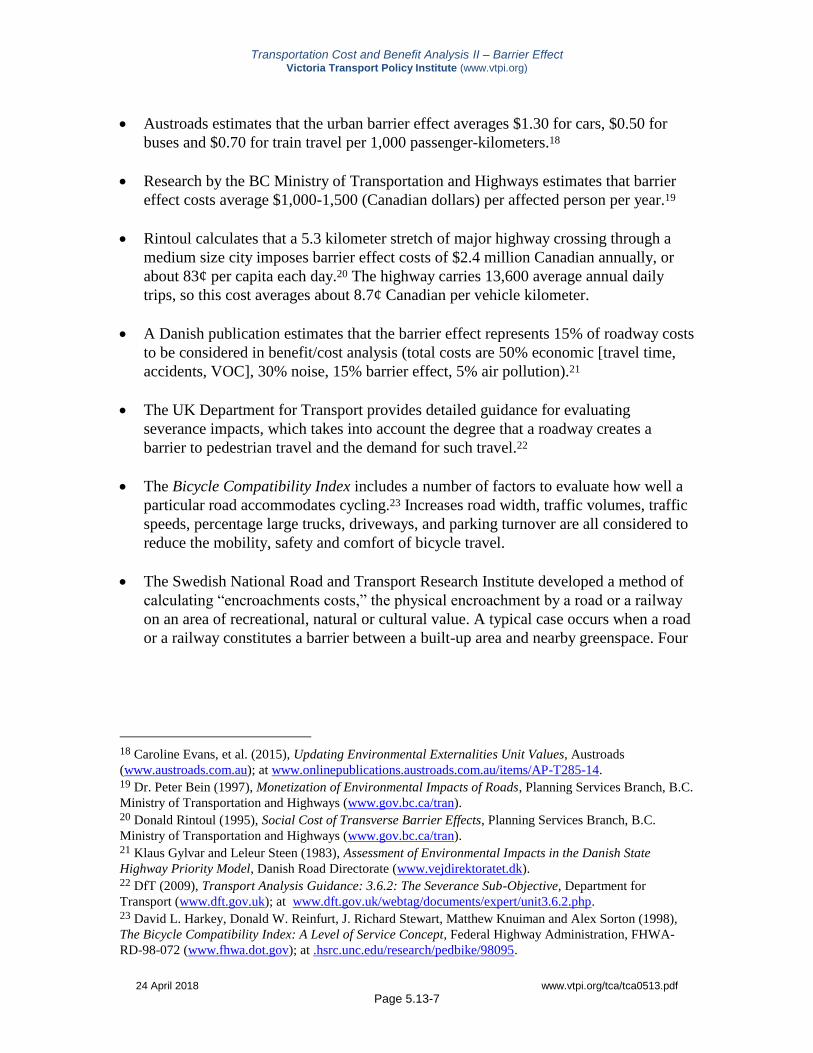
Austroads estimates that the urban barrier effect averages $1.30 for cars, $0.50 for
buses and $0.70 for train travel per 1,000 passenger-kilometers.18
Research by the BC Ministry of Transportation and Highways estimates that barrier
effect costs average $1,000-1,500 (Canadian dollars) per affected person per year.19
Rintoul calculates that a 5.3 kilometer stretch of major highway crossing through a
medium size city imposes barrier effect costs of $2.4 million Canadian annually, or
about 83¢ per capita each day.20 The highway carries 13,600 average annual daily
trips, so this cost averages about 8.7¢ Canadian per vehicle kilometer.
A Danish publication estimates that the barrier effect represents 15% of roadway costs
to be considered in benefit/cost analysis (total costs are 50% economic [travel time,
accidents, VOC], 30% noise, 15% barrier effect, 5% air pollution).21
The UK Department for Transport provides detailed guidance for evaluating
severance impacts, which takes into account the degree that a roadway creates a
barrier to pedestrian travel and the demand for such travel.22
The Bicycle Compatibility Index includes a number of factors to evaluate how well a
particular road accommodates cycling.23 Increases road width, traffic volumes, traffic
speeds, percentage large trucks, driveways, and parking turnover are all considered to
reduce the mobility, safety and comfort of bicycle travel.
The Swedish National Road and Transport Research Institute developed a method of
calculating “encroachments costs,” the physical encroachment by a road or a railway
on an area of recreational, natural or cultural value. A typical case occurs when a road
or a railway constitutes a barrier between a built-up area and nearby greenspace. Four
18 Caroline Evans, et al. (2015), Updating Environmental Externalities Unit Values, Austroads
(www.austroads.com.au); at www.onlinepublications.austroads.com.au/items/AP-T285-14. 19 Dr. Peter Bein (1997), Monetization of Environmental Impacts of Roads, Planning Services Branch, B.C.
Ministry of Transportation and Highways (www.gov.bc.ca/tran). 20 Donald Rintoul (1995), Social Cost of Transverse Barrier Effects, Planning Services Branch, B.C.
Ministry of Transportation and Highways (www.gov.bc.ca/tran). 21 Klaus Gylvar and Leleur Steen (1983), Assessment of Environmental Impacts in the Danish State
Highway Priority Model, Danish Road Directorate (www.vejdirektoratet.dk). 22 DfT (2009), Transport Analysis Guidance: 3.6.2: The Severance Sub-Objective, Department for
Transport (www.dft.gov.uk); at www.dft.gov.uk/webtag/documents/expert/unit3.6.2.php. 23 David L. Harkey, Donald W. Reinfurt, J. Richard Stewart, Matthew Knuiman and Alex Sorton (1998),
The Bicycle Compatibility Index: A Level of Service Concept, Federal Highway Administration, FHWA-
RD-98-072 (www.fhwa.dot.gov); at .hsrc.unc.edu/research/pedbike/98095.
Transportation Cost and Benefit Analysis II – Barrier Effect Victoria Transport Policy Institute (www.vtpi.org)
24 April 2018 www.vtpi.org/tca/tca0513.pdf
Page 5.13-8
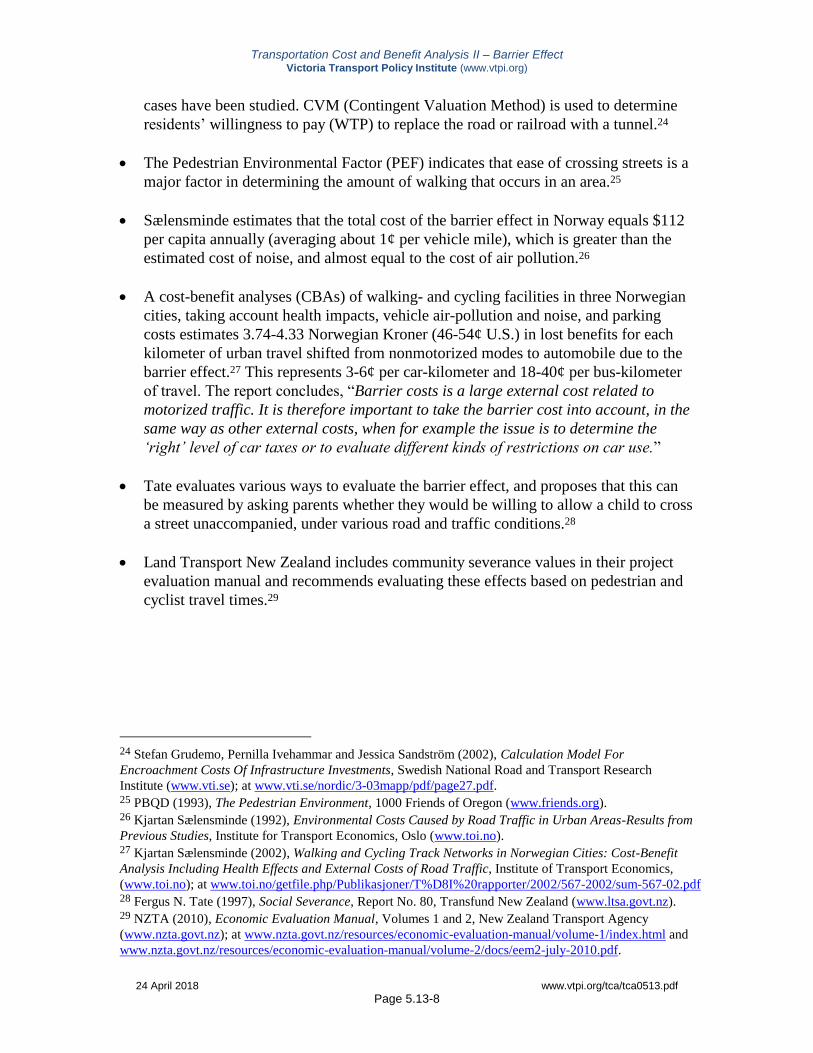
cases have been studied. CVM (Contingent Valuation Method) is used to determine
residents’ willingness to pay (WTP) to replace the road or railroad with a tunnel.24
The Pedestrian Environmental Factor (PEF) indicates that ease of crossing streets is a
major factor in determining the amount of walking that occurs in an area.25
Sælensminde estimates that the total cost of the barrier effect in Norway equals $112
per capita annually (averaging about 1¢ per vehicle mile), which is greater than the
estimated cost of noise, and almost equal to the cost of air pollution.26
A cost-benefit analyses (CBAs) of walking- and cycling facilities in three Norwegian
cities, taking account health impacts, vehicle air-pollution and noise, and parking
costs estimates 3.74-4.33 Norwegian Kroner (46-54¢ U.S.) in lost benefits for each
kilometer of urban travel shifted from nonmotorized modes to automobile due to the
barrier effect.27 This represents 3-6¢ per car-kilometer and 18-40¢ per bus-kilometer
of travel. The report concludes, “Barrier costs is a large external cost related to
motorized traffic. It is therefore important to take the barrier cost into account, in the
same way as other external costs, when for example the issue is to determine the
‘right’ level of car taxes or to evaluate different kinds of restrictions on car use.”
Tate evaluates various ways to evaluate the barrier effect, and proposes that this can
be measured by asking parents whether they would be willing to allow a child to cross
a street unaccompanied, under various road and traffic conditions.28
Land Transport New Zealand includes community severance values in their project
evaluation manual and recommends evaluating these effects based on pedestrian and
cyclist travel times.29
24 Stefan Grudemo, Pernilla Ivehammar and Jessica Sandström (2002), Calculation Model For
Encroachment Costs Of Infrastructure Investments, Swedish National Road and Transport Research
Institute (www.vti.se); at www.vti.se/nordic/3-03mapp/pdf/page27.pdf. 25 PBQD (1993), The Pedestrian Environment, 1000 Friends of Oregon (www.friends.org). 26 Kjartan Sælensminde (1992), Environmental Costs Caused by Road Traffic in Urban Areas-Results from
Previous Studies, Institute for Transport Economics, Oslo (www.toi.no). 27 Kjartan Sælensminde (2002), Walking and Cycling Track Networks in Norwegian Cities: Cost-Benefit
Analysis Including Health Effects and External Costs of Road Traffic, Institute of Transport Economics,
(www.toi.no); at www.toi.no/getfile.php/Publikasjoner/T%D8I%20rapporter/2002/567-2002/sum-567-02.pdf 28 Fergus N. Tate (1997), Social Severance, Report No. 80, Transfund New Zealand (www.ltsa.govt.nz). 29 NZTA (2010), Economic Evaluation Manual, Volumes 1 and 2, New Zealand Transport Agency
(www.nzta.govt.nz); at www.nzta.govt.nz/resources/economic-evaluation-manual/volume-1/index.html and
www.nzta.govt.nz/resources/economic-evaluation-manual/volume-2/docs/eem2-july-2010.pdf.
Transportation Cost and Benefit Analysis II – Barrier Effect Victoria Transport Policy Institute (www.vtpi.org)
24 April 2018 www.vtpi.org/tca/tca0513.pdf
Page 5.13-9
5.13.5 Variability As described in the Scandinavian literature, this impact depends on road width, traffic
speeds and volumes, and the quality of pedestrian facilities.
5.13.6 Equity and Efficiency Issues The barrier effect is an external cost, and so tends to be inequitable and inefficient. Since
disadvantaged populations often depend heavily on nonmotorized transport, and so bear a
disproportionate share of this cost, it tends to be vertically inequitable.
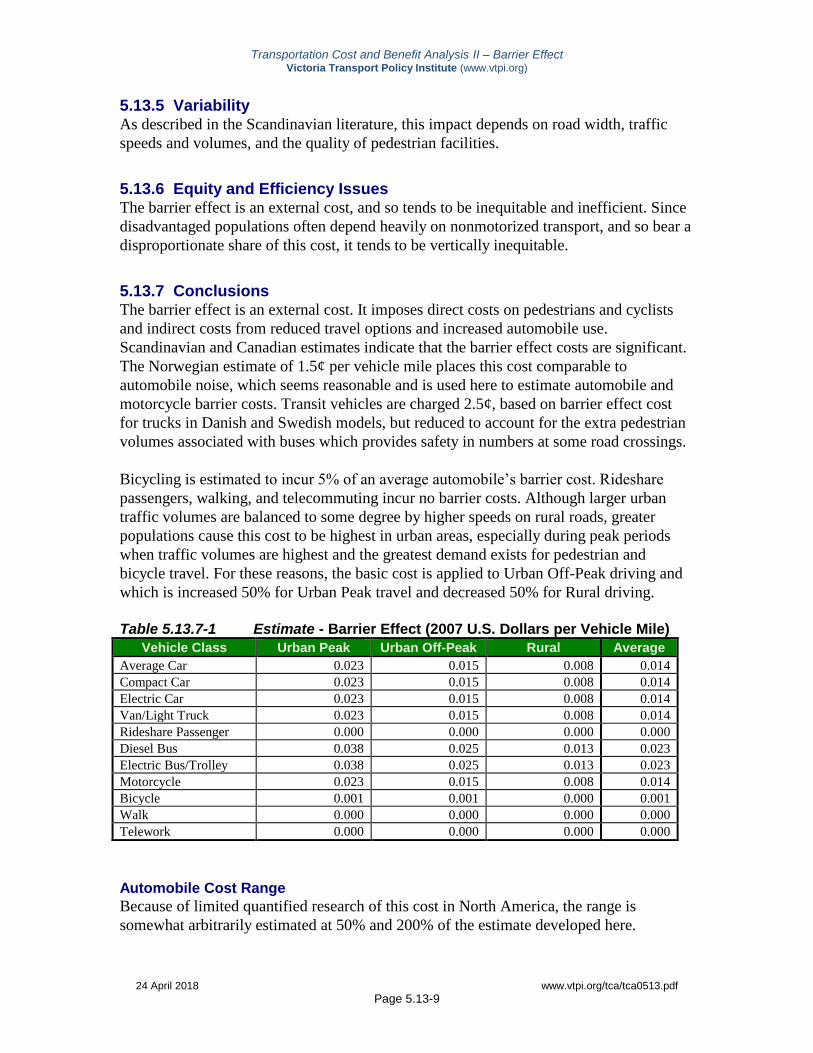
5.13.7 Conclusions The barrier effect is an external cost. It imposes direct costs on pedestrians and cyclists
and indirect costs from reduced travel options and increased automobile use.
Scandinavian and Canadian estimates indicate that the barrier effect costs are significant.
The Norwegian estimate of 1.5¢ per vehicle mile places this cost comparable to
automobile noise, which seems reasonable and is used here to estimate automobile and
motorcycle barrier costs. Transit vehicles are charged 2.5¢, based on barrier effect cost
for trucks in Danish and Swedish models, but reduced to account for the extra pedestrian
volumes associated with buses which provides safety in numbers at some road crossings.
Bicycling is estimated to incur 5% of an average automobile’s barrier cost. Rideshare
passengers, walking, and telecommuting incur no barrier costs. Although larger urban
traffic volumes are balanced to some degree by higher speeds on rural roads, greater
populations cause this cost to be highest in urban areas, especially during peak periods
when traffic volumes are highest and the greatest demand exists for pedestrian and
bicycle travel. For these reasons, the basic cost is applied to Urban Off-Peak driving and
which is increased 50% for Urban Peak travel and decreased 50% for Rural driving.
Table 5.13.7-1 Estimate - Barrier Effect (2007 U.S. Dollars per Vehicle Mile)
Vehicle Class Urban Peak Urban Off-Peak Rural Average
Average Car 0.023 0.015 0.008 0.014
Compact Car 0.023 0.015 0.008 0.014
Electric Car 0.023 0.015 0.008 0.014
Van/Light Truck 0.023 0.015 0.008 0.014
Rideshare Passenger 0.000 0.000 0.000 0.000
Diesel Bus 0.038 0.025 0.013 0.023
Electric Bus/Trolley 0.038 0.025 0.013 0.023
Motorcycle 0.023 0.015 0.008 0.014
Bicycle 0.001 0.001 0.000 0.001
Walk 0.000 0.000 0.000 0.000
Telework 0.000 0.000 0.000 0.000
Automobile Cost Range
Because of limited quantified research of this cost in North America, the range is
somewhat arbitrarily estimated at 50% and 200% of the estimate developed here.
Transportation Cost and Benefit Analysis II – Barrier Effect Victoria Transport Policy Institute (www.vtpi.org)
24 April 2018 www.vtpi.org/tca/tca0513.pdf
Page 5.13-10
Minimum Maximum
$0.008 $0.03
Transportation Cost and Benefit Analysis II – Barrier Effect Victoria Transport Policy Institute (www.vtpi.org)
24 April 2018 www.vtpi.org/tca/tca0513.pdf
Page 5.13-11
5.13.8 Information Resources Resources listed below provide information on evaluating impacts on nonmotorized travel.
Steve Abley, Dave Smith and Stacy Rendall (2014), Australasian Pedestrian Crossing Facility
Selection Web Tool, Austroads (www.austroads.com.au); at http://bit.ly/austroads_pedestrian.
Paulo Rui Anciaes, et al. (2016), “Urban Transport And Community Severance: Linking
Research and Policy to Link People and Places,” Journal of Transport & Health, Vol. 3, Issue 3,
pp. Pages 268–277 (http://dx.doi.org/10.1016/j.jth.2016.07.006); at
www.sciencedirect.com/science/article/pii/S2214140516302171.
A. Bradbury, P. Tomlinson and A. Millington (2007), Understanding The Evolution Of
Community Severance And Its Consequences On Mobility And Social Cohesion Over The Past
Century, delivered at the Association for European Transport Conference, Leeuwenhorst, The
Netherlands, 17-19 October, 2007; at http://etcproceedings.org/paper/understanding-the-
evolution-of-community-severance-and-its-consequences-on-mob.
Dan Burden (2003), Level of Quality (LOQ) Guidelines, Walkable Communities
(www.walkable.org/library.htm); at www.tjpdc.org/transportation/walkability.asp.
DfT (2009), Transport Analysis Guidance: 3.6.2: The Severance Sub-Objective, Department for
Transport (www.dft.gov.uk); at www.dft.gov.uk/webtag/documents/expert/unit3.6.2.php.
Richard Dowling, et al. (2008), Multimodal Level Of Service Analysis For Urban Streets,
NCHRP Report 616, Transportation Research Board (www.trb.org); at
http://trb.org/news/blurb_detail.asp?id=9470; User Guide at
http://onlinepubs.trb.org/onlinepubs/nchrp/nchrp_w128.pdf.
Caroline Evans, et al. (2015), Updating Environmental Externalities Unit Values, Austroads
(www.austroads.com.au); at www.onlinepublications.austroads.com.au/items/AP-T285-14.
FDOT (2002), Quality/Level of Service Handbook, Florida Department of Transportation
(www.dot.state.fl.us); at www.dot.state.fl.us/Planning/systems/sm/los/los_sw2.htm
Stefan Grudemo, Pernilla Ivehammar and Jessica Sandström (2002), Calculation Model For
Encroachment Costs Of Infrastructure Investments, Swedish National Road and Transport
Research Institute (www.vti.se); at www.vti.se/nordic/3-03mapp/pdf/page27.pdf.
Peter L. Jacobsen, F. Racioppi and H. Rutter (2009), “Who Owns The Roads? How Motorised
Traffic Discourages Walking And Bicycling,” Injury Prevention, Vol. 15, Issue 6, pp. 369-373;
http://injuryprevention.bmj.com/content/15/6/369.full.html.
Todd Litman (1994), “Bicycling and Transportation Demand Management,” Transportation
Research Record 1441, TRB (www.trb.org), pp. 134-140; now titled, Quantifying the Benefits of
Non-Motorized Transport for Achieving TDM Objectives; at www.vtpi.org/nmt-tdm.pdf.
Anne Vernez Moudon (2001-2007), Targeting Pedestrian Infrastructure Improvements,
Washington State DOT, WA-RD 519.1 (www.wsdot.wa.gov); at
www.wsdot.wa.gov/Research/Reports/500/519.1.htm.
Transportation Cost and Benefit Analysis II – Barrier Effect Victoria Transport Policy Institute (www.vtpi.org)
24 April 2018 www.vtpi.org/tca/tca0513.pdf
Page 5.13-12
Dan Nabors, et al. (2007), Pedestrian Road Safety Audit Guidelines and Prompt Lists, Pedestrian
and Bicycle Information Center (www.pedbikeinfo.org), Federal Highway Administration Office
of Safety; at http://drusilla.hsrc.unc.edu/cms/downloads/PedRSA.reduced.pdf
NZTA (2010), Economic Evaluation Manual, Volumes 1 and 2, New Zealand Transport Agency
(www.nzta.govt.nz); at www.nzta.govt.nz/resources/economic-evaluation-manual/volume-
1/index.html and www.nzta.govt.nz/resources/economic-evaluation-manual/volume-
2/docs/eem2-july-2010.pdf.
Pedestrian and Bicycle Information Center (www.bicyclinginfo.org), NHTSA, and USDOT.
Kjartan Sælensminde (2002), Walking and Cycling Track Networks in Norwegian Cities: Cost-
Benefit Analysis Including Health Effects and External Costs of Road Traffic, Institute of
Transport Economics, Oslo (www.toi.no); at
www.toi.no/getfile.php/Publikasjoner/T%D8I%20rapporter/2002/567-2002/sum-567-02.pdf.
Street Mobility Project (www.ucl.ac.uk/street-mobility). This Toolkit developed by the
University College London identifies ways to evaluate community walkability and identify ways
to reduce pedestrian barriers.
Peter Swift, Dan Painter and Matthew Goldstein (2006), Residential Street Typology and Injury
Accident Frequency, Swift and Associates, originally presented at the Congress for the New
Urbanism, 1997; at http://massengale.typepad.com/venustas/files/SwiftSafetyStudy.pdf.
Miles Tight (2005), TRAN5230 Reading List, Transport Studies Reading Lists, University of
Leeds Library (http://library.leeds.ac.uk/); at
http://lib5.leeds.ac.uk/rlists/transprt/tran5230.htm#Severance.
Alejandro Tirachini (2011), Effects Of Pedestrian Mobility Barriers On Walking Distance,
Institute of Transport and Logistics Studies (www.sydney.edu.au).
H.D. van Bohemen (2004), Ecological Engineering and Civil Engineering Works: A Practical
Set Of Ecological Engineering Principles For Road Infrastructure And Coastal Management,
Delft University of Technology, Road and Hydraulic Engineering Institute, Directorate-General
of Public Works and Water Management, Delft, Netherlands
(www.library.tudelft.nl/ws/index.htm); at http://repository.tudelft.nl/file/80768/161791