Embed Size (px)
Citation preview

JM Financial LimitedCorporate Identity Number : L67120MH1986PLC038784Regd. Office: 7th Floor, Cnergy, Appasaheb Marathe Marg, Prabhadevi, Mumbai 400 025.
T: +91 22 6630 3030 F: +91 22 6630 3223 www.jmfl.com
June 9, 2020
BSE Limited Department of Corporate Services 1st Floor, New Trading Ring Rotunda Building, P J Towers Dalal Street, Fort, Mumbai 400001
Security Code: 523405
National Stock Exchange of India Limited Exchange Plaza Plot No.C-1, G Block Bandra-Kurla Complex Bandra (East) Mumbai – 400 051
Symbol: JMFINANCIL
Dear Sirs,
Sub: Corporate Presentation
Pursuant to Regulation 30 of the Securities and Exchange Board of India (Listing Obligations and Disclosure Requirements) Regulations, 2015, read with Para A of Part A of Schedule III thereto, we wish to inform you that a copy of the corporate presentation is being uploaded on the website of the Company viz., www.jmfl.com for information of the investors. A copy of the said presentation is attached.
We request you to disseminate the above presentation on your website.
Thank you.
Yours faithfully, for JM Financial Limited
Prashant Choksi Group Head – Compliance, Legal & Company Secretary
Encl: a/a

JM Financial Limited
Corporate Presentation
Disclaimer
2
This presentation has been prepared for general information purposes in respect of JM Financial Limited (“Company”, together with its subsidiaries and associate the “Group”) only, without regard to any specific
objectives, suitability, financial situations and needs of any particular person and does not constitute any recommendation or form part of any offer or invitation, directly or indirectly, in any manner, or inducement to
sell or issue, or any solicitation of any offer to purchase or subscribe for, any securities of the Company in any jurisdiction, nor shall it or any part of it or the fact of its distribution form the basis of, or be relied on in
connection with, any contract or commitment therefor. This presentation does not solicit any action based on the material contained herein. Nothing in this presentation is intended by the Group to be construed as
legal, accounting or tax advice.
This presentation has not been approved and will not or may not be reviewed or approved by any statutory or regulatory authority in India.
This presentation contains certain forward-looking statements relating to the business, financial performance, strategy and results of the Group and/ or the industry in which it operates. Forward-looking statements
are statements concerning future circumstances and results, and any other statements that are not historical facts, sometimes identified by the words including, without limitation “believes”, “expects”, “predicts”,
“intends”, “projects”, “plans”, “estimates”, “aims”, “foresees”, “anticipates”, “targets”, and similar expressions. The forward-looking statements, including those cited from third party sources, contained in this
presentation are based on numerous assumptions and are uncertain and subject to risks. A multitude of factors including, but not limited to, changes in demand, competition and technology, can cause actual
events, performance or results to differ significantly from any anticipated development. Neither the Group nor its affiliates or advisors or representatives nor any of its or their parent or subsidiary undertakings or
any such person's officers or employees guarantees that the assumptions underlying such forward-looking statements are free from errors nor does either accept any responsibility for the future accuracy of the
forward-looking statements contained in this presentation or the actual occurrence of the forecasted developments. Forward-looking statements speak only as of the date of this presentation and are not guarantees
of future performance. As a result, the Group expressly disclaims any obligation or undertaking to release any update or revisions to any forward-looking statements in this presentation as a result of any change in
expectations or any change in events, conditions, assumptions or circumstances on which these forward looking statements are based. Given these uncertainties and other factors, viewers of this presentation are
cautioned not to place undue reliance on these forward-looking statements. Certain numbers in these presentations and materials have been subject to routine rounding off and accordingly figures shown as total in
tables and diagrams may not be an arithmetic aggregation of the figures that precede them.
The information contained in these presentations and materials are only current as of the dates specified herein and have not been independently verified. None of the Group, its directors, promoter or affiliates, nor
any of its or their respective employees, advisers or representatives or any other person accepts any responsibility or liability whatsoever, whether arising in tort, contract or otherwise, for any errors, omissions or
inaccuracies in such information or opinions or for any loss, cost or damage suffered or incurred howsoever arising, directly or indirectly, from any use of this presentation or its contents or otherwise in connection
with this presentation, and makes no representation or warranty, express or implied, for the contents of this presentation including its accuracy, fairness, completeness or verification or for any other statement
made or purported to be made by any of them, or on behalf of them, and nothing in this presentation or at this presentation shall be relied upon as a promise or representation in this respect, whether as to the past
or the future. Past performance is not a guide for future performance. The information contained in this presentation is current, and if not stated otherwise, made as of the date of this presentation. The Group
undertakes no obligation to update or revise any information in this presentation as a result of new information, future events or otherwise. Any person/ party intending to provide finance/ invest in the shares/
businesses of the Group shall do so after seeking their own professional advice and after carrying out their own due diligence procedure to ensure that they are making an informed decision.
This presentation is not a prospectus, a statement in lieu of a prospectus, an offering circular, an advertisement or an offer document under the Companies Act, 2013, and the rules made thereunder, as amended,
the Securities and Exchange Board of India (Issue of Capital and Disclosure Requirements) Regulations, 2018, as amended, or any other applicable law in India.
This presentation is strictly confidential and may not be copied or disseminated, reproduced, re-circulated, re-distributed, published or advertised in any media, website or otherwise, in whole or in part, and in any
manner or for any purpose. Any unauthorized use, disclosure or public dissemination of information contained herein is prohibited. No person is authorized to give any information or to make any representation not
contained in or inconsistent with this presentation and if given or made, such information or representation must not be relied upon as having been authorized by any person. Failure to comply with this restriction
may constitute a violation of the applicable securities laws. Neither this document nor any part or copy of it may be distributed, directly or indirectly, in the United States. The distribution of this document in certain
jurisdictions may be restricted by law and persons in to whose possession this presentation comes should inform themselves about and observe any such restrictions. Accordingly, any persons in possession of the
aforesaid should inform themselves about and observe any such restrictions. By reviewing this presentation, you agree to be bound by the foregoing limitations. You further represent and agree that you are located
outside the United States and you are permitted under the laws of your jurisdiction to receive this presentation. You may not repackage or sell the presentation. Information contained in a presentation hosted or
promoted by the Group is provided “as is” without warranty of any kind, either expressed or implied, including any warranty of fitness for a particular purpose. This presentation is not an offer to sell or a solicitation
of any offer to buy the securities of the Company in the United States or in any other jurisdiction where such offer or sale would be unlawful. Securities may not be offered, sold, resold, pledged, delivered,
distributed or transferred, directly or indirectly, in to or within the United States absent registration under the United States Securities Act of 1933, as amended (the “Securities Act”), except pursuant to an
exemption from, or in a transaction not subject to, the registration requirements of the Securities Act and in compliance with any applicable securities laws of any state or other jurisdiction of the United States. The
Company’s securities have not been and will not be registered under the Securities Act.
By accessing this presentation, you accept this disclaimer and any claims arising out of or in connection with this presentation shall be governed by the laws of India and only the courts in Mumbai, India, and no
other courts shall have jurisdiction over the same.
All financial numbers of FY18 are based on and/or derived from the comparatives included in the audited financial statements for FY 19

Presentation Overview
3
Group Overview1
Business Overview3
Financial Performance4
Key Strengths and Strategies2
Board of Directors5

Group Overview
Section 1
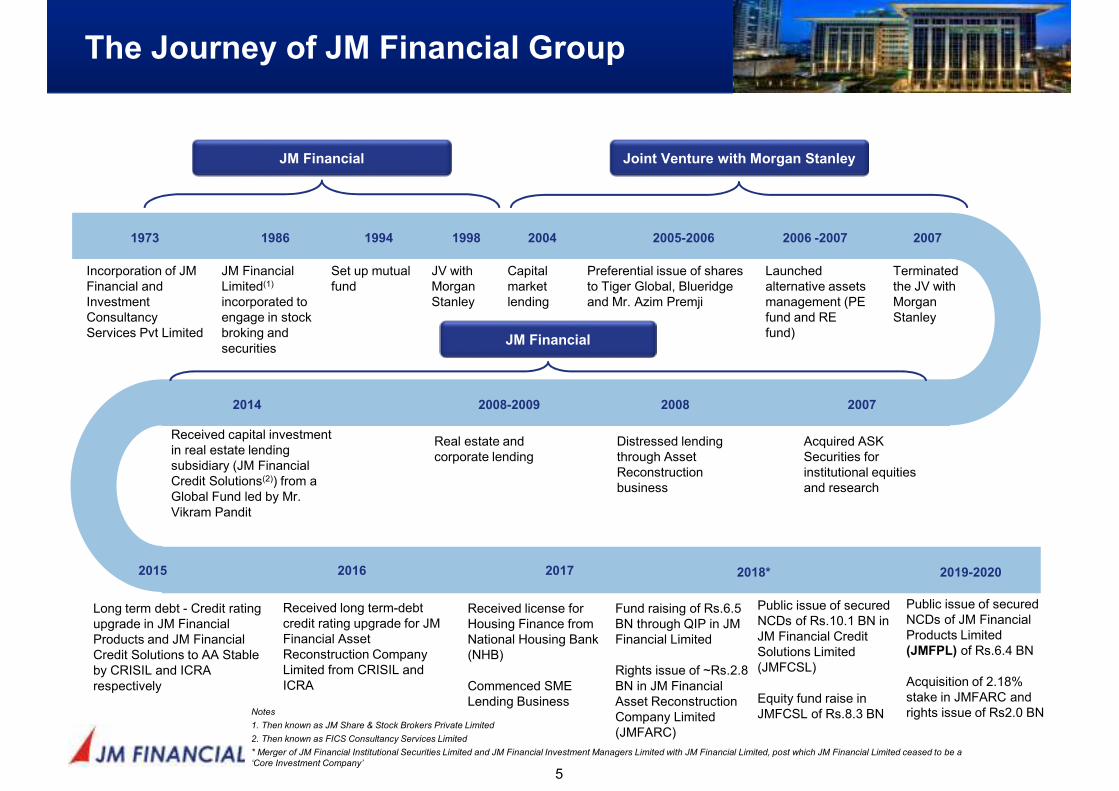
The Journey of JM Financial Group
5
1973
Incorporation of JM Financial and Investment Consultancy Services Pvt Limited
1986
JM Financial Limited(1)
incorporated to engage in stock broking and securities
1994
Set up mutual fund
1998
JV with Morgan Stanley
2006 -2007
Launched alternative assets management (PE fund and RE fund)
2007
Terminated the JV with Morgan Stanley
2007
Acquired ASK Securities for institutional equities and research
2008
Distressed lending through Asset Reconstruction business
2008-2009
Real estate and corporate lending
2014
Received capital investment in real estate lending subsidiary (JM Financial Credit Solutions(2)) from a Global Fund led by Mr. Vikram Pandit
2015
Long term debt - Credit rating upgrade in JM Financial Products and JM Financial Credit Solutions to AA Stable by CRISIL and ICRA respectively
2017
Received license for Housing Finance from National Housing Bank (NHB)
Commenced SME Lending Business
2018*
Fund raising of Rs.6.5 BN through QIP in JM Financial Limited
Rights issue of ~Rs.2.8 BN in JM Financial Asset Reconstruction Company Limited (JMFARC)
Joint Venture with Morgan Stanley
JM Financial
2005-2006
Preferential issue of shares to Tiger Global, Blueridge and Mr. Azim Premji
2016
Received long term-debt credit rating upgrade for JM Financial Asset Reconstruction Company Limited from CRISIL and ICRA
JM Financial
2004
Capital market lending
Notes
1. Then known as JM Share & Stock Brokers Private Limited
2. Then known as FICS Consultancy Services Limited
* Merger of JM Financial Institutional Securities Limited and JM Financial Investment Managers Limited with JM Financial Limited, post which JM Financial Limited ceased to be a
‘Core Investment Company’
Public issue of secured NCDs of Rs.10.1 BN in JM Financial Credit Solutions Limited (JMFCSL)
Equity fund raise in JMFCSL of Rs.8.3 BN
Public issue of secured NCDs of JM Financial Products Limited (JMFPL) of Rs.6.4 BN
Acquisition of 2.18% stake in JMFARC and rights issue of Rs2.0 BN
2019-2020
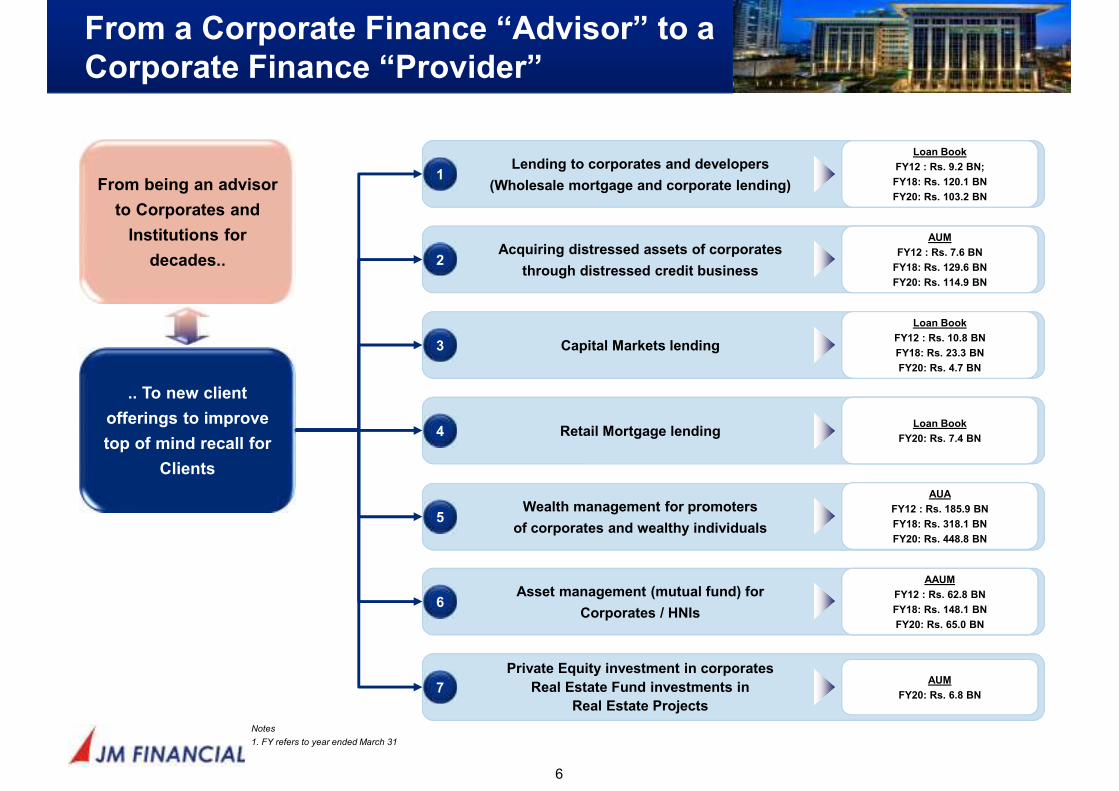
Lending to corporates and developers
(Wholesale mortgage and corporate lending)
Loan Book
FY12 : Rs. 9.2 BN;
FY18: Rs. 120.1 BN
FY20: Rs. 103.2 BN
1
Acquiring distressed assets of corporates
through distressed credit business
AUM
FY12 : Rs. 7.6 BN
FY18: Rs. 129.6 BN
FY20: Rs. 114.9 BN
2
Capital Markets lending
Loan Book
FY12 : Rs. 10.8 BN
FY18: Rs. 23.3 BN
FY20: Rs. 4.7 BN
3
Wealth management for promoters
of corporates and wealthy individuals
AUA
FY12 : Rs. 185.9 BN
FY18: Rs. 318.1 BN
FY20: Rs. 448.8 BN
Asset management (mutual fund) for
Corporates / HNIs
AAUM
FY12 : Rs. 62.8 BN
FY18: Rs. 148.1 BN
FY20: Rs. 65.0 BN
Private Equity investment in corporates
Real Estate Fund investments in
Real Estate Projects
AUM
FY20: Rs. 6.8 BN
Retail Mortgage lendingLoan Book
FY20: Rs. 7.4 BN4
From a Corporate Finance “Advisor” to a
Corporate Finance “Provider”
6
5
6
7
.. To new client
offerings to improve
top of mind recall for
Clients
From being an advisor
to Corporates and
Institutions for
decades..
Notes
1. FY refers to year ended March 31

Key Strengths and Strategies
Section 2
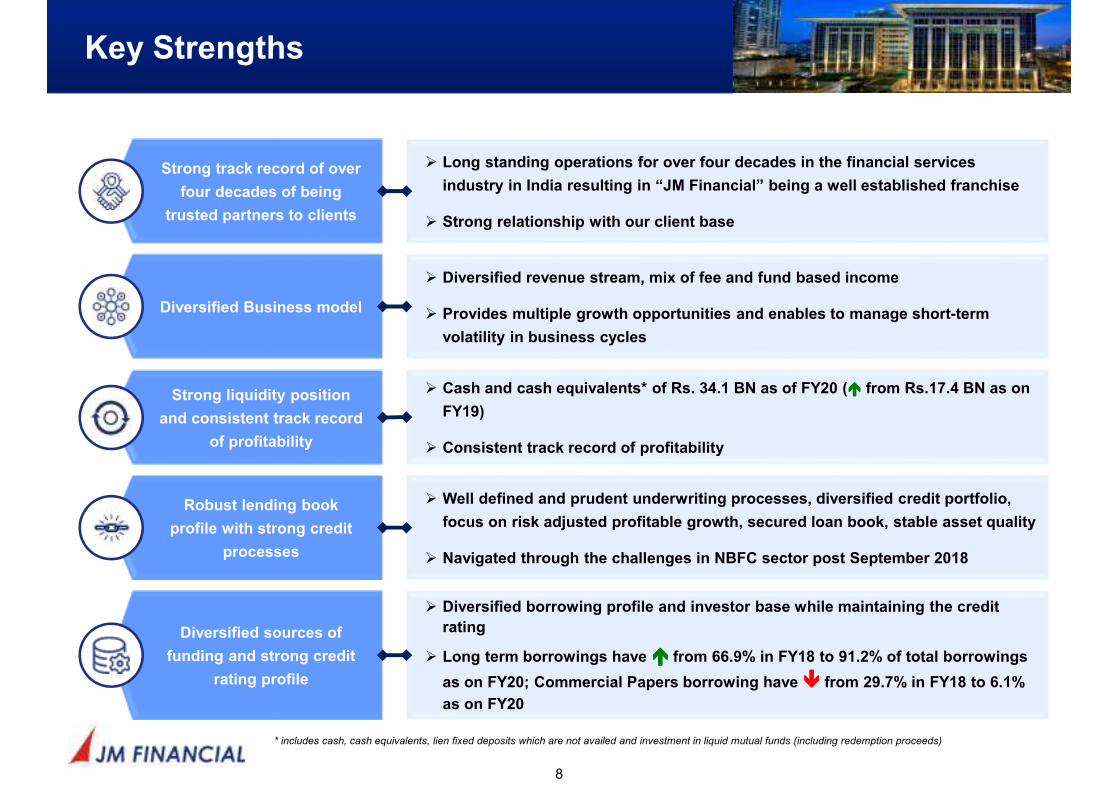
Key Strengths
8
Diversified Business model
� Diversified revenue stream, mix of fee and fund based income
� Provides multiple growth opportunities and enables to manage short-term
volatility in business cycles
Robust lending book
profile with strong credit
processes
� Well defined and prudent underwriting processes, diversified credit portfolio,
focus on risk adjusted profitable growth, secured loan book, stable asset quality
� Navigated through the challenges in NBFC sector post September 2018
Diversified sources of
funding and strong credit
rating profile
� Diversified borrowing profile and investor base while maintaining the credit
rating
� Long term borrowings have ���� from 66.9% in FY18 to 91.2% of total borrowings
as on FY20; Commercial Papers borrowing have ���� from 29.7% in FY18 to 6.1%
as on FY20
Strong liquidity position
and consistent track record
of profitability
� Cash and cash equivalents* of Rs. 34.1 BN as of FY20 (���� from Rs.17.4 BN as on
FY19)
� Consistent track record of profitability
Strong track record of over
four decades of being
trusted partners to clients
� Long standing operations for over four decades in the financial services
industry in India resulting in “JM Financial” being a well established franchise
� Strong relationship with our client base
* includes cash, cash equivalents, lien fixed deposits which are not availed and investment in liquid mutual funds (including redemption proceeds)
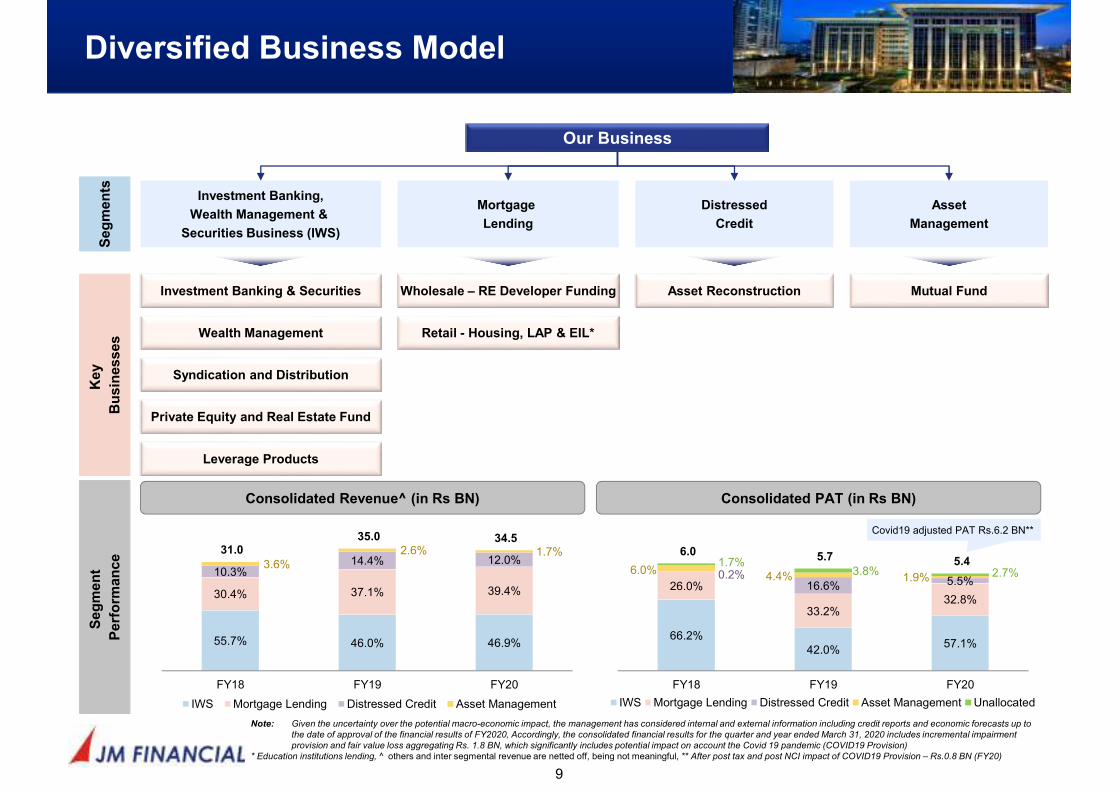
Diversified Business Model
9
Our Business
Seg
men
ts
Investment Banking,
Wealth Management &
Securities Business (IWS)
Key
Bu
sin
esses
Investment Banking & Securities
Wealth Management
Syndication and Distribution
Private Equity and Real Estate Fund
Leverage Products
Note: Given the uncertainty over the potential macro-economic impact, the management has considered internal and external information including credit reports and economic forecasts up to
the date of approval of the financial results of FY2020, Accordingly, the consolidated financial results for the quarter and year ended March 31, 2020 includes incremental impairment
provision and fair value loss aggregating Rs. 1.8 BN, which significantly includes potential impact on account the Covid 19 pandemic (COVID19 Provision)
* Education institutions lending, ^ others and inter segmental revenue are netted off, being not meaningful, ** After post tax and post NCI impact of COVID19 Provision – Rs.0.8 BN (FY20)
Seg
men
t
Perf
orm
an
ce
Consolidated Revenue^ (in Rs BN) Consolidated PAT (in Rs BN)
Mortgage
Lending
Wholesale – RE Developer Funding
Retail - Housing, LAP & EIL*
Distressed
Credit
Asset Reconstruction
Asset
Management
Mutual Fund
55.7% 46.0% 46.9%
30.4% 37.1% 39.4%
10.3%14.4% 12.0%3.6%
2.6% 1.7%31.0 35.0 34.5
FY18 FY19 FY20
IWS Mortgage Lending Distressed Credit Asset Management
66.2%42.0%
57.1%
26.0%
33.2%32.8%
0.2%16.6% 5.5%
6.0%4.4% 1.9%
1.7%3.8% 2.7%
6.0 5.7 5.4
FY18 FY19 FY20
IWS Mortgage Lending Distressed Credit Asset Management Unallocated
Covid19 adjusted PAT Rs.6.2 BN**
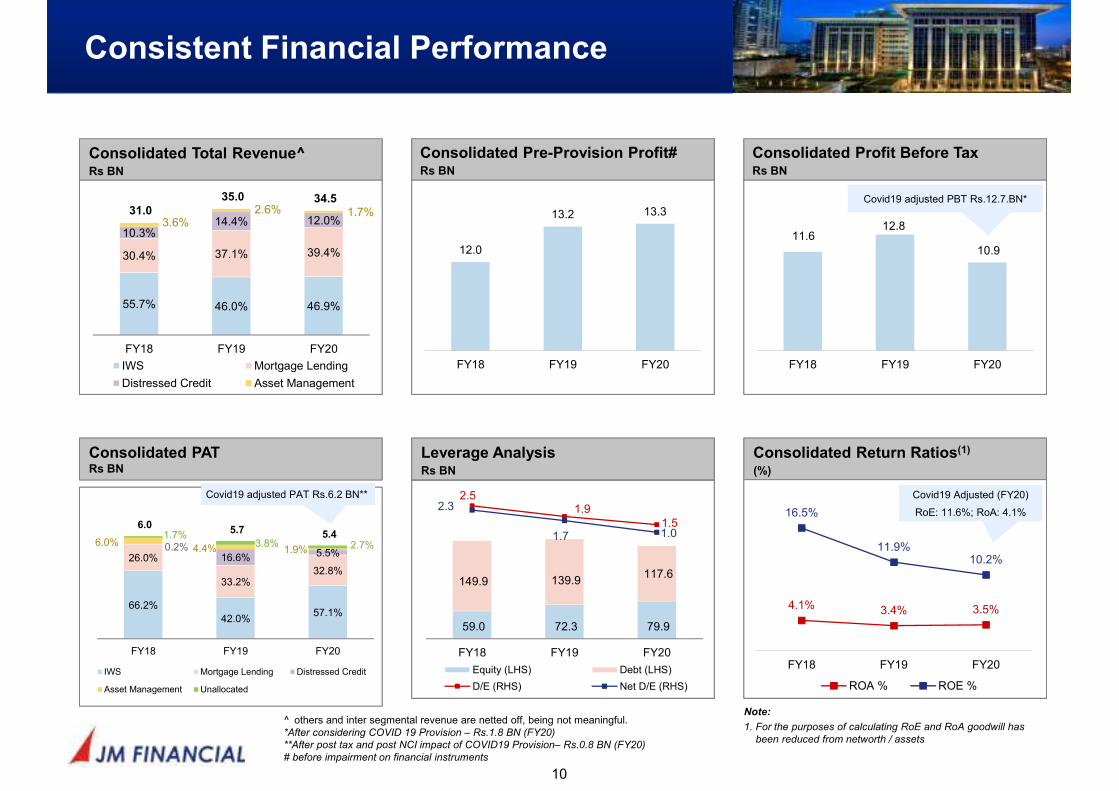
Consistent Financial Performance
10
Consolidated Total Revenue^Rs BN
Consolidated PATRs BN
Consolidated Return Ratios(1)
(%)
4.1% 3.4% 3.5%
16.5%
11.9%10.2%
FY18 FY19 FY20
ROA % ROE %
Consolidated Profit Before TaxRs BN
11.612.8
10.9
FY18 FY19 FY20
Note:
1. For the purposes of calculating RoE and RoA goodwill has
been reduced from networth / assets
Consolidated Pre-Provision Profit#Rs BN
12.0
13.2 13.3
FY18 FY19 FY20
Leverage AnalysisRs BN
59.0 72.3 79.9
149.9 139.9 117.6
2.51.9
1.5
2.3
1.7 1.0
FY18 FY19 FY20
Equity (LHS) Debt (LHS)
D/E (RHS) Net D/E (RHS)
Covid19 adjusted PBT Rs.12.7.BN*
Covid19 Adjusted (FY20)
RoE: 11.6%; RoA: 4.1%
Covid19 adjusted PAT Rs.6.2 BN**
^ others and inter segmental revenue are netted off, being not meaningful.*After considering COVID 19 Provision – Rs.1.8 BN (FY20)
**After post tax and post NCI impact of COVID19 Provision– Rs.0.8 BN (FY20)
# before impairment on financial instruments
55.7% 46.0% 46.9%
30.4% 37.1% 39.4%
10.3%14.4% 12.0%3.6%
2.6% 1.7%31.0
35.0 34.5
FY18 FY19 FY20
IWS Mortgage Lending
Distressed Credit Asset Management
66.2%
42.0%57.1%
26.0%
33.2%32.8%
0.2%16.6% 5.5%
6.0%4.4% 1.9%
1.7%3.8% 2.7%
6.0 5.7 5.4
FY18 FY19 FY20
IWS Mortgage Lending Distressed Credit
Asset Management Unallocated
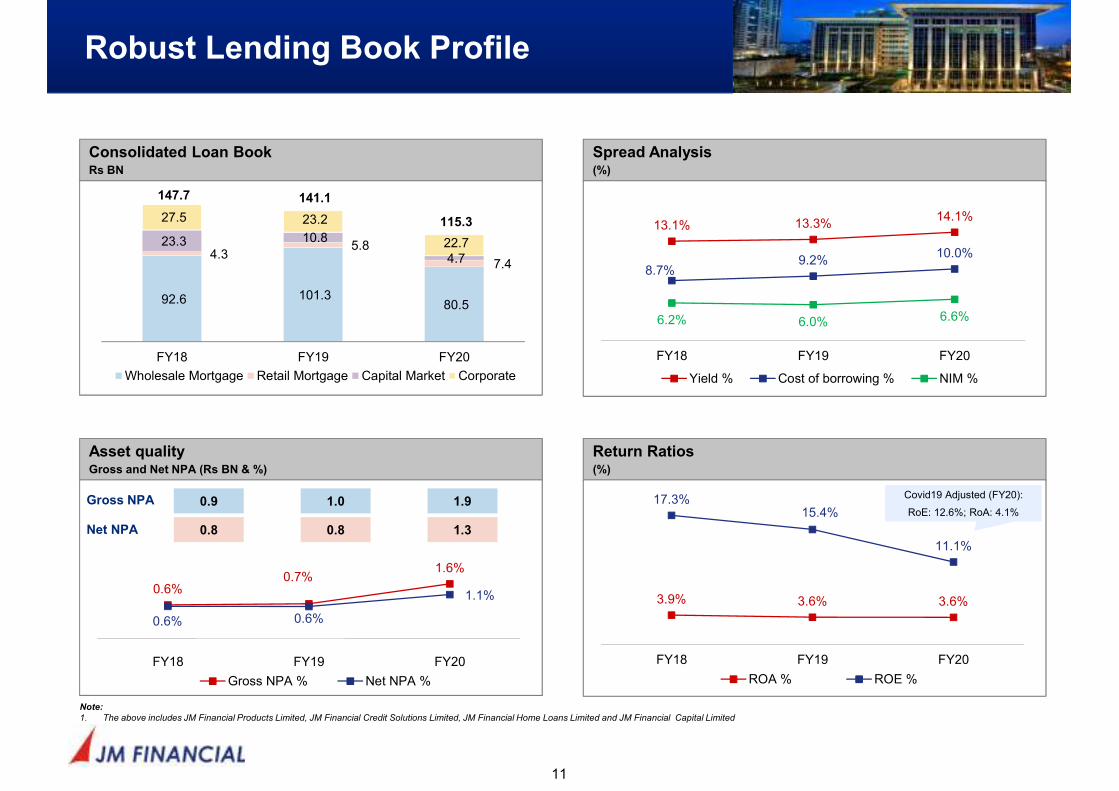
Consolidated Loan BookRs BN
Spread Analysis(%)
Robust Lending Book Profile
11
Return Ratios(%)
Asset qualityGross and Net NPA (Rs BN & %)
0.6%0.7%
1.6%
0.6% 0.6%
1.1%
FY18 FY19 FY20
Gross NPA % Net NPA %
3.9% 3.6% 3.6%
17.3%15.4%
11.1%
FY18 FY19 FY20
ROA % ROE %
92.6 101.3 80.5
4.3 5.8
7.4
23.3 10.8
4.7
27.5 23.2
22.7
147.7 141.1
115.3
FY18 FY19 FY20
Wholesale Mortgage Retail Mortgage Capital Market Corporate
13.1% 13.3%14.1%
8.7%9.2%
10.0%
6.2% 6.0% 6.6%
FY18 FY19 FY20
Yield % Cost of borrowing % NIM %
Note:
1. The above includes JM Financial Products Limited, JM Financial Credit Solutions Limited, JM Financial Home Loans Limited and JM Financial Capital Limited
0.9
0.8
1.0
0.8
1.9
1.3
Gross NPA
Net NPA
Covid19 Adjusted (FY20):
RoE: 12.6%; RoA: 4.1%
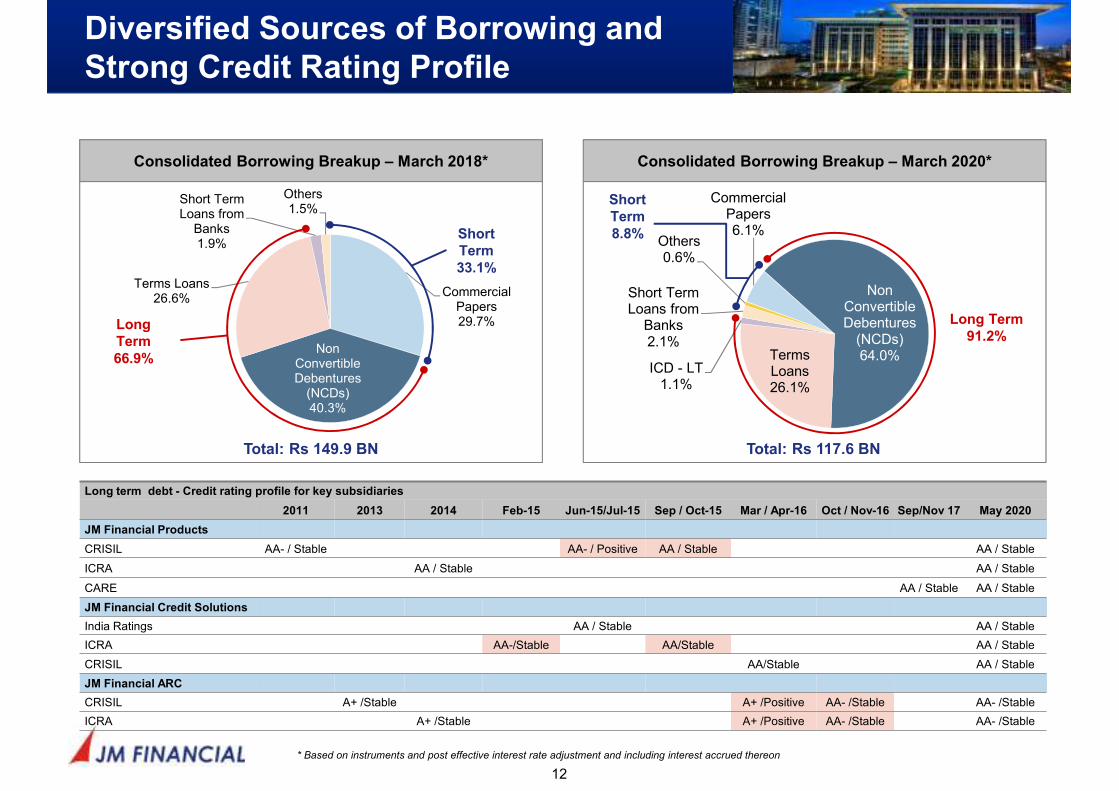
Long term debt - Credit rating profile for key subsidiaries
2011 2013 2014 Feb-15 Jun-15/Jul-15 Sep / Oct-15 Mar / Apr-16 Oct / Nov-16 Sep/Nov 17 May 2020
JM Financial Products
CRISIL AA- / Stable AA- / Positive AA / Stable AA / Stable
ICRA AA / Stable AA / Stable
CARE AA / Stable AA / Stable
JM Financial Credit Solutions
India Ratings AA / Stable AA / Stable
ICRA AA-/Stable AA/Stable AA / Stable
CRISIL AA/Stable AA / Stable
JM Financial ARC
CRISIL A+ /Stable A+ /Positive AA- /Stable AA- /Stable
ICRA A+ /Stable A+ /Positive AA- /Stable AA- /Stable
Diversified Sources of Borrowing and
Strong Credit Rating Profile
12
* Based on instruments and post effective interest rate adjustment and including interest accrued thereon
Consolidated Borrowing Breakup – March 2020*
Total: Rs 117.6 BN
Consolidated Borrowing Breakup – March 2018*
Total: Rs 149.9 BN
Commercial Papers29.7%
Non Convertible Debentures
(NCDs)40.3%
Terms Loans26.6%
Short Term Loans from
Banks1.9%
Others1.5%
Short
Term
33.1%
Long
Term
66.9%
Commercial Papers6.1%
Non Convertible Debentures
(NCDs)64.0%Terms
Loans26.1%
ICD - LT1.1%
Short Term Loans from
Banks2.1%
Others0.6%
Short
Term
8.8%
Long Term
91.2%
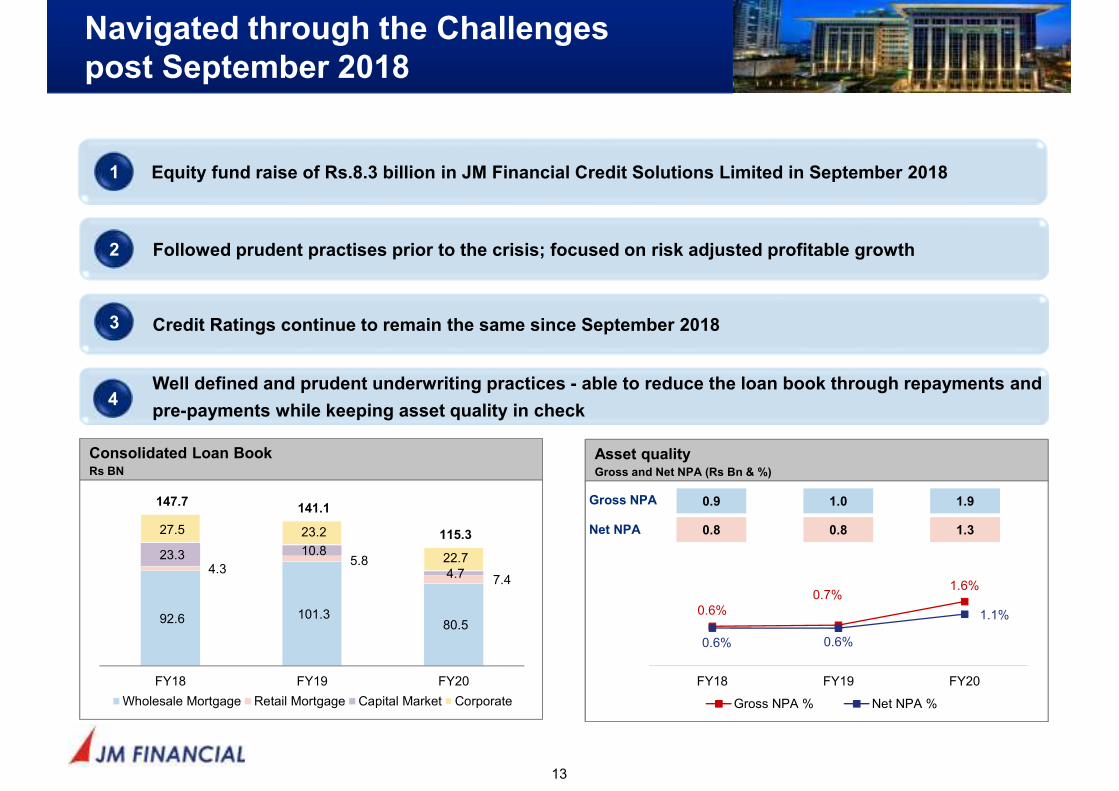
Asset qualityGross and Net NPA (Rs Bn & %)
Consolidated Loan BookRs BN
Navigated through the Challenges
post September 2018
13
0.6%0.7%
1.6%
0.6% 0.6%
1.1%
FY18 FY19 FY20
Gross NPA % Net NPA %
92.6 101.3 80.5
4.3 5.8
7.4
23.3 10.8
4.7
27.5 23.2
22.7
147.7 141.1
115.3
FY18 FY19 FY20
Wholesale Mortgage Retail Mortgage Capital Market Corporate
0.9
0.8
1.0
0.8
1.9
1.3
Gross NPA
Net NPA
Credit Ratings continue to remain the same since September 2018 3
Well defined and prudent underwriting practices - able to reduce the loan book through repayments and
pre-payments while keeping asset quality in check4
Followed prudent practises prior to the crisis; focused on risk adjusted profitable growth2
Equity fund raise of Rs.8.3 billion in JM Financial Credit Solutions Limited in September 20181
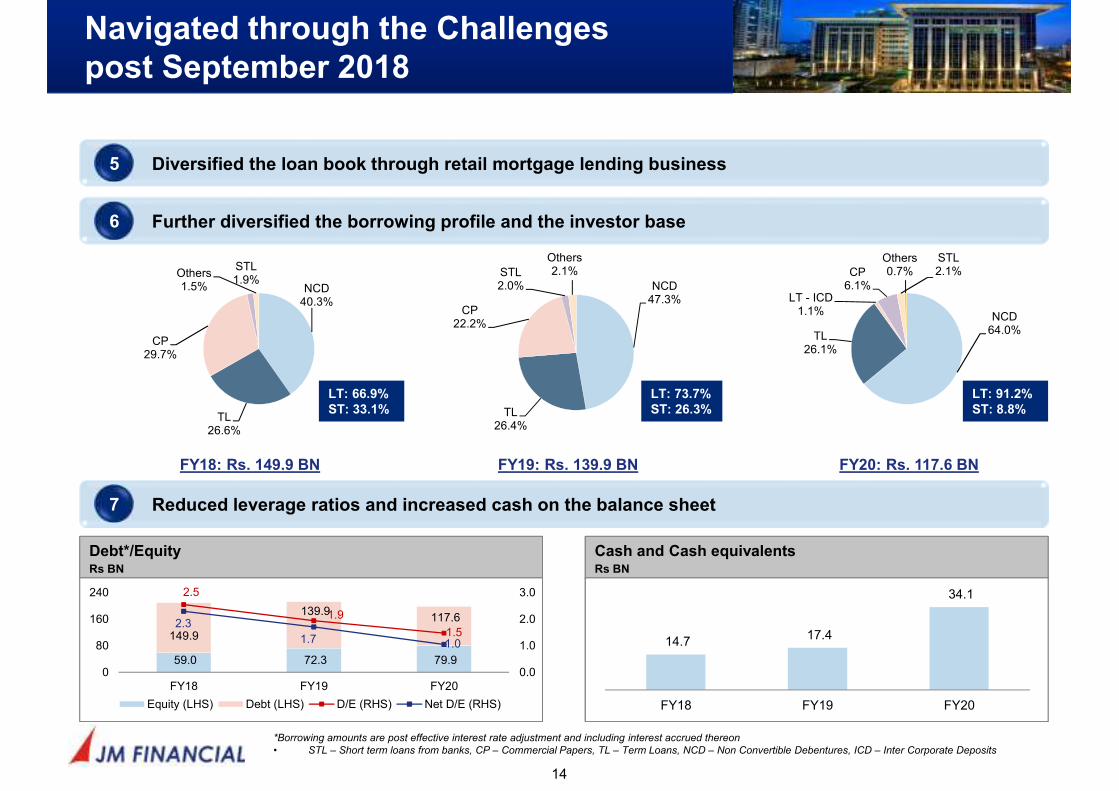
Navigated through the Challenges
post September 2018
14
Diversified the loan book through retail mortgage lending business5
Further diversified the borrowing profile and the investor base6
NCD40.3%
TL26.6%
CP29.7%
STL1.9%
Others1.5% NCD
47.3%
TL26.4%
CP22.2%
STL2.0%
Others2.1%
NCD64.0%
TL26.1%
LT - ICD1.1%
CP6.1%
STL2.1%
Others0.7%
FY18: Rs. 149.9 BN FY19: Rs. 139.9 BN FY20: Rs. 117.6 BN
LT: 66.9%
ST: 33.1%
LT: 91.2%
ST: 8.8%
LT: 73.7%
ST: 26.3%
Reduced leverage ratios and increased cash on the balance sheet7
Cash and Cash equivalentsRs BN
Debt*/EquityRs BN
14.7 17.4
34.1
FY18 FY19 FY20
59.0 72.3 79.9
149.9
139.9 117.6
2.5
1.9
1.52.3
1.7 1.0
0.0
1.0
2.0
3.0
0
80
160
240
FY18 FY19 FY20
Equity (LHS) Debt (LHS) D/E (RHS) Net D/E (RHS)
*Borrowing amounts are post effective interest rate adjustment and including interest accrued thereon
• STL – Short term loans from banks, CP – Commercial Papers, TL – Term Loans, NCD – Non Convertible Debentures, ICD – Inter Corporate Deposits
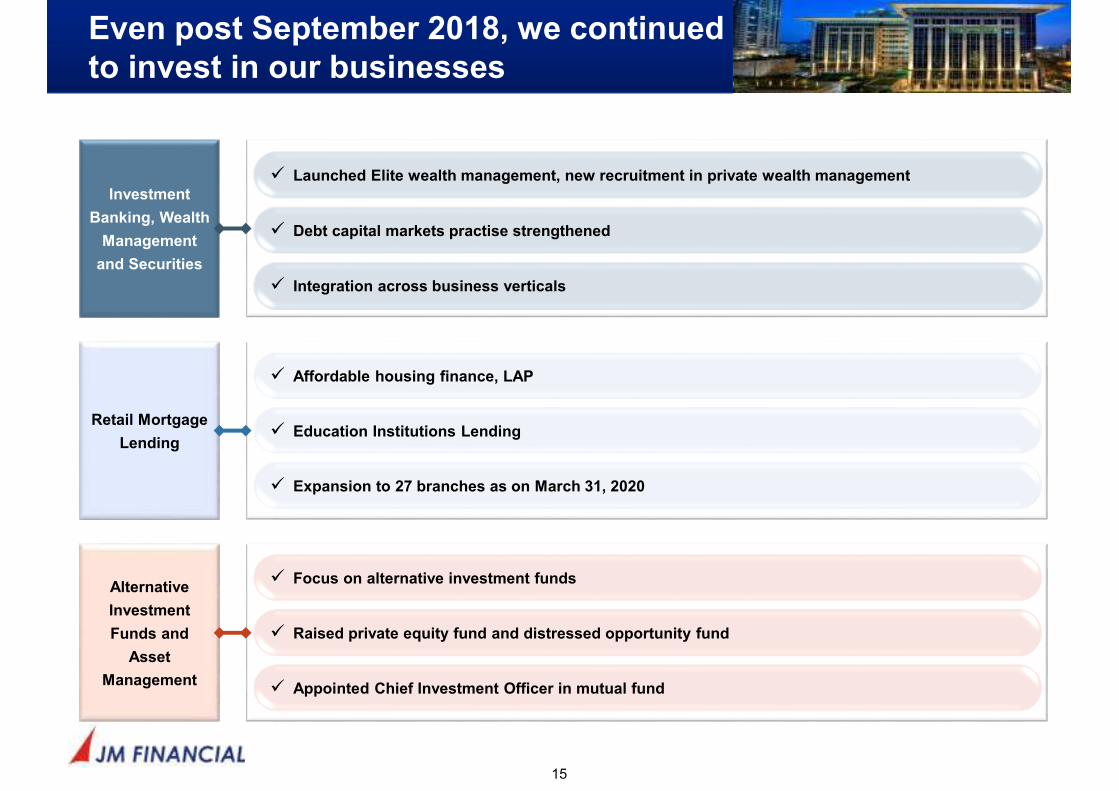
Even post September 2018, we continued
to invest in our businesses
15
Alternative
Investment
Funds and
Asset
Management
Retail Mortgage
Lending
Investment
Banking, Wealth
Management
and Securities
Investment Banking, Wealth Management and Securities
� Launched Elite wealth management, new recruitment in private wealth management
� Debt capital markets practise strengthened
� Integration across business verticals
� Affordable housing finance, LAP
� Education Institutions Lending
� Expansion to 27 branches as on March 31, 2020
� Focus on alternative investment funds
� Raised private equity fund and distressed opportunity fund
� Appointed Chief Investment Officer in mutual fund
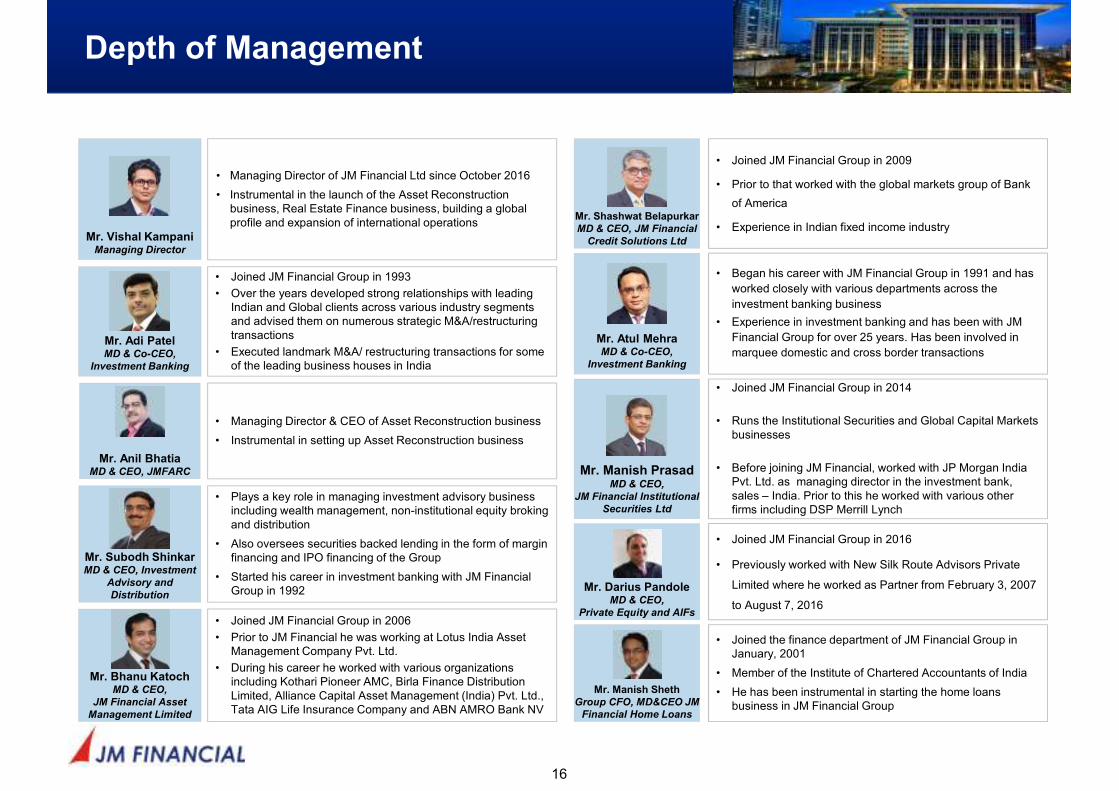
Depth of Management
16
Mr. Vishal KampaniManaging Director
• Managing Director of JM Financial Ltd since October 2016
• Instrumental in the launch of the Asset Reconstruction business, Real Estate Finance business, building a global profile and expansion of international operations
Mr. Anil BhatiaMD & CEO, JMFARC
• Managing Director & CEO of Asset Reconstruction business
• Instrumental in setting up Asset Reconstruction business
Mr. Subodh ShinkarMD & CEO, Investment
Advisory and
Distribution
• Plays a key role in managing investment advisory business including wealth management, non-institutional equity broking and distribution
• Also oversees securities backed lending in the form of margin financing and IPO financing of the Group
• Started his career in investment banking with JM Financial Group in 1992
Mr. Shashwat Belapurkar
MD & CEO, JM Financial
Credit Solutions Ltd
• Joined JM Financial Group in 2009
• Prior to that worked with the global markets group of Bank
of America
• Experience in Indian fixed income industry
Mr. Adi PatelMD & Co-CEO,
Investment Banking
• Joined JM Financial Group in 1993
• Over the years developed strong relationships with leading Indian and Global clients across various industry segments and advised them on numerous strategic M&A/restructuring transactions
• Executed landmark M&A/ restructuring transactions for some of the leading business houses in India
Mr. Bhanu KatochMD & CEO,
JM Financial Asset
Management Limited
• Joined JM Financial Group in 2006
• Prior to JM Financial he was working at Lotus India Asset Management Company Pvt. Ltd.
• During his career he worked with various organizations including Kothari Pioneer AMC, Birla Finance Distribution Limited, Alliance Capital Asset Management (India) Pvt. Ltd., Tata AIG Life Insurance Company and ABN AMRO Bank NV
Mr. Manish PrasadMD & CEO,
JM Financial Institutional
Securities Ltd
• Joined JM Financial Group in 2014
• Runs the Institutional Securities and Global Capital Markets businesses
• Before joining JM Financial, worked with JP Morgan India Pvt. Ltd. as managing director in the investment bank, sales – India. Prior to this he worked with various other firms including DSP Merrill Lynch
Mr. Atul MehraMD & Co-CEO,
Investment Banking
• Began his career with JM Financial Group in 1991 and has
worked closely with various departments across the
investment banking business
• Experience in investment banking and has been with JM
Financial Group for over 25 years. Has been involved in
marquee domestic and cross border transactions
Mr. Darius PandoleMD & CEO,
Private Equity and AIFs
• Joined JM Financial Group in 2016
• Previously worked with New Silk Route Advisors Private
Limited where he worked as Partner from February 3, 2007
to August 7, 2016
Mr. Manish Sheth
Group CFO, MD&CEO JM
Financial Home Loans
• Joined the finance department of JM Financial Group in January, 2001
• Member of the Institute of Chartered Accountants of India
• He has been instrumental in starting the home loans business in JM Financial Group

Business Overview
Section 3

Investment Banking, Wealth Management and Securities
Tab A
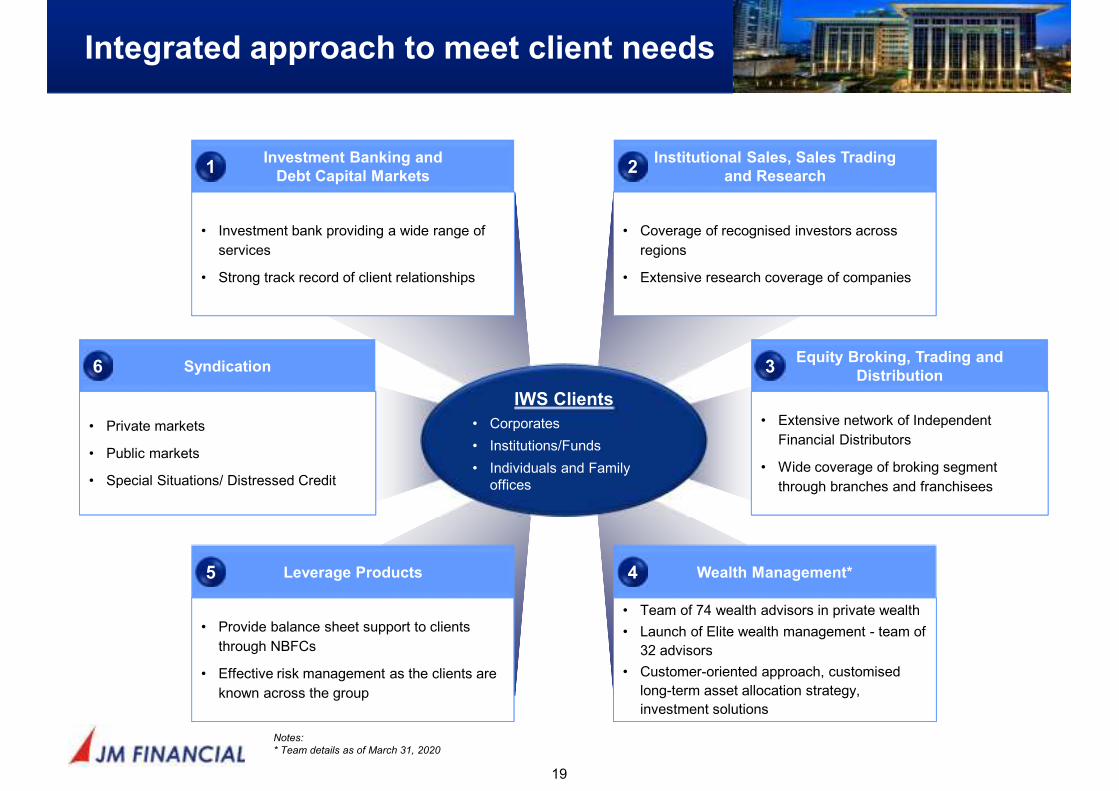
Integrated approach to meet client needs
19
Institutional Sales, Sales Trading
and Research
Investment Banking and
Debt Capital Markets
• Investment bank providing a wide range of
services
• Strong track record of client relationships
• Coverage of recognised investors across
regions
• Extensive research coverage of companies
IWS Clients
• Corporates
• Institutions/Funds
• Individuals and Family offices
Wealth Management*
• Team of 74 wealth advisors in private wealth
• Launch of Elite wealth management - team of
32 advisors
• Customer-oriented approach, customised
long-term asset allocation strategy,
investment solutions
Leverage Products
• Provide balance sheet support to clients
through NBFCs
• Effective risk management as the clients are
known across the group
Equity Broking, Trading and
Distribution
• Extensive network of Independent
Financial Distributors
• Wide coverage of broking segment
through branches and franchisees
Syndication
• Private markets
• Public markets
• Special Situations/ Distressed Credit
1 2
5 4
6 3
Notes:
* Team details as of March 31, 2020
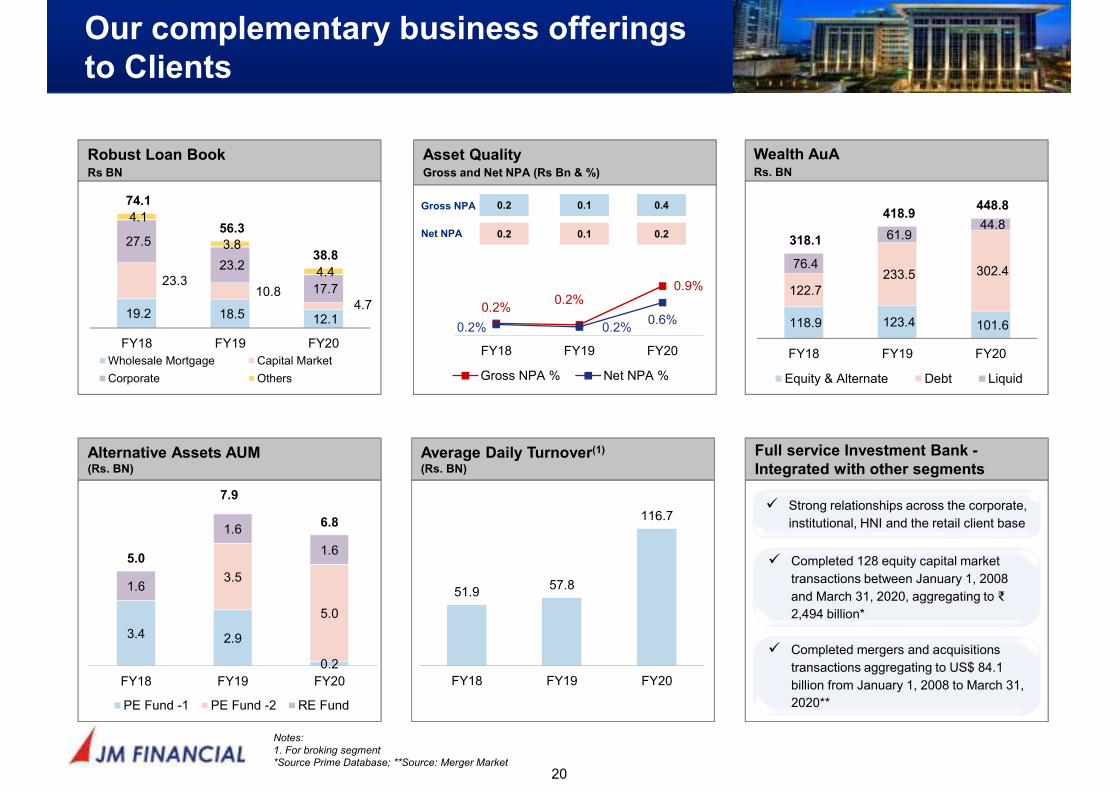
Robust Loan BookRs BN
Wealth AuARs. BN
Asset Quality Gross and Net NPA (Rs Bn & %)
Alternative Assets AUM(Rs. BN)
Average Daily Turnover(1)
(Rs. BN)
Full service Investment Bank -
Integrated with other segments
Our complementary business offerings
to Clients
20
19.2 18.5 12.1
23.3 10.8
4.7
27.5
23.2
17.7
4.1
3.8
4.4
74.1
56.3
38.8
FY18 FY19 FY20
Wholesale Mortgage Capital Market
Corporate Others
118.9 123.4 101.6
122.7 233.5 302.4
76.4
61.9 44.8
318.1
418.9 448.8
FY18 FY19 FY20
Equity & Alternate Debt Liquid
51.9 57.8
116.7
FY18 FY19 FY20
3.4 2.9
0.2
3.5
5.0
1.6
1.6
1.65.0
7.9
6.8
FY18 FY19 FY20
PE Fund -1 PE Fund -2 RE Fund
0.2%0.2%
0.9%
0.2% 0.2%0.6%
FY18 FY19 FY20
Gross NPA % Net NPA %
0.2
0.2
0.1
0.1
0.4
0.2
Gross NPA
Net NPA
� Strong relationships across the corporate,
institutional, HNI and the retail client base
� Completed 128 equity capital market
transactions between January 1, 2008
and March 31, 2020, aggregating to ₹
2,494 billion*
� Completed mergers and acquisitions
transactions aggregating to US$ 84.1
billion from January 1, 2008 to March 31,
2020**
Notes:
1. For broking segment
*Source Prime Database; **Source: Merger Market
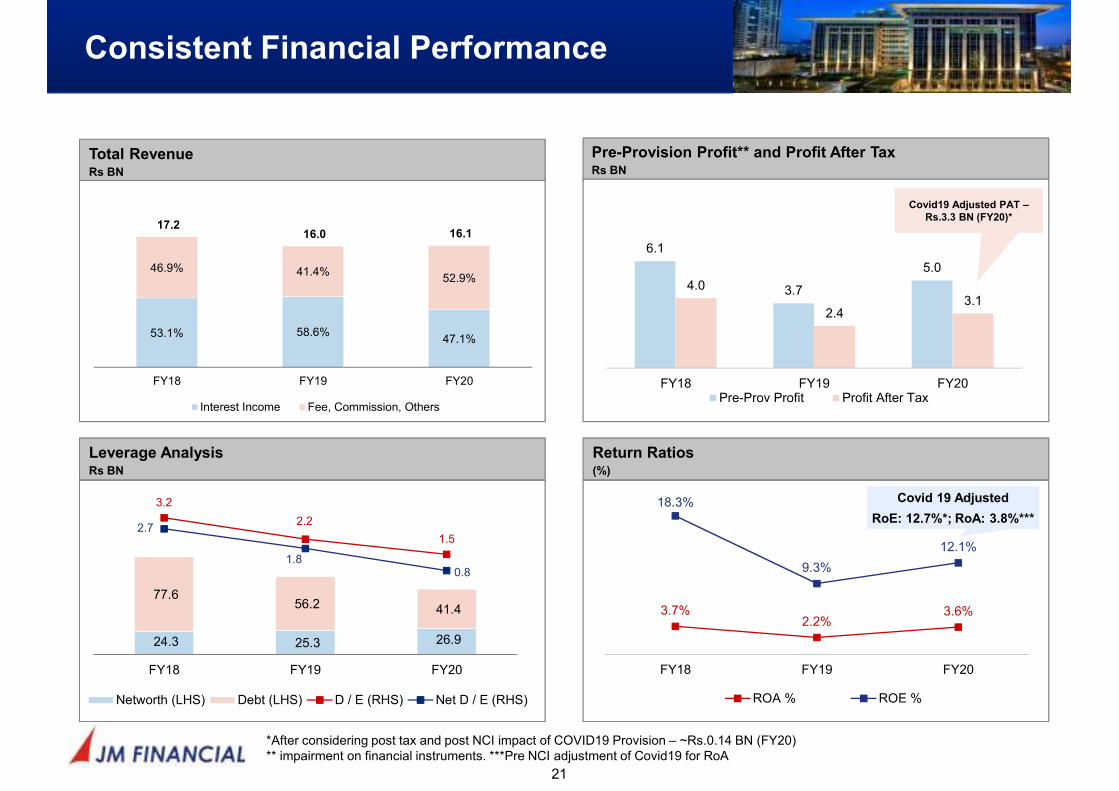
Total RevenueRs BN
Return Ratios(%)
3.7%2.2%
3.6%
18.3%
9.3%
12.1%
FY18 FY19 FY20
ROA % ROE %
Consistent Financial Performance
21
Leverage AnalysisRs BN
24.3 25.3 26.9
77.6 56.2 41.4
3.2
2.2
1.52.7
1.80.8
FY18 FY19 FY20
Networth (LHS) Debt (LHS) D / E (RHS) Net D / E (RHS)
Covid 19 Adjusted
RoE: 12.7%*; RoA: 3.8%***
Pre-Provision Profit** and Profit After TaxRs BN
6.1
3.7
5.0
4.0
2.4 3.1
FY18 FY19 FY20Pre-Prov Profit Profit After Tax
Covid19 Adjusted PAT –
Rs.3.3 BN (FY20)*
53.1% 58.6%47.1%
46.9% 41.4%52.9%
17.2 16.0 16.1
FY18 FY19 FY20
Interest Income Fee, Commission, Others
*After considering post tax and post NCI impact of COVID19 Provision – ~Rs.0.14 BN (FY20)** impairment on financial instruments. ***Pre NCI adjustment of Covid19 for RoA

Mortgage Lending
Tab B

Overview
23
Received capital investment in JM Financial Limited’s real
estate lending subsidiary (JM Financial Credit Solutions(1))
from a Global Fund led by Mr. Vikram Pandit in
November 2014
JM Financial Limited holds 46.7% stake in JM Financial Credit
Solutions Limited as of March 31, 2020
# groups – 74 as of March 2020
Average ticket size per group – ~Rs. 1.0 BN as of March 2020
70.3% of book is against residential projects as of March 2020.
78.6% of book is cash flow backed lending as of March 2020
Long term credit rating of AA Stable
JM Financial Credit Solutions (wholesale mortgage)
Registered with National Housing Bank of India (NHB) in
November 2017
Comprises of housing finance, loan against property and
education institutions lending
Gross loan book of Rs.3.1 BN, average yield of 13%
Long term rating of AA Stable and short term rating of A1+
Expanded to 27 branches in the states of Maharashtra,
Gujarat, Rajasthan, Tamil Nadu, Telangana, Karnataka and
Madhya Pradesh as of March 31, 2020
Turned profitable in the financial year 2019-20
JM Financial Home Loans (retail mortgage)
Average ticket size of Rs. 1.2 million, loan to value of 53%
(as of FY20)
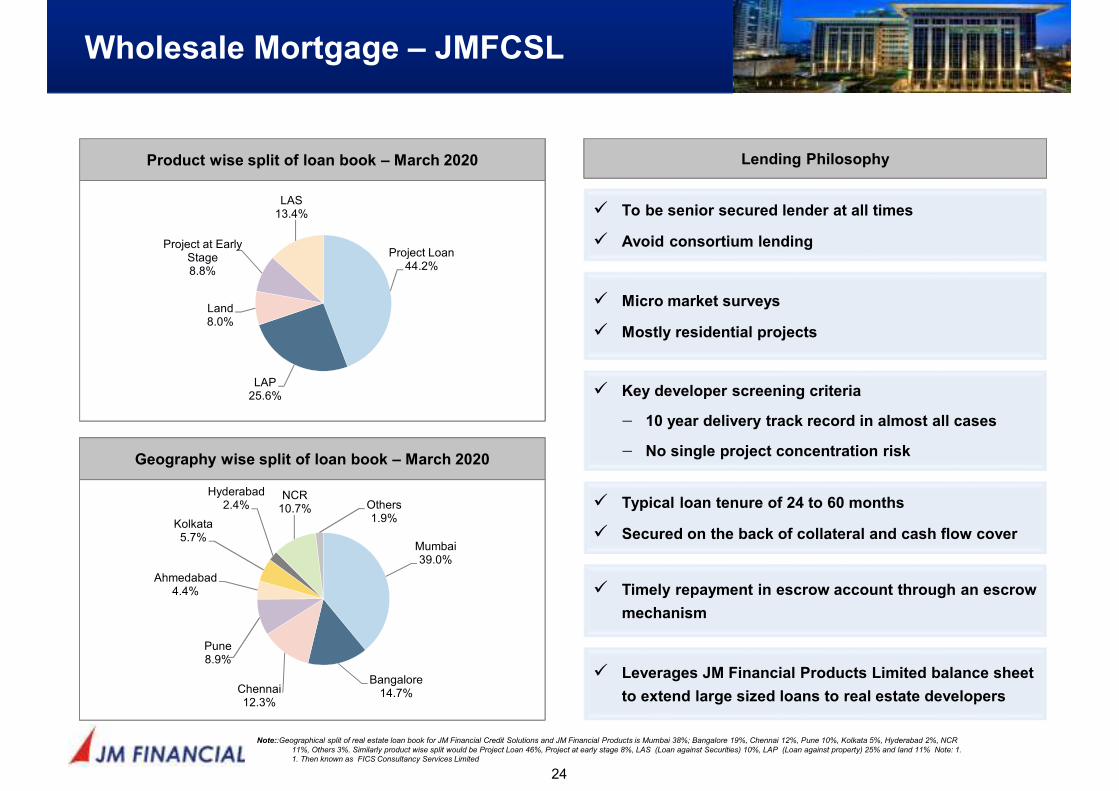
Wholesale Mortgage – JMFCSL
24
Note::Geographical split of real estate loan book for JM Financial Credit Solutions and JM Financial Products is Mumbai 38%; Bangalore 19%, Chennai 12%, Pune 10%, Kolkata 5%, Hyderabad 2%, NCR
11%, Others 3%. Similarly product wise split would be Project Loan 46%, Project at early stage 8%, LAS (Loan against Securities) 10%, LAP (Loan against property) 25% and land 11% Note: 1.
1. Then known as FICS Consultancy Services Limited
Lending Philosophy
� Key developer screening criteria
− 10 year delivery track record in almost all cases
− No single project concentration risk
� Micro market surveys
� Mostly residential projects
� Timely repayment in escrow account through an escrow
mechanism
� Typical loan tenure of 24 to 60 months
� Secured on the back of collateral and cash flow cover
� Leverages JM Financial Products Limited balance sheet
to extend large sized loans to real estate developers
� To be senior secured lender at all times
� Avoid consortium lending
Geography wise split of loan book – March 2020
Mumbai39.0%
Bangalore14.7%Chennai
12.3%
Pune8.9%
Ahmedabad4.4%
Kolkata5.7%
Hyderabad2.4%
NCR10.7% Others
1.9%
Product wise split of loan book – March 2020
Project Loan44.2%
LAP25.6%
Land8.0%
Project at Early Stage8.8%
LAS13.4%
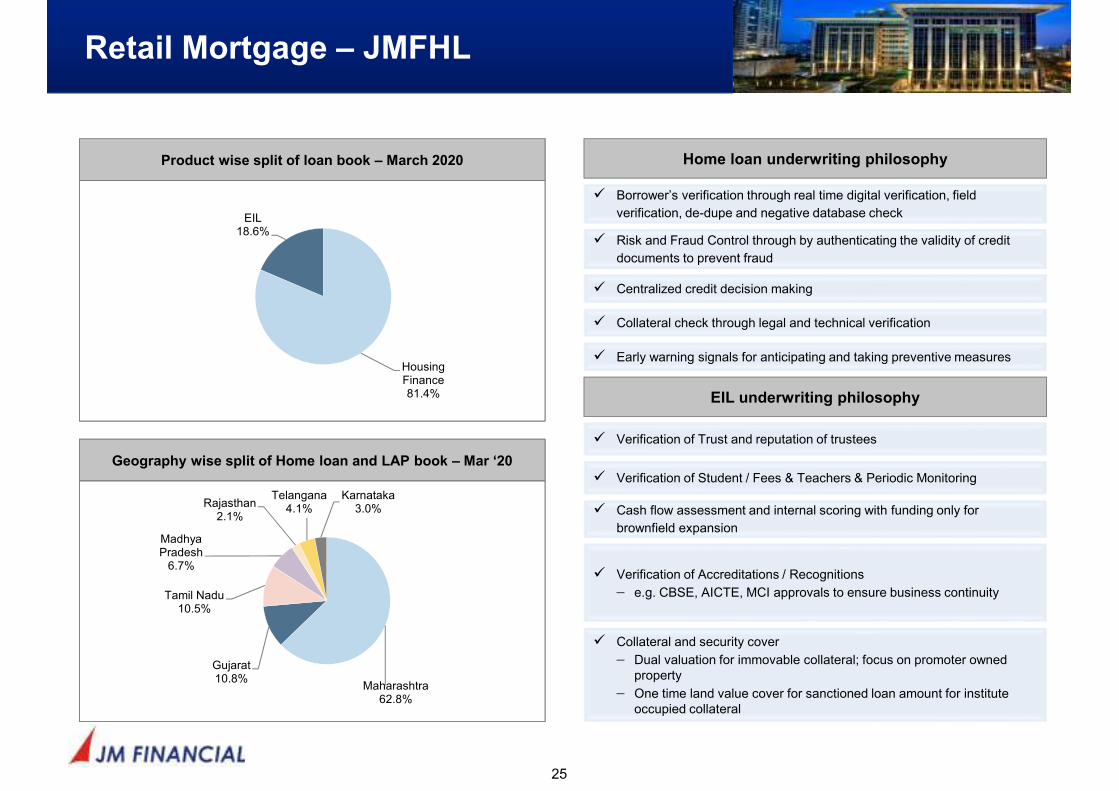
Retail Mortgage – JMFHL
25
Home loan underwriting philosophy
Geography wise split of Home loan and LAP book – Mar ‘20
Maharashtra62.8%
Gujarat10.8%
Tamil Nadu10.5%
Madhya Pradesh
6.7%
Rajasthan2.1%
Telangana4.1%
Karnataka3.0%
Product wise split of loan book – March 2020
Housing Finance81.4%
EIL18.6%
� Borrower’s verification through real time digital verification, field
verification, de-dupe and negative database check
� Risk and Fraud Control through by authenticating the validity of credit
documents to prevent fraud
� Centralized credit decision making
� Collateral check through legal and technical verification
� Early warning signals for anticipating and taking preventive measures
� Verification of Trust and reputation of trustees
� Verification of Student / Fees & Teachers & Periodic Monitoring
� Cash flow assessment and internal scoring with funding only for
brownfield expansion
EIL underwriting philosophy
� Verification of Accreditations / Recognitions
− e.g. CBSE, AICTE, MCI approvals to ensure business continuity
� Collateral and security cover
− Dual valuation for immovable collateral; focus on promoter owned property
− One time land value cover for sanctioned loan amount for institute occupied collateral
Pre-Provision Profit ***Rs BN
Operating and Financial Performance –
Mortgage Lending (Wholesale + Retail)
26
Cost to net total income(%)
Spread Analysis(%)
14.7%14.2%
14.7%
9.2% 9.5%10.1%
8.0%7.3% 7.9%
FY18 FY19 FY20
Yield % COF % NIM %
9.2%10.1%
13.7%
FY18 FY19 FY20
5.0
6.46.8
FY18 FY19 FY20
PAT (Pre & Post NCI*)Rs BN
3.1 4.0
3.8
1.61.9 1.8
FY18 FY19 FY20
Pre NCI Post NCI
Covid19 Adjusted : Rs2.1 BN**
Covid19 Adjusted–Rs.4.5 BN FY20#
* Non-controlling interest; # After considering post tax impact of COVID19 Provision– Rs.0.7 BN (FY20); **After considering post tax impact of Covid19 provisions–Rs.0.3 BN FY20); *** Before impairment on financial instruments
Employees(No.)
105 185 334
Return Ratios(%)
5.1% 4.6% 4.3%
20.5%
17.2%
11.7%
FY18 FY19 FY20
ROA % ROE %
Covid19 Adjusted:#
RoA: 5.0%; RoE: 13.7%
Total IncomeRs BN
9.4
12.9 13.5
FY18 FY19 FY20
Operating and Financial Performance –
Mortgage Lending (Wholesale + Retail)
27
Leverage AnalysisRs BN
17.0 30.2
34.3
56.6
57.0 50.2
3.31.9
1.53.3
1.7 1.2
FY18 FY19 FY20
Networth (LHS) Debt (LHS) D / E (RHS) Net D / E (RHS)
Capital Adequacy(%)
22.8%
35.0%
41.0%
FY18 FY19 FY20
CRAR %
Asset qualityGross and Net NPA (Rs BN & %)
1.0% 1.0%
2.0%
0.9% 0.8%
1.4%
FY18 FY19 FY20
Gross NPA % Net NPA %
0.8
0.7
0.9
0.7
1.5
1.1
Gross NPA
Net NPA
Loan BookRs. BN
73.6
83.276.5
FY18 FY19 FY20

Distressed Credit
Tab C
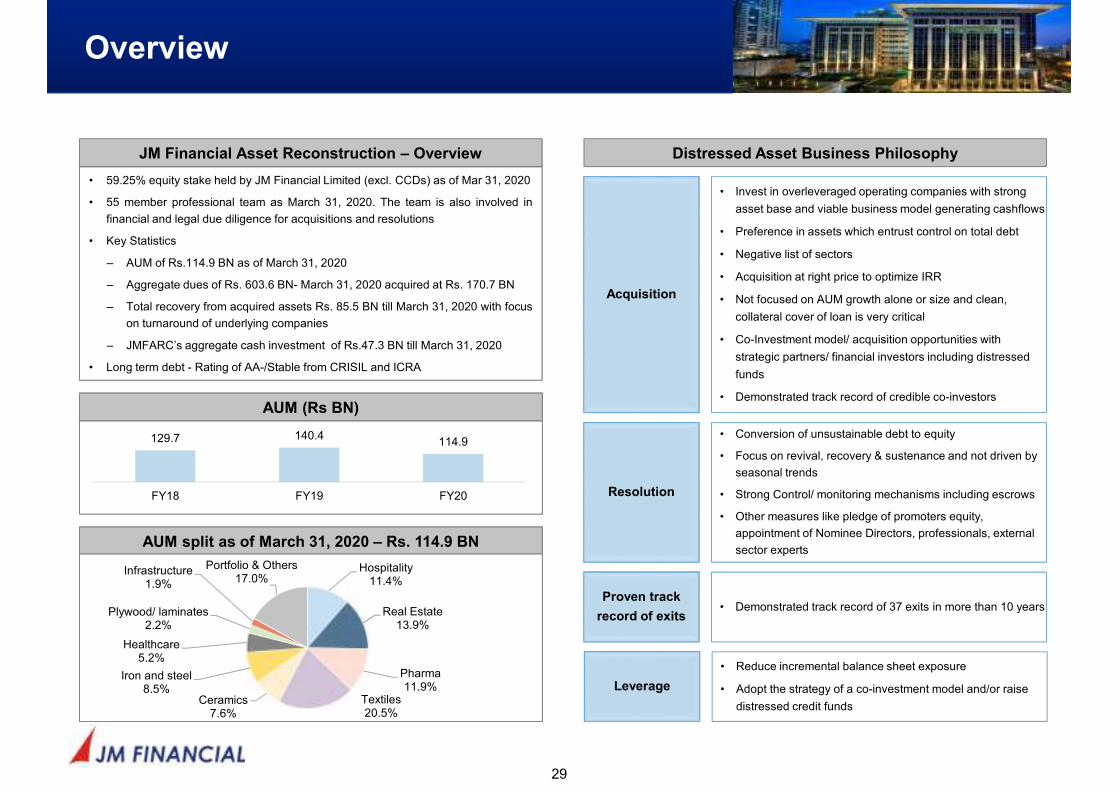
Overview
29
JM Financial Asset Reconstruction – Overview
• 59.25% equity stake held by JM Financial Limited (excl. CCDs) as of Mar 31, 2020
• 55 member professional team as March 31, 2020. The team is also involved in
financial and legal due diligence for acquisitions and resolutions
• Key Statistics
– AUM of Rs.114.9 BN as of March 31, 2020
– Aggregate dues of Rs. 603.6 BN- March 31, 2020 acquired at Rs. 170.7 BN
– Total recovery from acquired assets Rs. 85.5 BN till March 31, 2020 with focus
on turnaround of underlying companies
– JMFARC’s aggregate cash investment of Rs.47.3 BN till March 31, 2020
• Long term debt - Rating of AA-/Stable from CRISIL and ICRA
AUM (Rs BN)
129.7 140.4114.9
FY18 FY19 FY20
AUM split as of March 31, 2020 – Rs. 114.9 BN
Hospitality11.4%
Real Estate13.9%
Pharma11.9%
Textiles20.5%
Ceramics7.6%
Iron and steel8.5%
Healthcare5.2%
Plywood/ laminates2.2%
Infrastructure1.9%
Portfolio & Others17.0%
Distressed Asset Business Philosophy
Acquisition
• Invest in overleveraged operating companies with strong
asset base and viable business model generating cashflows
• Preference in assets which entrust control on total debt
• Negative list of sectors
• Acquisition at right price to optimize IRR
• Not focused on AUM growth alone or size and clean,
collateral cover of loan is very critical
• Co-Investment model/ acquisition opportunities with
strategic partners/ financial investors including distressed
funds
• Demonstrated track record of credible co-investors
Resolution
• Conversion of unsustainable debt to equity
• Focus on revival, recovery & sustenance and not driven by
seasonal trends
• Strong Control/ monitoring mechanisms including escrows
• Other measures like pledge of promoters equity,
appointment of Nominee Directors, professionals, external
sector experts
Proven track
record of exits• Demonstrated track record of 37 exits in more than 10 years
Leverage
• Reduce incremental balance sheet exposure
• Adopt the strategy of a co-investment model and/or raise
distressed credit funds
Financial Performance
30
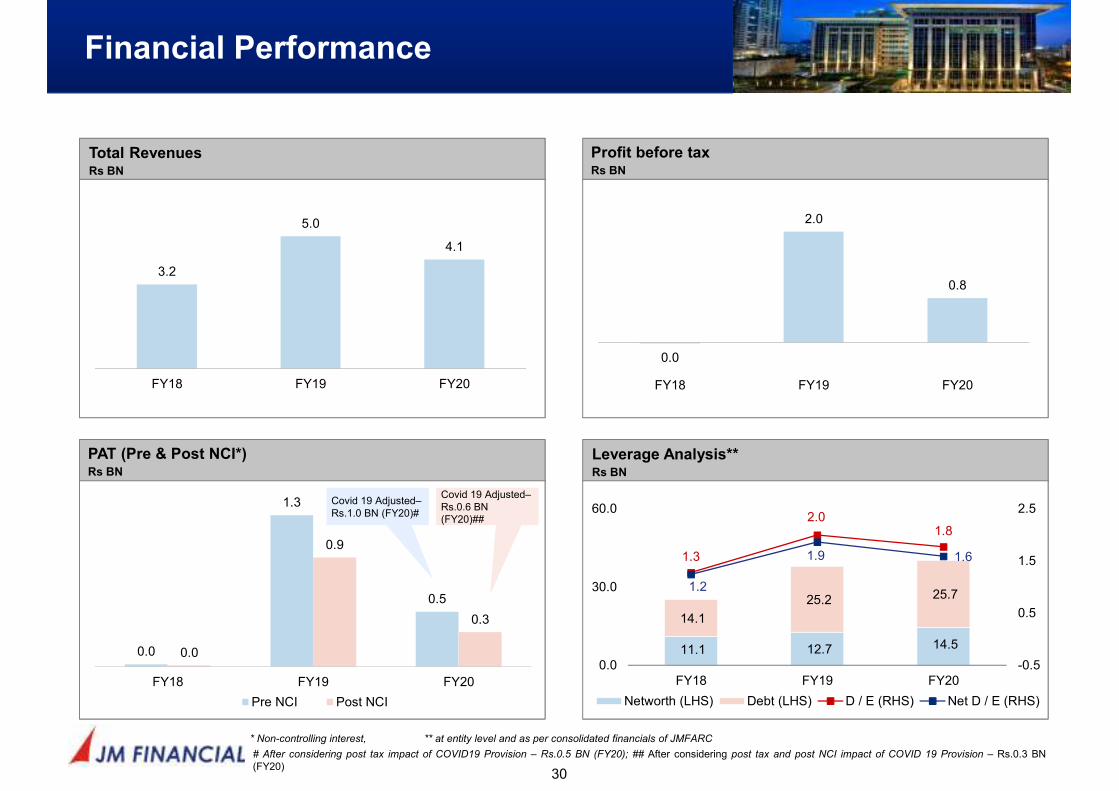
** at entity level and as per consolidated financials of JMFARC* Non-controlling interest,
Total RevenuesRs BN
3.2
5.0
4.1
FY18 FY19 FY20
PAT (Pre & Post NCI*)Rs BN
0.0
1.3
0.5
0.0
0.9
0.3
FY18 FY19 FY20
Pre NCI Post NCI
Profit before taxRs BN
0.0
2.0
0.8
FY18 FY19 FY20
Leverage Analysis**Rs BN
11.1 12.7 14.5
14.1
25.2 25.7
1.3
2.01.8
1.2
1.9 1.6
-0.5
0.5
1.5
2.5
0.0
30.0
60.0
FY18 FY19 FY20
Networth (LHS) Debt (LHS) D / E (RHS) Net D / E (RHS)
Covid 19 Adjusted–Rs.1.0 BN (FY20)#
Covid 19 Adjusted–Rs.0.6 BN (FY20)##
# After considering post tax impact of COVID19 Provision – Rs.0.5 BN (FY20); ## After considering post tax and post NCI impact of COVID 19 Provision – Rs.0.3 BN(FY20)

Asset Management
Tab D
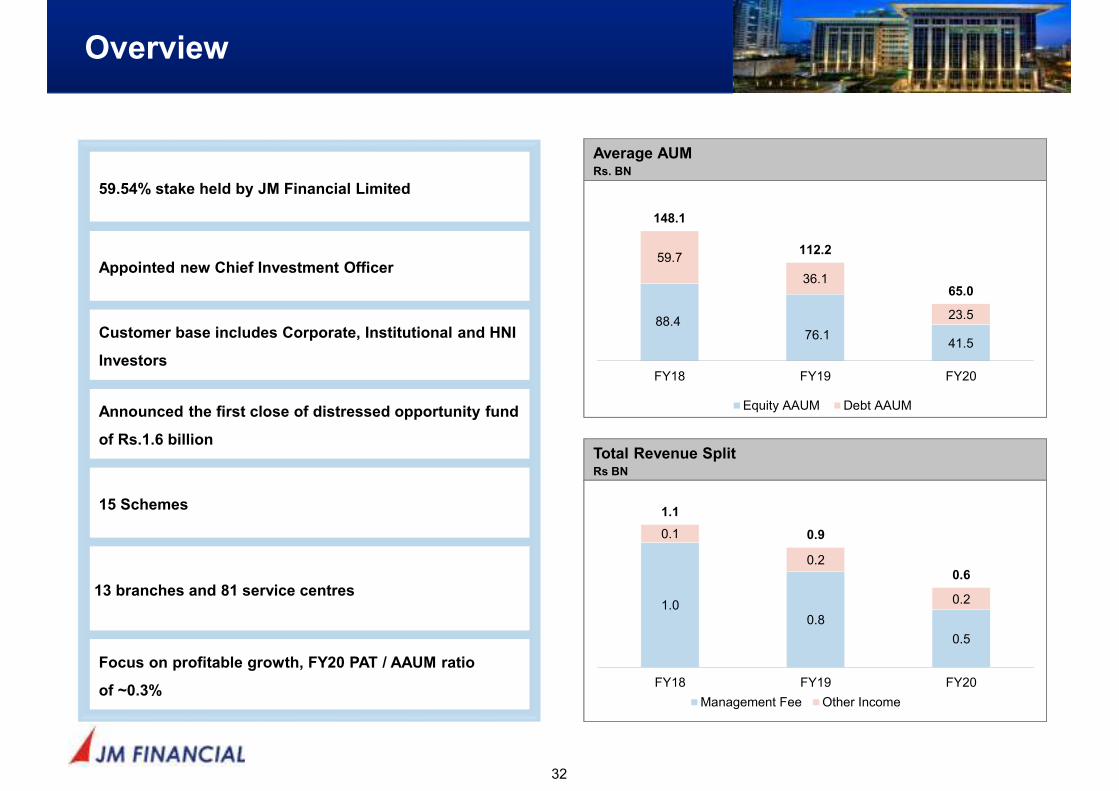
Overview
32
Average AUMRs. BN
Total Revenue SplitRs BN
88.476.1
41.5
59.7
36.1
23.5
148.1
112.2
65.0
FY18 FY19 FY20
Equity AAUM Debt AAUM
1.00.8
0.5
0.1
0.2
0.2
1.1
0.9
0.6
FY18 FY19 FY20
Management Fee Other Income
59.54% stake held by JM Financial Limited
Appointed new Chief Investment Officer
Customer base includes Corporate, Institutional and HNI
Investors
Announced the first close of distressed opportunity fund
of Rs.1.6 billion
15 Schemes
Focus on profitable growth, FY20 PAT / AAUM ratio
of ~0.3%
13 branches and 81 service centres
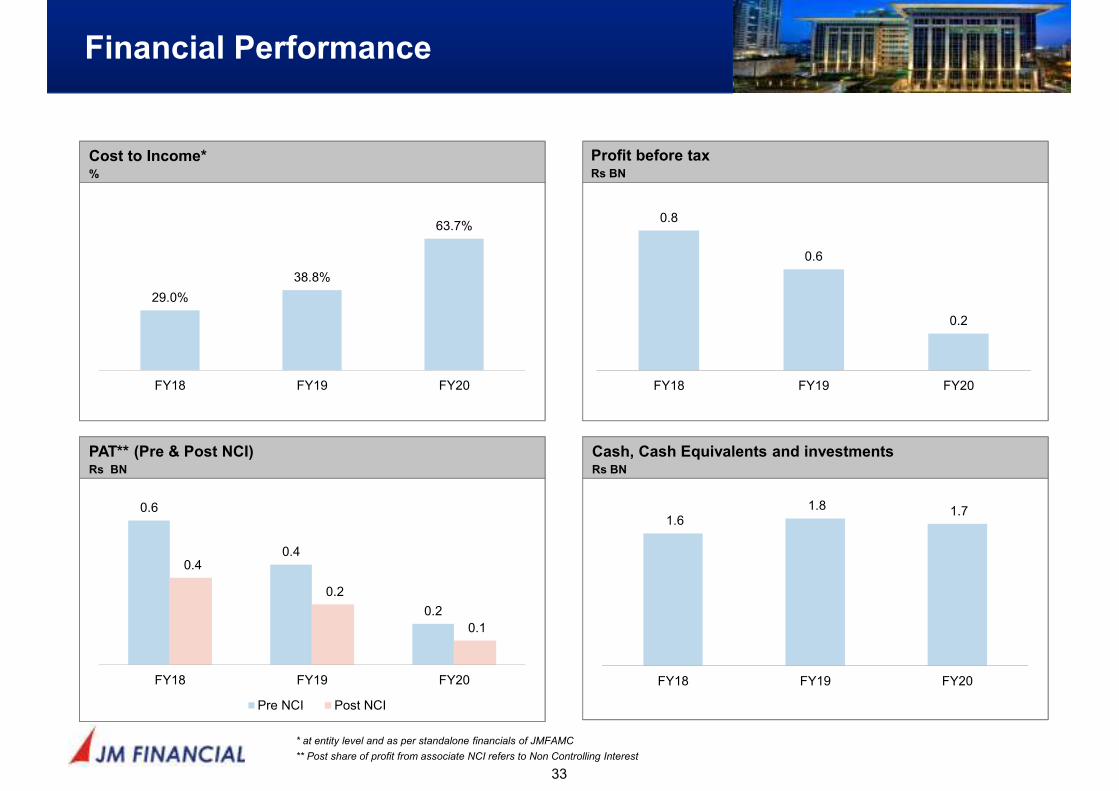
Financial Performance
33
Cost to Income*%
29.0%
38.8%
63.7%
FY18 FY19 FY20
PAT** (Pre & Post NCI)Rs BN
0.6
0.4
0.2
0.4
0.2
0.1
FY18 FY19 FY20
Pre NCI Post NCI
Cash, Cash Equivalents and investmentsRs BN
1.6 1.8 1.7
FY18 FY19 FY20
** Post share of profit from associate NCI refers to Non Controlling Interest
Profit before taxRs BN
0.8
0.6
0.2
FY18 FY19 FY20
* at entity level and as per standalone financials of JMFAMC
Financial Performance
Section 4
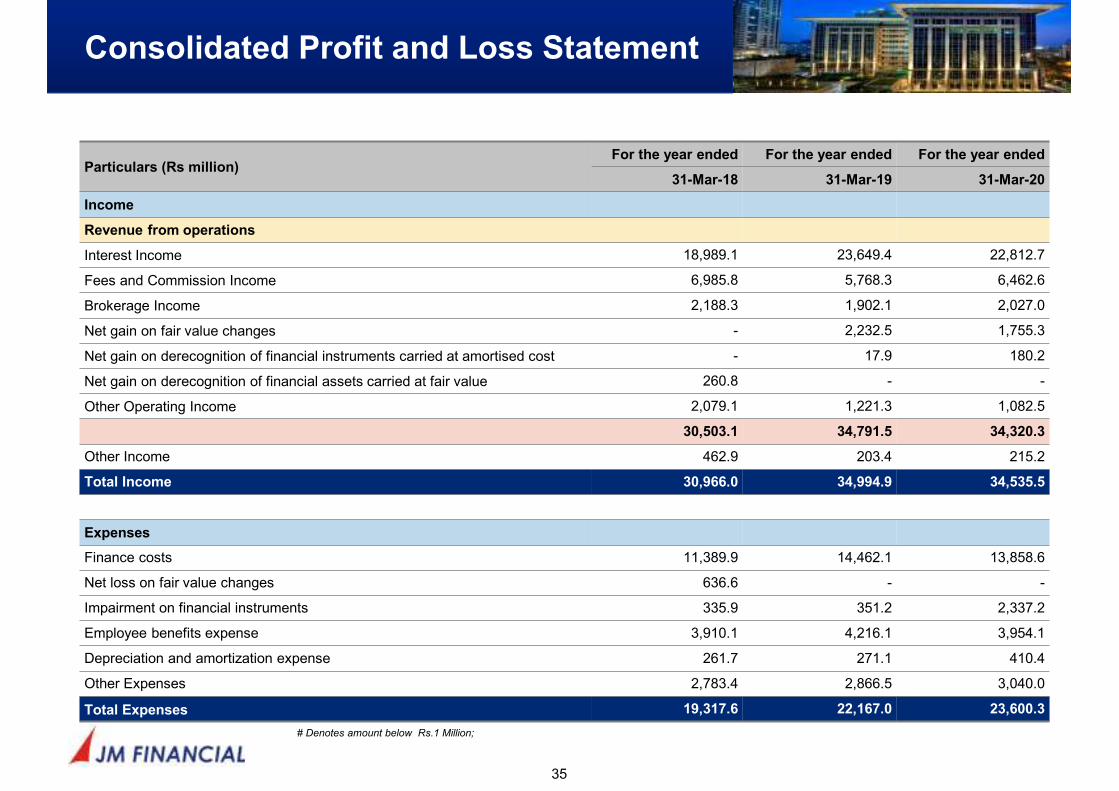
Consolidated Profit and Loss Statement
35
Particulars (Rs million)For the year ended For the year ended For the year ended
31-Mar-18 31-Mar-19 31-Mar-20
Income
Revenue from operations
Interest Income 18,989.1 23,649.4 22,812.7
Fees and Commission Income 6,985.8 5,768.3 6,462.6
Brokerage Income 2,188.3 1,902.1 2,027.0
Net gain on fair value changes - 2,232.5 1,755.3
Net gain on derecognition of financial instruments carried at amortised cost - 17.9 180.2
Net gain on derecognition of financial assets carried at fair value 260.8 - -
Other Operating Income 2,079.1 1,221.3 1,082.5
30,503.1 34,791.5 34,320.3
Other Income 462.9 203.4 215.2
Total Income 30,966.0 34,994.9 34,535.5
Expenses
Finance costs 11,389.9 14,462.1 13,858.6
Net loss on fair value changes 636.6 - -
Impairment on financial instruments 335.9 351.2 2,337.2
Employee benefits expense 3,910.1 4,216.1 3,954.1
Depreciation and amortization expense 261.7 271.1 410.4
Other Expenses 2,783.4 2,866.5 3,040.0
Total Expenses 19,317.6 22,167.0 23,600.3
# Denotes amount below Rs.1 Million;
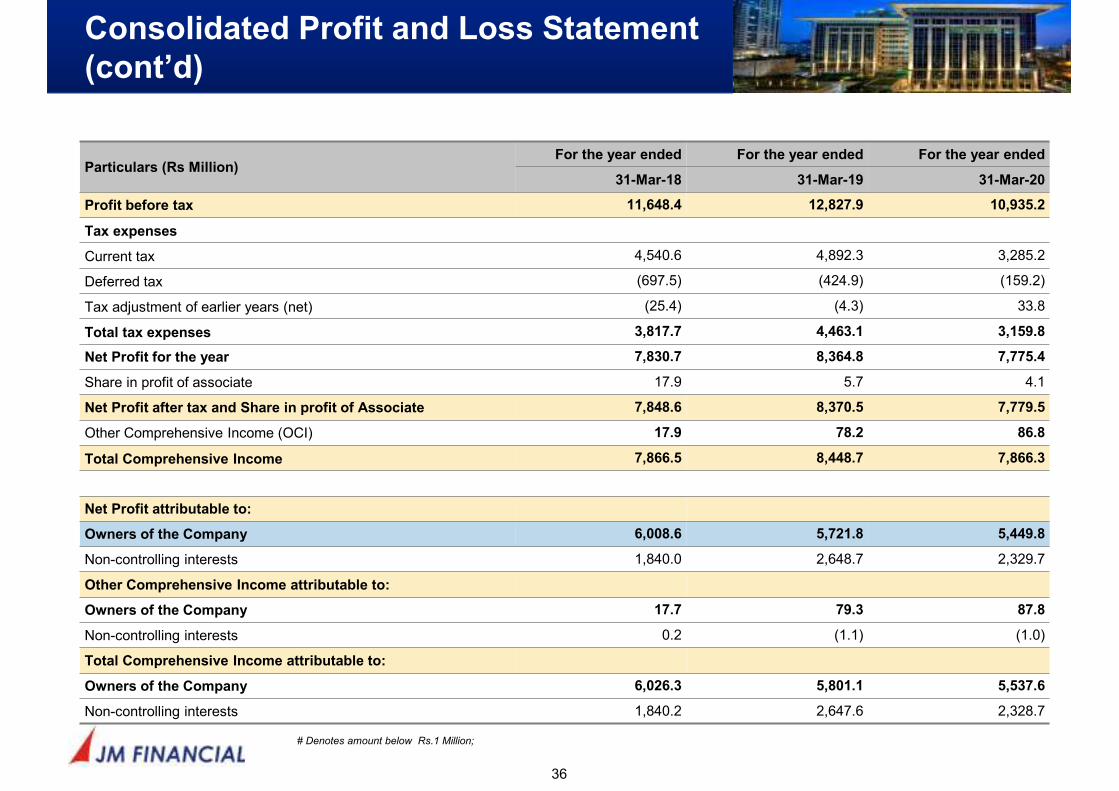
Consolidated Profit and Loss Statement
(cont’d)
36
Particulars (Rs Million)For the year ended For the year ended For the year ended
31-Mar-18 31-Mar-19 31-Mar-20
Profit before tax 11,648.4 12,827.9 10,935.2
Tax expenses
Current tax 4,540.6 4,892.3 3,285.2
Deferred tax (697.5) (424.9) (159.2)
Tax adjustment of earlier years (net) (25.4) (4.3) 33.8
Total tax expenses 3,817.7 4,463.1 3,159.8
Net Profit for the year 7,830.7 8,364.8 7,775.4
Share in profit of associate 17.9 5.7 4.1
Net Profit after tax and Share in profit of Associate 7,848.6 8,370.5 7,779.5
Other Comprehensive Income (OCI) 17.9 78.2 86.8
Total Comprehensive Income 7,866.5 8,448.7 7,866.3
Net Profit attributable to:
Owners of the Company 6,008.6 5,721.8 5,449.8
Non-controlling interests 1,840.0 2,648.7 2,329.7
Other Comprehensive Income attributable to:
Owners of the Company 17.7 79.3 87.8
Non-controlling interests 0.2 (1.1) (1.0)
Total Comprehensive Income attributable to:
Owners of the Company 6,026.3 5,801.1 5,537.6
Non-controlling interests 1,840.2 2,647.6 2,328.7
# Denotes amount below Rs.1 Million;
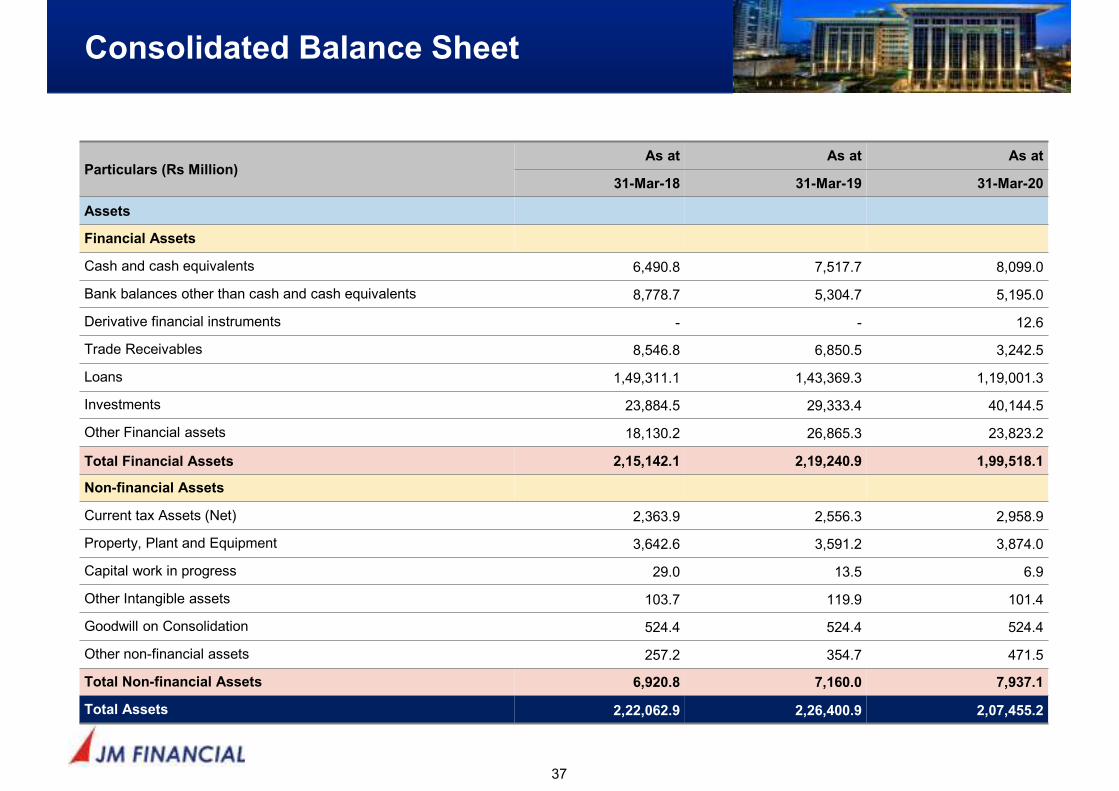
Consolidated Balance Sheet
37
Particulars (Rs Million)As at As at As at
31-Mar-18 31-Mar-19 31-Mar-20
Assets
Financial Assets
Cash and cash equivalents 6,490.8 7,517.7 8,099.0
Bank balances other than cash and cash equivalents 8,778.7 5,304.7 5,195.0
Derivative financial instruments - - 12.6
Trade Receivables 8,546.8 6,850.5 3,242.5
Loans 1,49,311.1 1,43,369.3 1,19,001.3
Investments 23,884.5 29,333.4 40,144.5
Other Financial assets 18,130.2 26,865.3 23,823.2
Total Financial Assets 2,15,142.1 2,19,240.9 1,99,518.1
Non-financial Assets
Current tax Assets (Net) 2,363.9 2,556.3 2,958.9
Property, Plant and Equipment 3,642.6 3,591.2 3,874.0
Capital work in progress 29.0 13.5 6.9
Other Intangible assets 103.7 119.9 101.4
Goodwill on Consolidation 524.4 524.4 524.4
Other non-financial assets 257.2 354.7 471.5
Total Non-financial Assets 6,920.8 7,160.0 7,937.1
Total Assets 2,22,062.9 2,26,400.9 2,07,455.2
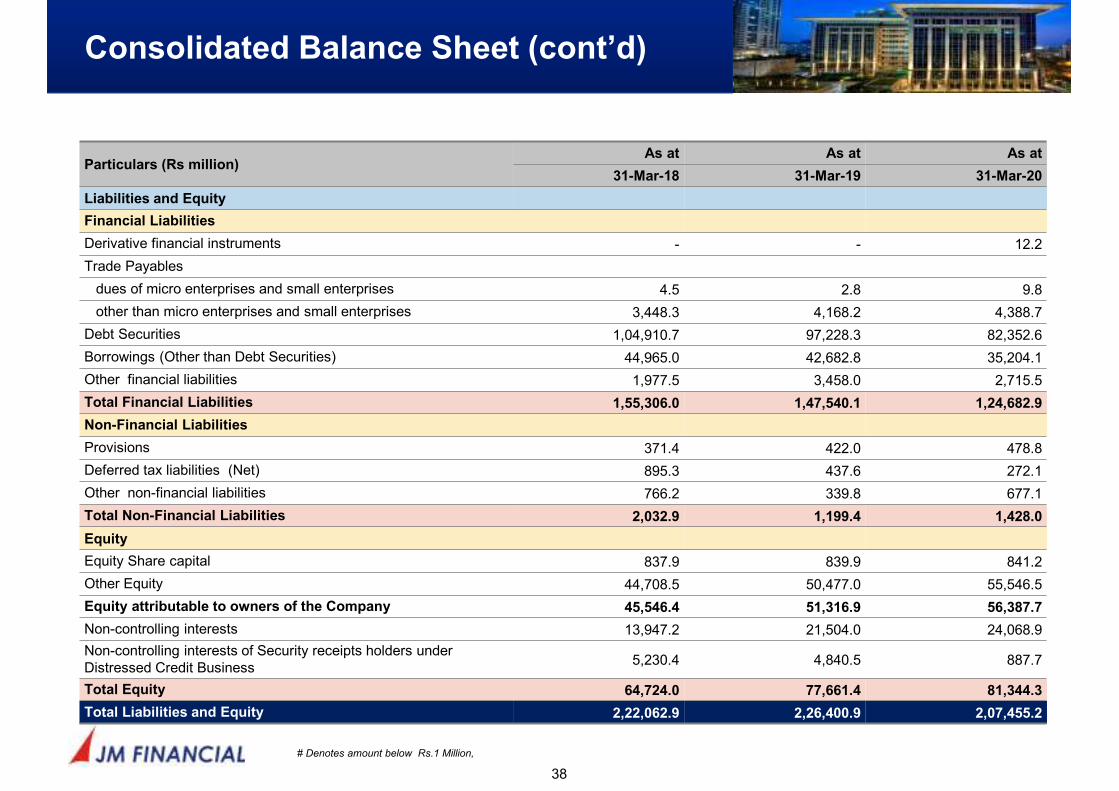
Consolidated Balance Sheet (cont’d)
38
Particulars (Rs million)As at As at As at
31-Mar-18 31-Mar-19 31-Mar-20
Liabilities and Equity
Financial Liabilities
Derivative financial instruments - - 12.2
Trade Payables
dues of micro enterprises and small enterprises 4.5 2.8 9.8
other than micro enterprises and small enterprises 3,448.3 4,168.2 4,388.7
Debt Securities 1,04,910.7 97,228.3 82,352.6
Borrowings (Other than Debt Securities) 44,965.0 42,682.8 35,204.1
Other financial liabilities 1,977.5 3,458.0 2,715.5
Total Financial Liabilities 1,55,306.0 1,47,540.1 1,24,682.9
Non-Financial Liabilities
Provisions 371.4 422.0 478.8
Deferred tax liabilities (Net) 895.3 437.6 272.1
Other non-financial liabilities 766.2 339.8 677.1
Total Non-Financial Liabilities 2,032.9 1,199.4 1,428.0
Equity
Equity Share capital 837.9 839.9 841.2
Other Equity 44,708.5 50,477.0 55,546.5
Equity attributable to owners of the Company 45,546.4 51,316.9 56,387.7
Non-controlling interests 13,947.2 21,504.0 24,068.9
Non-controlling interests of Security receipts holders under Distressed Credit Business
5,230.4 4,840.5 887.7
Total Equity 64,724.0 77,661.4 81,344.3
Total Liabilities and Equity 2,22,062.9 2,26,400.9 2,07,455.2
# Denotes amount below Rs.1 Million,
Financial Performance of Key
Subsidiaries
39
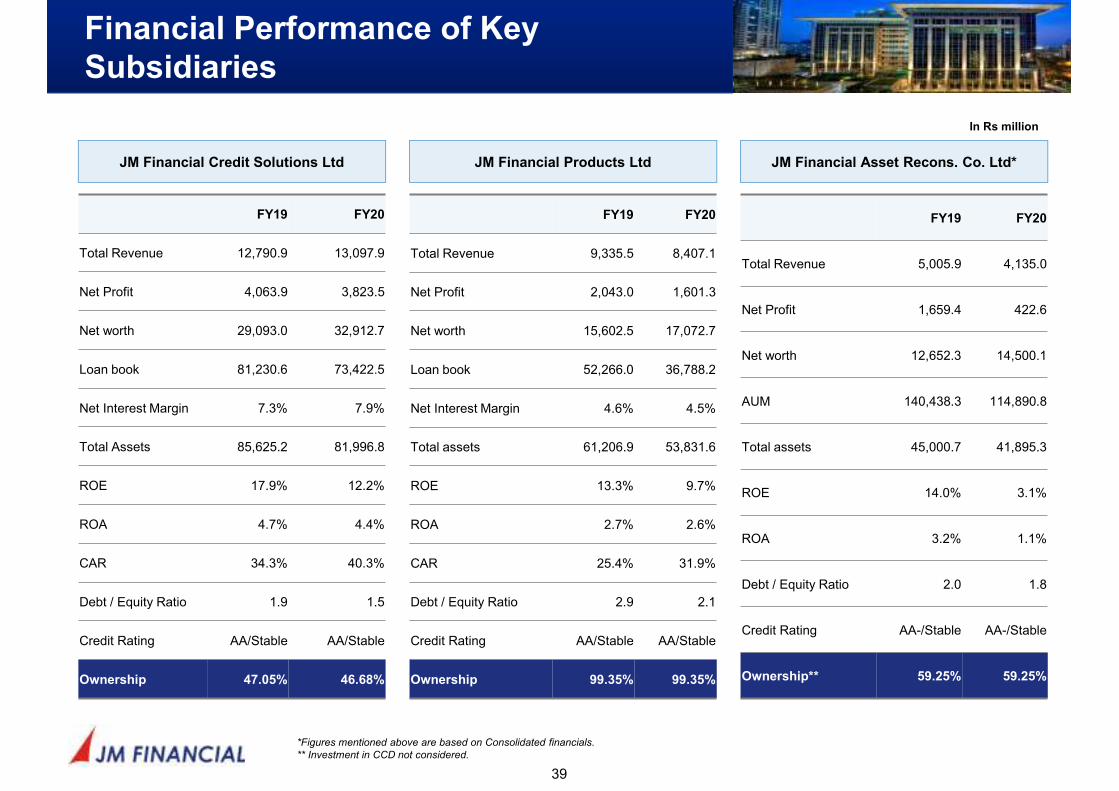
JM Financial Credit Solutions Ltd JM Financial Products Ltd JM Financial Asset Recons. Co. Ltd*
In Rs million
*Figures mentioned above are based on Consolidated financials.
** Investment in CCD not considered.
FY19 FY20
Total Revenue 12,790.9 13,097.9
Net Profit 4,063.9 3,823.5
Net worth 29,093.0 32,912.7
Loan book 81,230.6 73,422.5
Net Interest Margin 7.3% 7.9%
Total Assets 85,625.2 81,996.8
ROE 17.9% 12.2%
ROA 4.7% 4.4%
CAR 34.3% 40.3%
Debt / Equity Ratio 1.9 1.5
Credit Rating AA/Stable AA/Stable
Ownership 47.05% 46.68%
FY19 FY20
Total Revenue 9,335.5 8,407.1
Net Profit 2,043.0 1,601.3
Net worth 15,602.5 17,072.7
Loan book 52,266.0 36,788.2
Net Interest Margin 4.6% 4.5%
Total assets 61,206.9 53,831.6
ROE 13.3% 9.7%
ROA 2.7% 2.6%
CAR 25.4% 31.9%
Debt / Equity Ratio 2.9 2.1
Credit Rating AA/Stable AA/Stable
Ownership 99.35% 99.35%
FY19 FY20
Total Revenue 5,005.9 4,135.0
Net Profit 1,659.4 422.6
Net worth 12,652.3 14,500.1
AUM 140,438.3 114,890.8
Total assets 45,000.7 41,895.3
ROE 14.0% 3.1%
ROA 3.2% 1.1%
Debt / Equity Ratio 2.0 1.8
Credit Rating AA-/Stable AA-/Stable
Ownership** 59.25% 59.25%

Board of Directors
Section 5

Board of Directors
41
Mr. E. A. Kshirsagar, Independent Director
• Mr. Kshirsagar has been a Director in JM Financial Limited
since May, 2004
• Mr. Kshirsagar serves as a director on the board of directors
of several companies such as JM Financial Products
Limited, Hawkins Cookers Limited, Batliboi Limited and
Manipal Global Education Services Private Limited
Dr. Vijay Kelkar, Independent Director
• Mr. Kelkar has been a Director in JM Financial Limited since
March, 2010
• Serves as a director on the board of directors of several
companies such as JM Financial Asset Reconstruction
Company Limited, National Bulk Handling Corporation
Private Limited, Avanti Finance Private Limited, Avanti
Microfinance Private Limited and Go Airlines (India) Limited
Mr. Darius E. Udwadia, Independent Director
• Mr. Udwadia has been a Director in JM Financial Limited
since June, 2006
• Mr. Udwadia serves as a director on the board of directors
of several companies such as JM Financial Credit Solutions
Limited, Quantum Advisors Private Limited, ABB India
Limited and Concast (India) Private Limited
Mr. Keki Dadiseth, Independent Director
• Mr. Dadiseth has been a Director in JM Financial Limited
since October, 2012
• Mr. Dadiseth is on the board of directors of several
companies such as Britannia Industries Limited, Piramal
Enterprises Limited and Godrej Properties Limited
Mr. Paul Zuckerman, Independent Director
• Mr. Zuckerman has been a Director in JM Financial Limited
since October, 2007
Ms. Jagi Panda, Independent Director
• Ms. Panda has been a Director in JM Financial Limited
since March, 2015
• Ms. Panda is on the board of directors of several companies
such as Ortel Communications Limited, Metro Skynet
Limited and Odisha Television Limited
Mr. Nimesh Kampani, Chairman
• Non-Executive Chairman of JM Financial Limited.
• Mr. Kampani has been a Director in our Company since
June, 1987
Mr. Vishal Kampani, Managing Director
• Managing Director of JM Financial Limited since October
2016
• Instrumental in the launch of the Asset Reconstruction
business, Real Estate Finance business, building a global
profile and expansion of international operations.

ALM of Lending Companies
Annexure I
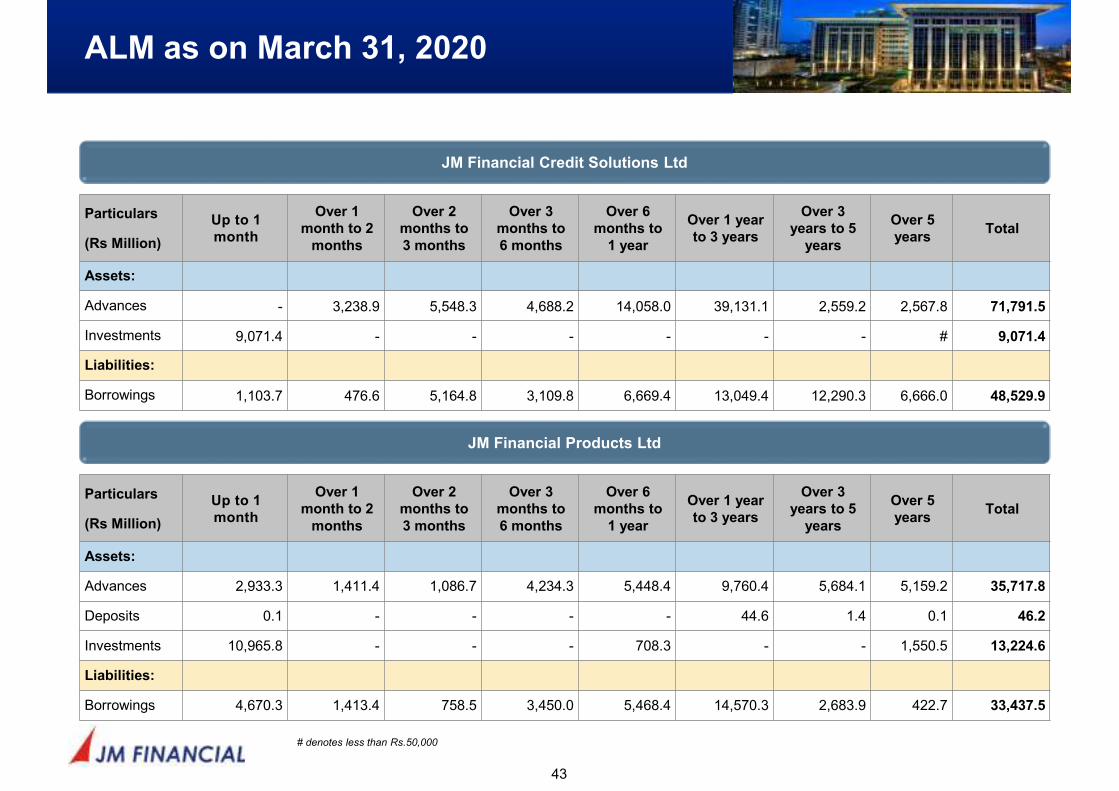
ALM as on March 31, 2020
43
Particulars
(Rs Million)
Up to 1
month
Over 1
month to 2
months
Over 2
months to
3 months
Over 3
months to
6 months
Over 6
months to
1 year
Over 1 year
to 3 years
Over 3
years to 5
years
Over 5
yearsTotal
Assets:
Advances - 3,238.9 5,548.3 4,688.2 14,058.0 39,131.1 2,559.2 2,567.8 71,791.5
Investments 9,071.4 - - - - - - # 9,071.4
Liabilities:
Borrowings 1,103.7 476.6 5,164.8 3,109.8 6,669.4 13,049.4 12,290.3 6,666.0 48,529.9
JM Financial Credit Solutions Ltd
JM Financial Products Ltd
Particulars
(Rs Million)
Up to 1
month
Over 1
month to 2
months
Over 2
months to
3 months
Over 3
months to
6 months
Over 6
months to
1 year
Over 1 year
to 3 years
Over 3
years to 5
years
Over 5
yearsTotal
Assets:
Advances 2,933.3 1,411.4 1,086.7 4,234.3 5,448.4 9,760.4 5,684.1 5,159.2 35,717.8
Deposits 0.1 - - - - 44.6 1.4 0.1 46.2
Investments 10,965.8 - - - 708.3 - - 1,550.5 13,224.6
Liabilities:
Borrowings 4,670.3 1,413.4 758.5 3,450.0 5,468.4 14,570.3 2,683.9 422.7 33,437.5
# denotes less than Rs.50,000
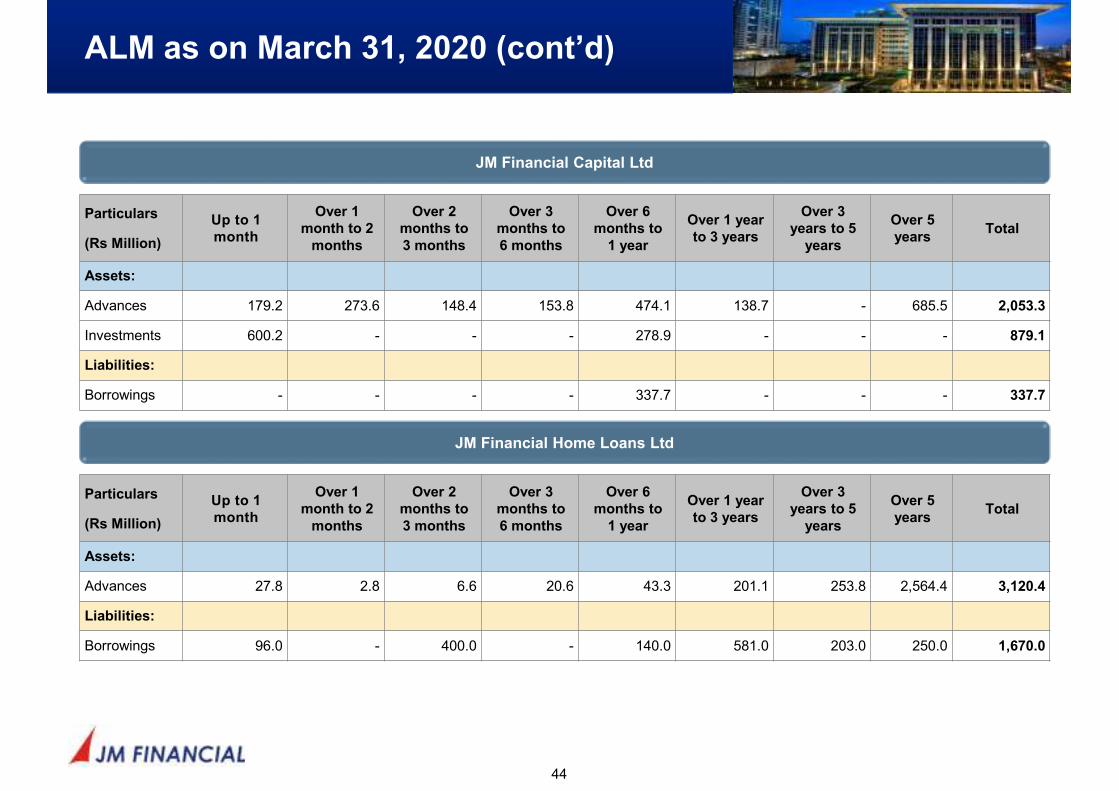
ALM as on March 31, 2020 (cont’d)
44
Particulars
(Rs Million)
Up to 1
month
Over 1
month to 2
months
Over 2
months to
3 months
Over 3
months to
6 months
Over 6
months to
1 year
Over 1 year
to 3 years
Over 3
years to 5
years
Over 5
yearsTotal
Assets:
Advances 179.2 273.6 148.4 153.8 474.1 138.7 - 685.5 2,053.3
Investments 600.2 - - - 278.9 - - - 879.1
Liabilities:
Borrowings - - - - 337.7 - - - 337.7
JM Financial Capital Ltd
JM Financial Home Loans Ltd
Particulars
(Rs Million)
Up to 1
month
Over 1
month to 2
months
Over 2
months to
3 months
Over 3
months to
6 months
Over 6
months to
1 year
Over 1 year
to 3 years
Over 3
years to 5
years
Over 5
yearsTotal
Assets:
Advances 27.8 2.8 6.6 20.6 43.3 201.1 253.8 2,564.4 3,120.4
Liabilities:
Borrowings 96.0 - 400.0 - 140.0 581.0 203.0 250.0 1,670.0

JM Financial – Group Structure
Annexure II
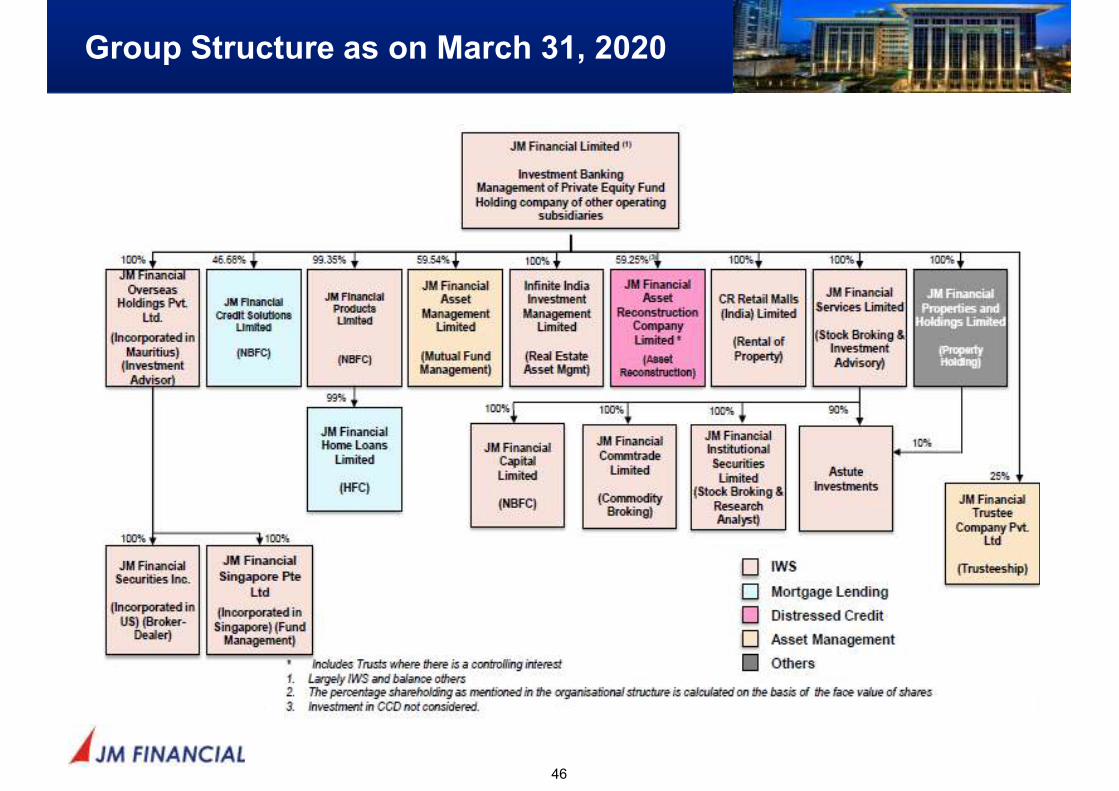
Group Structure as on March 31, 2020
46
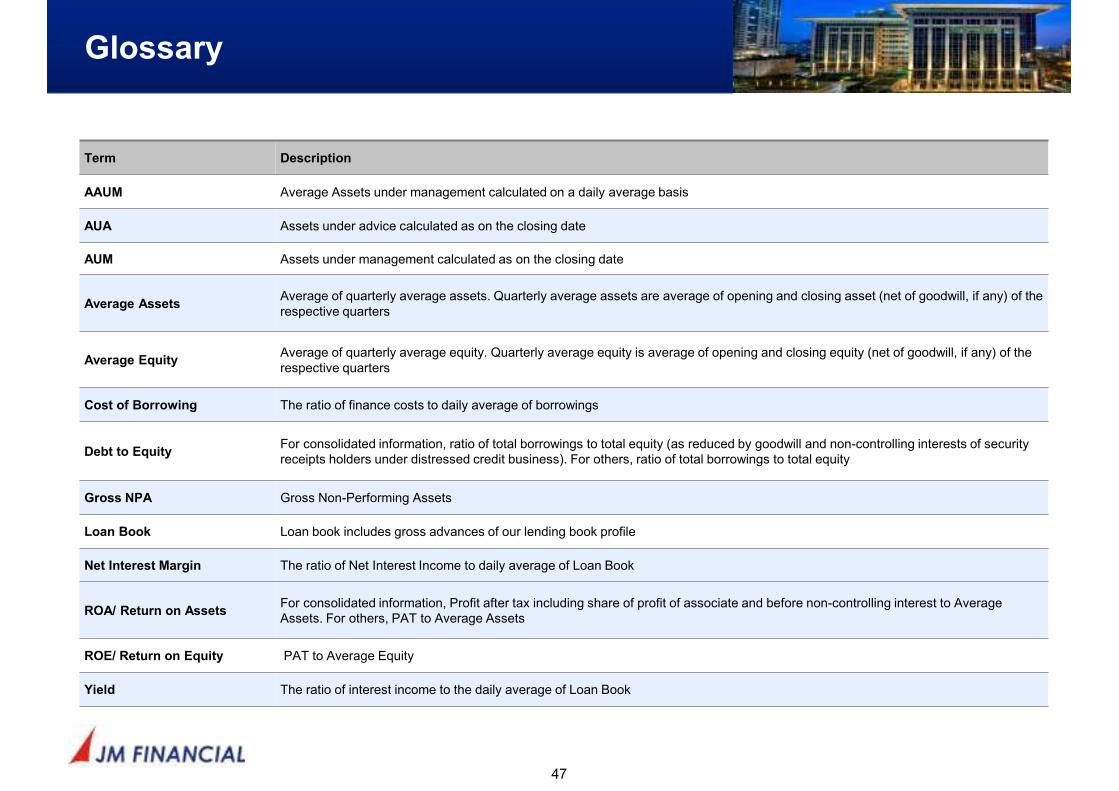
Glossary
47
Term Description
AAUM Average Assets under management calculated on a daily average basis
AUA Assets under advice calculated as on the closing date
AUM Assets under management calculated as on the closing date
Average AssetsAverage of quarterly average assets. Quarterly average assets are average of opening and closing asset (net of goodwill, if any) of the respective quarters
Average EquityAverage of quarterly average equity. Quarterly average equity is average of opening and closing equity (net of goodwill, if any) of the respective quarters
Cost of Borrowing The ratio of finance costs to daily average of borrowings
Debt to EquityFor consolidated information, ratio of total borrowings to total equity (as reduced by goodwill and non-controlling interests of security receipts holders under distressed credit business). For others, ratio of total borrowings to total equity
Gross NPA Gross Non-Performing Assets
Loan Book Loan book includes gross advances of our lending book profile
Net Interest Margin The ratio of Net Interest Income to daily average of Loan Book
ROA/ Return on AssetsFor consolidated information, Profit after tax including share of profit of associate and before non-controlling interest to Average Assets. For others, PAT to Average Assets
ROE/ Return on Equity PAT to Average Equity
Yield The ratio of interest income to the daily average of Loan Book