Embed Size (px)
Citation preview
ENVIRONMENTAL RESOURCES MANAGEMENT BURGAN CAPE TERMINALS FEIR
6-1
6 ENVIRONMENTAL BASELINE
6.1 INTRODUCTION
The environment consists of the entire complexity of interacting geological, biological, social, economic and cultural factors, which influence the lives of individuals and communities. It is thus essential that the effects of any proposed development on all aspects of the environment be assessed before a decision to proceed is taken. The biophysical baseline conditions of the study area for this EIA are described in this section.
6.2 CLIMATE
The City of Cape Town has a Mediterranean climate and receives approximately 788mm of rain per year. The rainfall values for Cape Town per month are lowest in February (15mm) and highest in June (140mm). The monthly distribution of average daily maximum temperatures shows that the average midday temperatures for Cape Town range from 15.5°C in July to 25.9°C in February. The region is the coldest during July when the mercury drops to 7.4°C on average during the night (1). Summers are warm and dry. During summer months, November through February, the Peninsula is exposed to the strong South-Easterly winds known locally as the Cape Doctor (2). Turbulent, high-velocity winds such as pre-cold front north westerly winds help to dilute air pollutants at their source and disperse them as they travel downwind. Gentle breezes however, under stable atmospheric conditions do little to dilute and disperse air pollution. Cold, gentle winds in the area flow down slope on calm nights under clear skies, flowing into hollows and down valleys. These winds travel at less than one metre per second. Walls, steep embankments and tree plantations can impede this air, causing this air to mix it with the air above it, assisting in reducing the impact on air quality. Minimum requirements for dispersion modelling include knowledge of the wind speed, wind direction, atmospheric turbulence parameters, the ambient temperature and the mixing height. The atmospheric boundary during the day is normally unstable, as a result of the sun’s heating effect on the Earth’s surface. Thickness of the mixing height depends strongly on solar radiation, amongst other parameters. This mixing layer gradually increases in height from sunrise, to reach a maximum at about five to six hours after sunrise. Cloudy conditions, surface and upper air temperatures also affect final mixing height and its growth. During these conditions, dispersion plumes can be
(1) http://www.saexplorer.co.za/south-africa/climate/cape_town_climate.asp (2) http://cybercapetown.com/CapeTown/climate.php
ENVIRONMENTAL RESOURCES MANAGEMENT BURGAN CAPE TERMINALS FEIR
6-2
trapped in this layer and result in high ground-level concentrations. This dispersion process is known as Fumigation and is more pronounced during the winter months due to strong night-time inversions, weak wind conditions and slower developing mixing layers. Dispersion models require atmospheric condition to be categorised into one of six stability classes, which are shown in Table 6.1.
Table 6.1 Meteorological Conditions Represented by the Stability Categories
Stability Category Meteorological Conditions Occurrence A Very Unstable Hot daytime conditions, clear skies, calm
wind B Unstable Daytime conditions, clear skies C Slightly Unstable Daytime conditions, moderate winds,
slightly overcast D Neutral Day and night, high winds or cloudy
conditions E Stable Night-time, moderate winds, slightly
overcast conditions F Very Stable Night-time, low winds, clear skies, cold
conditions
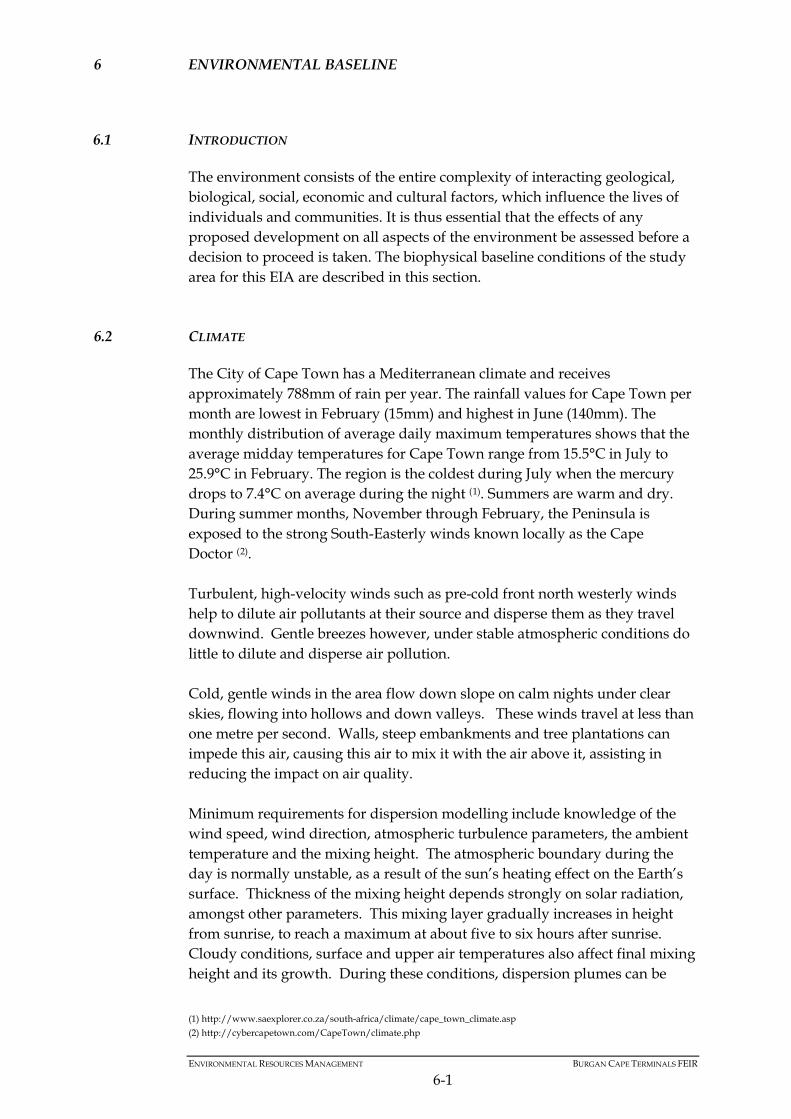
The Department of Environmental Affairs and Development Planning (DEADP) owns a set of model-ready meteorological data for the Western Cape. This set of data was generated by utilising a prognostic meso-scale model called Weather Research and Forecast Model (WRF). The WRF modelling resolution was 3km. The modelled data with centre point located at -33.911720° (latitude) and 18.454020° (longitude) was obtained from DEADP and utilised in the dispersion modelling. It is about 1.5 km east of the site. Five years (2006-2010) of hourly surface and upper air meteorological data was acquired. The wind characteristics for the site are illustrated in Figure 6.1to Figure 6.8 below with the aid of wind roses and wind speed frequency distribution charts. Wind directions are shown as from where the wind blows; wind classes are indicated by the coloured bars and frequencies of occurrence of the wind are indicated by the dashed circles. Wind roses were generated for 16 cardinal wind directions. Figure 6.1 depicts the wind roses of all hours, daytime and night-time of the combined weather data. The data show that the most predominant wind in the area is from the south easterly direction. The second predominant wind is from the north westerly direction. The occurrence of south easterly wind was approximately 28 percent of the time for all hours. The calm or light wind conditions with speeds less than 1 m/s accounted for 3.18 percent of total hours. The daytime and night-time wind patterns were similar. Wind speed frequency distributions for all hours, daytime and night-time are shown in Figure 6.2. The majority of winds were with speeds of between 0.5 m/s and 8.8 m/s for all hours. Calm conditions and strong winds (>8.8 m/s)
ENVIRONMENTAL RESOURCES MANAGEMENT BURGAN CAPE TERMINALS FEIR
6-3
accounted for 3.2 percent and 6.9 percent of the time for night-time and daytime respectively. Wind speeds are generally higher during the day. The average wind speeds during daytime and night-time were 4.4 m/s and 4.0 m/s respectively. Wind roses and wind speed frequency distribution were also developed for winter and summer seasons, as shown in Figure 6.3 and Figure 6.4. The wind roses show that, in summer, south easterly winds were predominant, with an approximate 41percent of occurrence. In winter, winds were mainly from the north west, with an occurrence of 59 percent. As expected, winds in summer are stronger than during winter. The average wind speeds in summer and winter were 5.0 m/s and 3.4 m/s respectively. The atmospheric stability category for each hour of the five years was calculated, using the wind speed and solar radiation method. The stability roses and frequency distribution of all hours, daytime and night-time of the combined weather data are show in Figure 6.5 and Figure 6.6. The stability roses display atmospheric conditions with regard to wind direction occurrences. As can be seen from the frequency distribution chart, the atmospheric condition with the highest occurrence was Neutral for all hours. During the five years examined, this condition occurred 29 percent of the time. A Slight Unstable atmospheric condition was the second most frequent category, accounting for 19 percent of the time. During daytime, the dominant atmospheric conditions were Slightly Unstable, Neutral and Unstable, while at night, Neutral to Stable conditions dominated. The atmospheric stability was also examined in terms of winter and summer patterns, as shown in Figure 6.7 and Figure 6.8. In winter, the conditions with similar high percentages were Slightly Unstable, Neutral, Stable and Very Stable. Unstable and Very Unstable conditions occurred about 12 percent and five percent of the time. During summer, the Neutral condition dominated with a 37 percent occurrence, followed by Slightly Unstable and Stable, which occurred 20 percent and 14 percent respectively.
Figure 6.1 Wind Roses for Combined Years 2006 to 2010: All-hours, Daytime and Night-time
NORTH
SOUTH
WEST EAST7%
14%21%
28%35%
WIND SPEED (m/s)
>= 11.1
8.8 - 11.1
5.7 - 8.8
3.6 - 5.7
2.1 - 3.6
0.5 - 2.1
Calms: 4.09%
NORTH
SOUTH
WEST EAST6%
12%18%
24%30%
WIND SPEED (m/s)
>= 11.1
8.8 - 11.1
5.7 - 8.8
3.6 - 5.7
2.1 - 3.6
0.5 - 2.1
Calms: 2.27%All HoursDay time Night-time
NORTH
SOUTH
WEST EAST6%
12%18%
24%30%
WIND SPEED (m/s)
>= 11.1
8.8 - 11.1
5.7 - 8.8
3.6 - 5.7
2.1 - 3.6
0.5 - 2.1
Calms: 3.18%
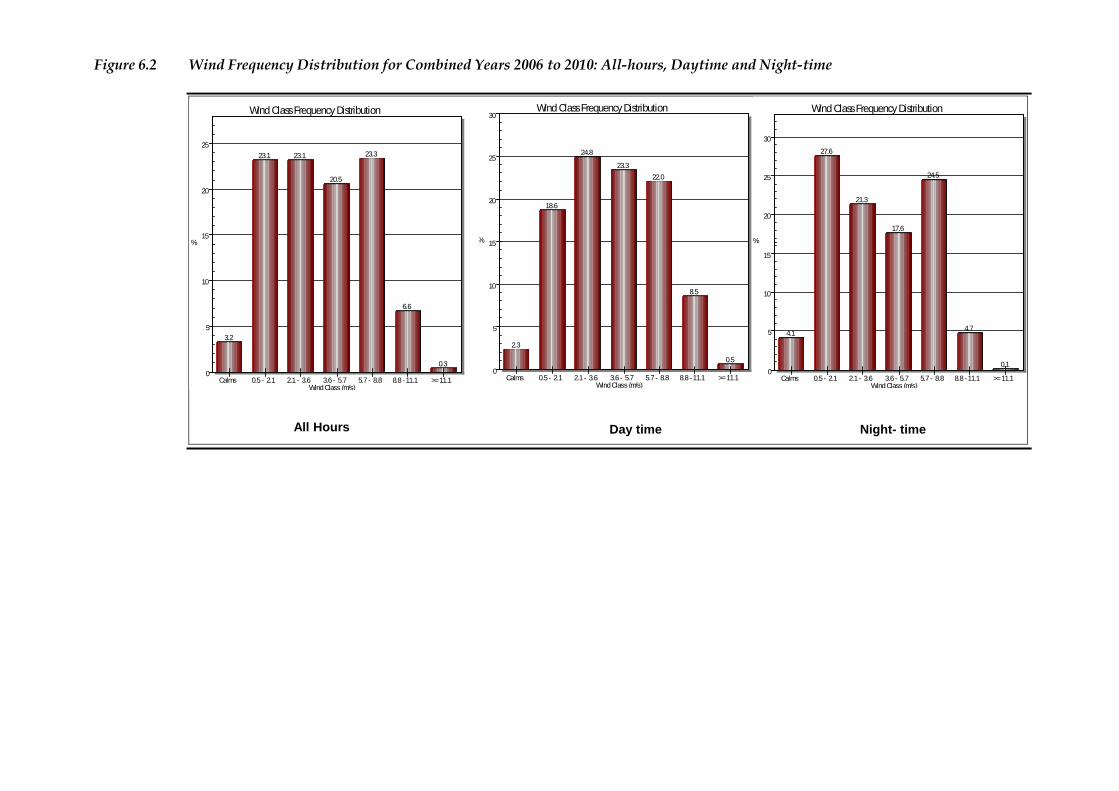
Figure 6.2 Wind Frequency Distribution for Combined Years 2006 to 2010: All-hours, Daytime and Night-time
4.1
27.6
21.3
17.6
24.5
4.7
0.10
5
10
15
20
25
30
%
Wind Class Frequency Distribution
Wind Class (m/s)Calms 0.5 - 2.1 2.1 - 3.6 3.6 - 5.7 5.7 - 8.8 8.8 - 11.1 >= 11.1
2.3
18.6
24.8
23.322.0
8.5
0.50
5
10
15
20
25
30
%
Wind Class Frequency Distribution
Wind Class (m/s)Calms 0.5 - 2.1 2.1 - 3.6 3.6 - 5.7 5.7 - 8.8 8.8 - 11.1 >= 11.1
All Hours Night- timeDay time
3.2
23.1 23.1
20.5
23.3
6.6
0.30
5
10
15
20
25
%
Wind Class Frequency Distribution
Wind Class (m/s)Calms 0.5 - 2.1 2.1 - 3.6 3.6 - 5.7 5.7 - 8.8 8.8 - 11.1 >= 11.1
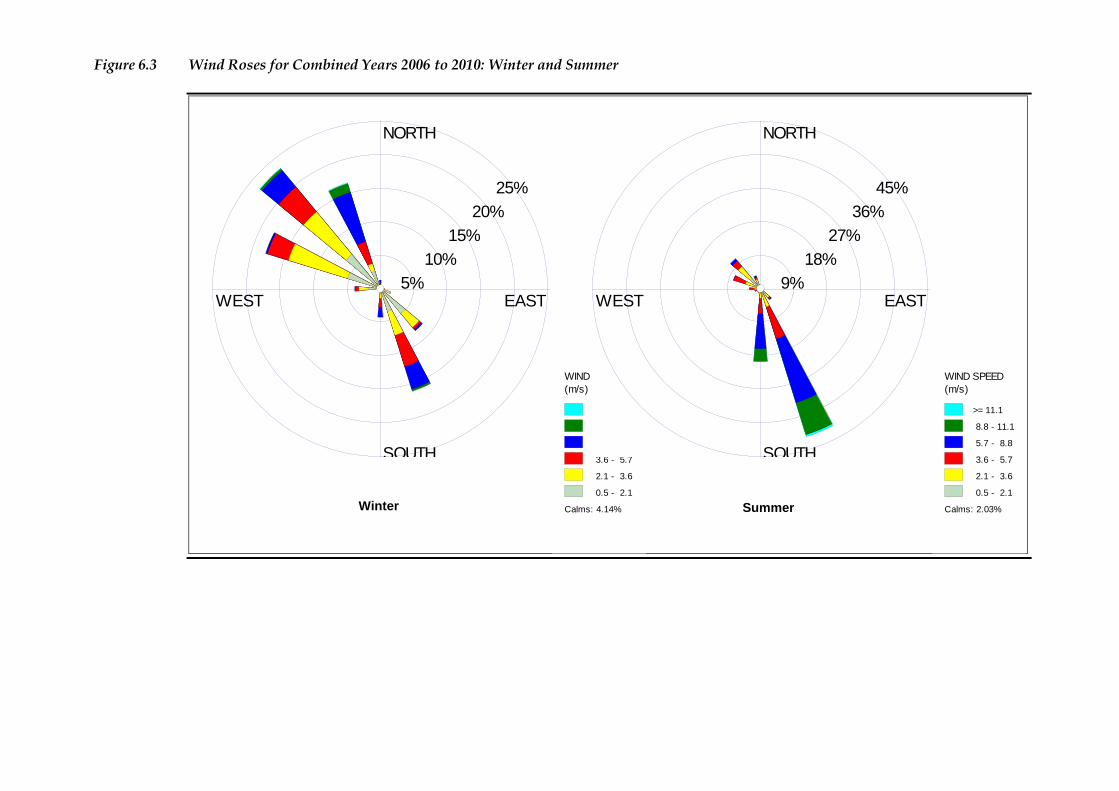
Figure 6.3 Wind Roses for Combined Years 2006 to 2010: Winter and Summer
SummerWinter
NORTH
SOUTH
WEST EAST5%
10%15%
20%25%
WIND SPEED (m/s)
>= 11.1
8.8 - 11.1
5.7 - 8.8
3.6 - 5.7
2.1 - 3.6
0.5 - 2.1
Calms: 4.14%
NORTH
SOUTH
WEST EAST9%
18%27%
36%45%
WIND SPEED (m/s)
>= 11.1
8.8 - 11.1
5.7 - 8.8
3.6 - 5.7
2.1 - 3.6
0.5 - 2.1
Calms: 2.03%
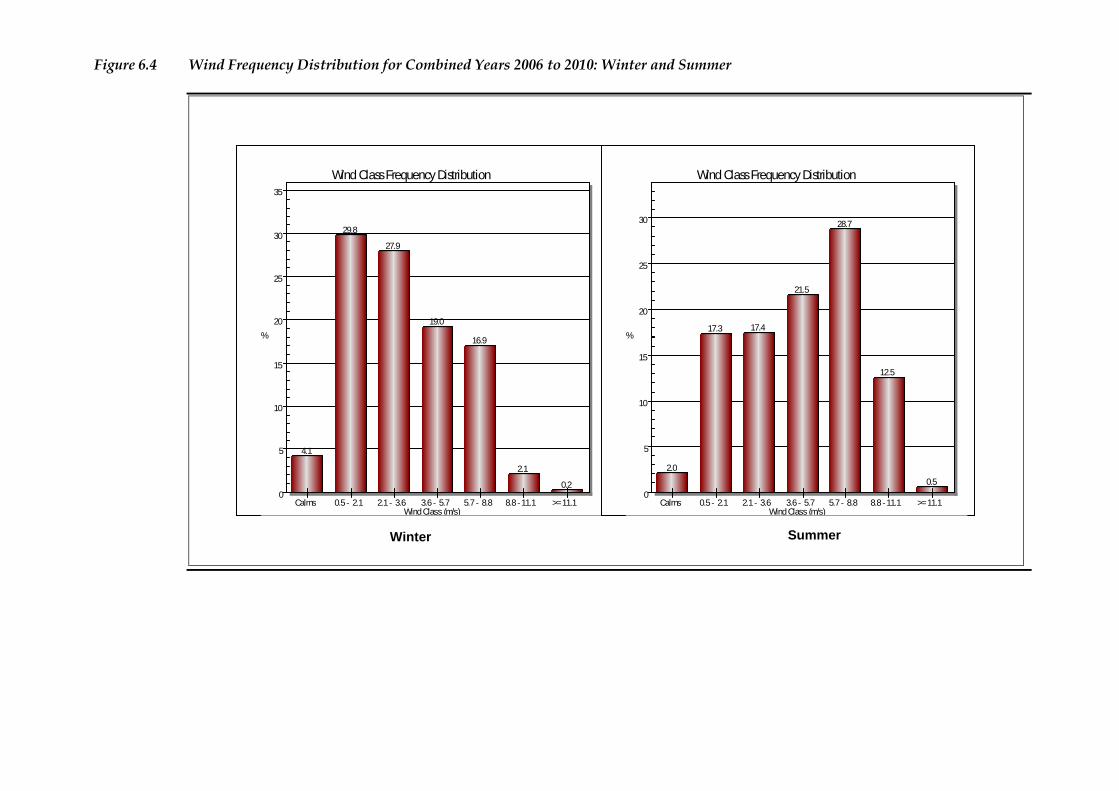
Figure 6.4 Wind Frequency Distribution for Combined Years 2006 to 2010: Winter and Summer
Winter Summer
4.1
29.8
27.9
19.0
16.9
2.1
0.20
5
10
15
20
25
30
35
%
Wind Class Frequency Distribution
Wind Class (m/s)Calms 0.5 - 2.1 2.1 - 3.6 3.6 - 5.7 5.7 - 8.8 8.8 - 11.1 >= 11.1
2.0
17.3 17.4
21.5
28.7
12.5
0.50
5
10
15
20
25
30
%
Wind Class Frequency Distribution
Wind Class (m/s)Calms 0.5 - 2.1 2.1 - 3.6 3.6 - 5.7 5.7 - 8.8 8.8 - 11.1 >= 11.1
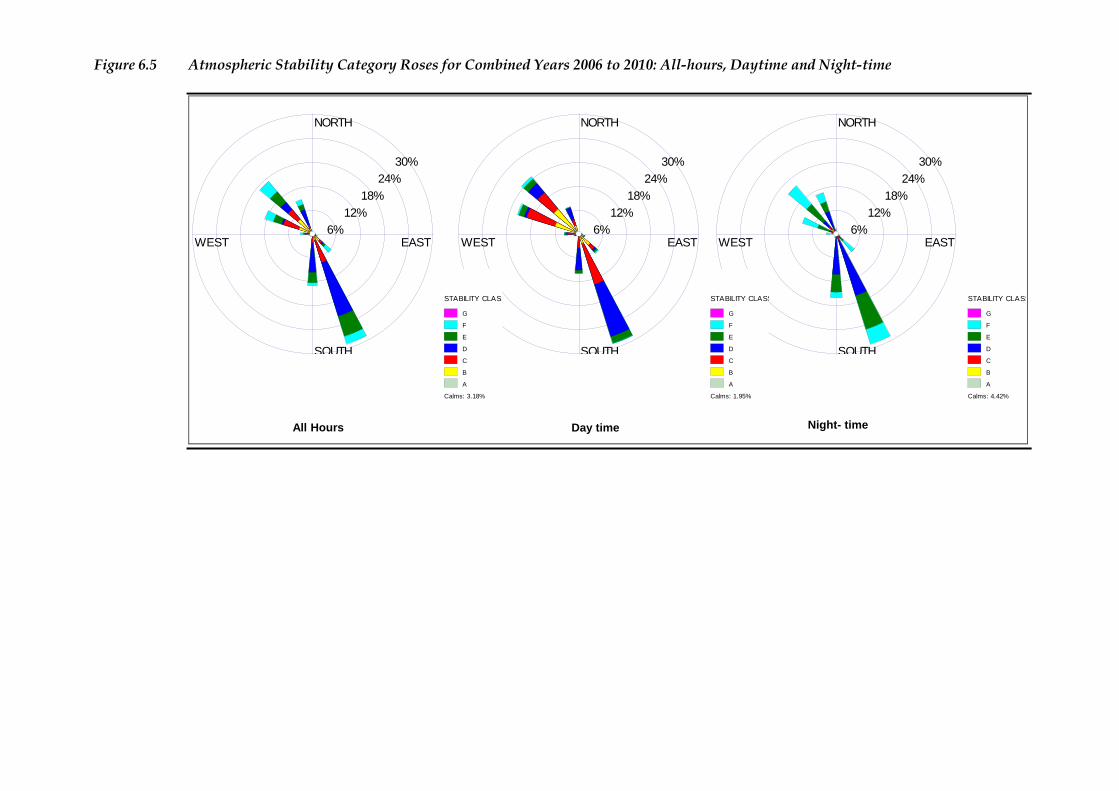
Figure 6.5 Atmospheric Stability Category Roses for Combined Years 2006 to 2010: All-hours, Daytime and Night-time
NORTH
SOUTH
WEST EAST6%
12%18%
24%30%
STABILITY CLASS
G
F
E
D
C
B
A
Calms: 4.42%
NORTH
SOUTH
WEST EAST6%
12%18%
24%30%
STABILITY CLASS
G
F
E
D
C
B
A
Calms: 1.95%
All Hours Day time Night- time
NORTH
SOUTH
WEST EAST6%
12%18%
24%30%
STABILITY CLASS
G
F
E
D
C
B
A
Calms: 3.18%
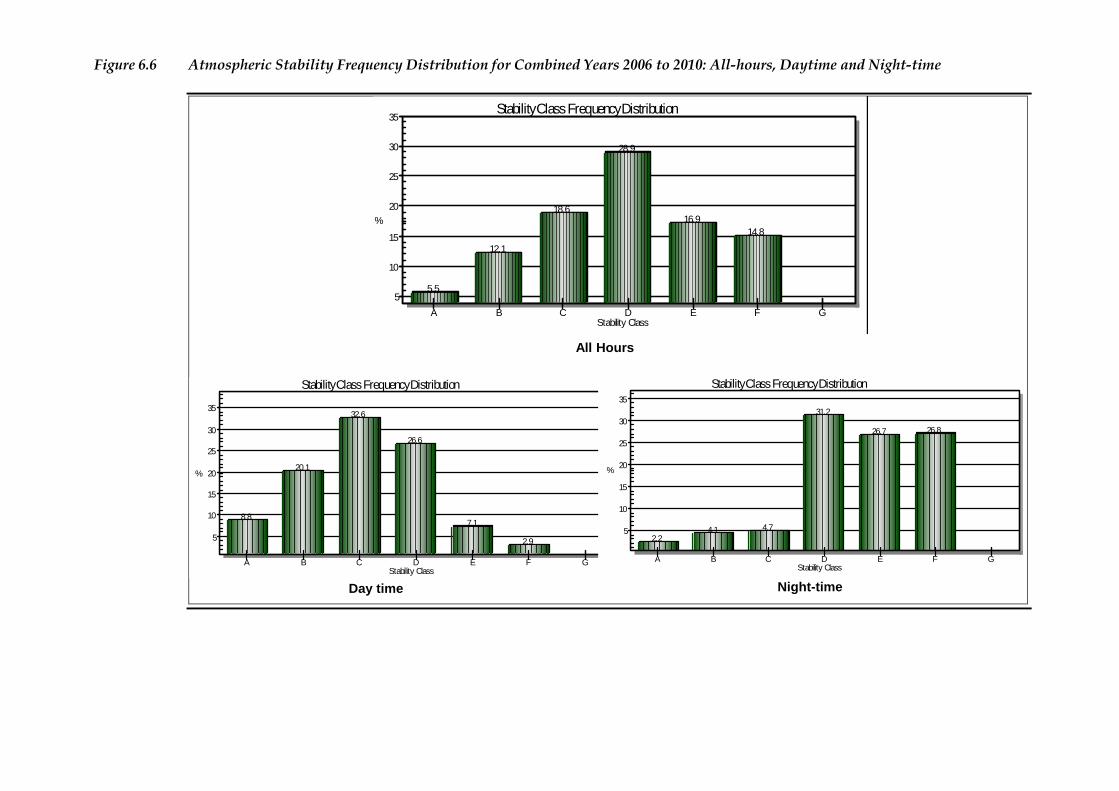
Figure 6.6 Atmospheric Stability Frequency Distribution for Combined Years 2006 to 2010: All-hours, Daytime and Night-time
All Hours
Night-timeDay time
5.5
12.1
18.6
28.9
16.914.8
5
10
15
20
25
30
35
%
Stability Class Frequency Distribution
Stability ClassA B C D E F G
8.8
20.1
32.6
26.6
7.1
2.95
10
15
20
25
30
35
%
Stability Class Frequency Distribution
Stability ClassA B C D E F G
2.24.1 4.7
31.2
26.7 26.8
5
10
15
20
25
30
35
%
Stability Class Frequency Distribution
Stability ClassA B C D E F G
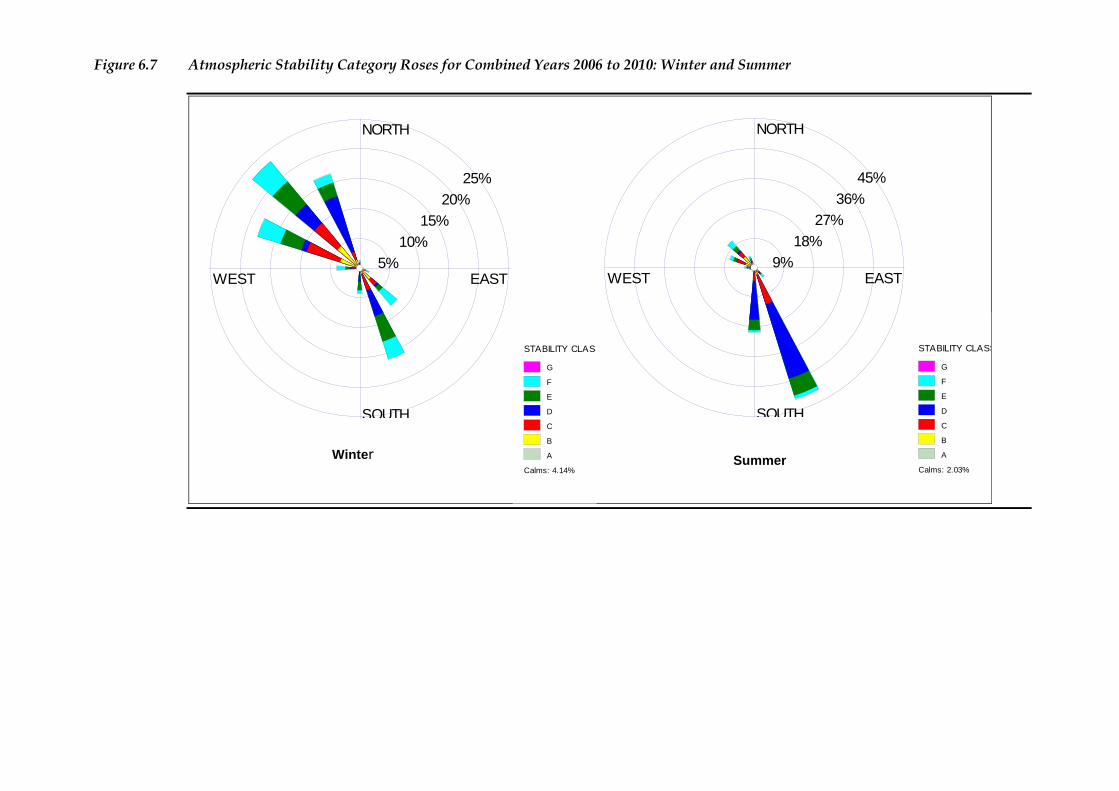
Figure 6.7 Atmospheric Stability Category Roses for Combined Years 2006 to 2010: Winter and Summer
SummerWinter
NORTH
SOUTH
WEST EAST5%
10%15%
20%25%
STABILITY CLASS
G
F
E
D
C
B
A
Calms: 4.14%
NORTH
SOUTH
WEST EAST9%
18%27%
36%45%
STABILITY CLASS
G
F
E
D
C
B
A
Calms: 2.03%
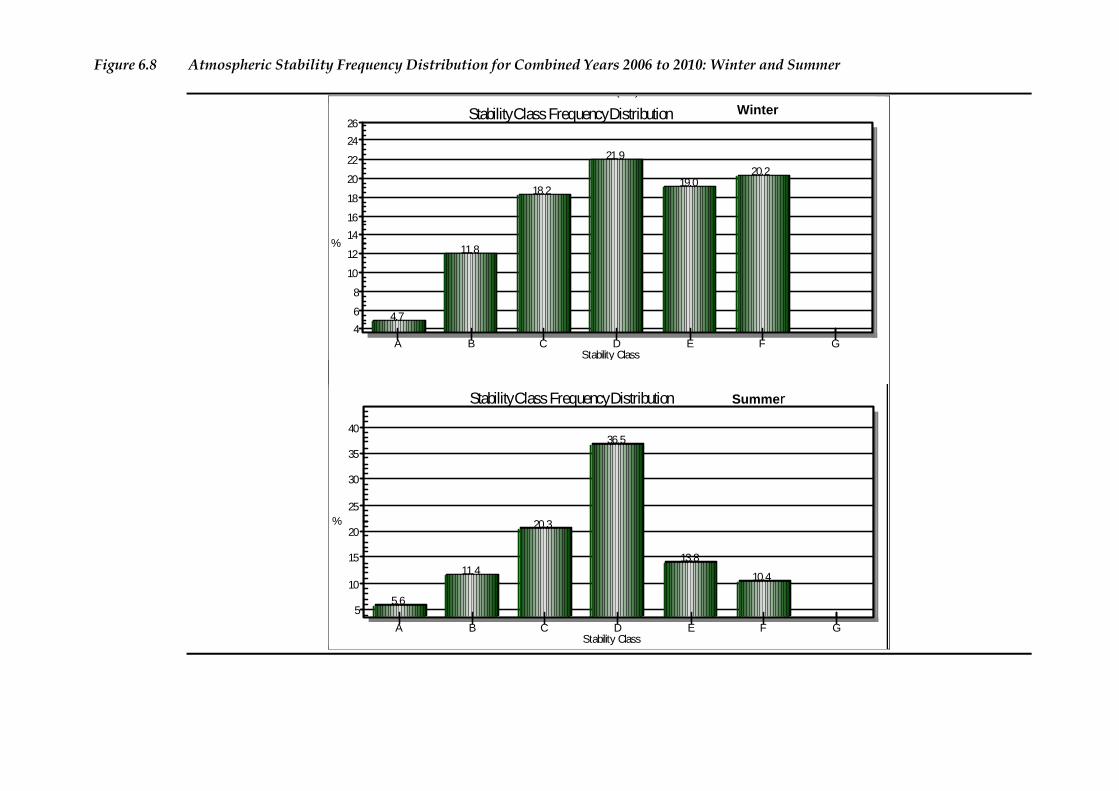
Figure 6.8 Atmospheric Stability Frequency Distribution for Combined Years 2006 to 2010: Winter and Summer
5.6
11.4
20.3
36.5
13.8
10.4
5
10
15
20
25
30
35
40
%
Stability Class Frequency Distribution
Stability ClassA B C D E F G
d Cass ( /s)
4.7
11.8
18.2
21.9
19.020.2
46
8
10
12
1416
18
20
22
2426
%
Stability Class Frequency Distribution
Stability ClassA B C D E F G
Summer
Winter
ENVIRONMENTAL RESOURCES MANAGEMENT BURGAN CAPE TERMINALS FEIR
6-12
6.3 AIR QUALITY
Sensitive Receptors
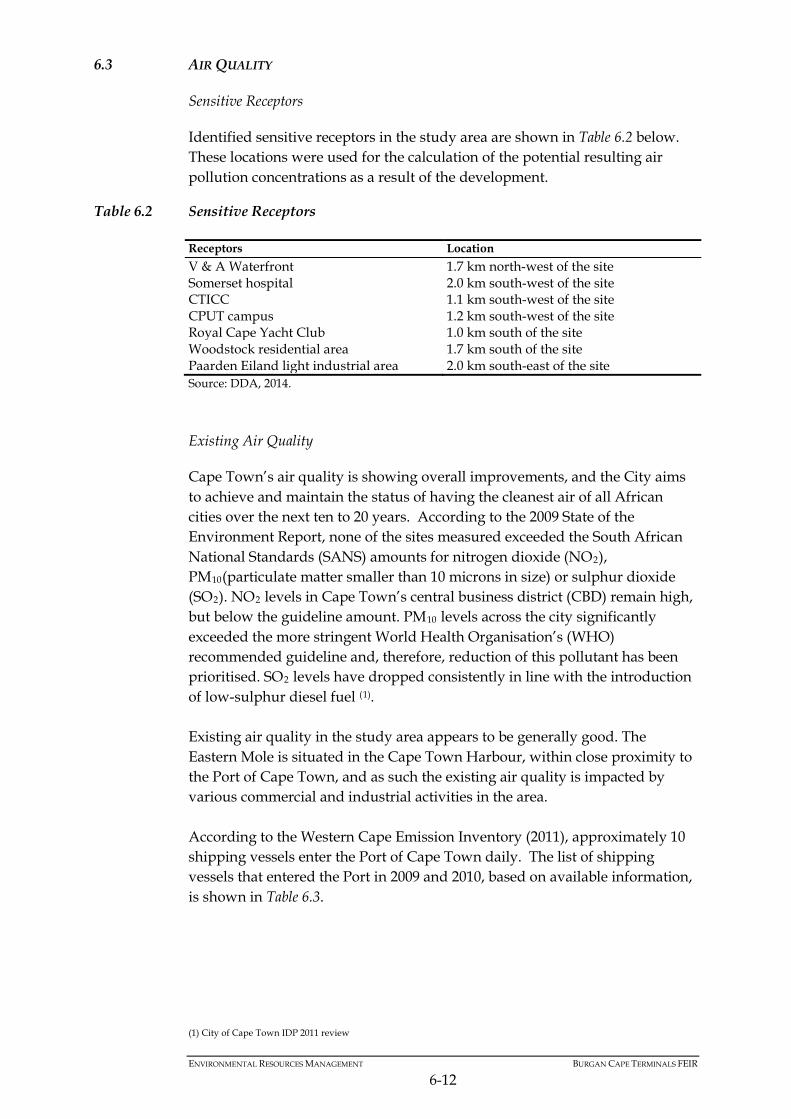
Identified sensitive receptors in the study area are shown in Table 6.2 below. These locations were used for the calculation of the potential resulting air pollution concentrations as a result of the development.
Table 6.2 Sensitive Receptors
Receptors Location V & A Waterfront 1.7 km north-west of the site Somerset hospital 2.0 km south-west of the site CTICC 1.1 km south-west of the site CPUT campus 1.2 km south-west of the site Royal Cape Yacht Club 1.0 km south of the site Woodstock residential area 1.7 km south of the site Paarden Eiland light industrial area 2.0 km south-east of the site Source: DDA, 2014. Existing Air Quality
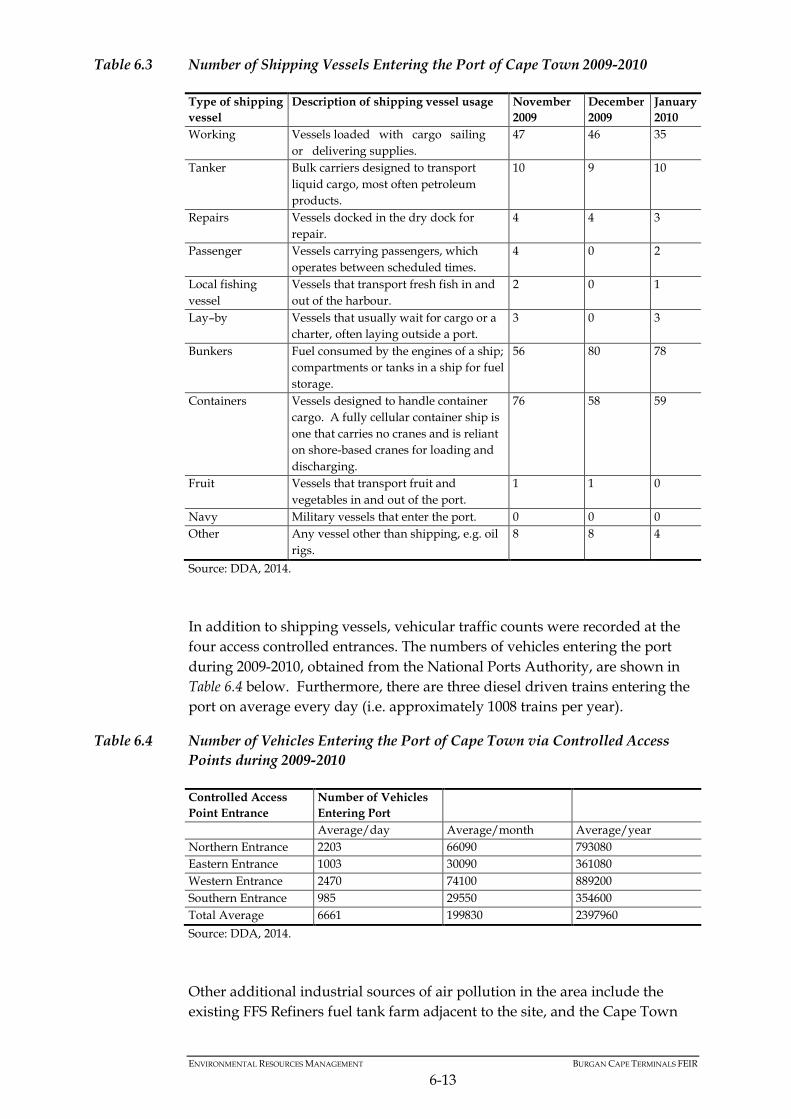
Cape Town’s air quality is showing overall improvements, and the City aims to achieve and maintain the status of having the cleanest air of all African cities over the next ten to 20 years. According to the 2009 State of the Environment Report, none of the sites measured exceeded the South African National Standards (SANS) amounts for nitrogen dioxide (NO2), PM10(particulate matter smaller than 10 microns in size) or sulphur dioxide (SO2). NO2 levels in Cape Town’s central business district (CBD) remain high, but below the guideline amount. PM10 levels across the city significantly exceeded the more stringent World Health Organisation’s (WHO) recommended guideline and, therefore, reduction of this pollutant has been prioritised. SO2 levels have dropped consistently in line with the introduction of low-sulphur diesel fuel (1). Existing air quality in the study area appears to be generally good. The Eastern Mole is situated in the Cape Town Harbour, within close proximity to the Port of Cape Town, and as such the existing air quality is impacted by various commercial and industrial activities in the area. According to the Western Cape Emission Inventory (2011), approximately 10 shipping vessels enter the Port of Cape Town daily. The list of shipping vessels that entered the Port in 2009 and 2010, based on available information, is shown in Table 6.3.
(1) City of Cape Town IDP 2011 review
ENVIRONMENTAL RESOURCES MANAGEMENT BURGAN CAPE TERMINALS FEIR
6-13
Table 6.3 Number of Shipping Vessels Entering the Port of Cape Town 2009-2010
Type of shipping vessel
Description of shipping vessel usage November 2009
December 2009
January 2010
Working Vessels loaded with cargo sailing or delivering supplies.
47 46 35
Tanker Bulk carriers designed to transport liquid cargo, most often petroleum products.
10 9 10
Repairs Vessels docked in the dry dock for repair.
4 4 3
Passenger Vessels carrying passengers, which operates between scheduled times.
4 0 2
Local fishing vessel
Vessels that transport fresh fish in and out of the harbour.
2 0 1
Lay–by Vessels that usually wait for cargo or a charter, often laying outside a port.
3 0 3
Bunkers Fuel consumed by the engines of a ship; compartments or tanks in a ship for fuel storage.
56 80 78
Containers Vessels designed to handle container cargo. A fully cellular container ship is one that carries no cranes and is reliant on shore-based cranes for loading and discharging.
76 58 59
Fruit Vessels that transport fruit and vegetables in and out of the port.
1 1 0
Navy Military vessels that enter the port. 0 0 0 Other Any vessel other than shipping, e.g. oil
rigs. 8 8 4
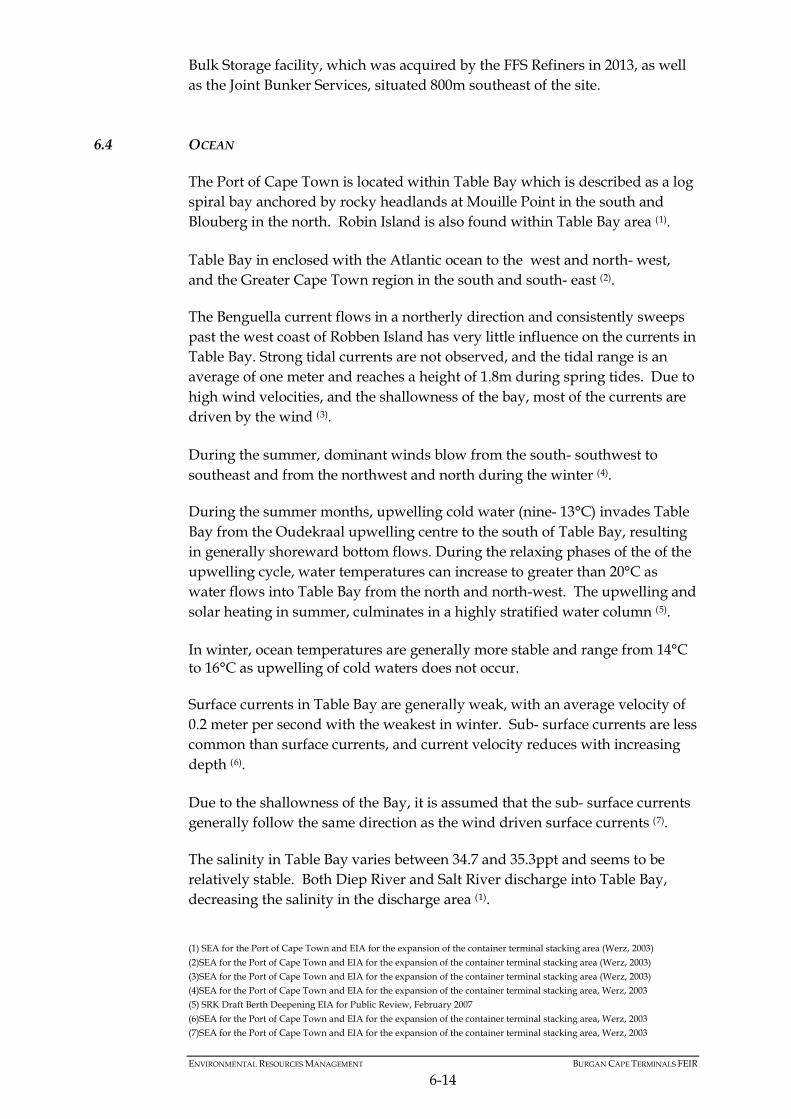
Source: DDA, 2014. In addition to shipping vessels, vehicular traffic counts were recorded at the four access controlled entrances. The numbers of vehicles entering the port during 2009-2010, obtained from the National Ports Authority, are shown in Table 6.4 below. Furthermore, there are three diesel driven trains entering the port on average every day (i.e. approximately 1008 trains per year).
Table 6.4 Number of Vehicles Entering the Port of Cape Town via Controlled Access Points during 2009-2010
Controlled Access Point Entrance
Number of Vehicles Entering Port
Average/day Average/month Average/year Northern Entrance 2203 66090 793080 Eastern Entrance 1003 30090 361080 Western Entrance 2470 74100 889200 Southern Entrance 985 29550 354600 Total Average 6661 199830 2397960 Source: DDA, 2014. Other additional industrial sources of air pollution in the area include the existing FFS Refiners fuel tank farm adjacent to the site, and the Cape Town
ENVIRONMENTAL RESOURCES MANAGEMENT BURGAN CAPE TERMINALS FEIR
6-14
Bulk Storage facility, which was acquired by the FFS Refiners in 2013, as well as the Joint Bunker Services, situated 800m southeast of the site.
6.4 OCEAN
The Port of Cape Town is located within Table Bay which is described as a log spiral bay anchored by rocky headlands at Mouille Point in the south and Blouberg in the north. Robin Island is also found within Table Bay area (1). Table Bay in enclosed with the Atlantic ocean to the west and north- west, and the Greater Cape Town region in the south and south- east (2). The Benguella current flows in a northerly direction and consistently sweeps past the west coast of Robben Island has very little influence on the currents in Table Bay. Strong tidal currents are not observed, and the tidal range is an average of one meter and reaches a height of 1.8m during spring tides. Due to high wind velocities, and the shallowness of the bay, most of the currents are driven by the wind (3). During the summer, dominant winds blow from the south- southwest to southeast and from the northwest and north during the winter (4). During the summer months, upwelling cold water (nine- 13°C) invades Table Bay from the Oudekraal upwelling centre to the south of Table Bay, resulting in generally shoreward bottom flows. During the relaxing phases of the of the upwelling cycle, water temperatures can increase to greater than 20°C as water flows into Table Bay from the north and north-west. The upwelling and solar heating in summer, culminates in a highly stratified water column (5). In winter, ocean temperatures are generally more stable and range from 14°C to 16°C as upwelling of cold waters does not occur. Surface currents in Table Bay are generally weak, with an average velocity of 0.2 meter per second with the weakest in winter. Sub- surface currents are less common than surface currents, and current velocity reduces with increasing depth (6). Due to the shallowness of the Bay, it is assumed that the sub- surface currents generally follow the same direction as the wind driven surface currents (7). The salinity in Table Bay varies between 34.7 and 35.3ppt and seems to be relatively stable. Both Diep River and Salt River discharge into Table Bay, decreasing the salinity in the discharge area (1).
(1) SEA for the Port of Cape Town and EIA for the expansion of the container terminal stacking area (Werz, 2003) (2)SEA for the Port of Cape Town and EIA for the expansion of the container terminal stacking area (Werz, 2003) (3)SEA for the Port of Cape Town and EIA for the expansion of the container terminal stacking area (Werz, 2003) (4)SEA for the Port of Cape Town and EIA for the expansion of the container terminal stacking area, Werz, 2003 (5) SRK Draft Berth Deepening EIA for Public Review, February 2007 (6)SEA for the Port of Cape Town and EIA for the expansion of the container terminal stacking area, Werz, 2003 (7)SEA for the Port of Cape Town and EIA for the expansion of the container terminal stacking area, Werz, 2003
ENVIRONMENTAL RESOURCES MANAGEMENT BURGAN CAPE TERMINALS FEIR
6-15
6.5 TOPOGRAPHY
The site is almost entirely level, with the surface projecting about 3 – 3.5m above sea level (2).
6.6 GEOLOGY
This geological baseline is largely based on work undertaken by Kantey and Templer Consulting Engineers (3). The Eastern Mole is known to be situated in terrain composed of and underlain at depth by meta–sedimentary strata of the Tygerberg Formation, Malmesbury Group. This is typically comprised of layers of fine grained siltstone, phyllitic shales, greywacke, and quartzite, which range in thickness from a few centimetres to more than three metres. These are overlain by a thin veneer of marine sediment. Tight, near isoclinal folding has resulted in bedding planes lying near vertical, with surrounding evidence suggesting that a typical dip of 750 to 800 occurs to the south west. Subsequent minor folding has resulted in the trace of these folds being slightly curved across the site. The underlying rock is typically closely to very closely jointed with an axial cleavage. The intact rock strength ranges from relatively high to very low depending on the rock type and the degree of weathering. The preferential weathering of the softer and more argillaceous rock bands has resulted in variable depths of weathering and a typical ridged bedrock surface, where ridges of hard rock stand out above valleys or gullies of weathered softer rock. These ridges tend to run in a north west – south east direction. Dolerite dykes are known to intrude through the Malmesbury Group over localised areas. These intrusions show a preferential trend corresponding to the trend of the primary folding. There are no known faults existing in the vicinity of the eastern Mole. However, small faults in the Malmesbury Group at Mouille Point about 3.5km from the site suggest that the presence of such faults would not be unexpected. Due to the old rocky shoreline lying well to the south west of the site, substantial marine sediments overly the rock. The development area comprises man-made ground imported and placed over several years of reclamation.
(1)SRK Draft Berth Deepening EIA for Public Review, February 2007 (2) Kantey and Templer. October 2013. Report on Geotechnical Investigation for Proposed New Fuel Storage terminal at Eastern Mole Cape Town Harbour (Initial Report). (3) Kantey and Templer. October 2013. Report on Geotechnical Investigation for Proposed New Fuel Storage terminal at Eastern Mole Cape Town Harbour (Initial Report).
ENVIRONMENTAL RESOURCES MANAGEMENT BURGAN CAPE TERMINALS FEIR
6-16
6.7 SEISMICITY
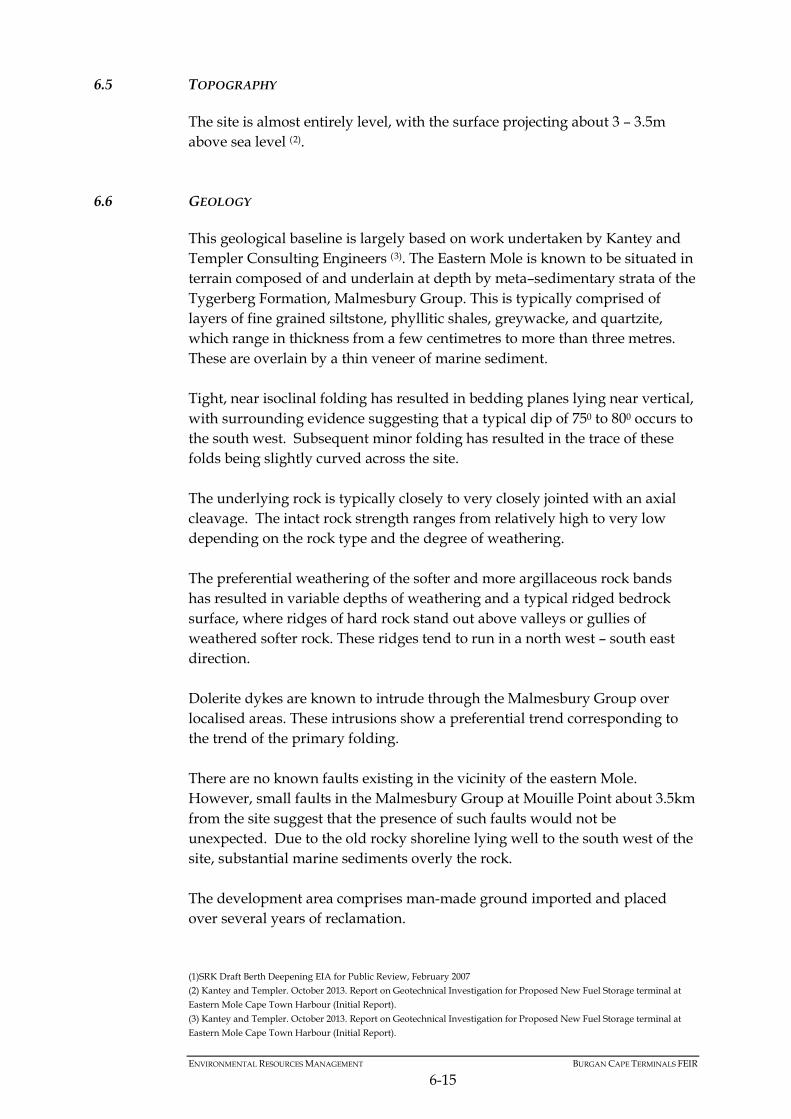
There are no known or proven faults in the site vicinity. A study of the available aeromagnetic and radiometric maps of the area did not suggest the presence of any such faults which could become the focus of a seismic event. The risk associated with the maximum size of a seismic event in and around Cape Town remains a matter of some academic debate. Table 6.5 below shows the maximum intensities experienced in the area are reported by Hartnady (1996) (1).
Table 6.5 Maximum seismic intensities experienced in the Cape Town area
Intesity (Modified Mercali Scale) Date Epicentre Distance from site in km
6.1 1809 Milnerton Unknown 5.5-6.0 1811 Milnerton Fault Approximately 10
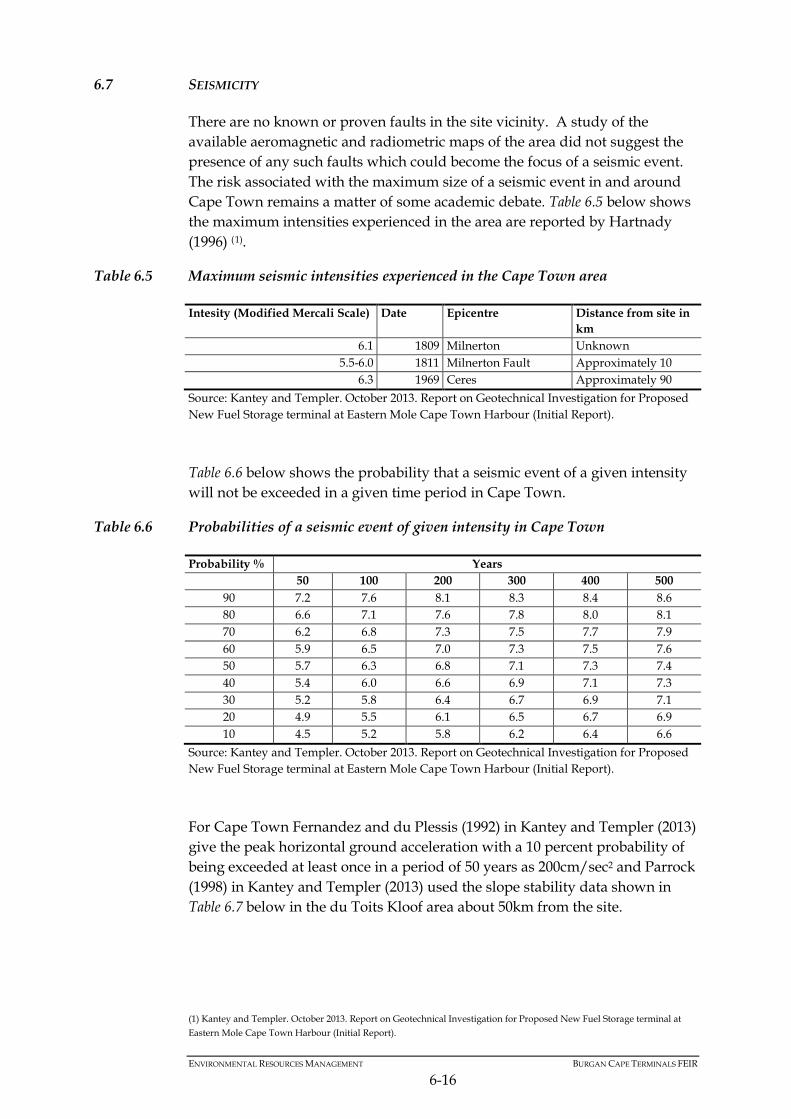
6.3 1969 Ceres Approximately 90 Source: Kantey and Templer. October 2013. Report on Geotechnical Investigation for Proposed New Fuel Storage terminal at Eastern Mole Cape Town Harbour (Initial Report). Table 6.6 below shows the probability that a seismic event of a given intensity will not be exceeded in a given time period in Cape Town.
Table 6.6 Probabilities of a seismic event of given intensity in Cape Town
Probability % Years 50 100 200 300 400 500
90 7.2 7.6 8.1 8.3 8.4 8.6 80 6.6 7.1 7.6 7.8 8.0 8.1 70 6.2 6.8 7.3 7.5 7.7 7.9 60 5.9 6.5 7.0 7.3 7.5 7.6 50 5.7 6.3 6.8 7.1 7.3 7.4 40 5.4 6.0 6.6 6.9 7.1 7.3 30 5.2 5.8 6.4 6.7 6.9 7.1 20 4.9 5.5 6.1 6.5 6.7 6.9 10 4.5 5.2 5.8 6.2 6.4 6.6
Source: Kantey and Templer. October 2013. Report on Geotechnical Investigation for Proposed New Fuel Storage terminal at Eastern Mole Cape Town Harbour (Initial Report). For Cape Town Fernandez and du Plessis (1992) in Kantey and Templer (2013) give the peak horizontal ground acceleration with a 10 percent probability of being exceeded at least once in a period of 50 years as 200cm/sec2 and Parrock (1998) in Kantey and Templer (2013) used the slope stability data shown in Table 6.7 below in the du Toits Kloof area about 50km from the site.
(1) Kantey and Templer. October 2013. Report on Geotechnical Investigation for Proposed New Fuel Storage terminal at Eastern Mole Cape Town Harbour (Initial Report).
ENVIRONMENTAL RESOURCES MANAGEMENT BURGAN CAPE TERMINALS FEIR
6-17
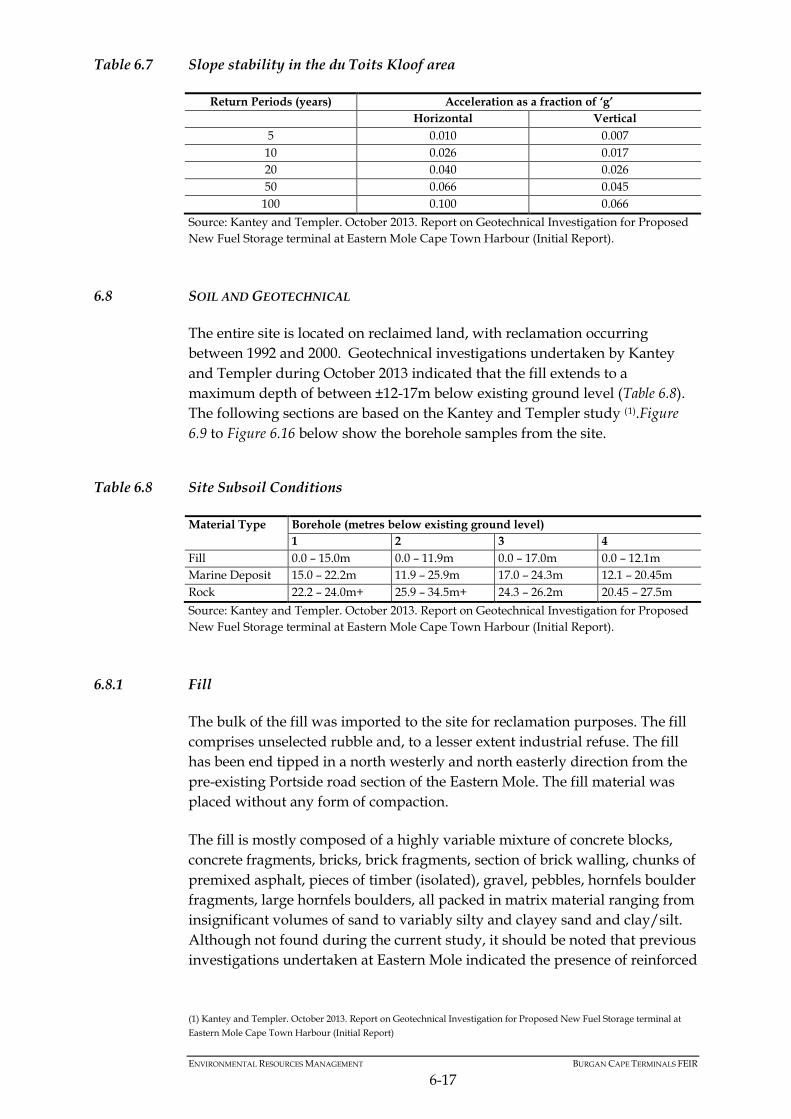
Table 6.7 Slope stability in the du Toits Kloof area
Return Periods (years) Acceleration as a fraction of ‘g’ Horizontal Vertical
5 0.010 0.007 10 0.026 0.017 20 0.040 0.026 50 0.066 0.045
100 0.100 0.066 Source: Kantey and Templer. October 2013. Report on Geotechnical Investigation for Proposed New Fuel Storage terminal at Eastern Mole Cape Town Harbour (Initial Report).
6.8 SOIL AND GEOTECHNICAL
The entire site is located on reclaimed land, with reclamation occurring between 1992 and 2000. Geotechnical investigations undertaken by Kantey and Templer during October 2013 indicated that the fill extends to a maximum depth of between ±12-17m below existing ground level (Table 6.8). The following sections are based on the Kantey and Templer study (1).Figure 6.9 to Figure 6.16 below show the borehole samples from the site.
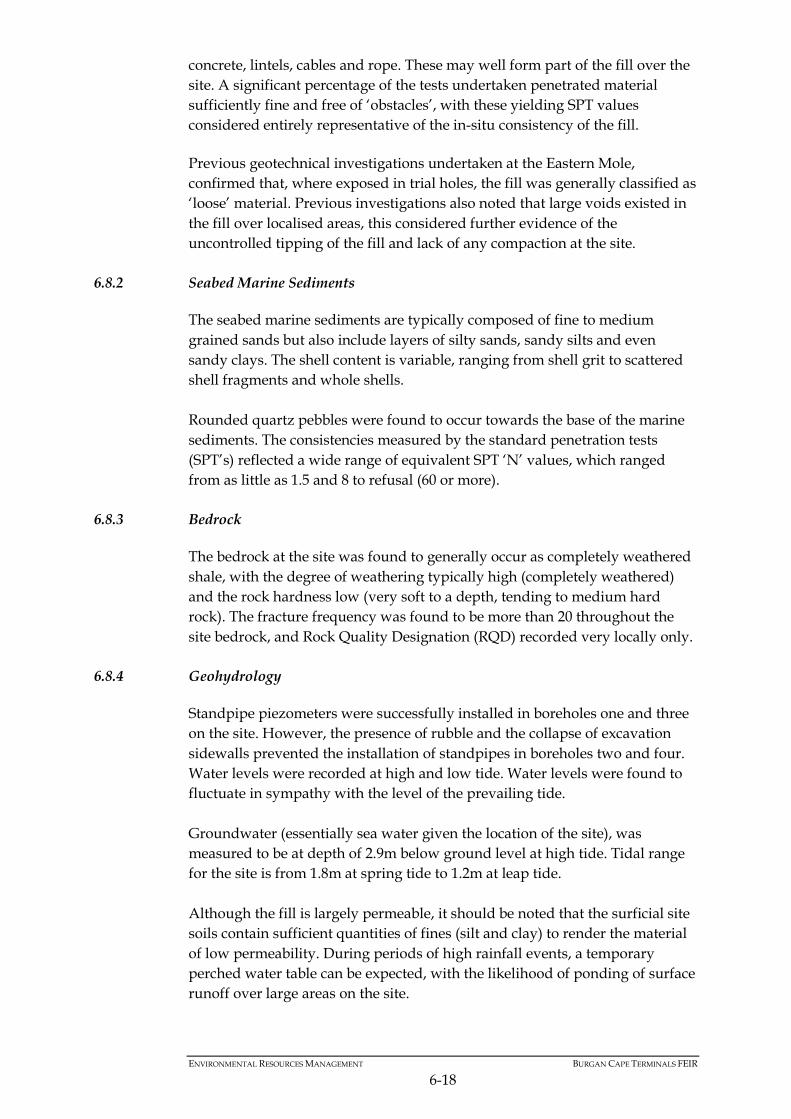
Table 6.8 Site Subsoil Conditions
Material Type Borehole (metres below existing ground level) 1 2 3 4
Fill 0.0 – 15.0m 0.0 – 11.9m 0.0 – 17.0m 0.0 – 12.1m Marine Deposit 15.0 – 22.2m 11.9 – 25.9m 17.0 – 24.3m 12.1 – 20.45m Rock 22.2 – 24.0m+ 25.9 – 34.5m+ 24.3 – 26.2m 20.45 – 27.5m Source: Kantey and Templer. October 2013. Report on Geotechnical Investigation for Proposed New Fuel Storage terminal at Eastern Mole Cape Town Harbour (Initial Report).
6.8.1 Fill
The bulk of the fill was imported to the site for reclamation purposes. The fill comprises unselected rubble and, to a lesser extent industrial refuse. The fill has been end tipped in a north westerly and north easterly direction from the pre-existing Portside road section of the Eastern Mole. The fill material was placed without any form of compaction. The fill is mostly composed of a highly variable mixture of concrete blocks, concrete fragments, bricks, brick fragments, section of brick walling, chunks of premixed asphalt, pieces of timber (isolated), gravel, pebbles, hornfels boulder fragments, large hornfels boulders, all packed in matrix material ranging from insignificant volumes of sand to variably silty and clayey sand and clay/silt. Although not found during the current study, it should be noted that previous investigations undertaken at Eastern Mole indicated the presence of reinforced
(1) Kantey and Templer. October 2013. Report on Geotechnical Investigation for Proposed New Fuel Storage terminal at Eastern Mole Cape Town Harbour (Initial Report)
ENVIRONMENTAL RESOURCES MANAGEMENT BURGAN CAPE TERMINALS FEIR
6-18
concrete, lintels, cables and rope. These may well form part of the fill over the site. A significant percentage of the tests undertaken penetrated material sufficiently fine and free of ‘obstacles’, with these yielding SPT values considered entirely representative of the in-situ consistency of the fill. Previous geotechnical investigations undertaken at the Eastern Mole, confirmed that, where exposed in trial holes, the fill was generally classified as ‘loose’ material. Previous investigations also noted that large voids existed in the fill over localised areas, this considered further evidence of the uncontrolled tipping of the fill and lack of any compaction at the site.
6.8.2 Seabed Marine Sediments
The seabed marine sediments are typically composed of fine to medium grained sands but also include layers of silty sands, sandy silts and even sandy clays. The shell content is variable, ranging from shell grit to scattered shell fragments and whole shells. Rounded quartz pebbles were found to occur towards the base of the marine sediments. The consistencies measured by the standard penetration tests (SPT’s) reflected a wide range of equivalent SPT ‘N’ values, which ranged from as little as 1.5 and 8 to refusal (60 or more).
6.8.3 Bedrock
The bedrock at the site was found to generally occur as completely weathered shale, with the degree of weathering typically high (completely weathered) and the rock hardness low (very soft to a depth, tending to medium hard rock). The fracture frequency was found to be more than 20 throughout the site bedrock, and Rock Quality Designation (RQD) recorded very locally only.
6.8.4 Geohydrology
Standpipe piezometers were successfully installed in boreholes one and three on the site. However, the presence of rubble and the collapse of excavation sidewalls prevented the installation of standpipes in boreholes two and four. Water levels were recorded at high and low tide. Water levels were found to fluctuate in sympathy with the level of the prevailing tide. Groundwater (essentially sea water given the location of the site), was measured to be at depth of 2.9m below ground level at high tide. Tidal range for the site is from 1.8m at spring tide to 1.2m at leap tide. Although the fill is largely permeable, it should be noted that the surficial site soils contain sufficient quantities of fines (silt and clay) to render the material of low permeability. During periods of high rainfall events, a temporary perched water table can be expected, with the likelihood of ponding of surface runoff over large areas on the site.
ENVIRONMENTAL RESOURCES MANAGEMENT BURGAN CAPE TERMINALS FEIR
6-19
6.8.5 Liquefaction
‘Liquefaction’ is a general term which is used to describe various forms of unstable behaviour of saturated sands during earthquakes. Settlement and tilting of foundations due to ‘quicksand’ conditions in bearing strata and the subsequent collapse of quay walls have all been attributed to liquefaction. The following are included as optimum conditions for liquefaction to occur under earthquake loading; loose (N<10), fine to silty fine sands with the water table within ±3m of the surface. Furthermore, the greater the intensity and the duration of the earthquake, the greater the probability liquefaction will occur. Some of the site contains soil types which do not fall within these categories of optimum liquefaction causing conditions (i.e. the coarser grained end-tipped fill and the more rubbly fill). Although the water table is at ±3m depth, which is close to the liquefaction condition, site is not known to lie on a fault line likely to give rise to high earthquake intensities. Kantey and Templer therefore do not consider the site to be highly susceptible to the risk of liquefaction. However, there may be areas of sand of appropriate grading and looseness present, which would render these areas subject to liquefaction in the event of an earthquake of sufficient magnitude. The consequences of liquefaction would be loss of bearing capacity, lateral support to piles and ‘boiling up’ of liquefied sand where pressures are applied. The above effects associated with the loss of shear strength must not be confused with the potential for densification of very loose soils below the water table, occurring under surcharge loading due to self-weight or applied loads, when subjected to vibration. With the presence of loose sandy soils and the anticipated open-voided loose rubble fills present on site, the loss of shear strength remains a possibility in the event of an earthquake.
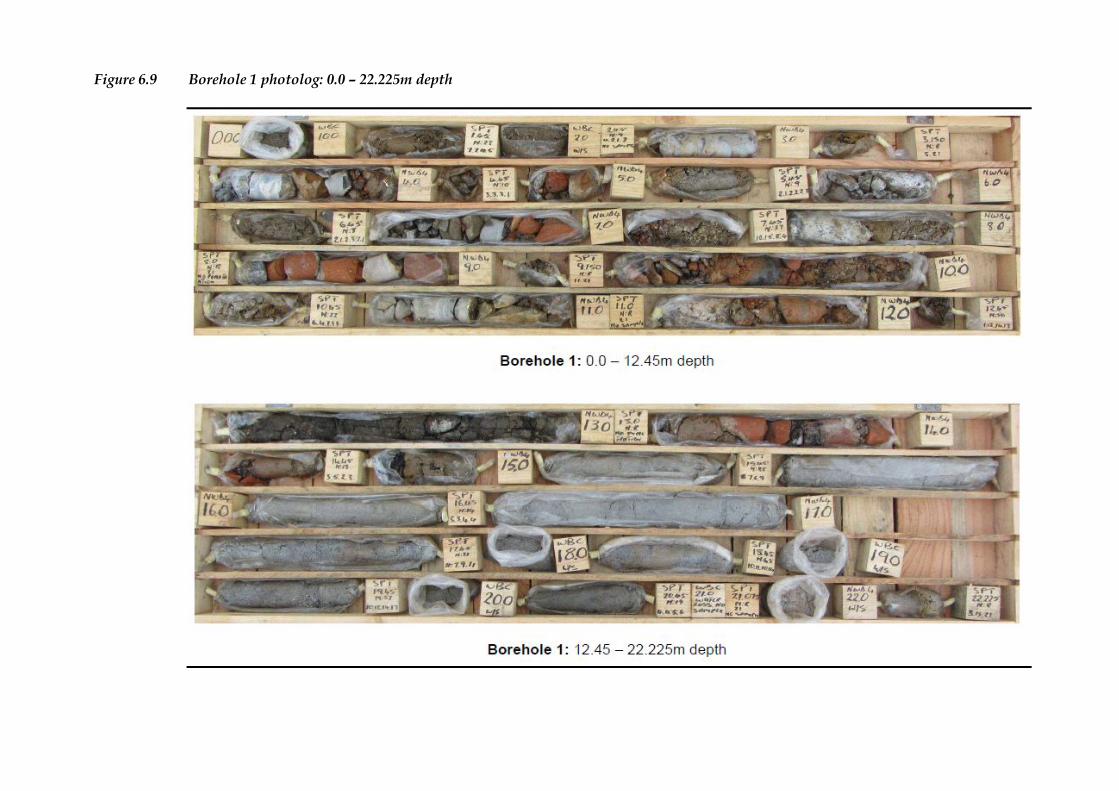
Figure 6.9 Borehole 1 photolog: 0.0 – 22.225m depth
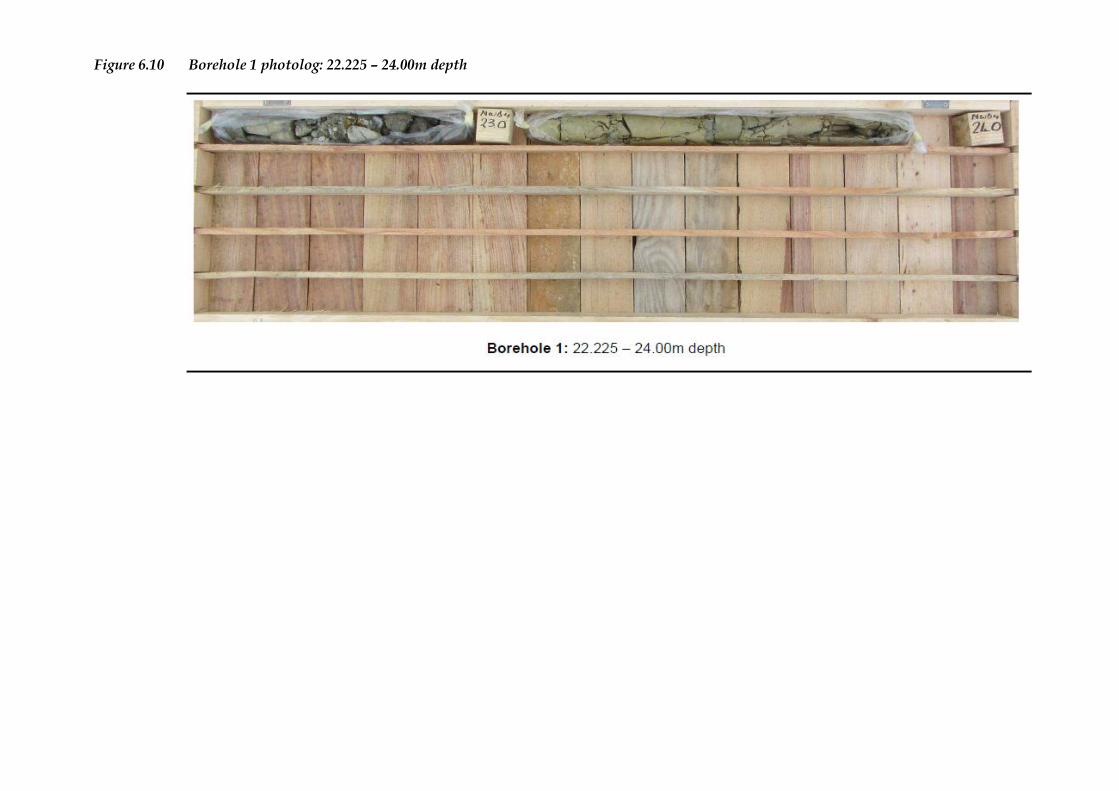
Figure 6.10 Borehole 1 photolog: 22.225 – 24.00m depth
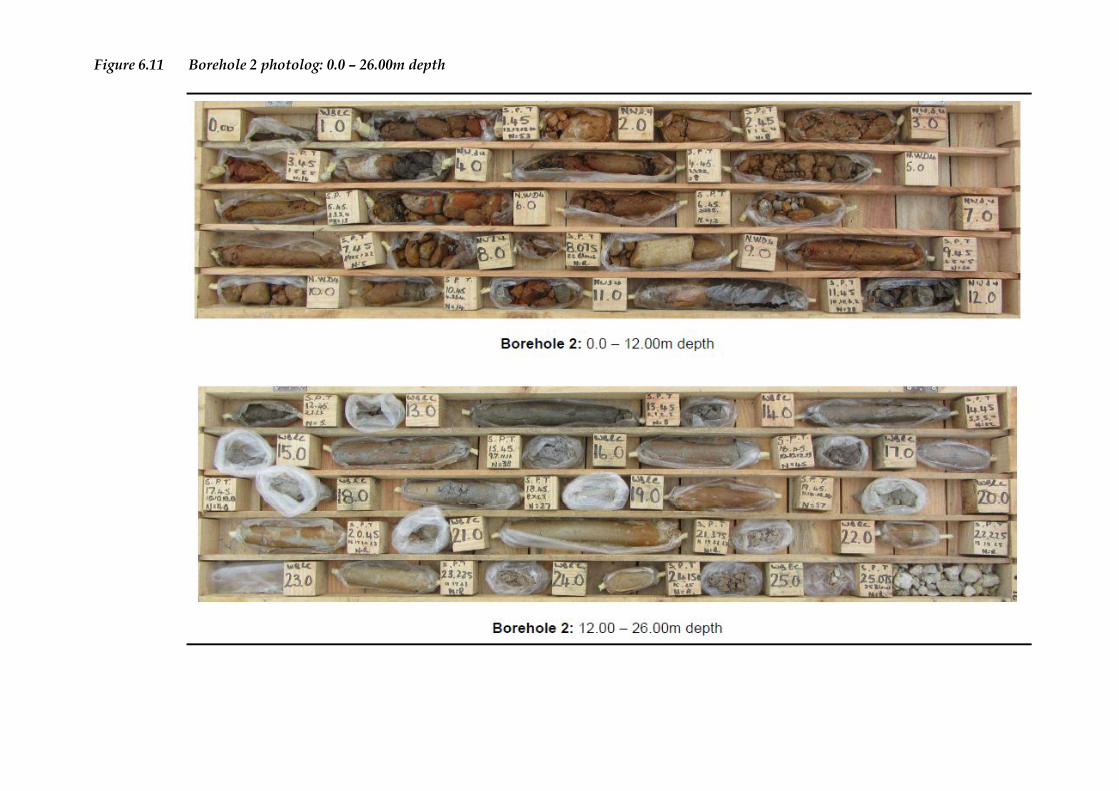
Figure 6.11 Borehole 2 photolog: 0.0 – 26.00m depth
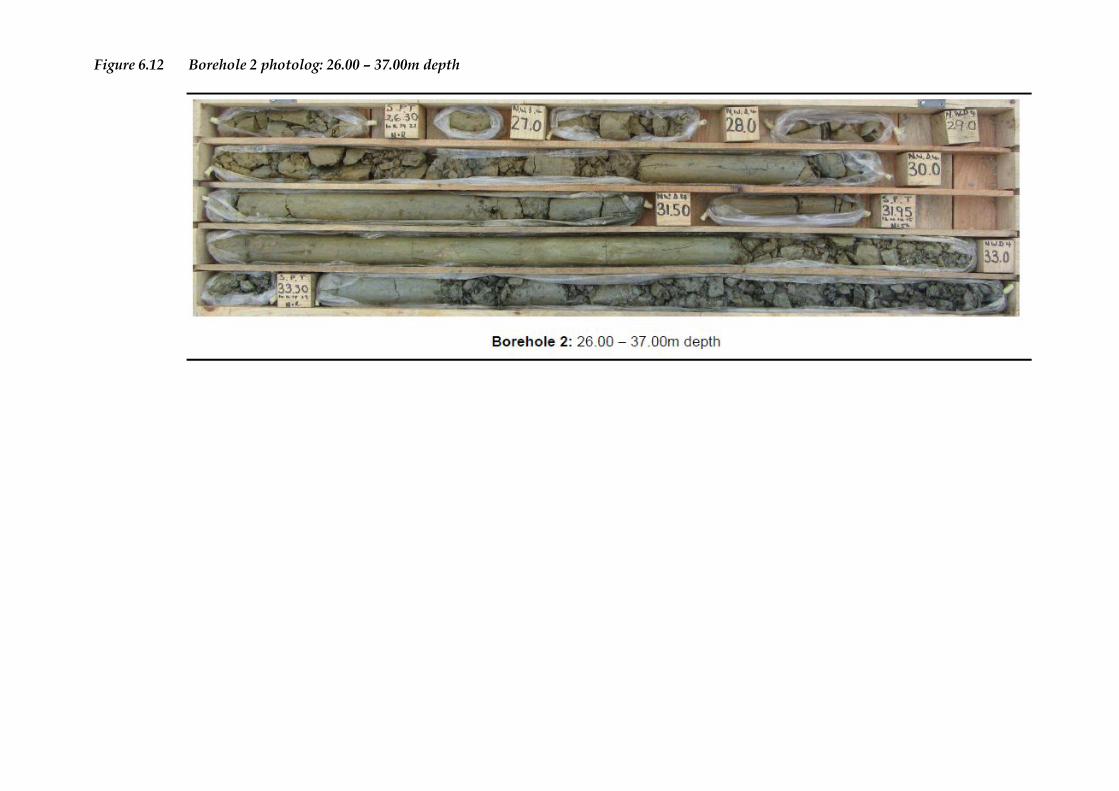
Figure 6.12 Borehole 2 photolog: 26.00 – 37.00m depth
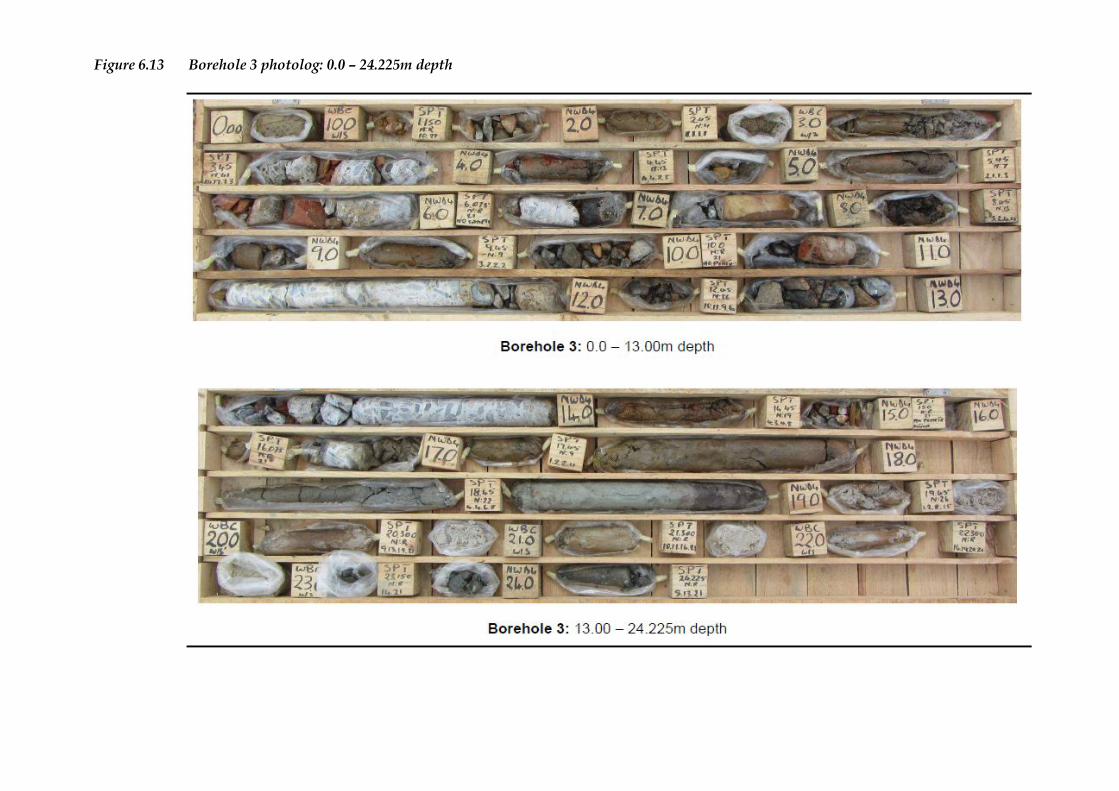
Figure 6.13 Borehole 3 photolog: 0.0 – 24.225m depth
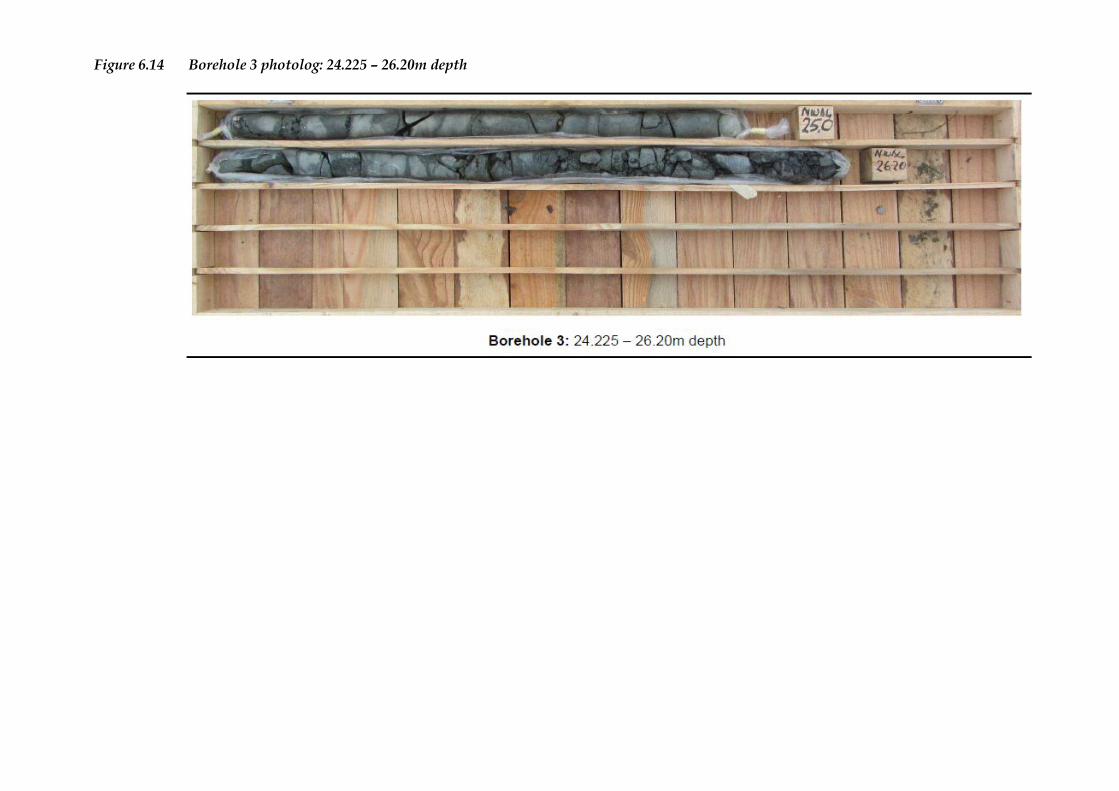
Figure 6.14 Borehole 3 photolog: 24.225 – 26.20m depth
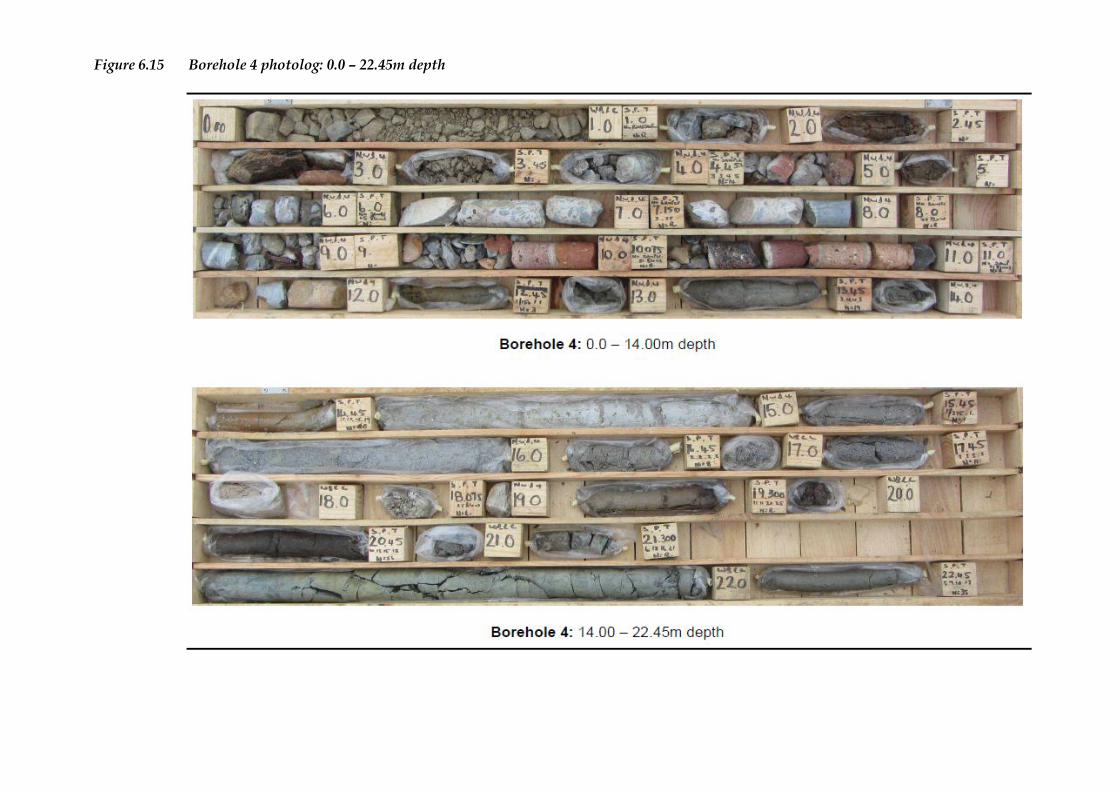
Figure 6.15 Borehole 4 photolog: 0.0 – 22.45m depth
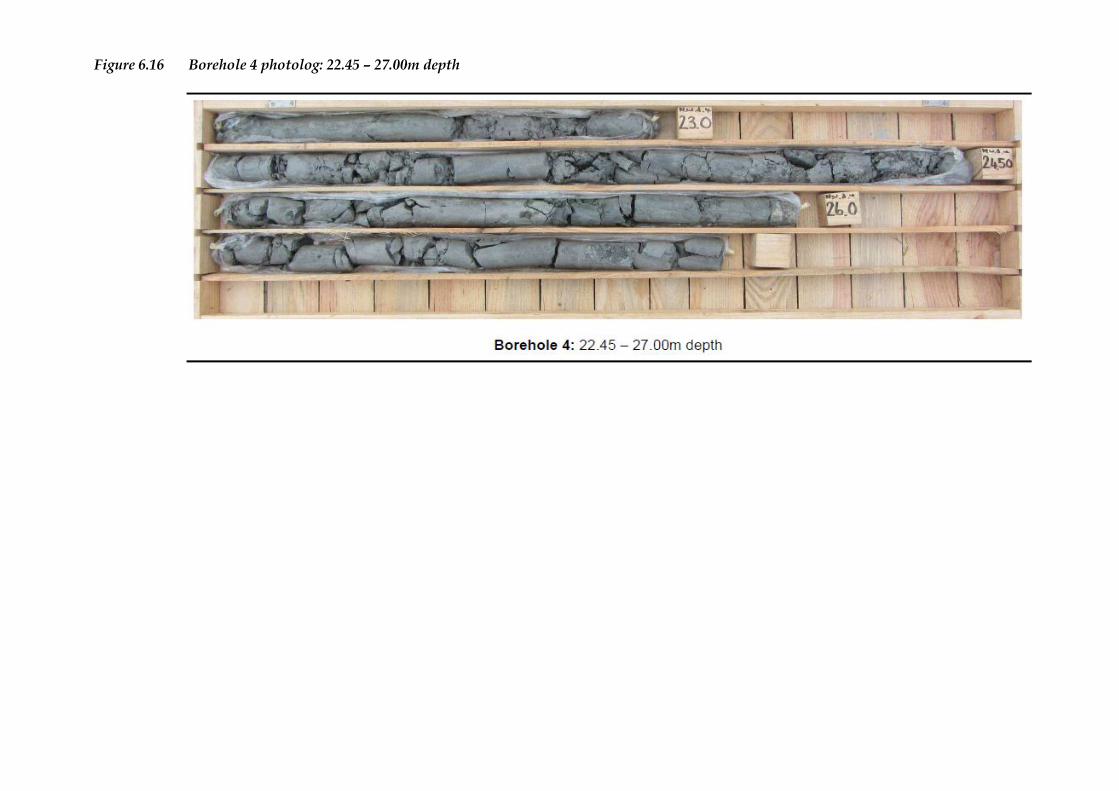
Figure 6.16 Borehole 4 photolog: 22.45 – 27.00m depth
ENVIRONMENTAL RESOURCES MANAGEMENT BURGAN CAPE TERMINALS FEIR
6-28
6.8.6 Site Contamination Study
Sub-Surface Clearance, Trial Pit Excavation and Field Observations
Twenty-two (22) trial pits were excavated with a TLB across the site at the locations illustrated in Figure 6.17. Pits intersected building rubble including bricks, concrete and tar, set in a matrix of sandy red-brown soil (Annex L). Other items including short metal rods and discarded cables were intersected in certain trial pits. No visual or olfactory evidence of hydrocarbons including stains or odours were noted in any of the trial pits excavated. PID readings of soil samples taken from the bottom of each trial pit recorded no detectable volatile organic compounds (VOCs). Laboratory Results
Screening Criteria: Results were compared against the commercial / industrial soil screening values (SSV2) listed in the now promulgated National Norms and Standards for the Remediation of Contaminated Land and Soil Quality in the Republic of South Africa in Government Notice 331 of 2014. Analytical Results: Complete laboratory results are provided in Annex L, while summaries for hydrocarbons and metals are presented in and Table 6.10, respectively, with comparison to the adopted screening criteria.
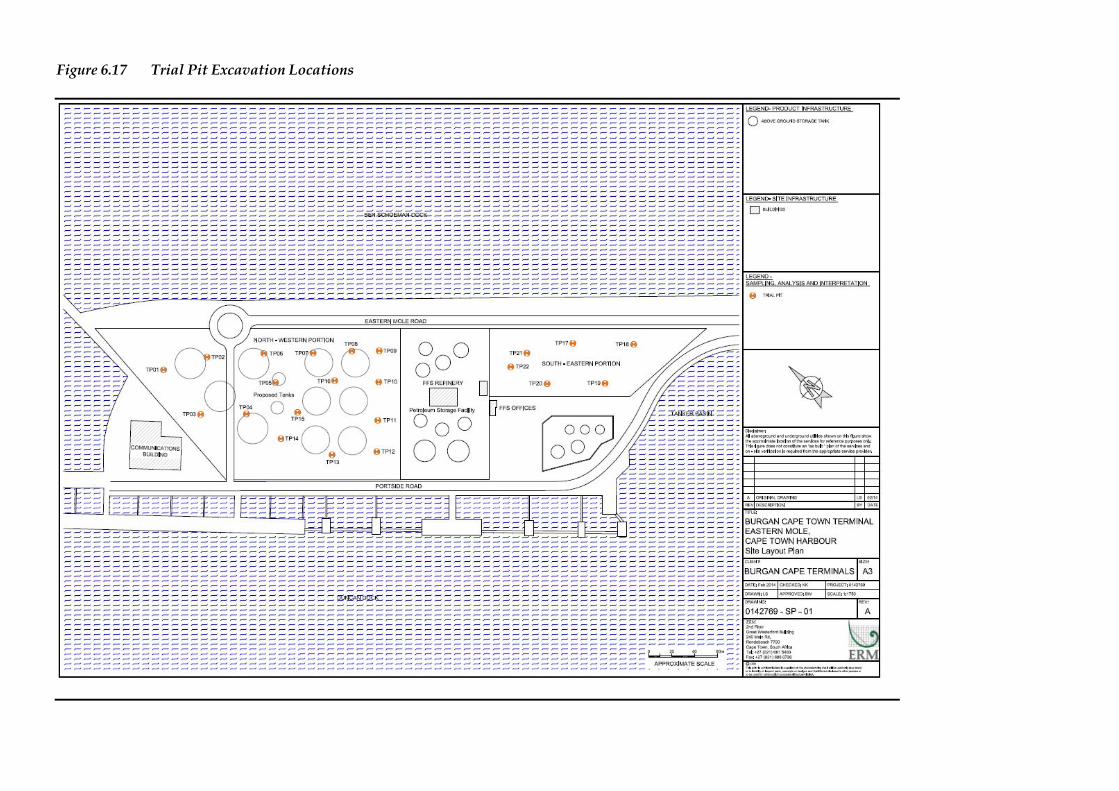
Figure 6.17 Trial Pit Excavation Locations
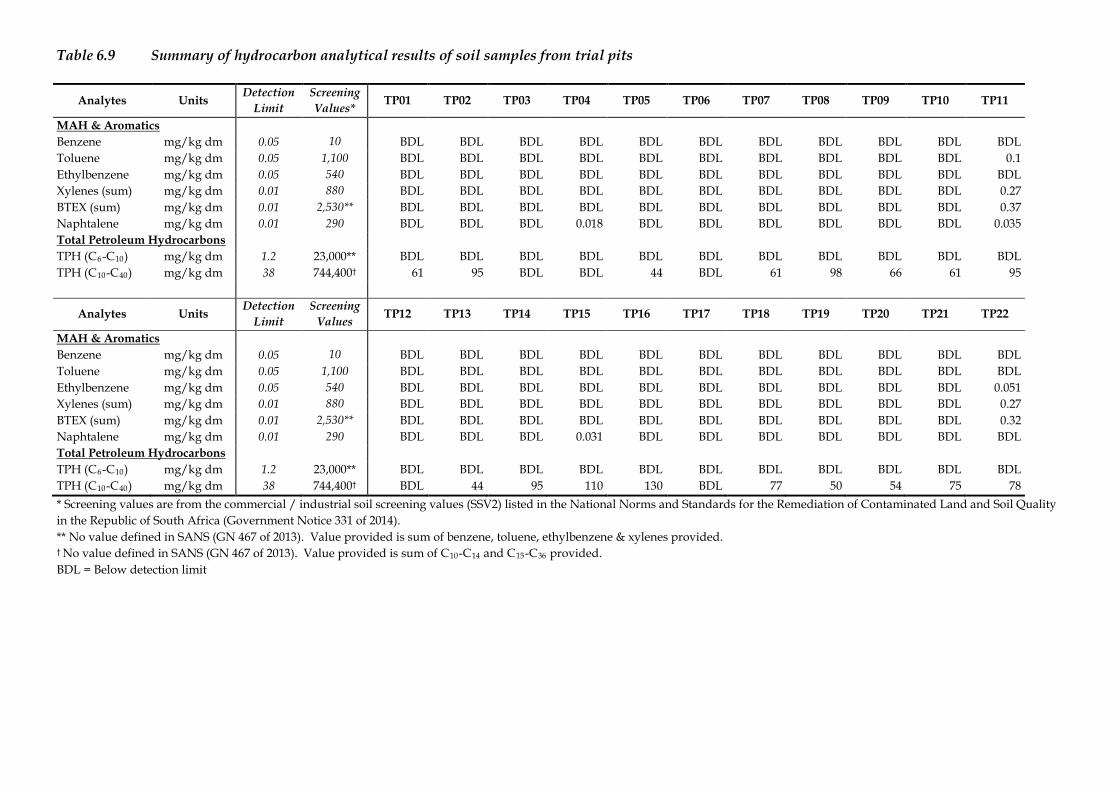
Table 6.9 Summary of hydrocarbon analytical results of soil samples from trial pits
Analytes Units Detection Limit
Screening Values* TP01 TP02 TP03 TP04 TP05 TP06 TP07 TP08 TP09 TP10 TP11
MAH & Aromatics Benzene mg/kg dm 0.05 10 BDL BDL BDL BDL BDL BDL BDL BDL BDL BDL BDL Toluene mg/kg dm 0.05 1,100 BDL BDL BDL BDL BDL BDL BDL BDL BDL BDL 0.1 Ethylbenzene mg/kg dm 0.05 540 BDL BDL BDL BDL BDL BDL BDL BDL BDL BDL BDL Xylenes (sum) mg/kg dm 0.01 880 BDL BDL BDL BDL BDL BDL BDL BDL BDL BDL 0.27 BTEX (sum) mg/kg dm 0.01 2,530** BDL BDL BDL BDL BDL BDL BDL BDL BDL BDL 0.37 Naphtalene mg/kg dm 0.01 290 BDL BDL BDL 0.018 BDL BDL BDL BDL BDL BDL 0.035 Total Petroleum Hydrocarbons TPH (C6-C10) mg/kg dm 1.2 23,000** BDL BDL BDL BDL BDL BDL BDL BDL BDL BDL BDL TPH (C10-C40) mg/kg dm 38 744,400† 61 95 BDL BDL 44 BDL 61 98 66 61 95
Analytes Units Detection Limit
Screening Values TP12 TP13 TP14 TP15 TP16 TP17 TP18 TP19 TP20 TP21 TP22
MAH & Aromatics Benzene mg/kg dm 0.05 10 BDL BDL BDL BDL BDL BDL BDL BDL BDL BDL BDL Toluene mg/kg dm 0.05 1,100 BDL BDL BDL BDL BDL BDL BDL BDL BDL BDL BDL Ethylbenzene mg/kg dm 0.05 540 BDL BDL BDL BDL BDL BDL BDL BDL BDL BDL 0.051 Xylenes (sum) mg/kg dm 0.01 880 BDL BDL BDL BDL BDL BDL BDL BDL BDL BDL 0.27 BTEX (sum) mg/kg dm 0.01 2,530** BDL BDL BDL BDL BDL BDL BDL BDL BDL BDL 0.32 Naphtalene mg/kg dm 0.01 290 BDL BDL BDL 0.031 BDL BDL BDL BDL BDL BDL BDL Total Petroleum Hydrocarbons TPH (C6-C10) mg/kg dm 1.2 23,000** BDL BDL BDL BDL BDL BDL BDL BDL BDL BDL BDL TPH (C10-C40) mg/kg dm 38 744,400† BDL 44 95 110 130 BDL 77 50 54 75 78 * Screening values are from the commercial / industrial soil screening values (SSV2) listed in the National Norms and Standards for the Remediation of Contaminated Land and Soil Quality in the Republic of South Africa (Government Notice 331 of 2014). ** No value defined in SANS (GN 467 of 2013). Value provided is sum of benzene, toluene, ethylbenzene & xylenes provided. † No value defined in SANS (GN 467 of 2013). Value provided is sum of C10-C14 and C15-C36 provided. BDL = Below detection limit
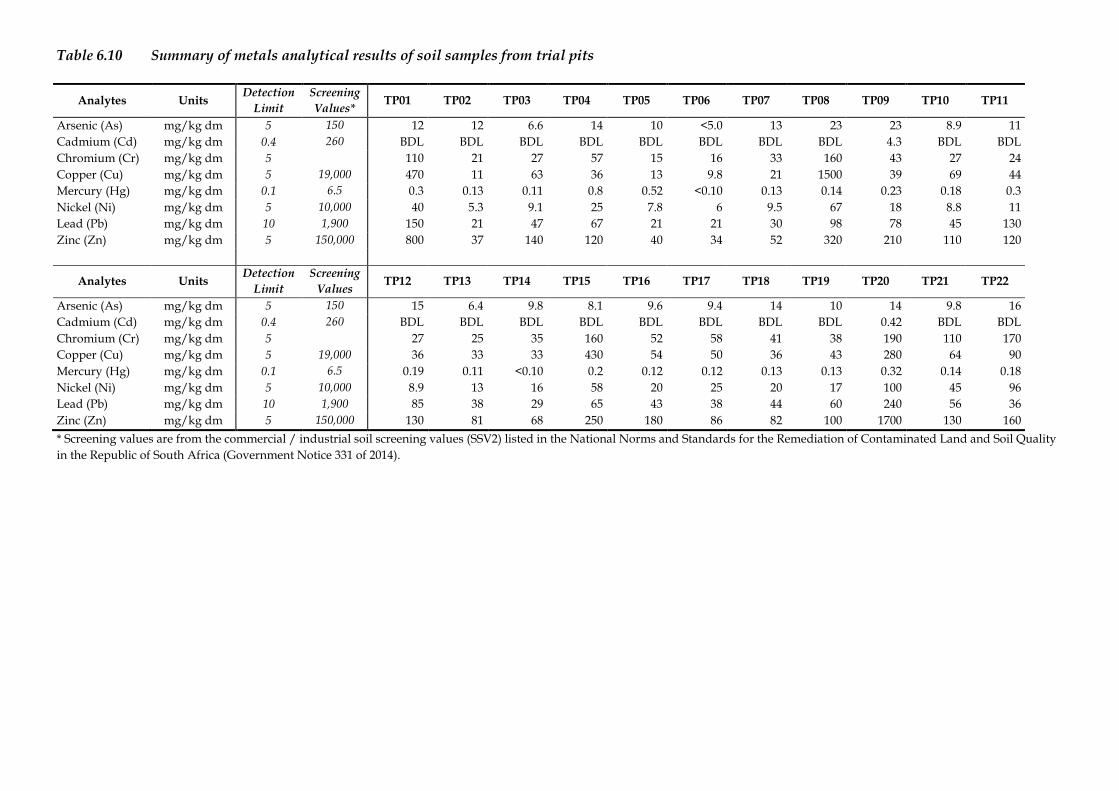
Table 6.10 Summary of metals analytical results of soil samples from trial pits
Analytes Units Detection Limit
Screening Values* TP01 TP02 TP03 TP04 TP05 TP06 TP07 TP08 TP09 TP10 TP11
Arsenic (As) mg/kg dm 5 150 12 12 6.6 14 10 <5.0 13 23 23 8.9 11 Cadmium (Cd) mg/kg dm 0.4 260 BDL BDL BDL BDL BDL BDL BDL BDL 4.3 BDL BDL Chromium (Cr) mg/kg dm 5 110 21 27 57 15 16 33 160 43 27 24 Copper (Cu) mg/kg dm 5 19,000 470 11 63 36 13 9.8 21 1500 39 69 44 Mercury (Hg) mg/kg dm 0.1 6.5 0.3 0.13 0.11 0.8 0.52 <0.10 0.13 0.14 0.23 0.18 0.3 Nickel (Ni) mg/kg dm 5 10,000 40 5.3 9.1 25 7.8 6 9.5 67 18 8.8 11 Lead (Pb) mg/kg dm 10 1,900 150 21 47 67 21 21 30 98 78 45 130 Zinc (Zn) mg/kg dm 5 150,000 800 37 140 120 40 34 52 320 210 110 120
Analytes Units Detection Limit
Screening Values TP12 TP13 TP14 TP15 TP16 TP17 TP18 TP19 TP20 TP21 TP22
Arsenic (As) mg/kg dm 5 150 15 6.4 9.8 8.1 9.6 9.4 14 10 14 9.8 16 Cadmium (Cd) mg/kg dm 0.4 260 BDL BDL BDL BDL BDL BDL BDL BDL 0.42 BDL BDL Chromium (Cr) mg/kg dm 5 27 25 35 160 52 58 41 38 190 110 170 Copper (Cu) mg/kg dm 5 19,000 36 33 33 430 54 50 36 43 280 64 90 Mercury (Hg) mg/kg dm 0.1 6.5 0.19 0.11 <0.10 0.2 0.12 0.12 0.13 0.13 0.32 0.14 0.18 Nickel (Ni) mg/kg dm 5 10,000 8.9 13 16 58 20 25 20 17 100 45 96 Lead (Pb) mg/kg dm 10 1,900 85 38 29 65 43 38 44 60 240 56 36 Zinc (Zn) mg/kg dm 5 150,000 130 81 68 250 180 86 82 100 1700 130 160 * Screening values are from the commercial / industrial soil screening values (SSV2) listed in the National Norms and Standards for the Remediation of Contaminated Land and Soil Quality in the Republic of South Africa (Government Notice 331 of 2014).
ENVIRONMENTAL RESOURCES MANAGEMENT BURGAN CAPE TERMINALS FEIR
6-32
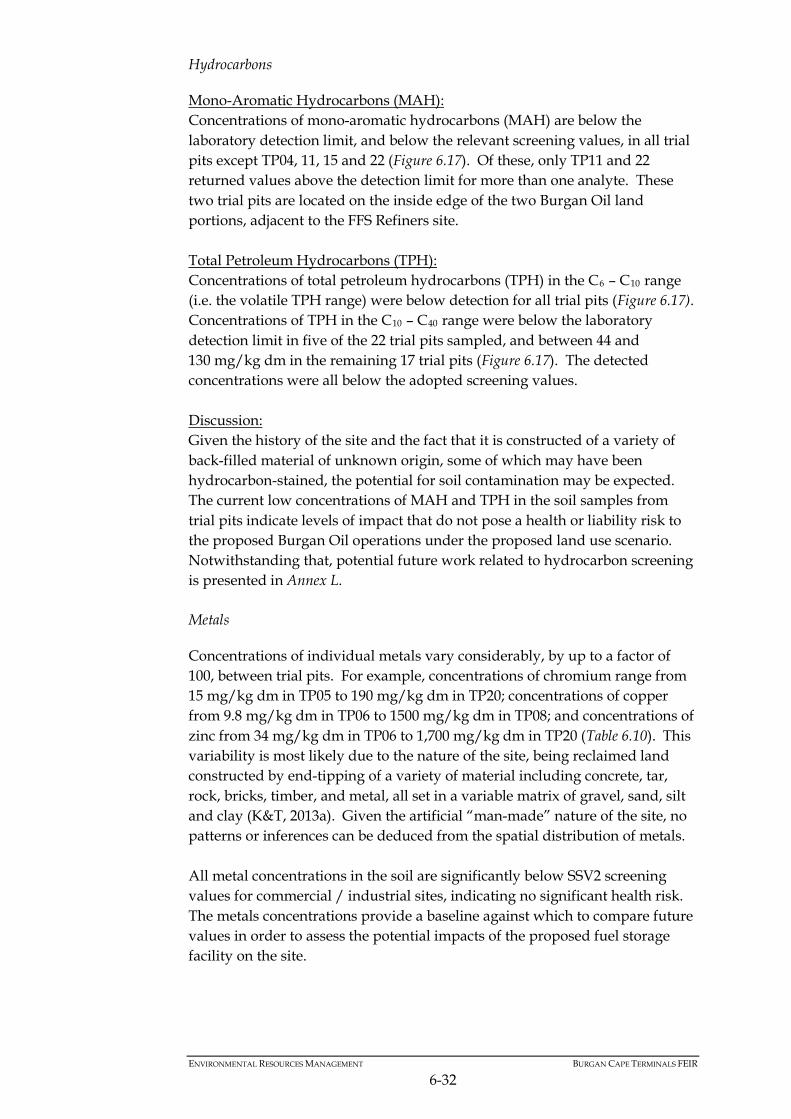
Hydrocarbons
Mono-Aromatic Hydrocarbons (MAH): Concentrations of mono-aromatic hydrocarbons (MAH) are below the laboratory detection limit, and below the relevant screening values, in all trial pits except TP04, 11, 15 and 22 (Figure 6.17). Of these, only TP11 and 22 returned values above the detection limit for more than one analyte. These two trial pits are located on the inside edge of the two Burgan Oil land portions, adjacent to the FFS Refiners site. Total Petroleum Hydrocarbons (TPH): Concentrations of total petroleum hydrocarbons (TPH) in the C6 – C10 range (i.e. the volatile TPH range) were below detection for all trial pits (Figure 6.17). Concentrations of TPH in the C10 – C40 range were below the laboratory detection limit in five of the 22 trial pits sampled, and between 44 and 130 mg/kg dm in the remaining 17 trial pits (Figure 6.17). The detected concentrations were all below the adopted screening values. Discussion: Given the history of the site and the fact that it is constructed of a variety of back-filled material of unknown origin, some of which may have been hydrocarbon-stained, the potential for soil contamination may be expected. The current low concentrations of MAH and TPH in the soil samples from trial pits indicate levels of impact that do not pose a health or liability risk to the proposed Burgan Oil operations under the proposed land use scenario. Notwithstanding that, potential future work related to hydrocarbon screening is presented in Annex L. Metals
Concentrations of individual metals vary considerably, by up to a factor of 100, between trial pits. For example, concentrations of chromium range from 15 mg/kg dm in TP05 to 190 mg/kg dm in TP20; concentrations of copper from 9.8 mg/kg dm in TP06 to 1500 mg/kg dm in TP08; and concentrations of zinc from 34 mg/kg dm in TP06 to 1,700 mg/kg dm in TP20 (Table 6.10). This variability is most likely due to the nature of the site, being reclaimed land constructed by end-tipping of a variety of material including concrete, tar, rock, bricks, timber, and metal, all set in a variable matrix of gravel, sand, silt and clay (K&T, 2013a). Given the artificial “man-made” nature of the site, no patterns or inferences can be deduced from the spatial distribution of metals. All metal concentrations in the soil are significantly below SSV2 screening values for commercial / industrial sites, indicating no significant health risk. The metals concentrations provide a baseline against which to compare future values in order to assess the potential impacts of the proposed fuel storage facility on the site.
ENVIRONMENTAL RESOURCES MANAGEMENT BURGAN CAPE TERMINALS FEIR
6-33
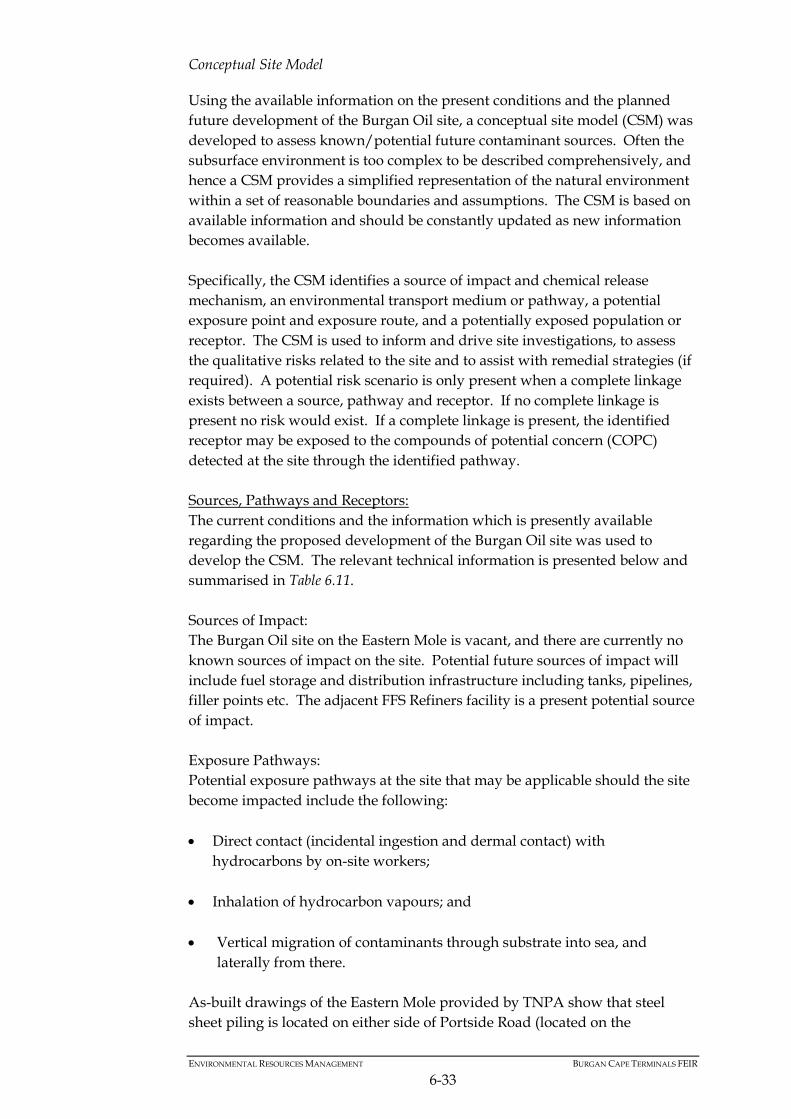
Conceptual Site Model
Using the available information on the present conditions and the planned future development of the Burgan Oil site, a conceptual site model (CSM) was developed to assess known/potential future contaminant sources. Often the subsurface environment is too complex to be described comprehensively, and hence a CSM provides a simplified representation of the natural environment within a set of reasonable boundaries and assumptions. The CSM is based on available information and should be constantly updated as new information becomes available. Specifically, the CSM identifies a source of impact and chemical release mechanism, an environmental transport medium or pathway, a potential exposure point and exposure route, and a potentially exposed population or receptor. The CSM is used to inform and drive site investigations, to assess the qualitative risks related to the site and to assist with remedial strategies (if required). A potential risk scenario is only present when a complete linkage exists between a source, pathway and receptor. If no complete linkage is present no risk would exist. If a complete linkage is present, the identified receptor may be exposed to the compounds of potential concern (COPC) detected at the site through the identified pathway. Sources, Pathways and Receptors: The current conditions and the information which is presently available regarding the proposed development of the Burgan Oil site was used to develop the CSM. The relevant technical information is presented below and summarised in Table 6.11. Sources of Impact: The Burgan Oil site on the Eastern Mole is vacant, and there are currently no known sources of impact on the site. Potential future sources of impact will include fuel storage and distribution infrastructure including tanks, pipelines, filler points etc. The adjacent FFS Refiners facility is a present potential source of impact. Exposure Pathways: Potential exposure pathways at the site that may be applicable should the site become impacted include the following: • Direct contact (incidental ingestion and dermal contact) with
hydrocarbons by on-site workers;
• Inhalation of hydrocarbon vapours; and
• Vertical migration of contaminants through substrate into sea, and laterally from there.
As-built drawings of the Eastern Mole provided by TNPA show that steel sheet piling is located on either side of Portside Road (located on the
ENVIRONMENTAL RESOURCES MANAGEMENT BURGAN CAPE TERMINALS FEIR
6-34
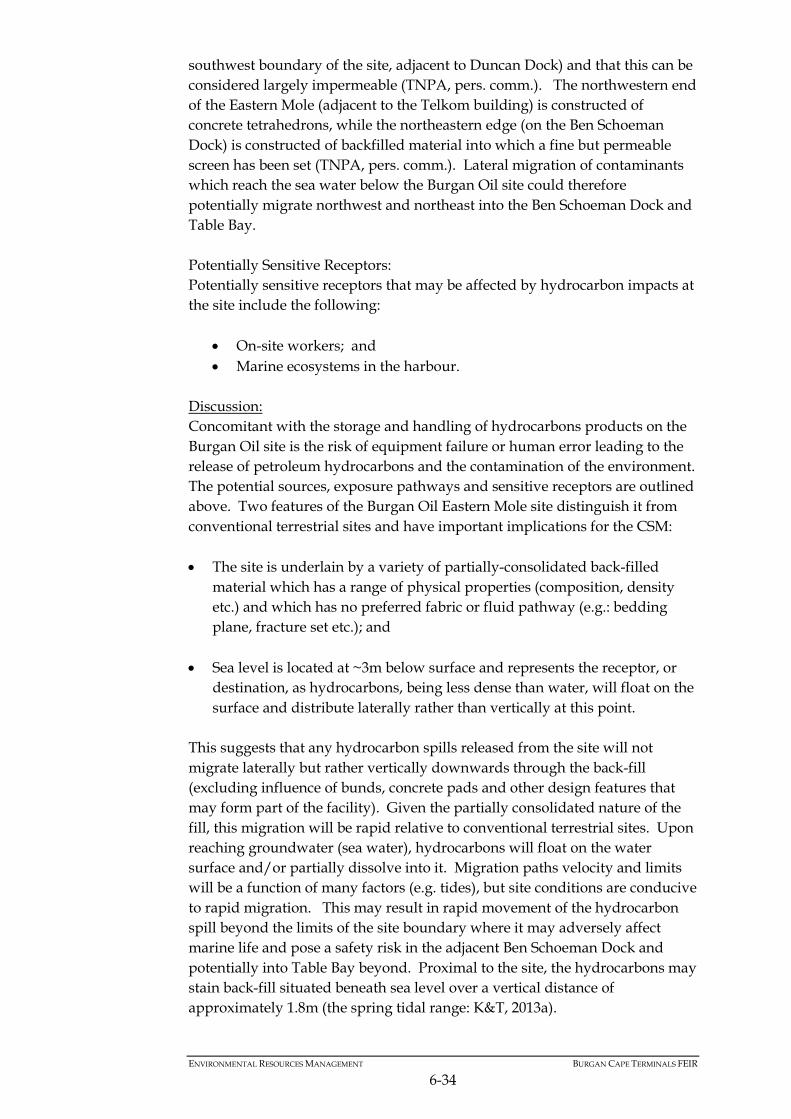
southwest boundary of the site, adjacent to Duncan Dock) and that this can be considered largely impermeable (TNPA, pers. comm.). The northwestern end of the Eastern Mole (adjacent to the Telkom building) is constructed of concrete tetrahedrons, while the northeastern edge (on the Ben Schoeman Dock) is constructed of backfilled material into which a fine but permeable screen has been set (TNPA, pers. comm.). Lateral migration of contaminants which reach the sea water below the Burgan Oil site could therefore potentially migrate northwest and northeast into the Ben Schoeman Dock and Table Bay. Potentially Sensitive Receptors: Potentially sensitive receptors that may be affected by hydrocarbon impacts at the site include the following:
• On-site workers; and • Marine ecosystems in the harbour.
Discussion: Concomitant with the storage and handling of hydrocarbons products on the Burgan Oil site is the risk of equipment failure or human error leading to the release of petroleum hydrocarbons and the contamination of the environment. The potential sources, exposure pathways and sensitive receptors are outlined above. Two features of the Burgan Oil Eastern Mole site distinguish it from conventional terrestrial sites and have important implications for the CSM: • The site is underlain by a variety of partially-consolidated back-filled
material which has a range of physical properties (composition, density etc.) and which has no preferred fabric or fluid pathway (e.g.: bedding plane, fracture set etc.); and
• Sea level is located at ~3m below surface and represents the receptor, or destination, as hydrocarbons, being less dense than water, will float on the surface and distribute laterally rather than vertically at this point.
This suggests that any hydrocarbon spills released from the site will not migrate laterally but rather vertically downwards through the back-fill (excluding influence of bunds, concrete pads and other design features that may form part of the facility). Given the partially consolidated nature of the fill, this migration will be rapid relative to conventional terrestrial sites. Upon reaching groundwater (sea water), hydrocarbons will float on the water surface and/or partially dissolve into it. Migration paths velocity and limits will be a function of many factors (e.g. tides), but site conditions are conducive to rapid migration. This may result in rapid movement of the hydrocarbon spill beyond the limits of the site boundary where it may adversely affect marine life and pose a safety risk in the adjacent Ben Schoeman Dock and potentially into Table Bay beyond. Proximal to the site, the hydrocarbons may stain back-fill situated beneath sea level over a vertical distance of approximately 1.8m (the spring tidal range: K&T, 2013a).
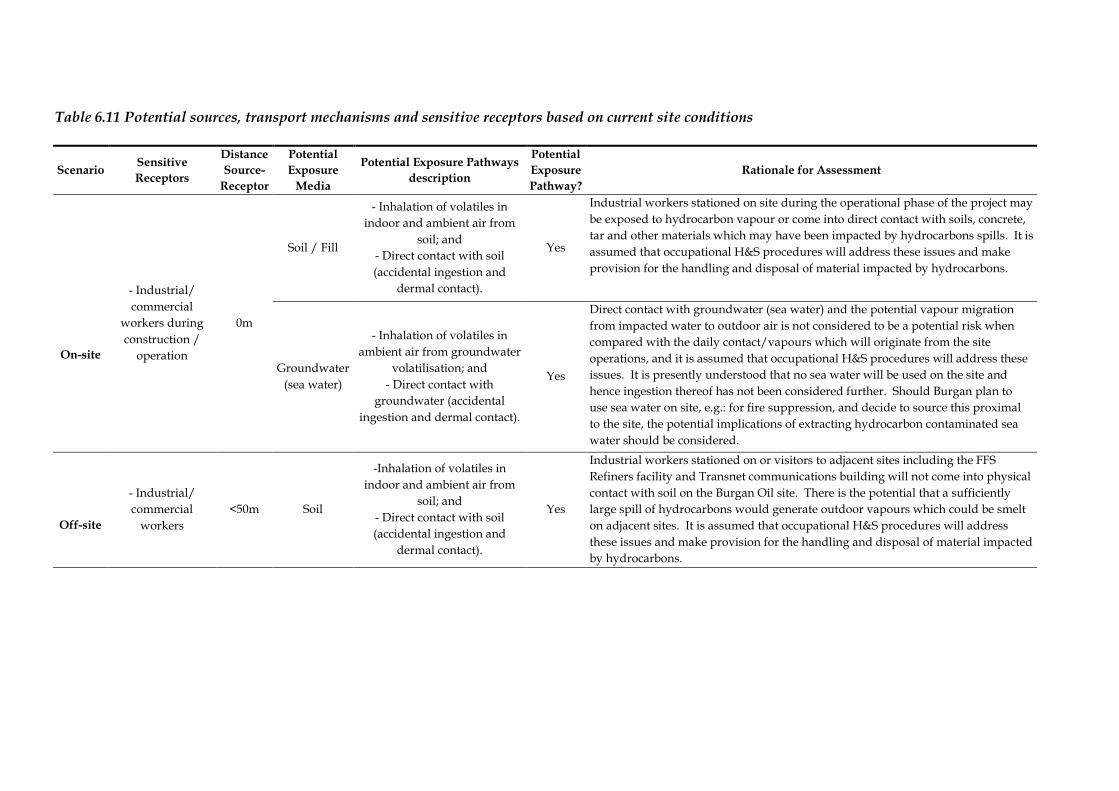
Table 6.11 Potential sources, transport mechanisms and sensitive receptors based on current site conditions
Scenario Sensitive Receptors
Distance Source-
Receptor
Potential Exposure
Media
Potential Exposure Pathways description
Potential Exposure Pathway?
Rationale for Assessment
On-site
- Industrial/ commercial
workers during construction /
operation
0m
Soil / Fill
- Inhalation of volatiles in indoor and ambient air from
soil; and - Direct contact with soil (accidental ingestion and
dermal contact).
Yes
Industrial workers stationed on site during the operational phase of the project may be exposed to hydrocarbon vapour or come into direct contact with soils, concrete, tar and other materials which may have been impacted by hydrocarbons spills. It is assumed that occupational H&S procedures will address these issues and make provision for the handling and disposal of material impacted by hydrocarbons.
Groundwater (sea water)
- Inhalation of volatiles in ambient air from groundwater
volatilisation; and - Direct contact with
groundwater (accidental ingestion and dermal contact).
Yes
Direct contact with groundwater (sea water) and the potential vapour migration from impacted water to outdoor air is not considered to be a potential risk when compared with the daily contact/vapours which will originate from the site operations, and it is assumed that occupational H&S procedures will address these issues. It is presently understood that no sea water will be used on the site and hence ingestion thereof has not been considered further. Should Burgan plan to use sea water on site, e.g.: for fire suppression, and decide to source this proximal to the site, the potential implications of extracting hydrocarbon contaminated sea water should be considered.
Off-site
- Industrial/ commercial
workers <50m Soil
-Inhalation of volatiles in indoor and ambient air from
soil; and - Direct contact with soil (accidental ingestion and
dermal contact).
Yes
Industrial workers stationed on or visitors to adjacent sites including the FFS Refiners facility and Transnet communications building will not come into physical contact with soil on the Burgan Oil site. There is the potential that a sufficiently large spill of hydrocarbons would generate outdoor vapours which could be smelt on adjacent sites. It is assumed that occupational H&S procedures will address these issues and make provision for the handling and disposal of material impacted by hydrocarbons.
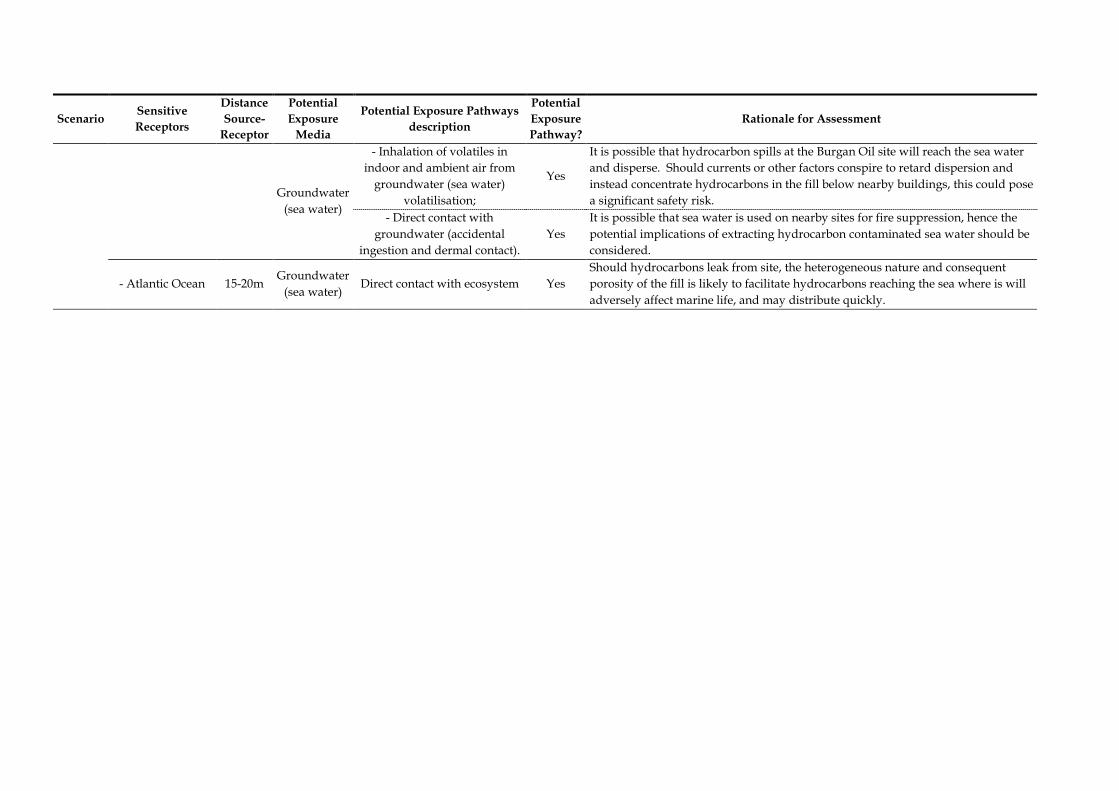
Scenario Sensitive Receptors
Distance Source-
Receptor
Potential Exposure
Media
Potential Exposure Pathways description
Potential Exposure Pathway?
Rationale for Assessment
Groundwater (sea water)
- Inhalation of volatiles in indoor and ambient air from
groundwater (sea water) volatilisation;
Yes
It is possible that hydrocarbon spills at the Burgan Oil site will reach the sea water and disperse. Should currents or other factors conspire to retard dispersion and instead concentrate hydrocarbons in the fill below nearby buildings, this could pose a significant safety risk.
- Direct contact with groundwater (accidental
ingestion and dermal contact). Yes
It is possible that sea water is used on nearby sites for fire suppression, hence the potential implications of extracting hydrocarbon contaminated sea water should be considered.
- Atlantic Ocean 15-20m Groundwater
(sea water) Direct contact with ecosystem Yes
Should hydrocarbons leak from site, the heterogeneous nature and consequent porosity of the fill is likely to facilitate hydrocarbons reaching the sea where is will adversely affect marine life, and may distribute quickly.
ENVIRONMENTAL RESOURCES MANAGEMENT BURGAN CAPE TERMINALS FEIR
6-37
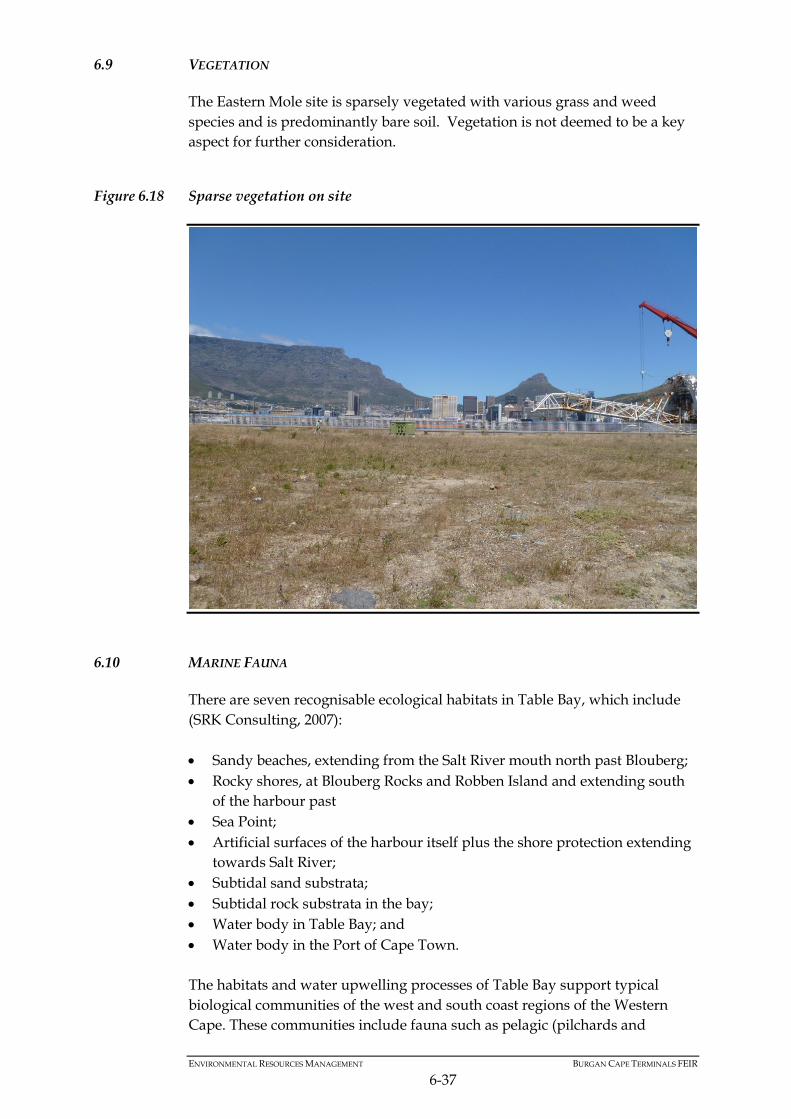
6.9 VEGETATION
The Eastern Mole site is sparsely vegetated with various grass and weed species and is predominantly bare soil. Vegetation is not deemed to be a key aspect for further consideration.
Figure 6.18 Sparse vegetation on site
6.10 MARINE FAUNA
There are seven recognisable ecological habitats in Table Bay, which include (SRK Consulting, 2007): • Sandy beaches, extending from the Salt River mouth north past Blouberg; • Rocky shores, at Blouberg Rocks and Robben Island and extending south
of the harbour past • Sea Point; • Artificial surfaces of the harbour itself plus the shore protection extending
towards Salt River; • Subtidal sand substrata; • Subtidal rock substrata in the bay; • Water body in Table Bay; and • Water body in the Port of Cape Town. The habitats and water upwelling processes of Table Bay support typical biological communities of the west and south coast regions of the Western Cape. These communities include fauna such as pelagic (pilchards and
ENVIRONMENTAL RESOURCES MANAGEMENT BURGAN CAPE TERMINALS FEIR
6-38
anchovy) and demersal (hake and kingklip) fish species, near shore species (such as various linefish, rock lobster and abalone), mammals (such as seals and whales) and seabirds (such as penguins, gannets and cormorants) (SRK Consulting, 2007). It has been noted that Table Bay does not appear to be critically important for marine fauna as either a foraging or breeding area, or for the fishing industry. Exceptions to this are endemic seabirds, such as Bank Cormorants and the African Penguin. These species use Table Bay for feeding and breeding purposes. The Bank Cormorant Phalacracorax neglectus and the African Penguin Spheniscus demersus are listed as Endangered according to the International Union for Conservation of Nature (IUCN), while the African Black Oystercatcher Haematopus moquini is classified as Near Threatened (SRK Consulting, 2007 and IUCN, 2014). Table Bay is also used by resident, semi-resident and migrant cetaceans (such as dolphins and whales). The most common cetacean is the Southern Right Whale Eubalaena australis which migrates into South African waters between May to October/November. The Southern Right Whale is listed as Least Concern according to IUCN (SRK Consulting, 2007 and IUCN, 2014). There are four species of seals found around the West Coast. These include the Cape Fur Seal Arctocephalus pusillus, Subantarctic Fur Seal Arctocephalus tropicalis, the Leopard Seal Hydrurga leptonyx and the Southern Elephant Seal Mirounga leonina. The Cape Fur Seal is the most common in Table Bay, but has no breeding colonies in the bay (SRK Consulting, 2007). Large numbers of juvenile rock lobsters have been found on the vertical faces of the outer harbour wall. Encrusting corallines, barnacles, sea urchins, mussels and sponges are other components of the wall community. It has been found that the biofouling community appears to be well-developed at the outer harbour areas (SRK Consulting, 2007). Previous studies undertaken have shown that further into the harbour the bentihic species diversity declines drastically. Barnacles, sea squirts, green algae, the alien anemone Metridium senile and the alien European shore crab Carninus maenas were found. The benthos inhabiting the sediments within the harbour appears to be limited or completely absent in the interior of the Victoria and Alfred Basins (SRK Consulting, 2007). At the time of writing there appears no published information on the communities inhabiting the water column in the Port of Cape Town. However, it is known that euphausiids occasionally occur in the port and small shoals of Mullet can be common in the outer harbour area. There is a resident or semi-resident Fur Seal population within the Port of Cape Town (SRK Consulting, 2007). Seabirds are arguably the most vulnerable to water surface oil. An oil spill occurred in the Port of Cape Town Harbour in May 1998. The result of which
ENVIRONMENTAL RESOURCES MANAGEMENT BURGAN CAPE TERMINALS FEIR
6-39
was the oiling of over 500 African Penguins Spheniscus demersus. These penguins were taken to the SANCCOB Seabird Rescue Centre in Table View, cleaned, treated and eventually released. Of the 547 penguins released, 266 (48.6 percent) had been resighted alive at breeding colonies, of which 12 had attempted breeding, during the first year following the oil spill (Avian Demography Unit, University of Cape Town, 2000). Oil causes a bird’s feathers to mat and separate, resulting in a loss of buoyancy and the ability to regulate body temperature. Contact with oil on the bird’s skin or face can lead to skin and eye lesions. Furthermore, birds need to preen their feathers to keep warm and dry, remove parasites and keep feathers in good condition. It is possible that birds may ingest oil while preening oiled feathers or by eating contaminated food. Ingestion of oil can lead to ulcers, pneumonia, liver damage, and other life-threatening conditions (NWF, 2014).