Embed Size (px)
Citation preview
8th Annual J.P. Morgan Homebuilding & Building Products Conference
May 19, 2015
J.P. Morgan Homebuilding and Building Products Conference
Forward-Looking Statements
This presentation may include “forward-looking statements” as defined by the Private Securities Litigation Reform Act of 1995.Although D.R. Horton believes any such statements are based on reasonable assumptions, there is no assurance that actualoutcomes will not be materially different. Factors that may cause the actual results to be materially different from the futureresults expressed by the forward-looking statements include, but are not limited to: potential deterioration in homebuildingindustry conditions or general economic conditions; the cyclical nature of the homebuilding industry and changes in economic,real estate and other conditions; constriction of the credit markets, which could limit our ability to access capital and increaseour costs of capital; reductions in the availability of mortgage financing and the liquidity provided by government-sponsoredenterprises, the effects of government programs, a decrease in our ability to sell mortgage loans on attractive terms or anincrease in mortgage interest rates; the risks associated with our land and lot inventory; home warranty and construction defectclaims; supply shortages and other risks of acquiring land, building materials and skilled labor; reductions in the availability ofperformance bonds; increases in the costs of owning a home; the impact of an inflationary, deflationary or higher interest rateenvironment; the effects of governmental regulations and environmental matters on our homebuilding operations; the effectsof governmental regulation on our financial services operations; our substantial debt and our ability to comply with related debtcovenants, restrictions and limitations; competitive conditions within the homebuilding and financial services industries; ourability to effect our growth strategies or acquisitions successfully; our ability to realize the full amount of our deferred incometax assets; the effects of the loss of key personnel; the effects of negative publicity; and information technology failures anddata security breaches. Additional information about issues that could lead to material changes in performance is contained inD.R. Horton’s annual report on Form 10-K and our most recent quarterly report on Form 10-Q, both of which are filed with theSecurities and Exchange Commission.
2
J.P. Morgan Homebuilding and Building Products Conference
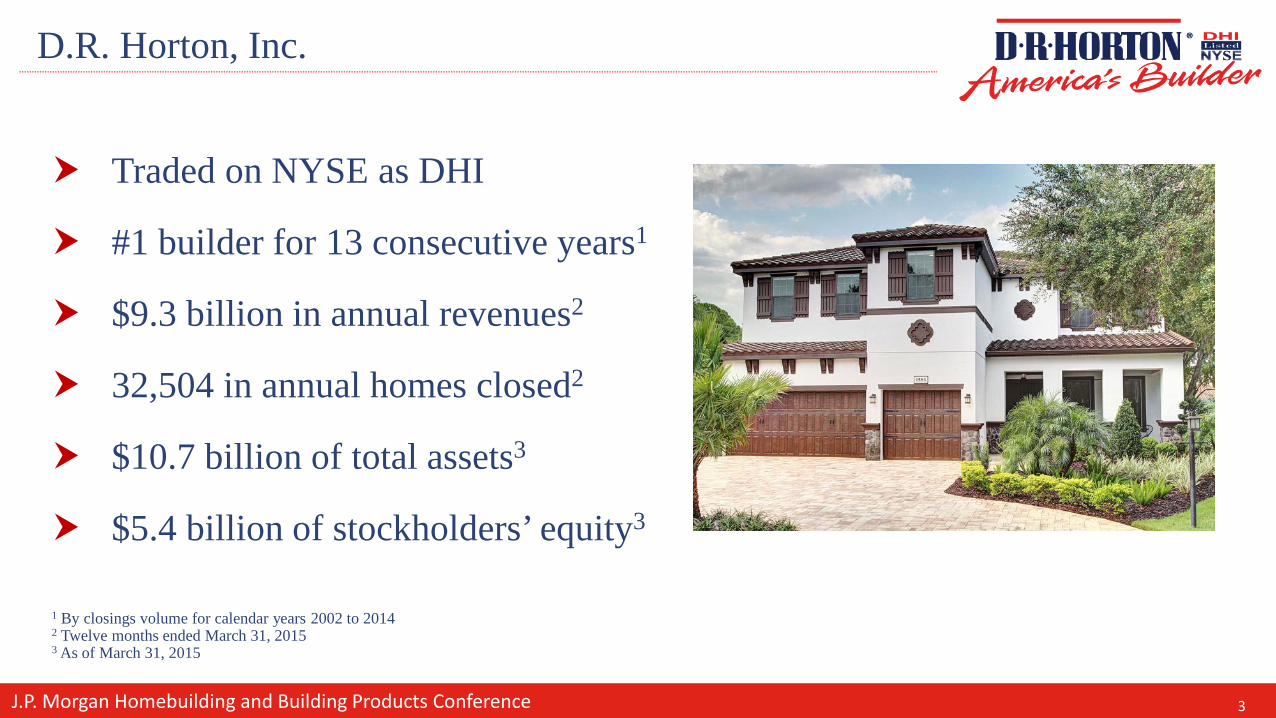
D.R. Horton, Inc.
Traded on NYSE as DHI
#1 builder for 13 consecutive years1
$9.3 billion in annual revenues2
32,504 in annual homes closed2
$10.7 billion of total assets3
$5.4 billion of stockholders’ equity3
1 By closings volume for calendar years 2002 to 20142 Twelve months ended March 31, 20153 As of March 31, 2015
3
J.P. Morgan Homebuilding and Building Products Conference
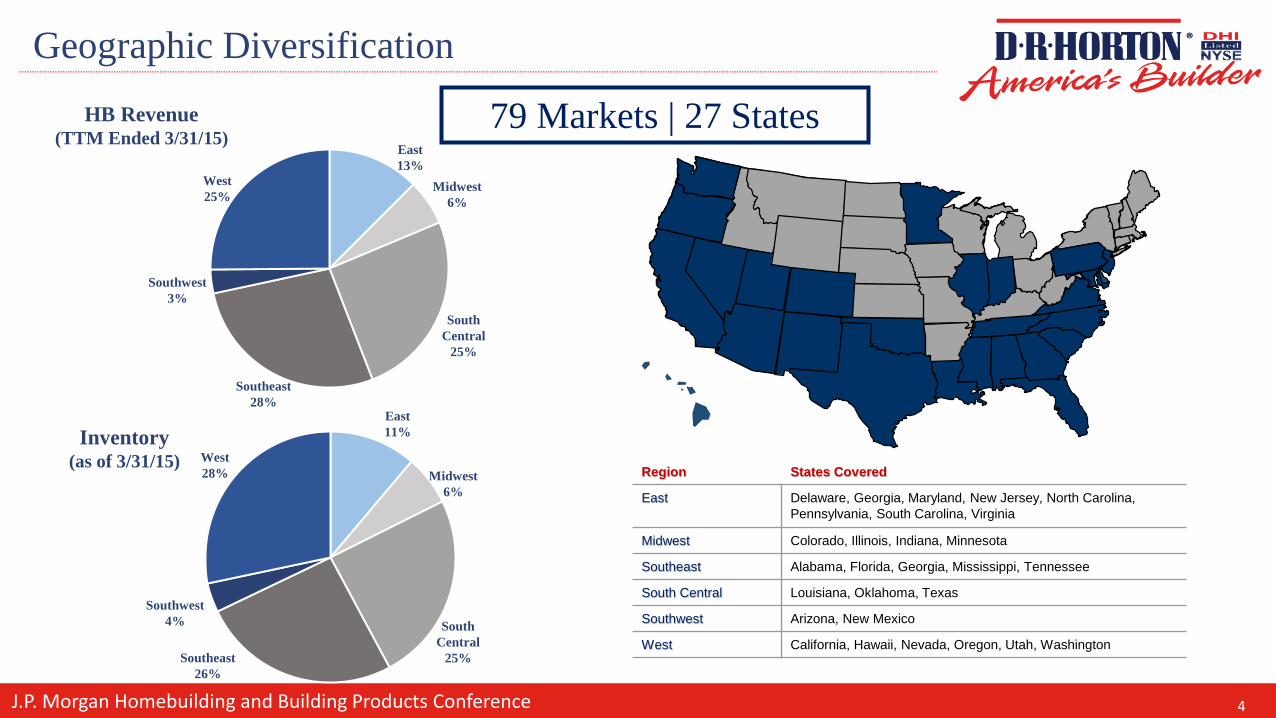
Geographic Diversification
79 Markets | 27 States
Region States Covered
East Delaware, Georgia, Maryland, New Jersey, North Carolina, Pennsylvania, South Carolina, Virginia
Midwest Colorado, Illinois, Indiana, Minnesota
Southeast Alabama, Florida, Georgia, Mississippi, Tennessee
South Central Louisiana, Oklahoma, Texas
Southwest Arizona, New Mexico
West California, Hawaii, Nevada, Oregon, Utah, Washington
South Central
25%
Southwest3%
West25%
HB Revenue(TTM Ended 3/31/15)
Midwest6%
South Central
25%Southeast26%
Inventory (as of 3/31/15)
East13%
Midwest6%
Southeast28%
West28%
Southwest4%
East11%
4
J.P. Morgan Homebuilding and Building Products Conference
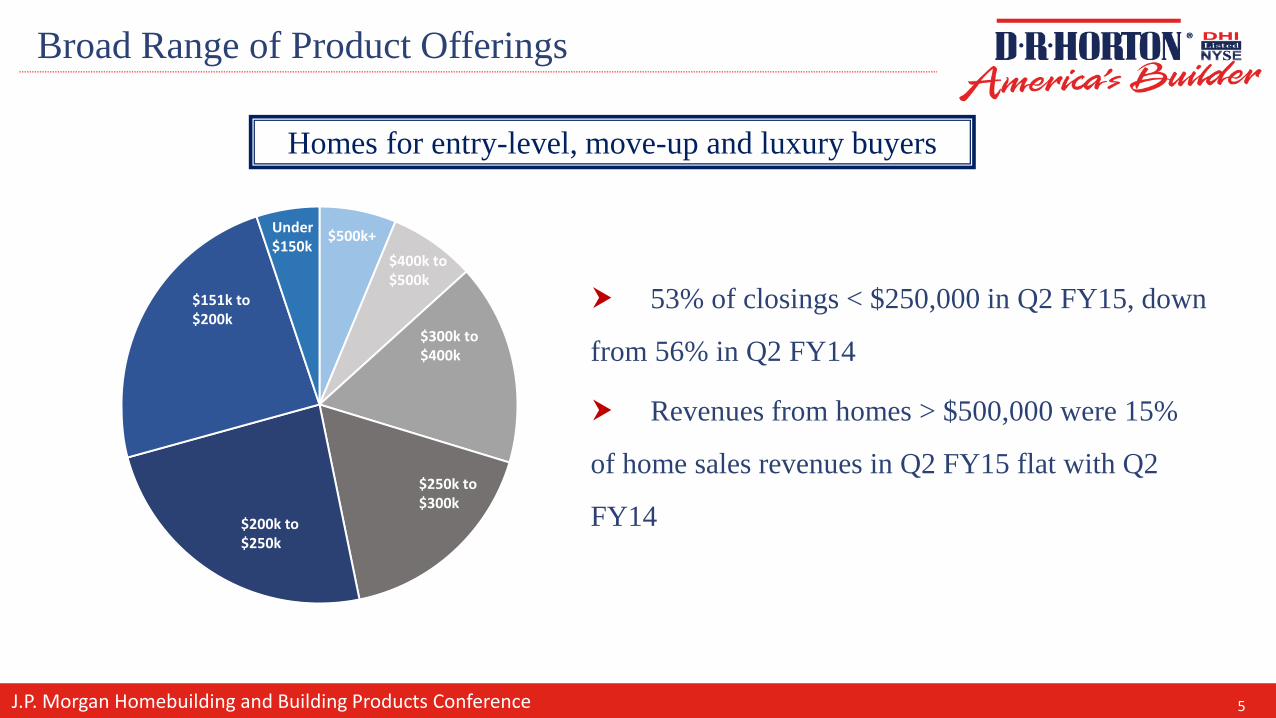
Broad Range of Product Offerings
Homes for entry-level, move-up and luxury buyers
53% of closings < $250,000 in Q2 FY15, down
from 56% in Q2 FY14
Revenues from homes > $500,000 were 15%
of home sales revenues in Q2 FY15 flat with Q2
FY14
Under $150k
$200k to $250k
$250k to $300k
$300k to $400k
$400k to $500k
$500k+
$500k+
$151k to $200k
5
J.P. Morgan Homebuilding and Building Products Conference
Competitive Advantage
Average employee tenure:
Region Presidents – over 20 years
Division Presidents – 15 years
City Managers – over 10 years
6

J.P. Morgan Homebuilding and Building Products Conference
D.R. Horton
The Heart of our Business
79 markets and 27 states
In the second quarter, accounted for:
79% of homes sold
85% of homes closed
87% of home sales revenue
Q2 Average Closing Price: $289,000
Reported metrics for D.R. Horton include our Breland Homes and Crown Communities operations
7
J.P. Morgan Homebuilding and Building Products Conference
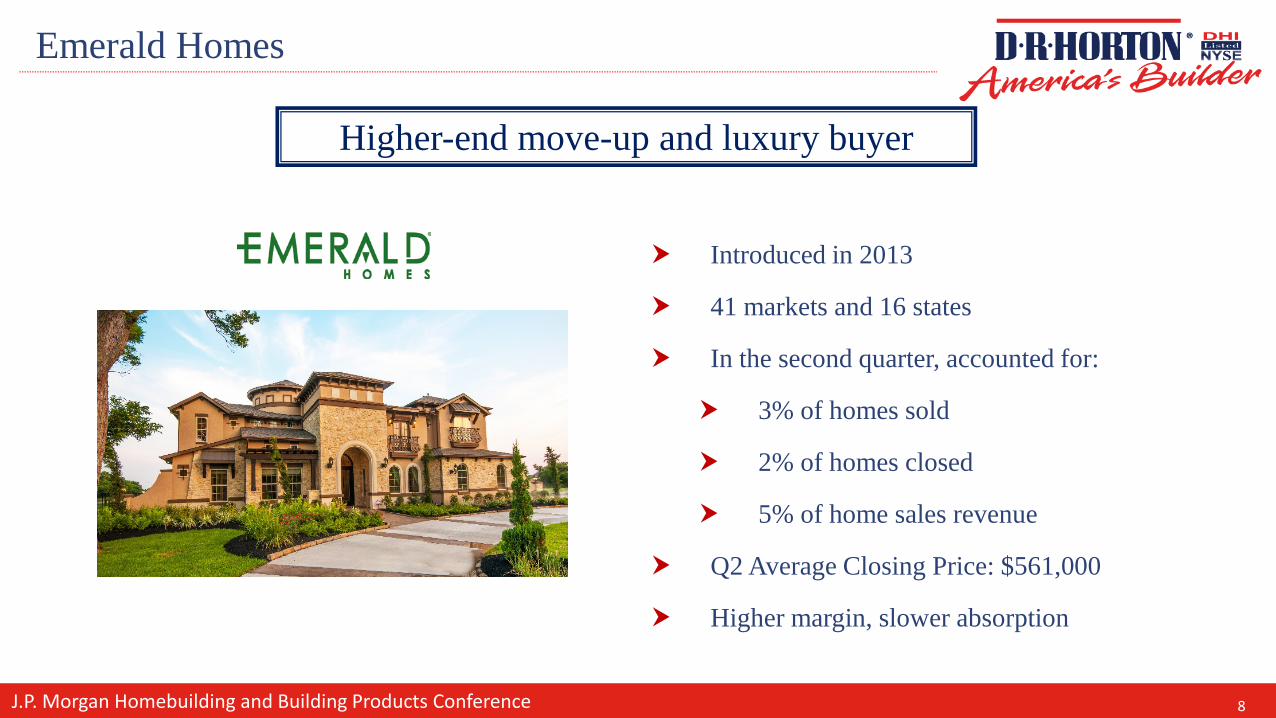
Emerald Homes
Higher-end move-up and luxury buyer
Introduced in 2013
41 markets and 16 states
In the second quarter, accounted for:
3% of homes sold
2% of homes closed
5% of home sales revenue
Q2 Average Closing Price: $561,000
Higher margin, slower absorption
8
J.P. Morgan Homebuilding and Building Products Conference
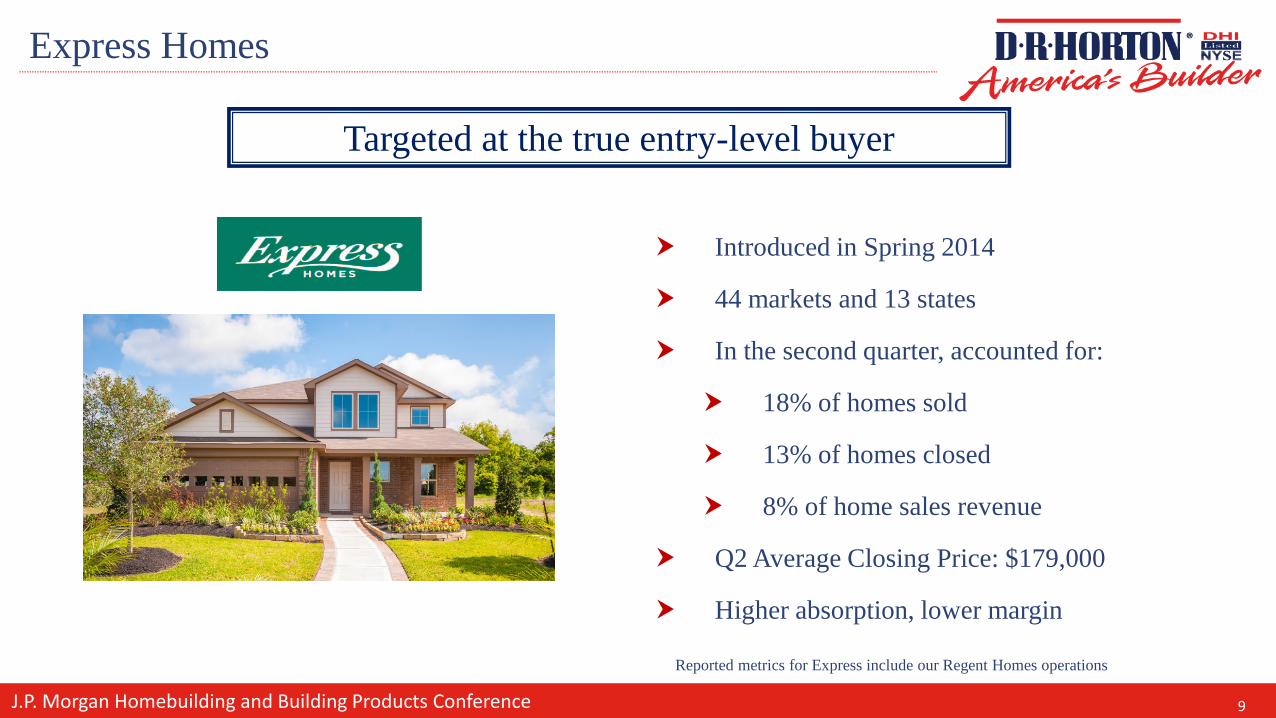
Express Homes
Targeted at the true entry-level buyer
$151k to $200k
Introduced in Spring 2014
44 markets and 13 states
In the second quarter, accounted for:
18% of homes sold
13% of homes closed
8% of home sales revenue
Q2 Average Closing Price: $179,000
Higher absorption, lower margin
Reported metrics for Express include our Regent Homes operations
9
J.P. Morgan Homebuilding and Building Products Conference
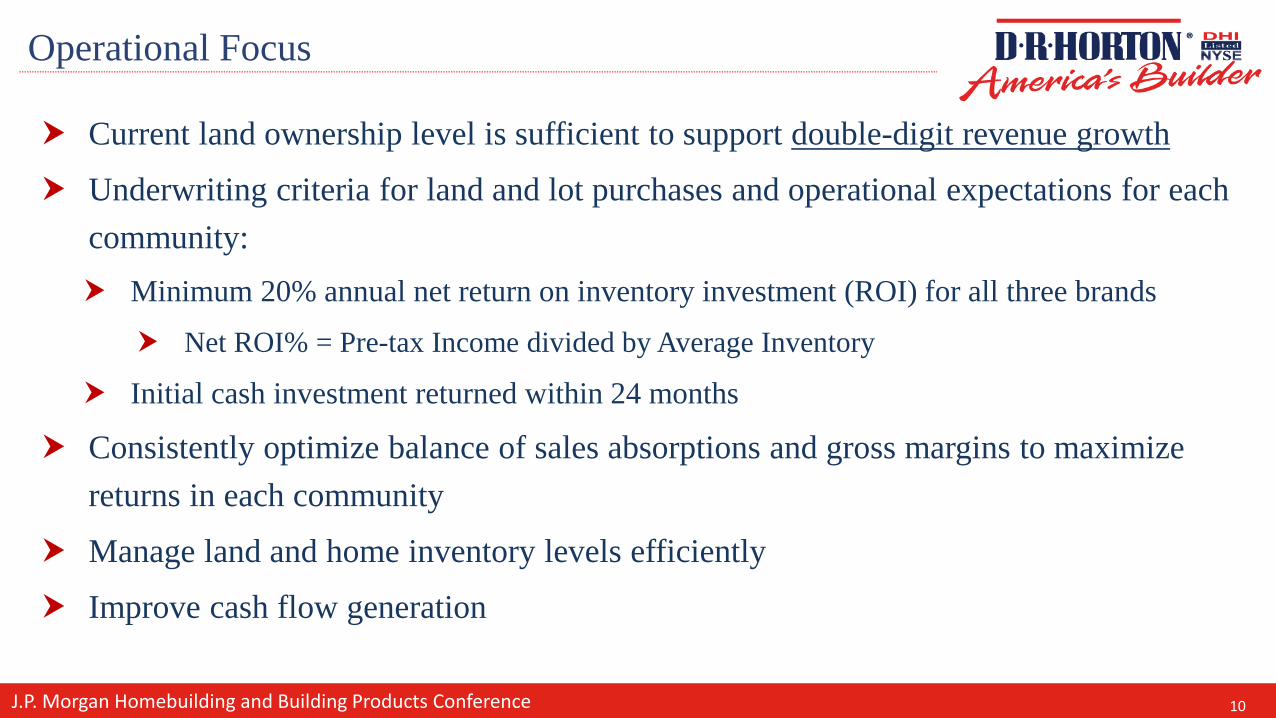
Operational Focus
Current land ownership level is sufficient to support double-digit revenue growth
Underwriting criteria for land and lot purchases and operational expectations for each community: Minimum 20% annual net return on inventory investment (ROI) for all three brands
Net ROI% = Pre-tax Income divided by Average Inventory
Initial cash investment returned within 24 months
Consistently optimize balance of sales absorptions and gross margins to maximize returns in each community
Manage land and home inventory levels efficiently
Improve cash flow generation
10
J.P. Morgan Homebuilding and Building Products Conference
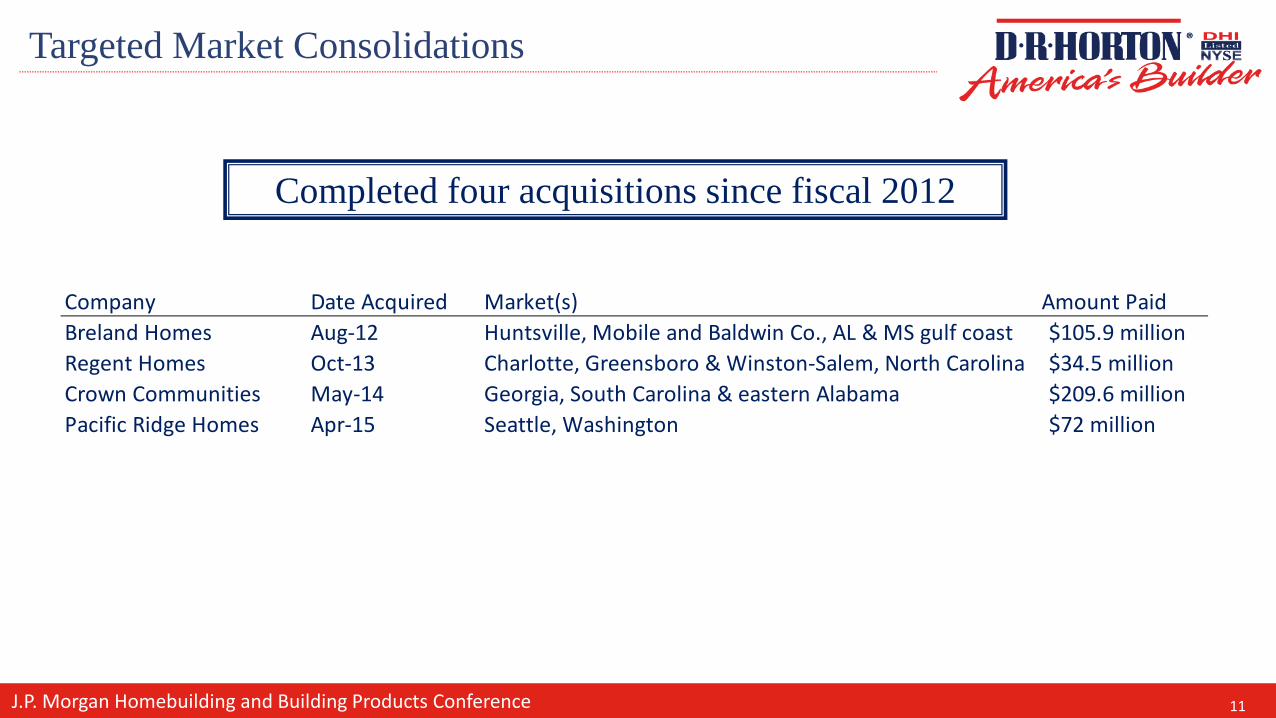
Targeted Market Consolidations
Completed four acquisitions since fiscal 2012
$151k to $200kCompany Date Acquired Market(s) Amount Paid
Breland Homes Aug-12 Huntsville, Mobile and Baldwin Co., AL & MS gulf coast $105.9 millionRegent Homes Oct-13 Charlotte, Greensboro & Winston-Salem, North Carolina $34.5 millionCrown Communities May-14 Georgia, South Carolina & eastern Alabama $209.6 millionPacific Ridge Homes Apr-15 Seattle, Washington $72 million
11
J.P. Morgan Homebuilding and Building Products Conference
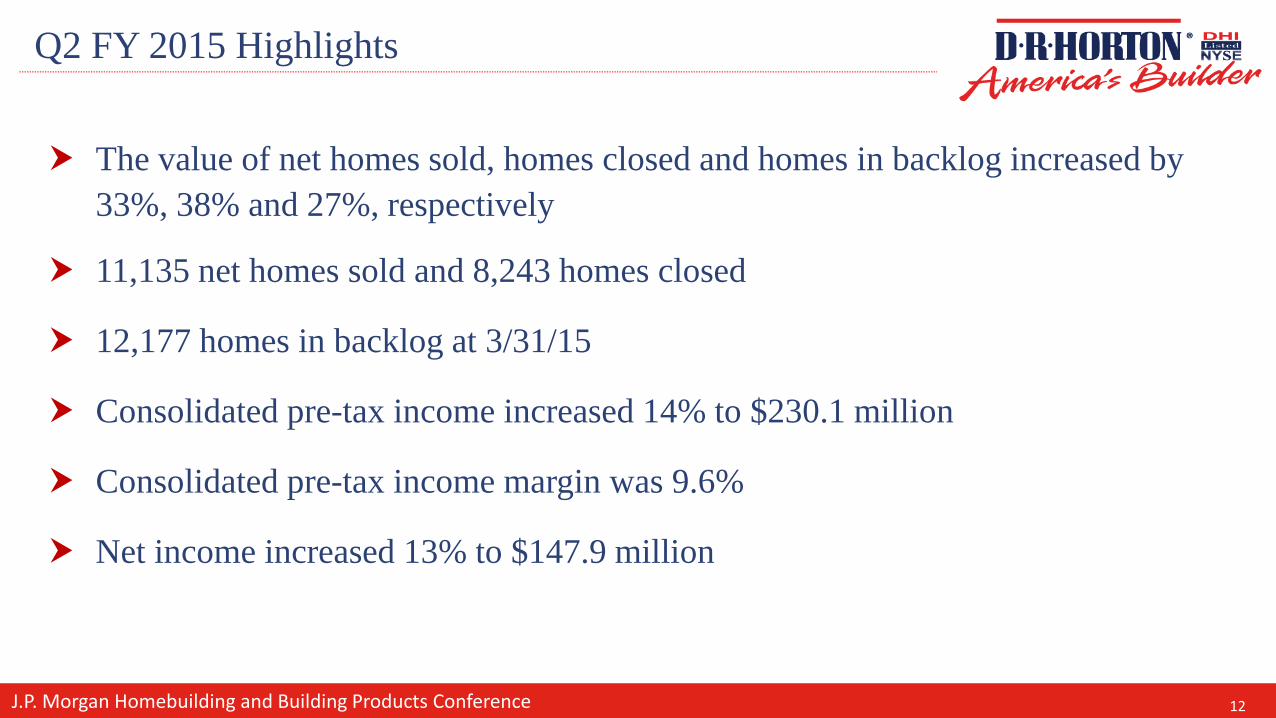
Q2 FY 2015 Highlights
The value of net homes sold, homes closed and homes in backlog increased by 33%, 38% and 27%, respectively
11,135 net homes sold and 8,243 homes closed
12,177 homes in backlog at 3/31/15
Consolidated pre-tax income increased 14% to $230.1 million
Consolidated pre-tax income margin was 9.6%
Net income increased 13% to $147.9 million
12
J.P. Morgan Homebuilding and Building Products Conference
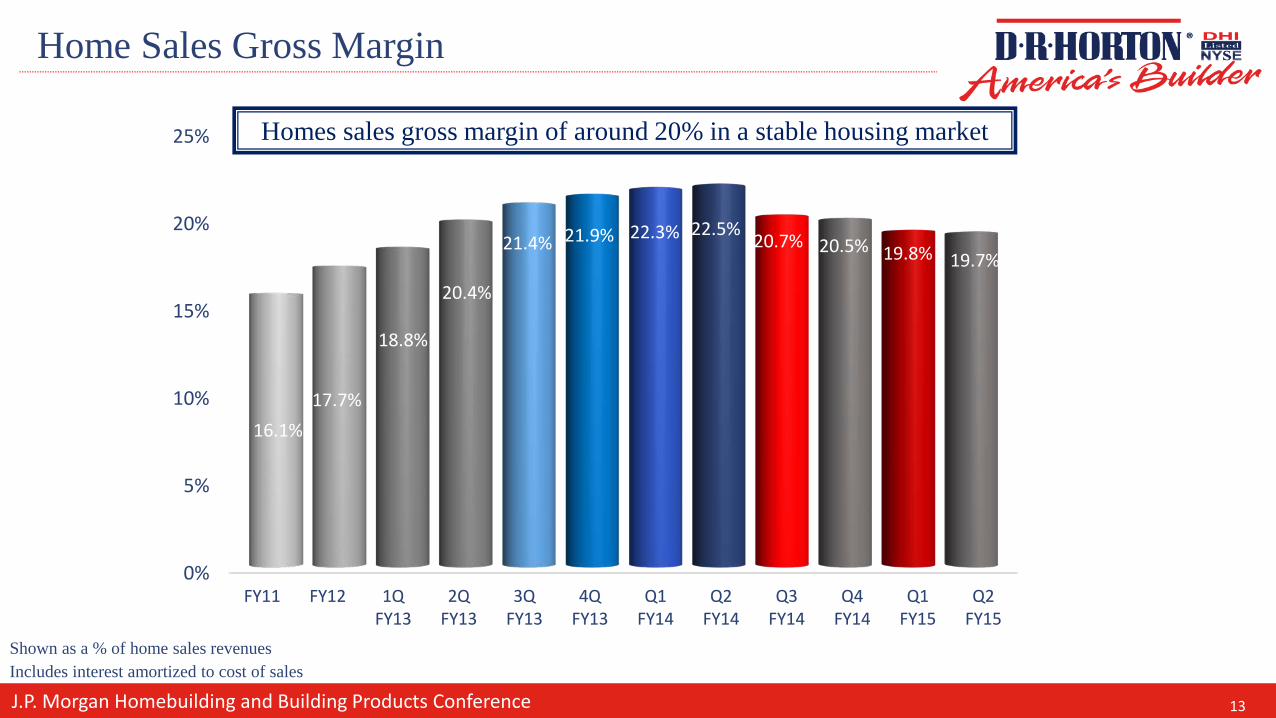
Home Sales Gross Margin
Shown as a % of home sales revenuesIncludes interest amortized to cost of sales
0%
5%
10%
15%
20%
25%
FY11 FY12 1QFY13
2QFY13
3QFY13
4QFY13
Q1FY14
Q2FY14
Q3FY14
Q4FY14
Q1FY15
Q2FY15
16.1%17.7%
18.8%
20.4%
21.4% 21.9% 22.3% 22.5% 20.7% 20.5% 19.8% 19.7%
Homes sales gross margin of around 20% in a stable housing market
13
J.P. Morgan Homebuilding and Building Products Conference
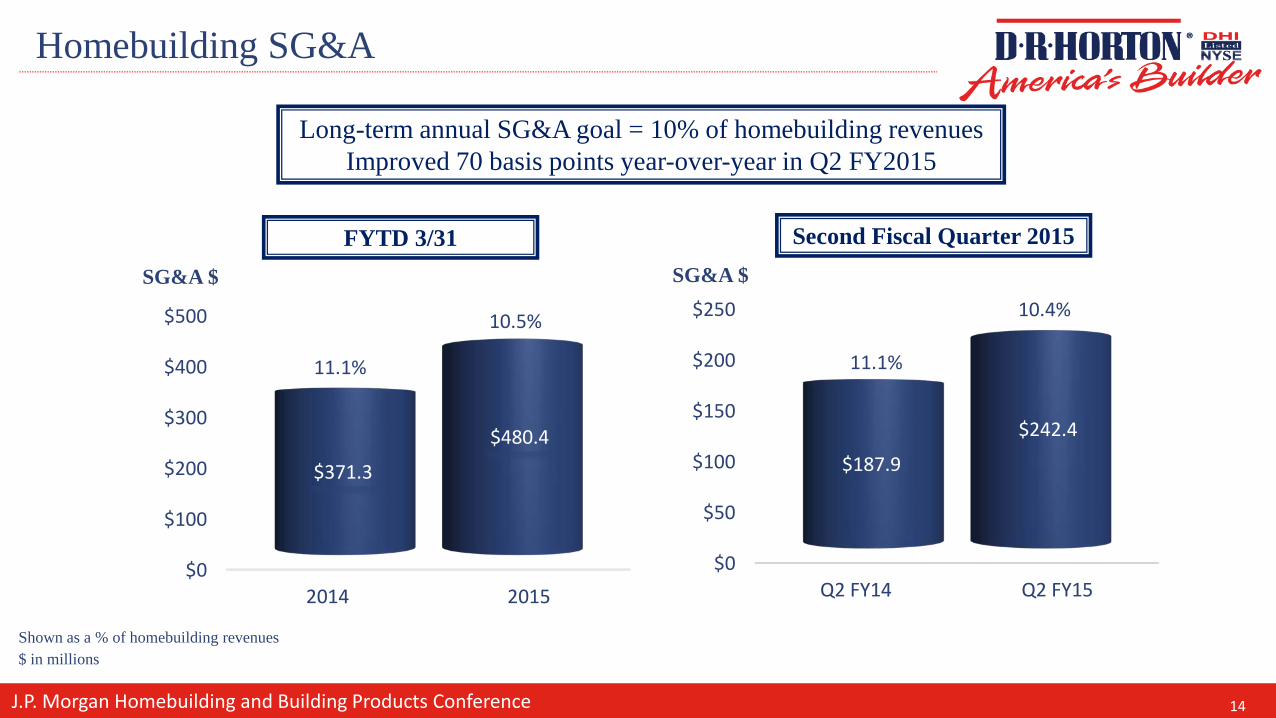
Homebuilding SG&A
Long-term annual SG&A goal = 10% of homebuilding revenuesImproved 70 basis points year-over-year in Q2 FY2015
FYTD 3/31 Second Fiscal Quarter 2015
$0
$100
$200
$300
$400
$500
2014 2015
$371.3
$480.4
11.1%
10.5%
$0
$50
$100
$150
$200
$250
Q2 FY14 Q2 FY15
$187.9
$242.4
10.4%SG&A $ SG&A $
11.1%
Shown as a % of homebuilding revenues$ in millions
14
J.P. Morgan Homebuilding and Building Products Conference
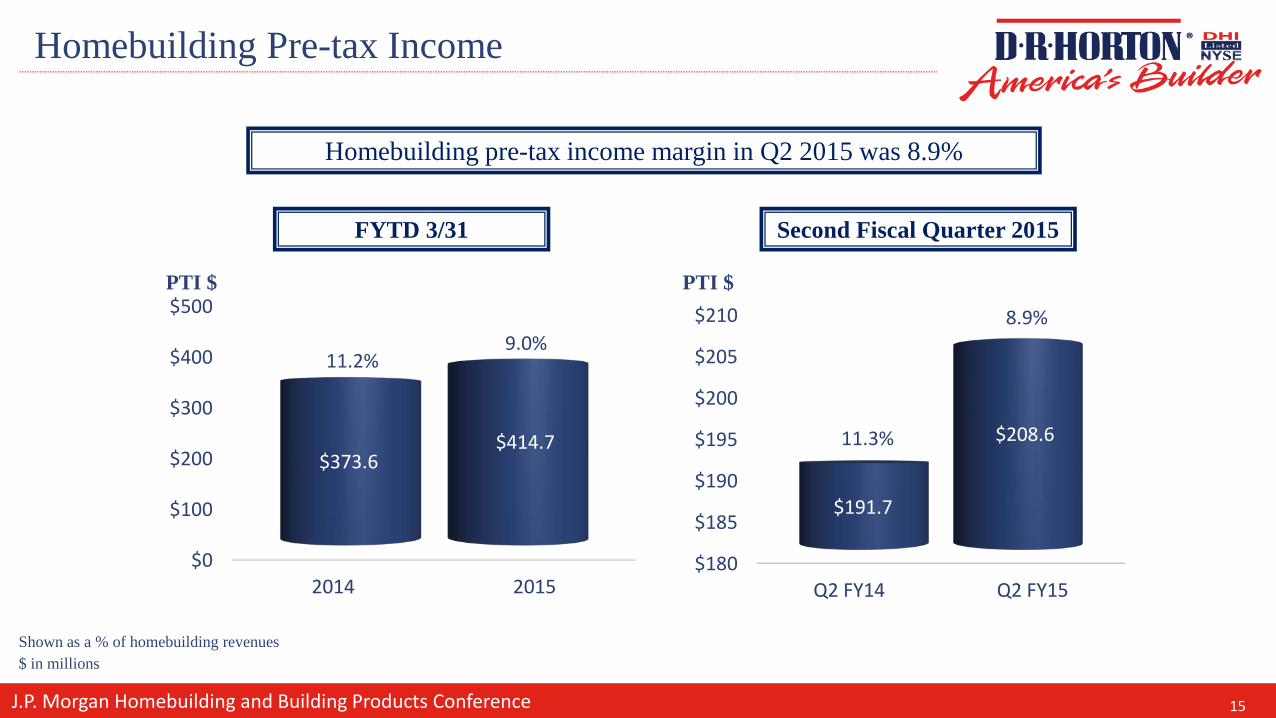
Homebuilding Pre-tax Income
Homebuilding pre-tax income margin in Q2 2015 was 8.9%
FYTD 3/31 Second Fiscal Quarter 2015
$0
$100
$200
$300
$400
$500
2014 2015
$373.6$414.7
11.2%9.0%
PTI $
$180
$185
$190
$195
$200
$205
$210
Q2 FY14 Q2 FY15
$191.7
$208.611.3%
8.9%
PTI $
Shown as a % of homebuilding revenues$ in millions
15
J.P. Morgan Homebuilding and Building Products Conference
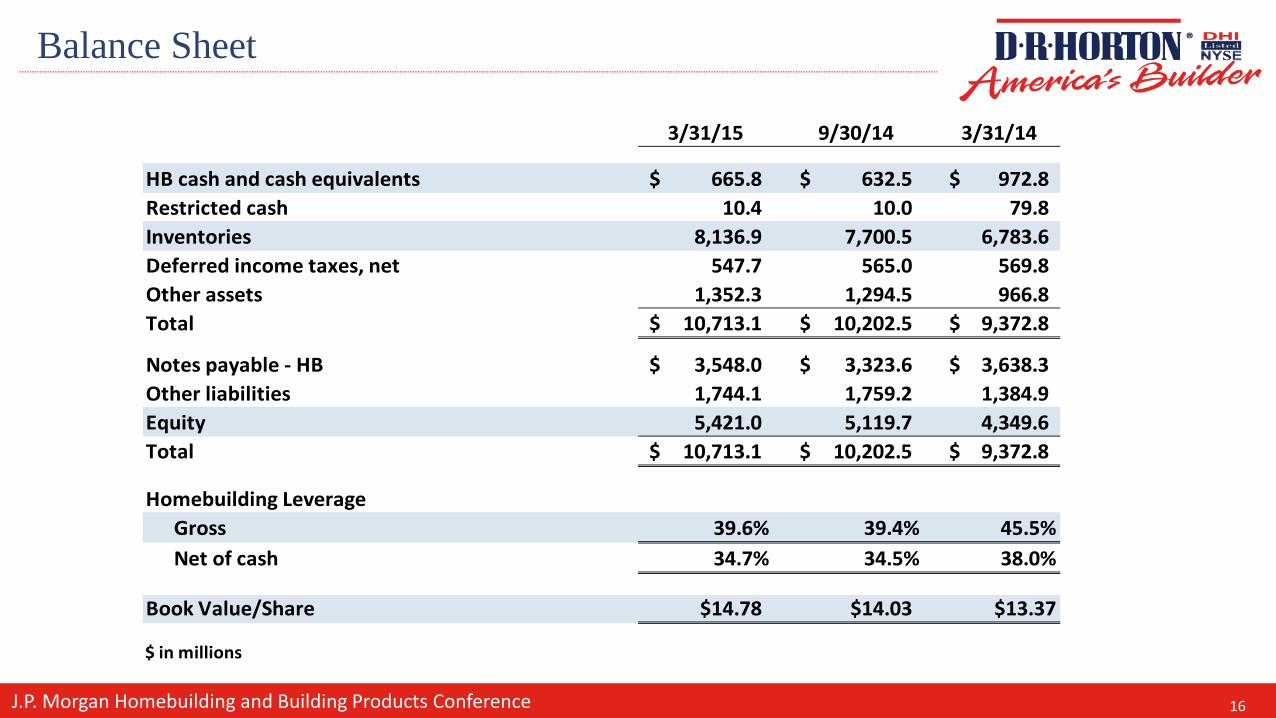
Balance Sheet
3/31/15 9/30/14 3/31/14
HB cash and cash equivalents 665.8$ 632.5$ 972.8$ Restricted cash 10.4 10.0 79.8 Inventories 8,136.9 7,700.5 6,783.6 Deferred income taxes, net 547.7 565.0 569.8 Other assets 1,352.3 1,294.5 966.8 Total 10,713.1$ 10,202.5$ 9,372.8$
Notes payable - HB 3,548.0$ 3,323.6$ 3,638.3$ Other liabilities 1,744.1 1,759.2 1,384.9 Equity 5,421.0 5,119.7 4,349.6 Total 10,713.1$ 10,202.5$ 9,372.8$
Homebuilding LeverageGross 39.6% 39.4% 45.5%Net of cash 34.7% 34.5% 38.0%
Book Value/Share $14.78 $14.03 $13.37
$ in millions
16
J.P. Morgan Homebuilding and Building Products Conference
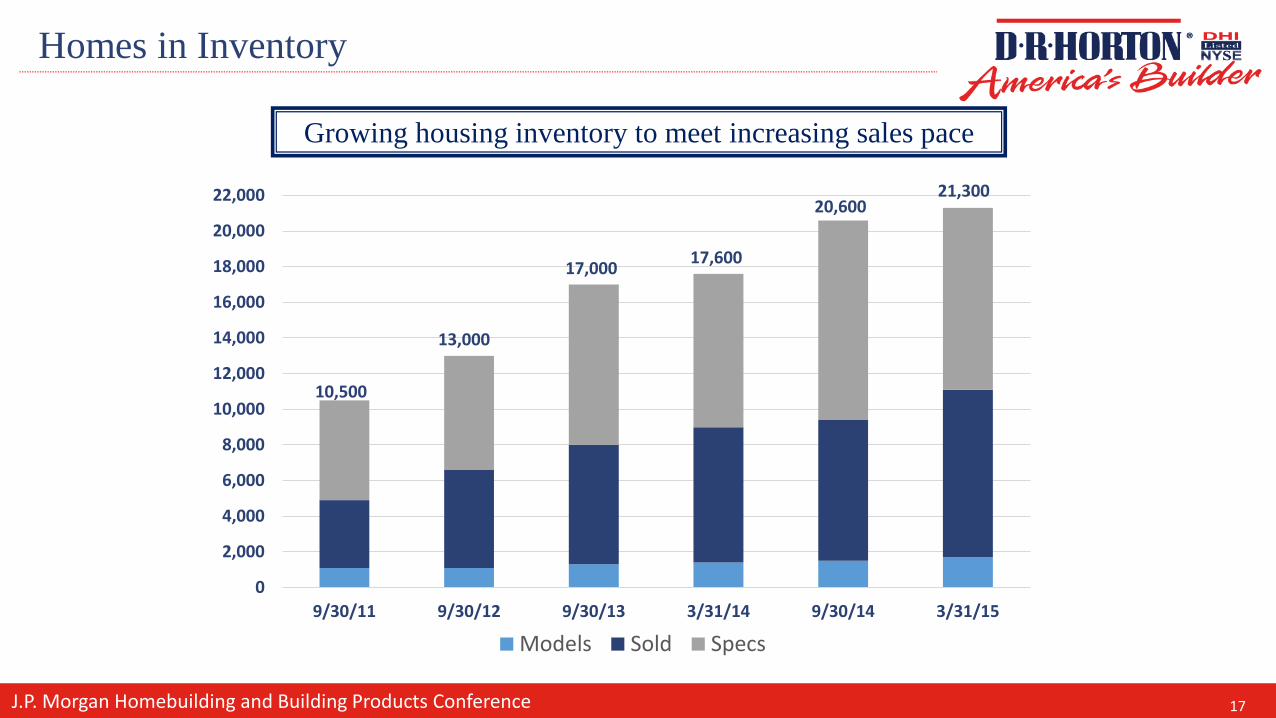
Homes in Inventory
Growing housing inventory to meet increasing sales pace
0
2,000
4,000
6,000
8,000
10,000
12,000
14,000
16,000
18,000
20,000
22,000
9/30/11 9/30/12 9/30/13 3/31/14 9/30/14 3/31/15
Models Sold Specs
10,500
13,000
17,000
20,60021,300
17,600
17
J.P. Morgan Homebuilding and Building Products Conference
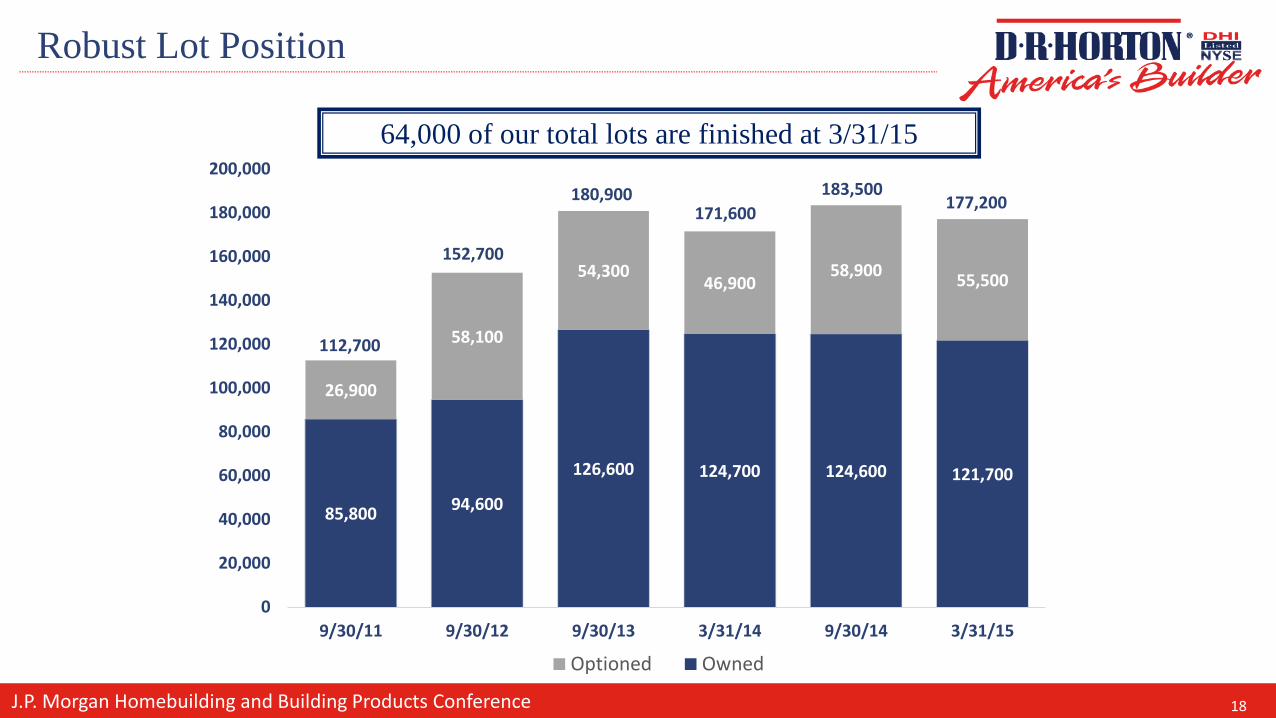
Robust Lot Position
64,000 of our total lots are finished at 3/31/15
85,800 94,600
126,600 124,700 124,600 121,700
26,900
58,100
54,30046,900
58,900 55,500
0
20,000
40,000
60,000
80,000
100,000
120,000
140,000
160,000
180,000
200,000
9/30/11 9/30/12 9/30/13 3/31/14 9/30/14 3/31/15
Optioned Owned
112,700
152,700
180,900 183,500171,600 177,200
18
J.P. Morgan Homebuilding and Building Products Conference
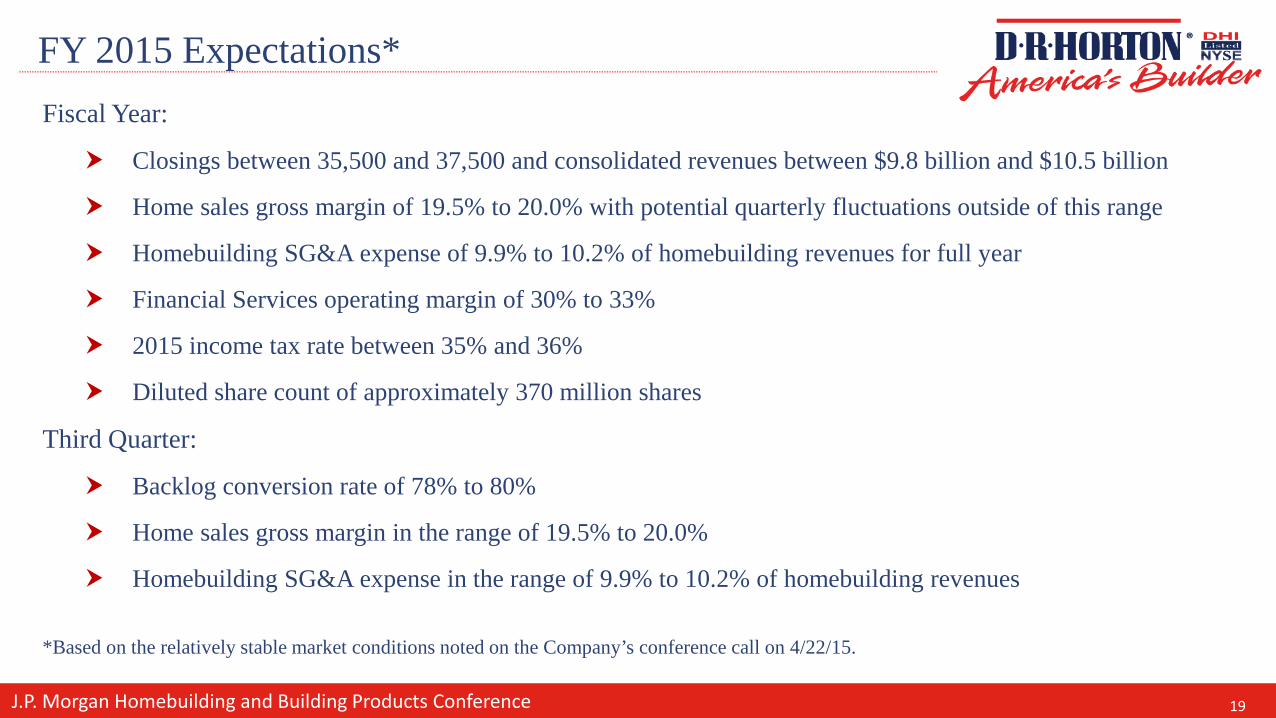
FY 2015 Expectations*Fiscal Year:
Closings between 35,500 and 37,500 and consolidated revenues between $9.8 billion and $10.5 billion
Home sales gross margin of 19.5% to 20.0% with potential quarterly fluctuations outside of this range
Homebuilding SG&A expense of 9.9% to 10.2% of homebuilding revenues for full year
Financial Services operating margin of 30% to 33%
2015 income tax rate between 35% and 36%
Diluted share count of approximately 370 million shares
Third Quarter:
Backlog conversion rate of 78% to 80%
Home sales gross margin in the range of 19.5% to 20.0%
Homebuilding SG&A expense in the range of 9.9% to 10.2% of homebuilding revenues
*Based on the relatively stable market conditions noted on the Company’s conference call on 4/22/15.
19