Embed Size (px)
Citation preview
8th annual new yorkvalue investing congress
•October 1, 2012 • new york, ny
Is it 1999 Again?Zack Buckley, Buckley Capital Partners
Join us for the 8th Annual Spring Value Investing Congress in Las Vegas! To register and benefit from a special discount go to www.ValueInvestingCongress.com/SAVE
www.ValueInvestingCongress.com

Disclaimer DISCLAIMER – IMPORTANT NOTICE
The information contained in this presentation “Is It 1999 Again” is highly confidential and is being provided for information purposes only to a limited number of financially sophisticated persons who have expressed an interest in the matters described herein.The Presentation does not constitute an offer to sell, or a solicitation of an offer to purchase, any securities. Any such offer or solicitation will be made in accordance with applicable securities laws.
The Presentation is being provided on a confidential basis solely to those persons to whom this Presentation may be lawfully provided. It is not to be reproduced or distributed to any other persons (other than professional advisors of the persons receiving these materials). It is intended solely for the use of the persons to whom it has been delivered and may not be used for any other purpose. Any reproduction of the Presentation in whole or in part, or the disclosure of its contents, without the express prior consent of Buckley Capital Management LLC is prohibited.
No representation or warranty (express or implied) is made or can be given with respect to the accuracy or completeness of the information in the Presentation. Certain information in the Presentation constitute “forward-looking statements” about potential future results. Those results may not be achieved, due to implementation lag, other timing factors, portfolio management decision-making, economic or market conditions or other unanticipated factors. Nothing contained herein shall be relied upon as a promise or representation whether as to past or future performance or otherwise.
The views, opinions, and assumptions expressed in this presentation are as of October 1st, 2012, are subject to change without notice, may not come to pass and do not represent a recommendation or offer of any particular security, strategy or investment.
The Presentation does not purport to contain all of the information that may be required to evaluate the matters discussed therein. It is not intended to be a risk disclosure document. Further, the Presentation is not intended to provide recommendations, and should not be relied upon for tax, accounting, legal or business advice. The persons to whom this document has been delivered are encouraged to ask questions of and receive answers from the [general partners] of the Company and to obtain any additional information they deem necessary concerning the matters described herein.
None of the information contained herein has been filed or will be filed with the Securities and Exchange Commission, any regulator under any state securities laws or any other governmental or self-regulatory authority. No governmental authority has passed or will pass on the merits of this offering or the adequacy of this document. Any representation to the contrary is unlawful.
2
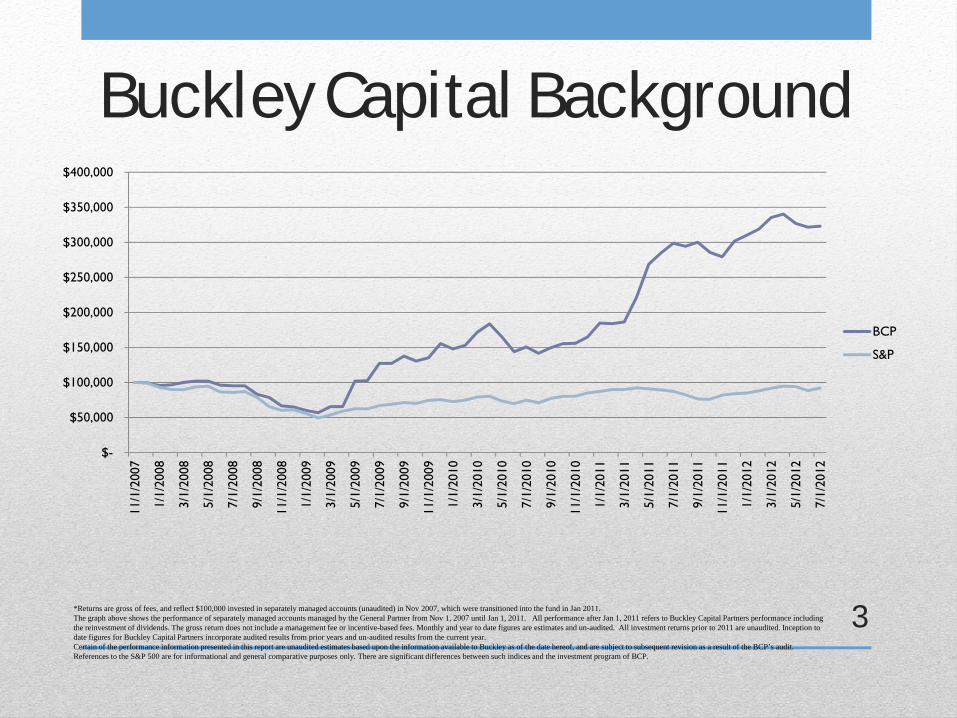
Buckley Capital Background
$-
$50,000
$100,000
$150,000
$200,000
$250,000
$300,000
$350,000
$400,000
11/1
/200
7
1/1/
2008
3/1/
2008
5/1/
2008
7/1/
2008
9/1/
2008
11/1
/200
8
1/1/
2009
3/1/
2009
5/1/
2009
7/1/
2009
9/1/
2009
11/1
/200
9
1/1/
2010
3/1/
2010
5/1/
2010
7/1/
2010
9/1/
2010
11/1
/201
0
1/1/
2011
3/1/
2011
5/1/
2011
7/1/
2011
9/1/
2011
11/1
/201
1
1/1/
2012
3/1/
2012
5/1/
2012
7/1/
2012
BCP
S&P
3*Returns are gross of fees, and reflect $100,000 invested in separately managed accounts (unaudited) in Nov 2007, which were transitioned into the fund in Jan 2011. The graph above shows the performance of separately managed accounts managed by the General Partner from Nov 1, 2007 until Jan 1, 2011. All performance after Jan 1, 2011 refers to Buckley Capital Partners performance including the reinvestment of dividends. The gross return does not include a management fee or incentive-based fees. Monthly and year to date figures are estimates and un-audited. All investment returns prior to 2011 are unaudited. Inception to date figures for Buckley Capital Partners incorporate audited results from prior years and un-audited results from the current year. Certain of the performance information presented in this report are unaudited estimates based upon the information available to Buckley as of the date hereof, and are subject to subsequent revision as a result of the BCP’s audit. References to the S&P 500 are for informational and general comparative purposes only. There are significant differences between such indices and the investment program of BCP.
Background as a Short Seller• I became a short seller in an embarrassing way, being long China
frauds• Visited 50 Chinese companies• When I went to china I was long, when I came back, I was short• Here’s why:
4
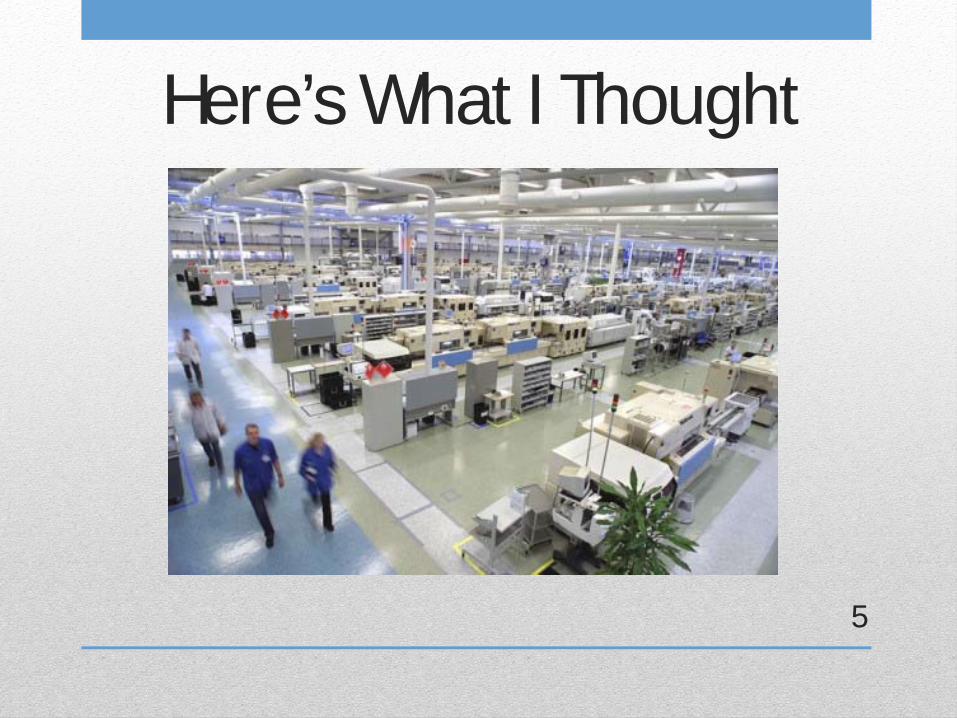
Here’s What I Thought
5
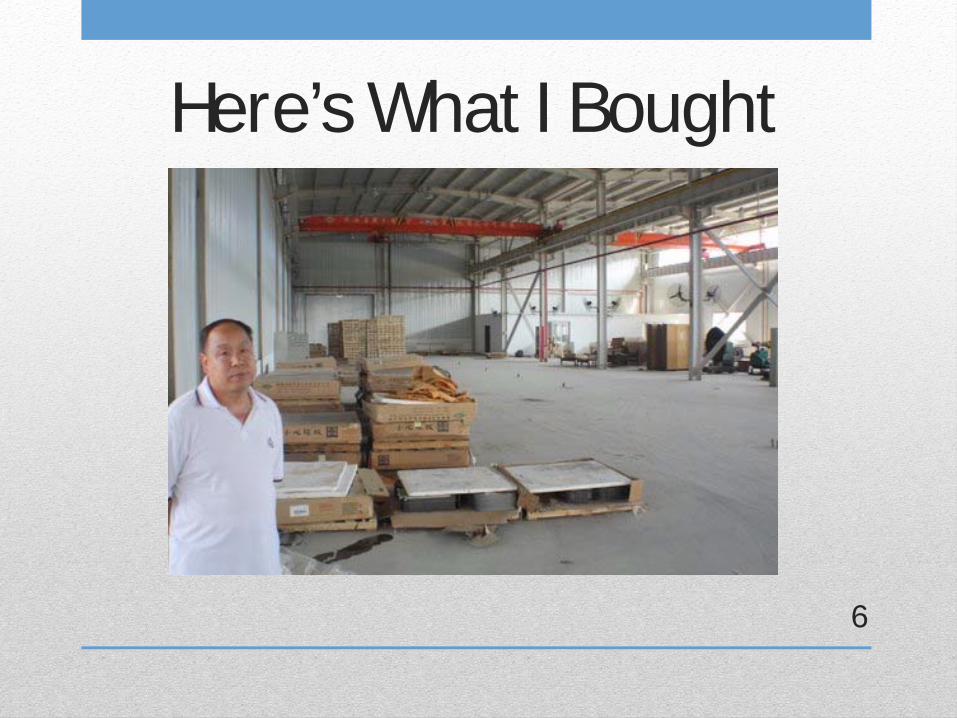
Here’s What I Bought
6

Here’s What I Thought
7

Here’s What I Bought
8
China Trade Is Over• Shorting China frauds has generally played out• Started looking for short opportunities elsewhere• Found 1999-like valuations among tech companies with
bad business models
9
Characteristics of a Good Company• Strong business model• Strong moat• Little to no competition• No obsolescence risk• High operating margins
Now let’s invert this
10
Characteristics of a Bad Company
• Questionable business model• Little moat• Fierce competition• Technology risk• One-product company• Low operating margins• High valuation
I think Splunk (SPLK) meets these criteria
11

Splunk’s Business
Source: 424B4 filed 2012-7-20
12
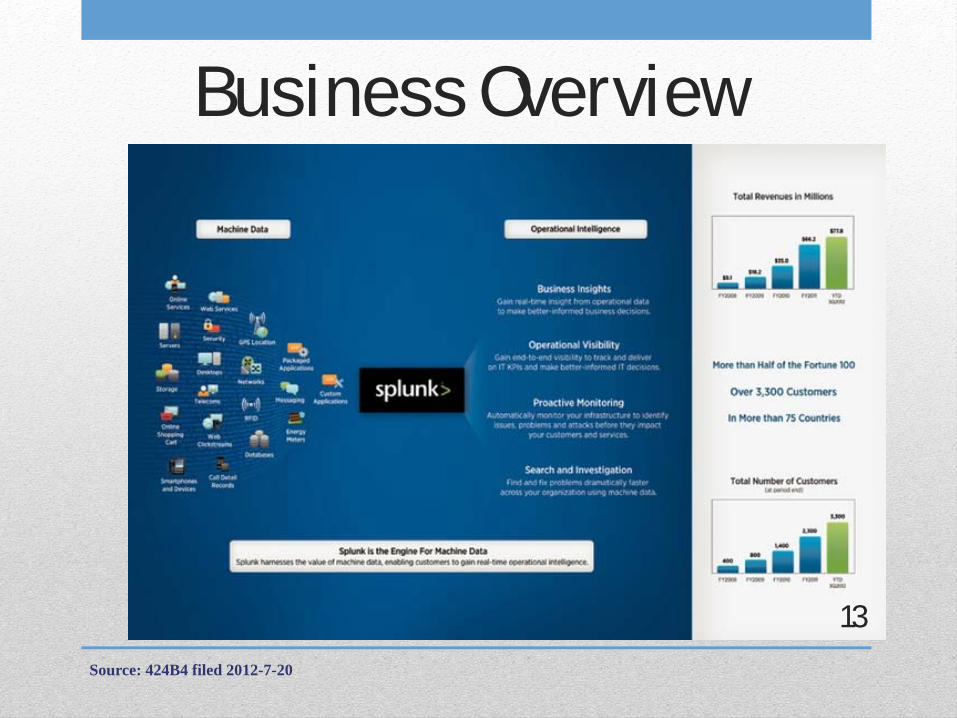
Business Overview
Source: 424B4 filed 2012-7-20
13
Splunk’s Revenue Model
• One-time fee for perpetual use of the software with a maintenance contract
• Annual term fee to license the software• Pricing based on indexed capacity
Source: 424B4 filed 2012-7-20
14
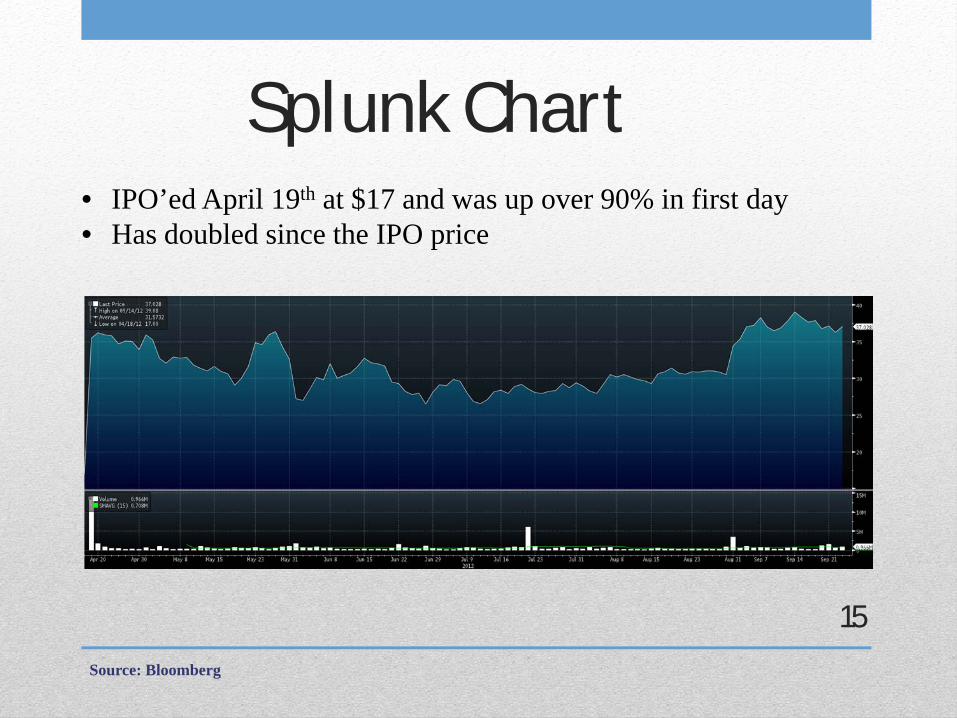
Splunk Chart
Source: Bloomberg
15
• IPO’ed April 19th at $17 and was up over 90% in first day• Has doubled since the IPO price
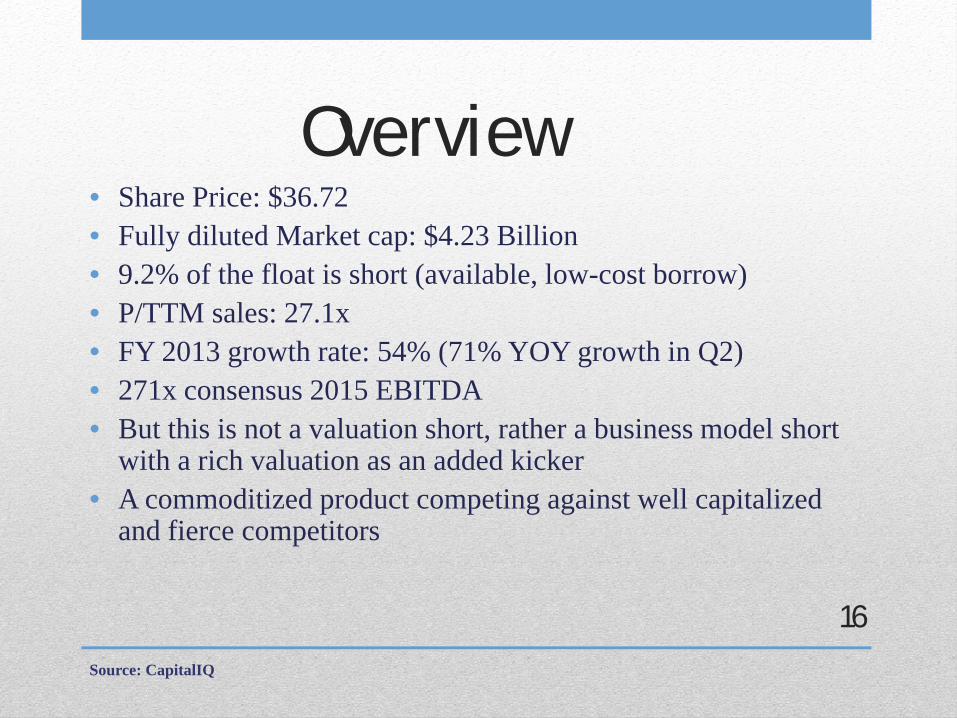
Overview• Share Price: $36.72• Fully diluted Market cap: $4.23 Billion• 9.2% of the float is short (available, low-cost borrow)• P/TTM sales: 27.1x• FY 2013 growth rate: 54% (71% YOY growth in Q2)• 271x consensus 2015 EBITDA • But this is not a valuation short, rather a business model short
with a rich valuation as an added kicker• A commoditized product competing against well capitalized
and fierce competitors
Source: CapitalIQ
16
Questionable Moat• Switching costs are very low for customers• Splunk boasts that customers can have their software up
and running within a few hours - but this means that competitors can do the same
• Very little patent protection
Source: 424B4 filed 2012-7-20
17
Splunk Is Not a Typical Software-As-A-Service (SaaS) Business
• Typical SaaS businesses have annuity-like recurring revenue
• From Splunk’s 10-Q:• “A substantial majority of our license revenue consists of
revenues from perpetual licenses, under which we generally recognize the license fee portion of the arrangement upfront”
Source: 10-Q filed 9-13-2012
18
SaaS Issues• Risk section of 10-Q:
• “If customers were to require that we provide our product via a SaaS deployment, we would need to direct a significant portion of our capital investments to implement this alternative business model, which would negatively affect our gross margins. Even if we make these investments, we may be unsuccessful in implementing a SaaS business model. Moreover, sales of a potential future SaaS offering could cannibalize sales of our SplunkEnterprise software licenses. In addition, the change to a SaaS model would result in changes in the manner in which we recognize revenues.”
Source: 10-Q filed 9-13-2012
19
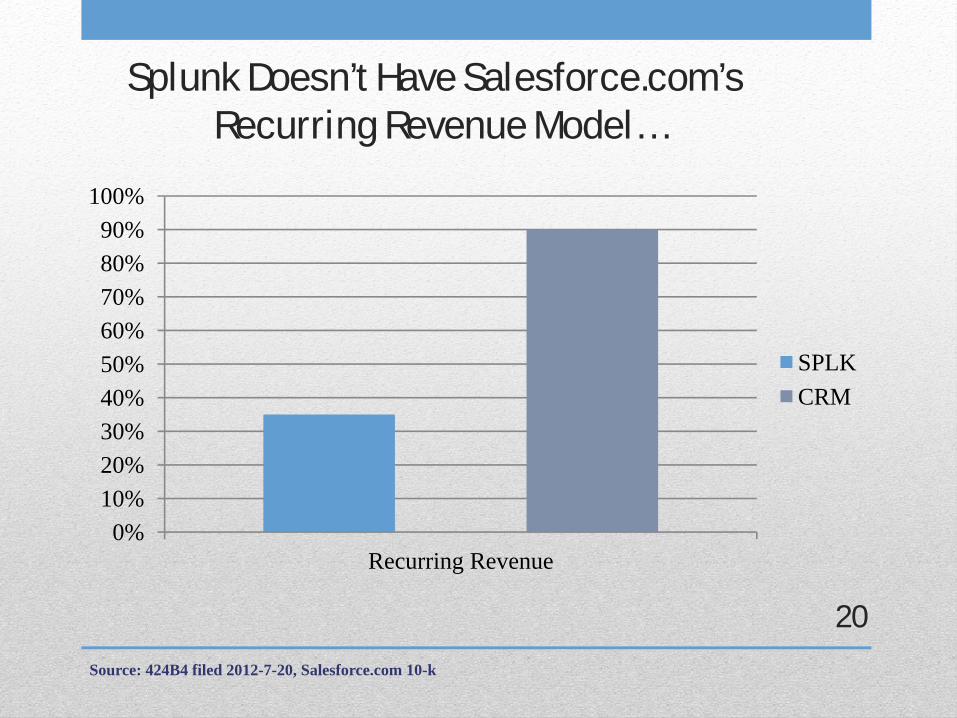
Splunk Doesn’t Have Salesforce.com’sRecurring Revenue Model…
0%10%20%30%40%50%60%70%80%90%
100%
Recurring Revenue
SPLKCRM
Source: 424B4 filed 2012-7-20, Salesforce.com 10-k
20
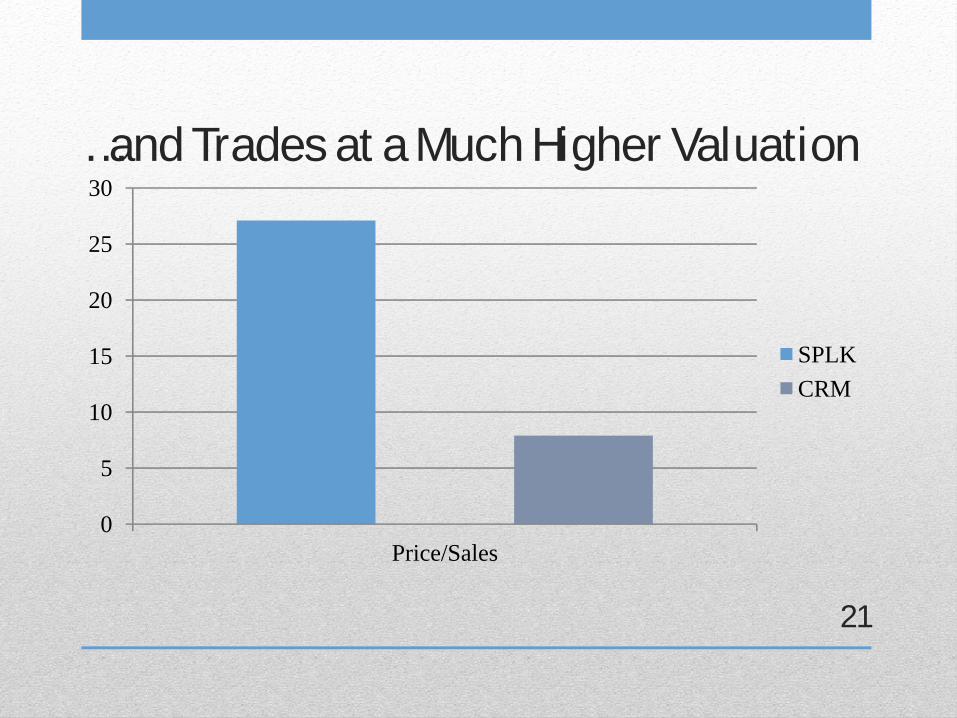
…and Trades at a Much Higher Valuation
0
5
10
15
20
25
30
Price/Sales
SPLKCRM
21
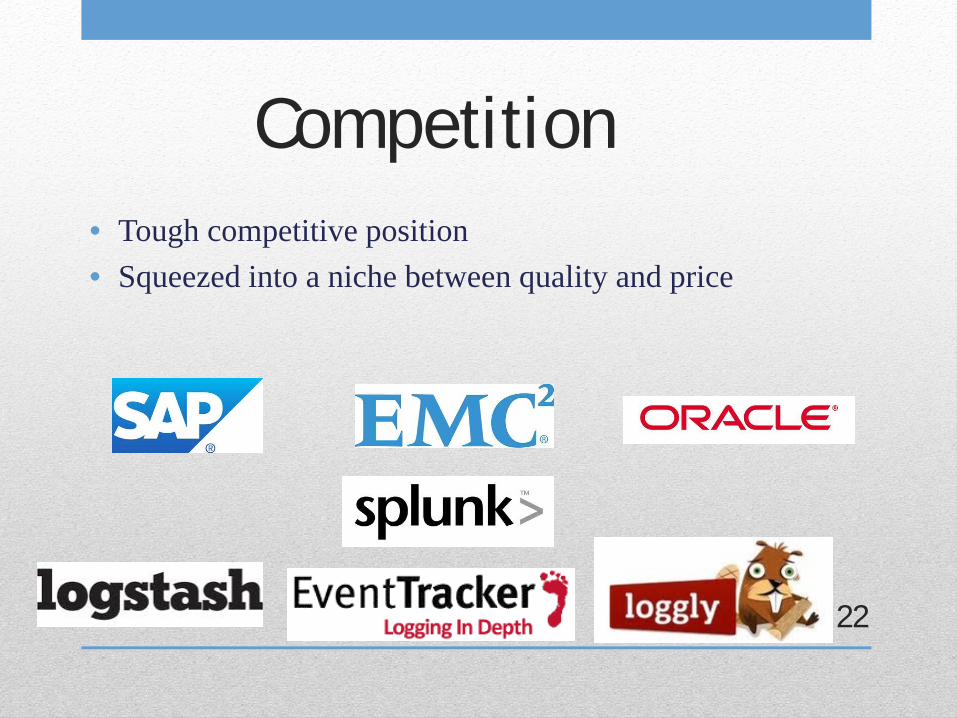
Competition• Tough competitive position • Squeezed into a niche between quality and price
22
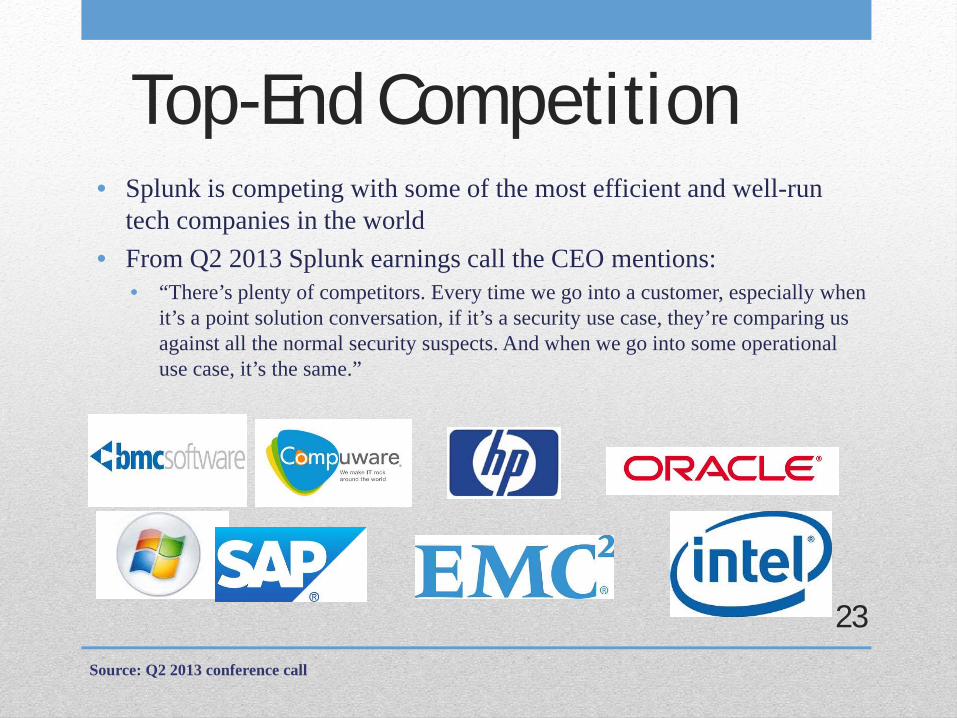
Top-End Competition• Splunk is competing with some of the most efficient and well-run
tech companies in the world• From Q2 2013 Splunk earnings call the CEO mentions:
• “There’s plenty of competitors. Every time we go into a customer, especially when it’s a point solution conversation, if it’s a security use case, they’re comparing us against all the normal security suspects. And when we go into some operational use case, it’s the same.”
Source: Q2 2013 conference call
23
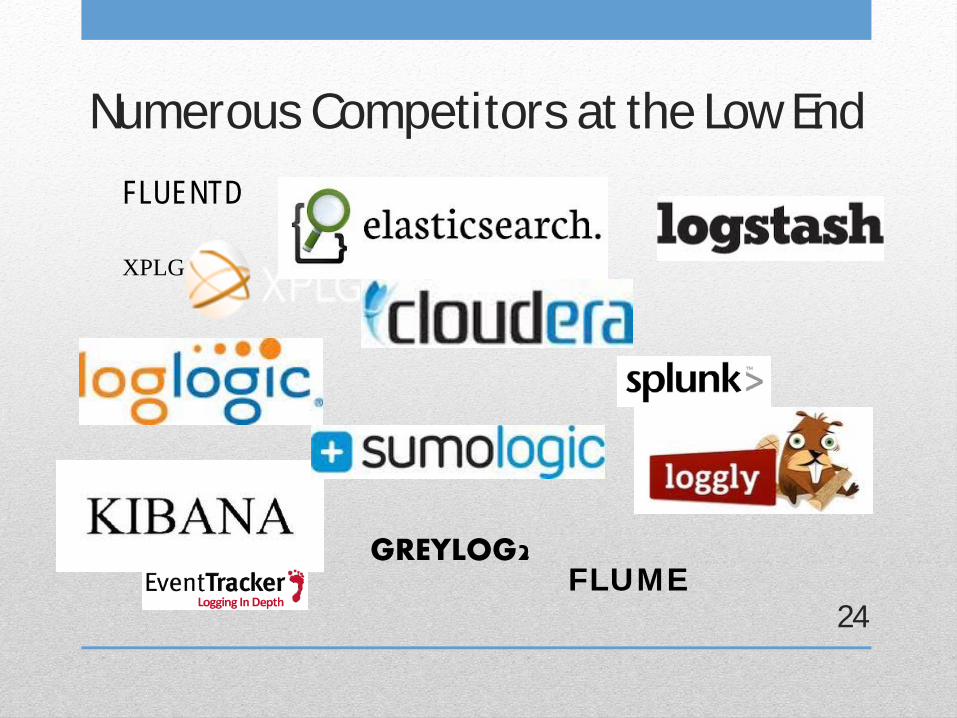
Numerous Competitors at the Low End
24
XPLG
GREYLOG2FLUME
FLUENTD
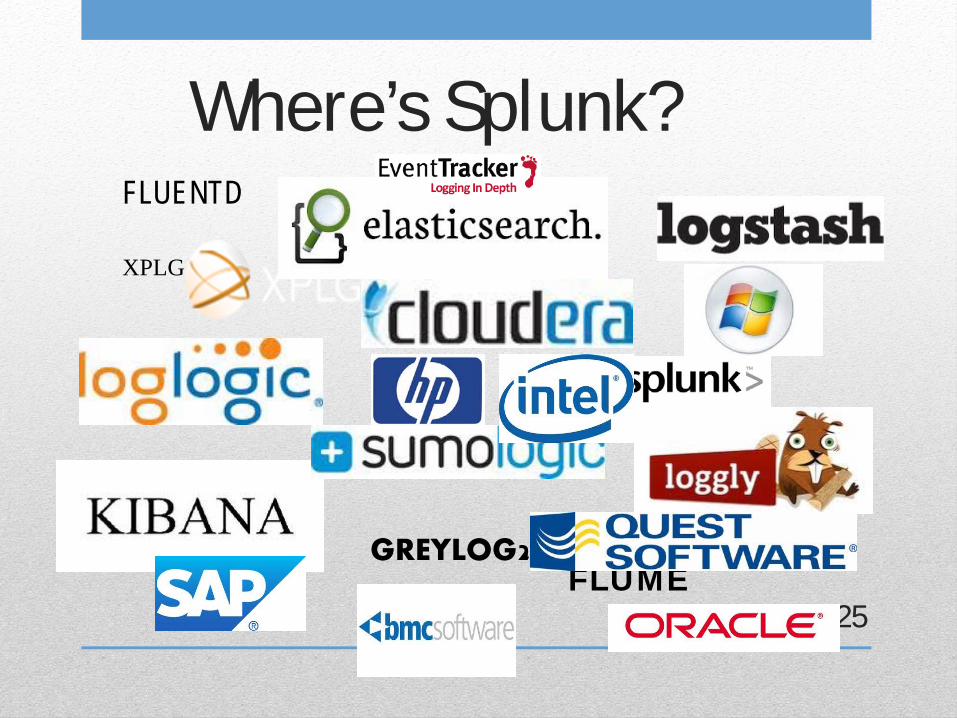
Where’s Splunk?
25
XPLG
GREYLOG2FLUME
FLUENTD
Splunk’s Niche is Being Squeezed• Splunk is losing on the point solutions side, because they are
going head to head with IBM, BMC, MSFT • Splunk’s CEO on the most recent conference call:
• “If we just get dragged into a very narrow point solutions conversation, the other guys know how to sell, too.”
• Integrated solutions is left, where they will have difficulty competing on price
• So if you combine a commoditized product, with heavy competition both on quality from one side and price on another, you have a very tough sale
• Why Use Splunk?
Source: Q2 2013 Conference call
26
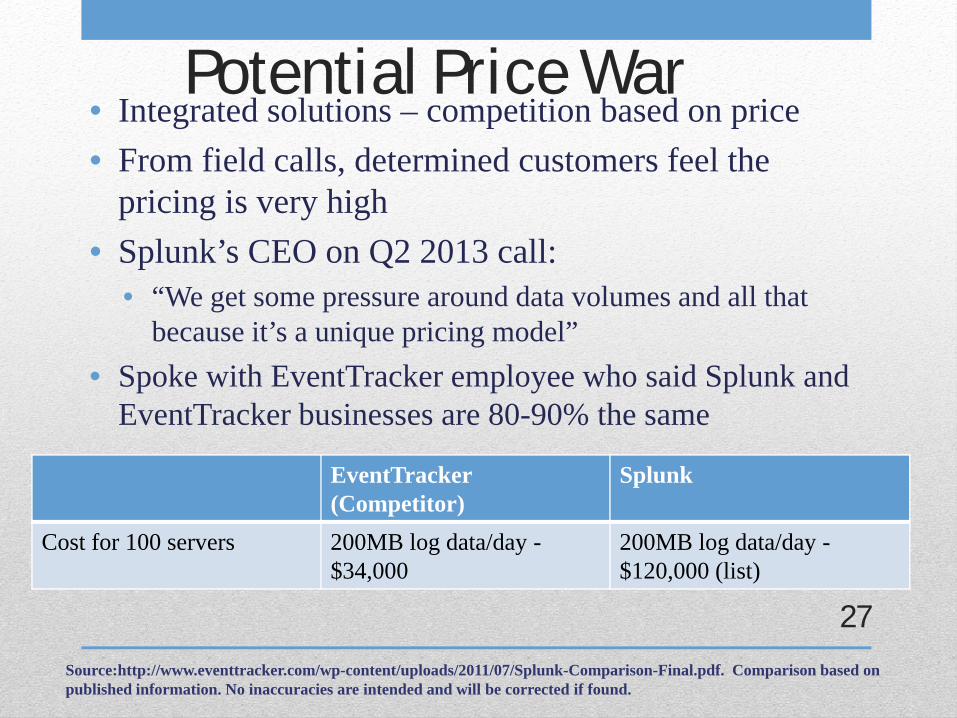
Potential Price War• Integrated solutions – competition based on price• From field calls, determined customers feel the
pricing is very high• Splunk’s CEO on Q2 2013 call:
• “We get some pressure around data volumes and all that because it’s a unique pricing model”
• Spoke with EventTracker employee who said Splunk and EventTracker businesses are 80-90% the same
Source:http://www.eventtracker.com/wp-content/uploads/2011/07/Splunk-Comparison-Final.pdf. Comparison based on published information. No inaccuracies are intended and will be corrected if found.
27
EventTracker(Competitor)
Splunk
Cost for 100 servers 200MB log data/day -$34,000
200MB log data/day -$120,000 (list)
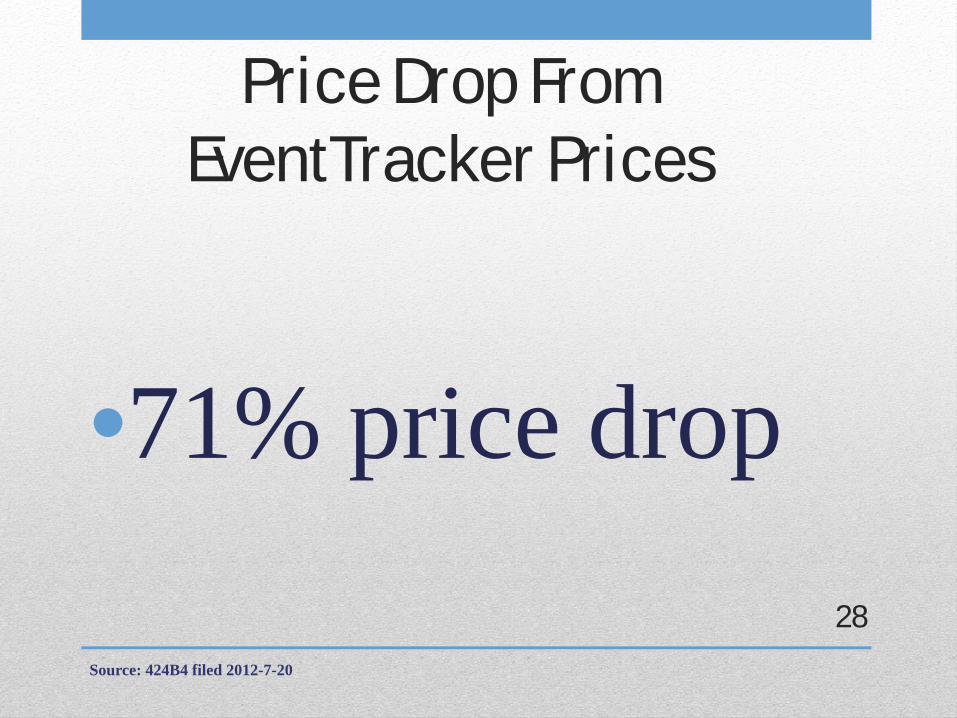
Price Drop From EventTracker Prices
•71% price drop
Source: 424B4 filed 2012-7-20
28
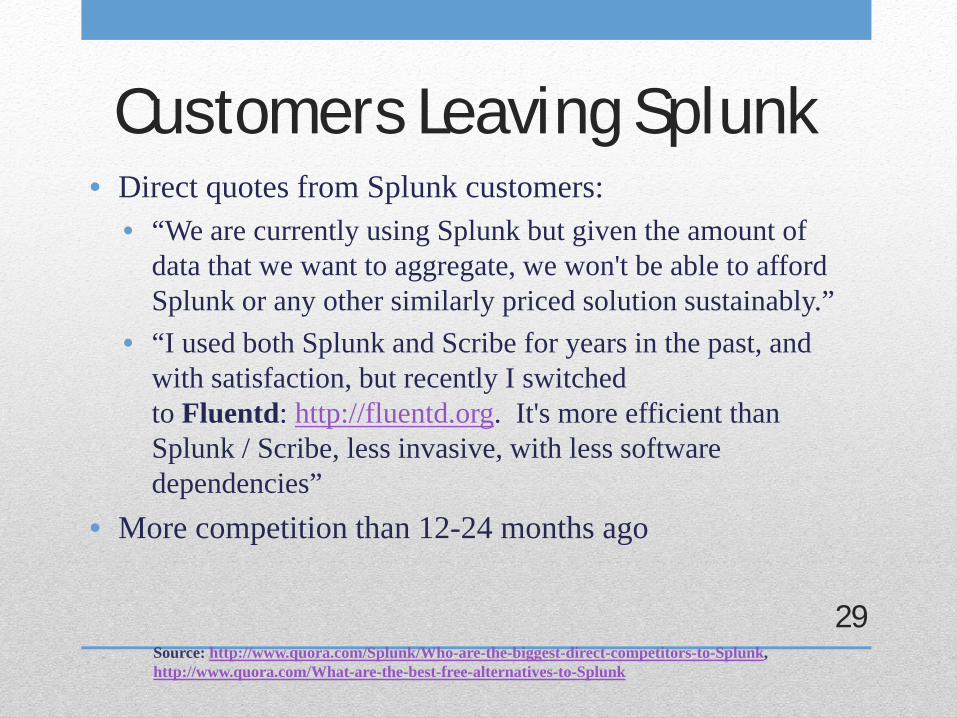
Customers Leaving Splunk• Direct quotes from Splunk customers:
• “We are currently using Splunk but given the amount of data that we want to aggregate, we won't be able to afford Splunk or any other similarly priced solution sustainably.”
• “I used both Splunk and Scribe for years in the past, and with satisfaction, but recently I switched to Fluentd: http://fluentd.org. It's more efficient than Splunk / Scribe, less invasive, with less software dependencies”
• More competition than 12-24 months ago
Source: http://www.quora.com/Splunk/Who-are-the-biggest-direct-competitors-to-Splunk, http://www.quora.com/What-are-the-best-free-alternatives-to-Splunk
29
Technology Risk – One-Product Company
• Technology risk is especially big because Splunk is a one-product company
• Highly competitive industry that is very difficult to model given the level of competition
• Analysts are giving Splunk the benefit of the doubt that it will be able to compete technologically with all the bigger software players
30

Smaller Target Market• Splunk’s target market is much smaller than they admit• In their main segment, IT operations, their top 5 competitors hold
53.5% of the market• Less than 10% in “business intelligence”
Source: S-1 filed 1-12-2012, www.IDC.com
31
IT Market ShareIBM 17.8%CA 12.3%BMC Software 10.0%Microsoft 6.9%HP 6.5%Total 53.5%
Market Size ($billions)IT Operations $18.6Business Intelligence
$12.5
Security $1.3Total $32.5 $19.9
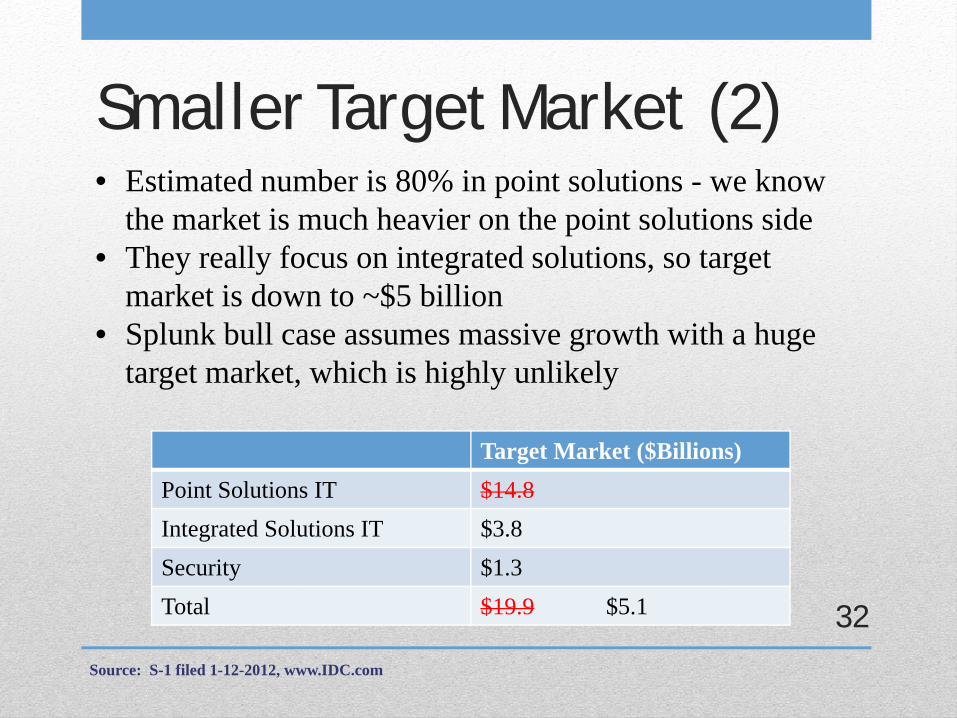
Smaller Target Market (2)
Source: S-1 filed 1-12-2012, www.IDC.com
32
• Estimated number is 80% in point solutions - we know the market is much heavier on the point solutions side
• They really focus on integrated solutions, so target market is down to ~$5 billion
• Splunk bull case assumes massive growth with a huge target market, which is highly unlikely
Target Market ($Billions)Point Solutions IT $14.8Integrated Solutions IT $3.8Security $1.3Total $19.9 $5.1
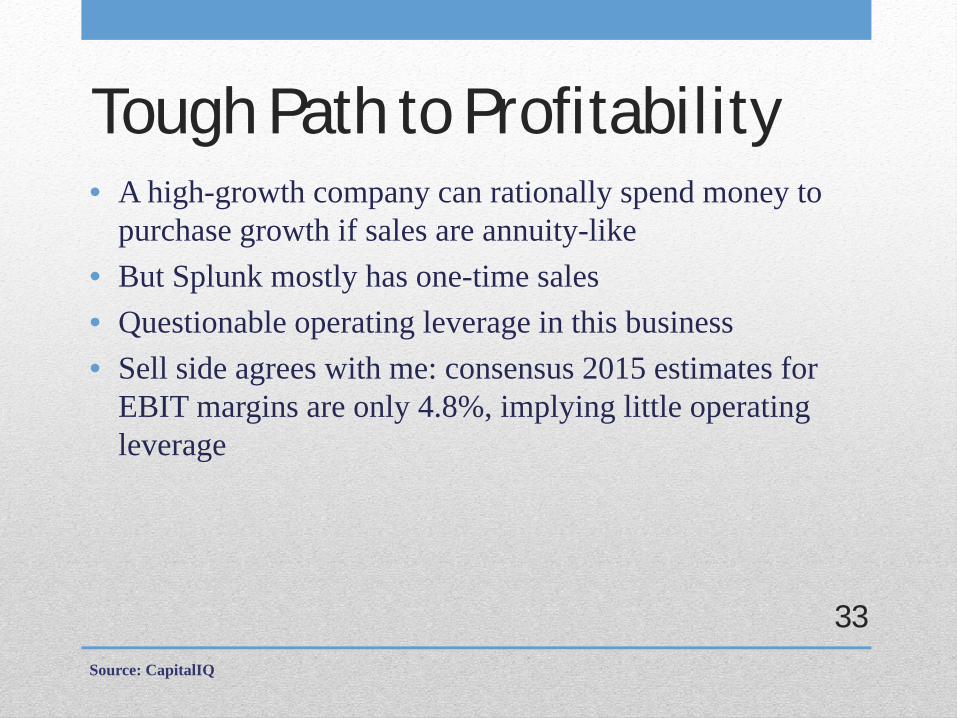
Tough Path to Profitability• A high-growth company can rationally spend money to
purchase growth if sales are annuity-like• But Splunk mostly has one-time sales• Questionable operating leverage in this business• Sell side agrees with me: consensus 2015 estimates for
EBIT margins are only 4.8%, implying little operating leverage
Source: CapitalIQ
33
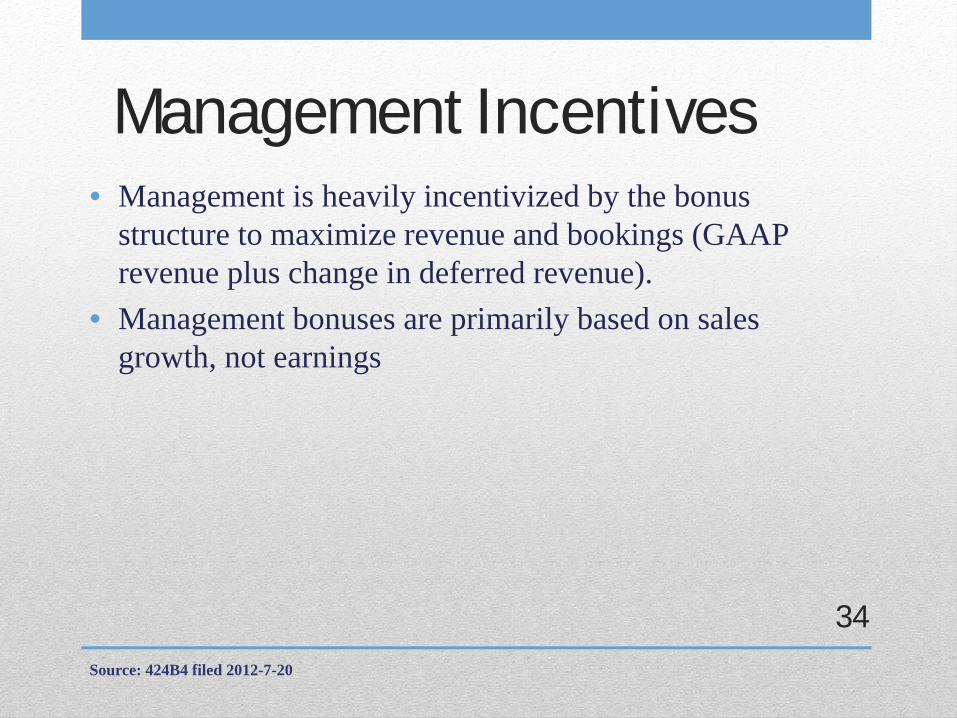
Management Incentives• Management is heavily incentivized by the bonus
structure to maximize revenue and bookings (GAAP revenue plus change in deferred revenue).
• Management bonuses are primarily based on sales growth, not earnings
Source: 424B4 filed 2012-7-20
34
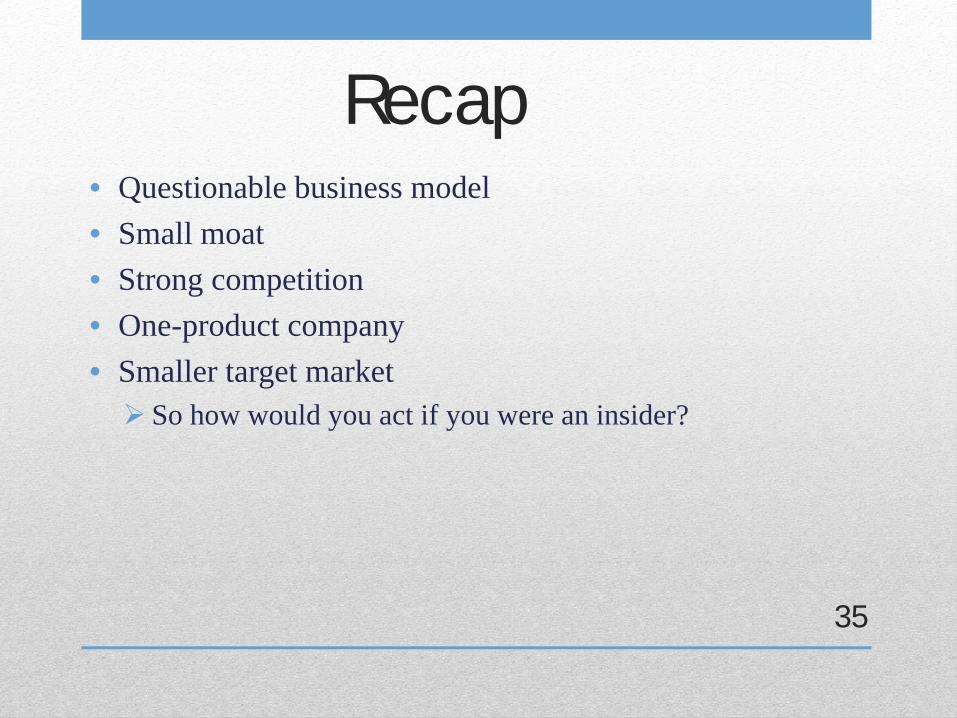
Recap• Questionable business model• Small moat• Strong competition• One-product company• Smaller target market
So how would you act if you were an insider?
35
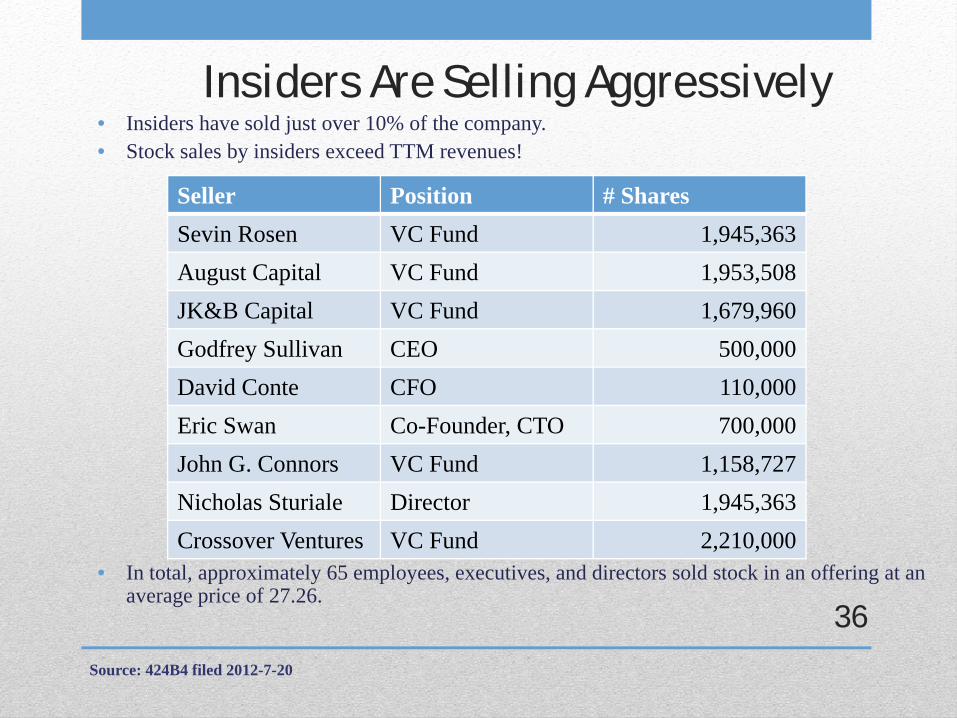
Insiders Are Selling Aggressively• Insiders have sold just over 10% of the company. • Stock sales by insiders exceed TTM revenues!
• In total, approximately 65 employees, executives, and directors sold stock in an offering at an average price of 27.26.
Source: 424B4 filed 2012-7-20
36
Seller Position # SharesSevin Rosen VC Fund 1,945,363August Capital VC Fund 1,953,508JK&B Capital VC Fund 1,679,960Godfrey Sullivan CEO 500,000David Conte CFO 110,000Eric Swan Co-Founder, CTO 700,000John G. Connors VC Fund 1,158,727Nicholas Sturiale Director 1,945,363Crossover Ventures VC Fund 2,210,000
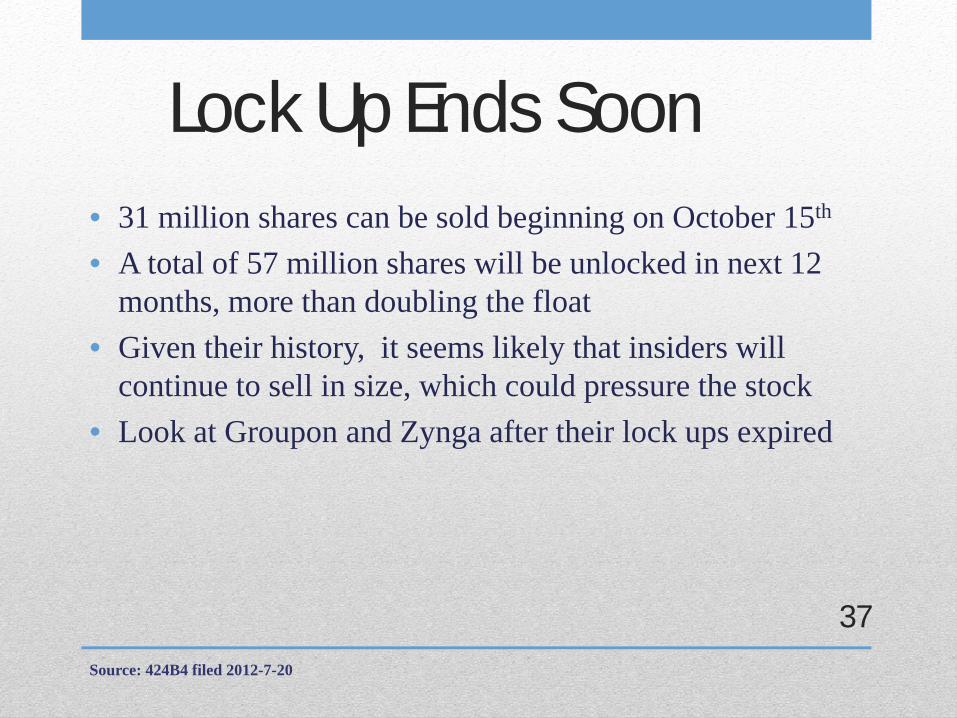
Lock Up Ends Soon• 31 million shares can be sold beginning on October 15th
• A total of 57 million shares will be unlocked in next 12 months, more than doubling the float
• Given their history, it seems likely that insiders will continue to sell in size, which could pressure the stock
• Look at Groupon and Zynga after their lock ups expired
Source: 424B4 filed 2012-7-20
37
Catalyst
Source: 424B4 filed 2012-7-20
38

Valuation• So what would you pay for this
business?• Would you pay 20x? 40x? 60x? 80x?• Splunk currently trades at 27x TTM
sales
39
A Strategic Acquisition at Anywhere Close to Today’s Price is Unlikely
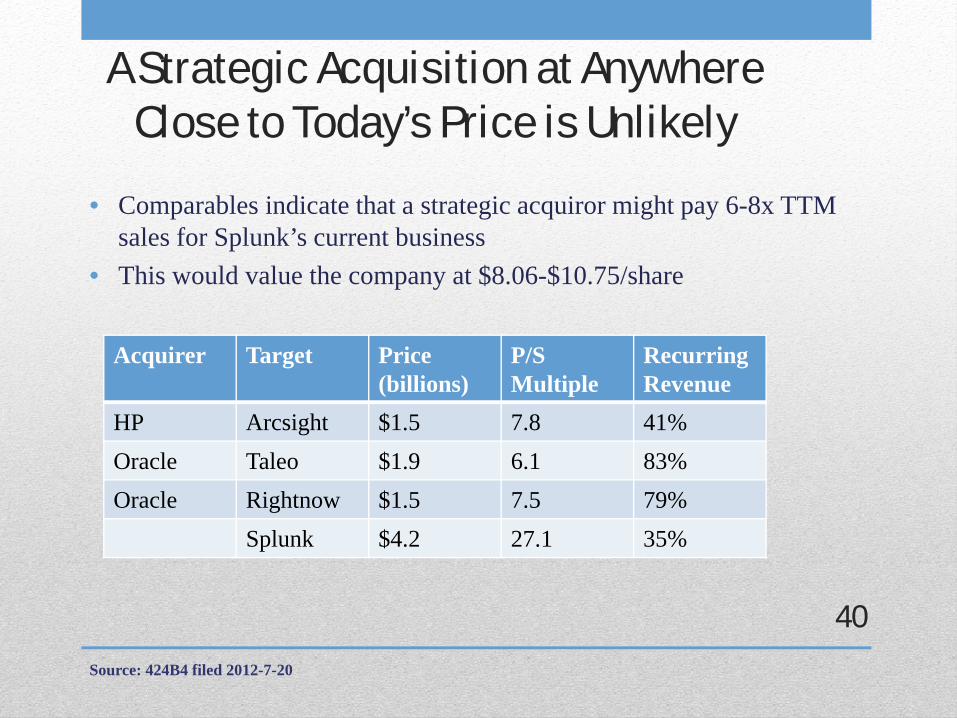
• Comparables indicate that a strategic acquiror might pay 6-8x TTM sales for Splunk’s current business
• This would value the company at $8.06-$10.75/share
Source: 424B4 filed 2012-7-20
40
Acquirer Target Price (billions)
P/SMultiple
Recurring Revenue
HP Arcsight $1.5 7.8 41%Oracle Taleo $1.9 6.1 83%Oracle Rightnow $1.5 7.5 79%
Splunk $4.2 27.1 35%
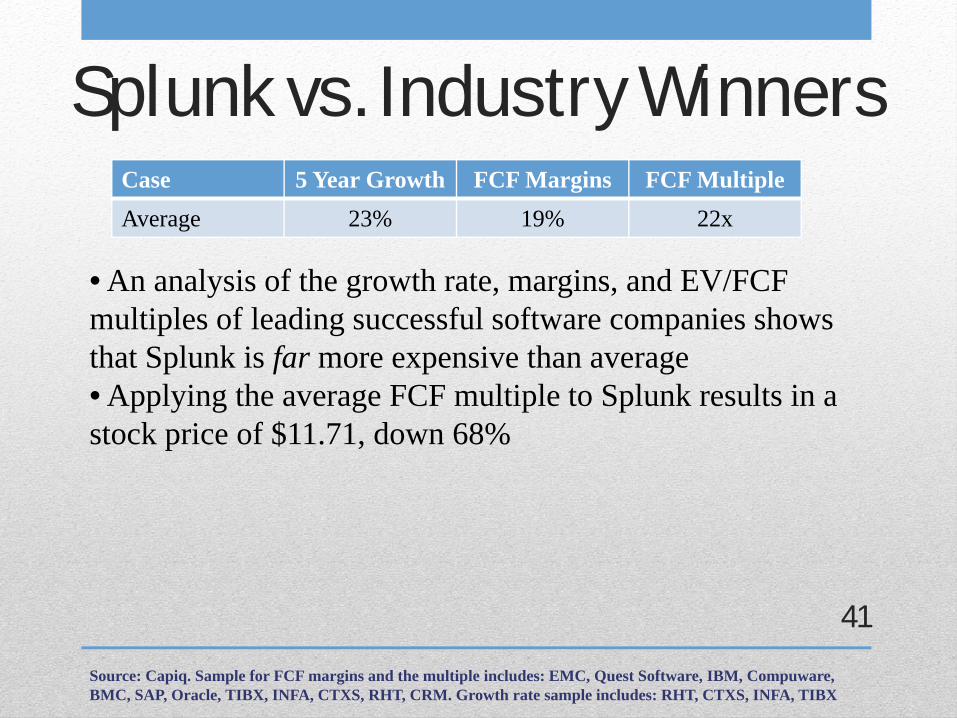
Splunk vs. Industry WinnersCase 5 Year Growth FCF Margins FCF MultipleAverage 23% 19% 22x
Source: Capiq. Sample for FCF margins and the multiple includes: EMC, Quest Software, IBM, Compuware, BMC, SAP, Oracle, TIBX, INFA, CTXS, RHT, CRM. Growth rate sample includes: RHT, CTXS, INFA, TIBX
41
• An analysis of the growth rate, margins, and EV/FCF multiples of leading successful software companies shows that Splunk is far more expensive than average• Applying the average FCF multiple to Splunk results in a stock price of $11.71, down 68%
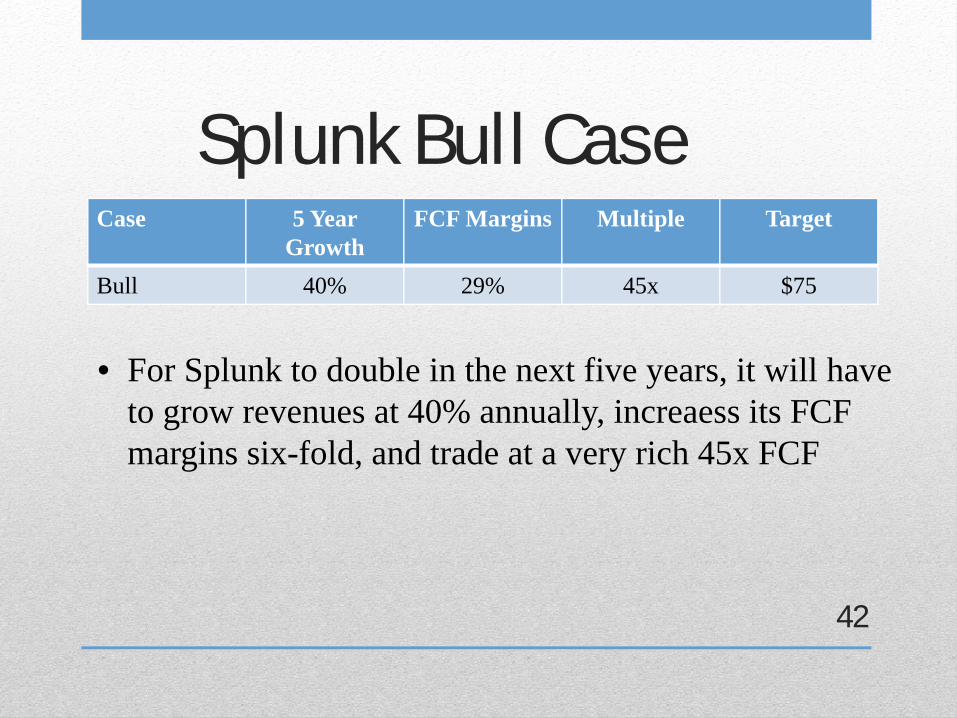
Splunk Bull CaseCase 5 Year
GrowthFCF Margins Multiple Target
Bull 40% 29% 45x $75
42
• For Splunk to double in the next five years, it will have to grow revenues at 40% annually, increaess its FCF margins six-fold, and trade at a very rich 45x FCF

No Growth Valuation• If Splunk slowed sales and marketing spending to
maintenance levels, its FCF margins would increase to 19% (from today’s less than 5%)
• Splunk would still be trading at ~140x FCF • Does this sound like a good bet???
Source: 424B4 filed 2012-7-20
43
Market cap (billion)
Share price EV/FCF Multiple
Splunk 4.23 36.72 ~140x
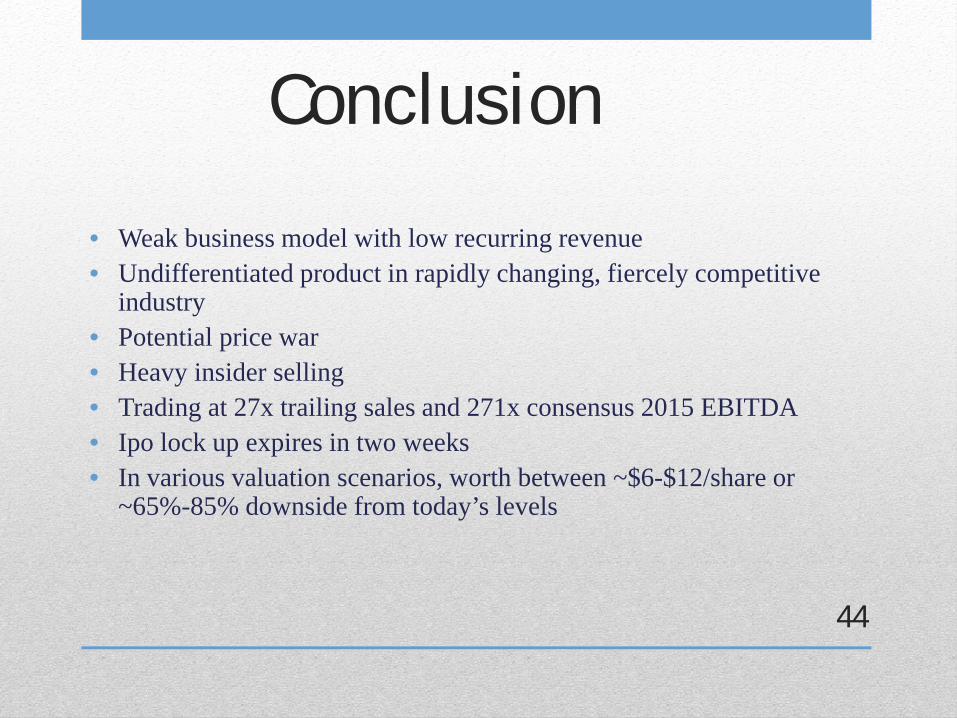
Conclusion
• Weak business model with low recurring revenue• Undifferentiated product in rapidly changing, fiercely competitive
industry• Potential price war• Heavy insider selling• Trading at 27x trailing sales and 271x consensus 2015 EBITDA• Ipo lock up expires in two weeks• In various valuation scenarios, worth between ~$6-$12/share or
~65%-85% downside from today’s levels
44