Embed Size (px)
Citation preview
99mTc Annexin V Imaging of Neonatal Hypoxic Brain InjuryHelen D’Arceuil, PhD; William Rhine, MD; Alex de Crespigny, PhD; Midori Yenari, MD;
John F. Tait, MD, PhD; William H. Strauss, MD; Tobias Engelhorn, MD; Andreas Kastrup, MD;Michael Moseley, PhD; Francis G. Blankenberg, MD
Background and Purpose:—Delayed cell loss in neonates after cerebral hypoxic-ischemic injury (HII) is believed to bea major cause of cerebral palsy. In this study, we used radiolabeled annexin V, a marker of delayed cell loss (apoptosis),to image neonatal rabbits suffering from HII.
Methods—Twenty-two neonatal New Zealand White rabbits had ligation of the right common carotid artery with reductionof inspired oxygen concentration to induce HII. Experimental animals (n517) were exposed to hypoxia until anipsilateral hemispheric decrease in the average diffusion coefficient occurred. After reversal of hypoxia andnormalization of average diffusion coefficient values, experimental animals were injected with99mTc annexin V.Radionuclide images were recorded 2 hours later.
Results—Experimental animals showed no MR evidence of blood-brain barrier breakdown or perfusion abnormalities afterhypoxia. Annexin images demonstrated multifocal brain uptake in both hemispheres of experimental but not controlanimals. Histology of the brains from experimental animals demonstrated scattered pyknotic cortical and hippocampalneurons with cytoplasmic vacuolization of glial cells without evidence of apoptotic nuclei by terminal deoxynucleotidyltransferase–mediated dUTP nick end-labeling (TUNEL) staining. Double staining with markers of cell type andexogenous annexin V revealed that annexin V was localized in the cytoplasm of scattered neurons and astrocytes inexperimental and, less commonly, control brains in the presence of an intact blood-brain barrier.
Conclusions—Apoptosis may develop after HII even in brains that appear normal on diffusion-weighted and perfusionMR. These data suggest a role of radiolabeled annexin V screening of neonates at risk for the development of cerebralpalsy.(Stroke. 2000;32:2692-2700.)
Key Words: apoptosisn brain injuriesn hypoxian newbornn radioisotopesn rabbits
Relatively minor fluctuations in the cerebral microcircu-lation can trigger programmed cell death (apoptosis) in
neonates after a hypoxic-ischemic insult (HII).1–5 Unlike theimmediate irreversible damage caused by severe prolongedischemia (necrosis and infarction), apoptosis occurs over aperiod of time and may be the primary mode of delayedneuronal death in neonates. This type of cell death may be theprecursor of cerebral palsy.6 Because apoptosis is a multistepprocess, with the lag phase lasting a significant amount oftime, it is possible that agents that block the apoptotic cascademay inhibit the completion of programmed cell death, poten-tially saving injured cells.5–8 To determine whether suchtherapy is warranted, an in vivo noninvasive imaging markerthat identifies cells committed to apoptosis is necessary.
See Editorial Comment, page 2699Efforts to image neonatal HII have largely centered on MR
techniques, including phosphorus (31P) and (lipid/lactate)proton (1H) spectroscopy, diffusion-weighted imaging(DWI), and gadolinium (Gd)–diethylenetriamine pentaaceticacid (DTPA) bolus tracking experiments.2,9–12 In a neonatalporcine model, Mehmet et al10 demonstrated high-energyphosphate depletion in the cingulate sulci after HII with31PMR spectroscopy. High-energy phosphate loss was alsodirectly correlated with the number of apoptotic hippocampalneurons in brains, without evidence of necrotic damage 48hours after the insult.
DWI can identify small changes in the apparent diffusioncoefficient (ADC), an indicator of regional diffusion of water
Received March 31, 2000; final revision received June 27, 2000; accepted July 11, 2000.From the Department of Radiology (H.D., A.d.C., W.H.S., T.E., A.K., M.M., F.G.B.), Stanford University School of Medicine, Stanford, Calif; the
Department of Pediatrics (W.R.), Lucile Salter Packard Children’s Hospital at Stanford, Palo Alto, Calif; the Department of Laboratory Medicine, (J.F.T.),University of Washington, Seattle; and the Department of Neurology, Neurological Sciences, and Neurosurgery (M.Y.), Stanford Stroke Center, PaloAlto, Calif.
Drs Strauss, Tait, and Blankenberg are currently on the scientific advisory board of Theseus Imaging Corp, Boston, Mass. Theseus Imaging Corp haspurchased the licensing rights for the authors’ patent, which describes the use of radiolabeled annexin V for the imaging of apoptosis in vivo (filed withStanford University). However, the authors have received no remuneration for the current project, nor did they use the preparation of annexin V byTheseus known as Apomate. Theseus also was not involved in any way with the experimental research or preparation involved in this study.
Correspondence to Francis G. Blankenberg, MD, Department of Radiology, Stanford University School of Medicine, 300 Pasture Dr, Stanford, CA94305-5105. E-mail [email protected]
© 2000 American Heart Association, Inc.
Stroke is available at http://www.strokeaha.org
2692
by guest on July 8, 2018http://stroke.ahajournals.org/
Dow
nloaded from
molecules, which is a sensitive marker of the earliest meta-bolic effects of cerebral ischemia.2,9 Normal ADC values ortimely normalization of ADC values, after brief periods ofischemia, suggest an absence of significant cerebral injury,particularly if found in conjunction with normal cerebralperfusion and an intact blood-brain barrier (BBB), as ob-served on MR bolus tracking and post–T1-weighted post–Gd-DTPA imaging experiments.9 However, the presence orabsence of apoptosis with respect to diffusion-weighted MRIhas been examined only in animals that suffered permanentADC changes that directly corresponded to areas of infarctioninduced by transient but moderately severe ischemia.2,13
Although changes in diffusion correlate with apoptosis,they are not a direct marker of the process. In 1998, aradiopharmaceutical approach to detect apoptosis in vivo wasdescribed.14,15 The technique used99mTc-labeled annexin V,which binds to phosphatidylserine (PS) expressed on theouter leaflet of the cell membrane of tissues undergoingapoptosis, which immediately follows caspase-3 activa-tion.16–18The technique has been validated in cell culture, inin vivo studies of Fas receptor–mediated hepatic apoptosis,and during acute rejection of transplanted hearts,19 lungs,20
and livers.21 Because neurons also express PS as they undergoapoptosis,22,23 we hypothesized that annexin imaging couldbe useful in identifying this process in the brain of theneonate.
In the present study, we tested the ability of99mTc-labeledannexin V to detect cerebral expression of PS in response totransient microcirculatory disturbances as defined by DWIand Gd-DTPA MR imaging during induction of neonatal HII.For the present study, we used a well-described rabbit modelof neonatal HII in which a single common carotid artery wasligated, followed by lowering FIO2 to 10%.24 This modelproduces a global HII after an initial period of ipsilateralischemic changes.
Materials and MethodsNeonatal Rabbit ModelAfter 8- to 10-day-old New Zealand White rabbits (n522, 17experimental and 5 control rabbits) were anesthetized with halo-thane, their right common carotid arteries were ligated. Either theright external jugular or a femoral vein was cannulated for infusionof the MR contrast agent and radiopharmaceuticals.
Experimental animals (n517) were divided into 2 test groups: (1)The chronic group (9 animals) was subjected to 2 hours of hypoxiaand 10 to 15 hours of reperfusion before annexin V injection. Aftersurgery, the animals were transferred to a warm (37°C) hypoxicchamber (10% FIO2) and subjected to hypoxia for a total of 2 hours.These animals recovered overnight. Ten to 15 hours later, they werescanned by MRI, followed by injection of99mTc annexin V andradionuclide imaging 2 hours later. (2). The acute group (8 animals)was subjected to 0.5 to 2 hours of hypoxia and 2 hours of reperfusionbefore annexin V injection). After surgical preparation, the animalswere directly subjected to hypoxia and MRI as described below.
All animals were positioned in a 2.0-T GE Omega MR system andkept normothermic with the use of a warm air circulation system.FIO2 for the experimental group was decreased by administration ofnitrogen to dilute the room air in the nose cone used for ventilation.The heart rate, SaO2 (measured by pulse oximetry), and rectaltemperature were recorded continuously on a Macintosh-based dataacquisition system (MacLab).
Five ligated animals (and 2 additional nonligated animals) wereused as controls and underwent MR and radionuclide imaging
without being exposed to hypoxia. The ligation of a single carotidartery alone, without reduction of FIO2, does not result in HII as seenhistologically.24 All animal procedures were approved by the Insti-tutional Administration Panel on Laboratory and Animal Care.
Diffusion-Weighted and Gd-DTPA–EnhancedT1-Weighted MRIMultislice diffusion-weighted (d512 ms,D516 ms, and b51300s/mm2, with gradient along z-axis; see MRI Data Processing fordefinitions of d, D, and b) MR scans were performed by use of asingle-shot echo planar imaging technique (repetition time 3000 ms,echo time 50 ms, 40-mm field of view, 64364 matrix, 4 to832.5-mm slices).9 For the acute group, continuous monitoring ofthe metabolic status of the brain throughout the entire experimentalperiod (baseline to recovery) was performed with the use of serialDWI to detect the onset of decreased signal intensity. Diffusion-weighted images (b51300 s/mm2) and T2-weighted images (echotime 50 ms) were acquired at baseline (prehypoxia), just before theend of the HII period, and after hypoxia. These images wereprocessed to yield ADC maps. After baseline images, the animalswere exposed to hypoxia (10% FIO2) until there was decreased signalintensity throughout the entire ipsilateral hemisphere. Hypoxia wasreversed immediately thereafter, and the animals recovered in 100%oxygen until diffusion-weighted hypointensity had resolved. Notethat the decreases in ADC, once they appeared, spread quite rapidly,making it difficult to stop the insult at a point in time at which thedecreased signal intensity was limited to just a single hemisphere.Therefore, there was a variable degree of overshoot of decreasedADC to the contralateral side.
Animals in the chronic group were not imaged acutely with MRIbut were instead imaged with MRI 10 to 15 hours after HII andbefore annexin V injection.
Prehypoxia and posthypoxia Gd-DTPA–enhanced T1-weightedMR images were acquired with the following parameters: repetitiontime 500 ms, echo time 12 ms, 2 excitations, 1283128 matrix, fieldof view 50 mm, and slice thickness 2.5 mm.
MRI Data ProcessingDiffusion-weighted images were processed by using customizedimage display software at each scan time point (MR Vision Co). A2-point fit was performed on the signal intensity decay curves of thebaseline (ie, zero diffusion-weighted) images (M0, with b50) anddiffusion-weighted images (M, with b51300 s/mm2). ADC wascalculated from these 2 images according to the following:ADC52loge(M/M 0)/b, where b5g2G2d2 (D2d/3), G is the diffusiongradient strength,d is the duration of the rectangular shapeddiffusion-weighting gradient pulses, andD is the time between theleading edges of the diffusion gradient pulses.25
Regions of interest (ROIs) were drawn in the uninvolved (con-tralateral) and ipsilateral brain by using the ROI tool of the imagedisplay software. The change in ADC was calculated as a percentageof the baseline value.
Radiopharmaceutical Preparationand Administration99mTc-HYNIC annexin V was prepared as previously described.14,15
Briefly, human annexin V was produced by expression inEsche-richia coli. Annexin V was conjugated with HYNIC, a bifunctionallinker molecule with one moiety that binds to a protein lysine residueand another that binds to complexes of99mTc.26 HYNIC-labeledannexin V was stored at270°C until use.99mTc was bound toHYNIC-labeled annexin V after reduction in a tin-tricine solution.Specific activity ranged from 100 to 200mCi/mg protein, with aradiopurity of 92% to 97%.
Annexin V (2 to 4 mCi, 50 to 100mg/kg protein per animal) wasadministered intravenously 2 hours (acutely) and 10 to 15 hours(chronically) after HII. Three chronic test and 2 ligation controlanimals were coinjected with 200mCi of 111In-DTPA to assess forthe integrity of the BBB by use of a radiopharmaceutical technique.
D’Arceuil et al Annexin Imaging of Neonatal Hypoxic Brain Injury 2693
by guest on July 8, 2018http://stroke.ahajournals.org/
Dow
nloaded from
Radionuclide ImagingA mobile gamma camera (model 420, Technicare) equipped with a1-mm pinhole collimator was used to record the radionuclidedistribution. Images were recorded 2 hours after tracer administra-tion. The animals were sedated with 80 mg/kg ketamine, adminis-tered intramuscularly before imaging.
The brain was imaged in the vertex (posterior) and right lateralpositions for 20 minutes per view. Data were recorded in a dedicatedsystem (ICON, Siemens) in a 2563256 matrix. The camera was setto image the 140-keV photopeak of99mTc with a 20% window. In theanimals coinjected with111In-DTPA, 20-minute 2563256 acquisi-tions were performed with use of the same projections (withoutrepositioning of brain) as described above. The pulse height analyzerwas set to include both photopeaks of111In.
Radionuclide Data Processing andStatistical AnalysisImages were analyzed by placing an ROI over normal areas of thebrain and over zones of high uptake. The normal zones correspondedto regions of low cerebral activity (ie, cerebral tissue background[CTB]). Data were expressed as CTB (cpm) per number of pixels.
Regions of highest uptake (RoH) were recorded as counts (cpm)per pixel and then normalized to CBT as follows: RoH (cpm/pixel)/CTB (cpm/pixel).
The normalized activities obtained (see above) were averaged andpresented as mean6SD for individual brain tissue regions. Thecerebellar uptakes in the control and experimental groups wereexpressed as cerebellar counts (cpm) per pixel divided by CTB (cpm)per pixel. Statistical comparisons between control and experimentalmean values were performed by a 2-tailed Studentt test forsignificance. A value ofP#0.05 was considered to be significant.Note that the intrasubject regional variations of annexin uptakewithin control brains (n55 ligated, n52 nonligated) were,29% forimages taken in the posterior projection and 14% for those taken inthe right lateral projection.
Histopathologic Analysis/In Situ Detection ofApoptotic NucleiBrains were excised and immediately put into PBS before radionu-clide imaging ('1.5 hours for each animal). Formalin fixation in situwas not performed because this may have interfered with annexin Vbinding. After annexin V imaging, the brains were transferreddirectly to phosphate-buffered formalin. Formalin-fixed paraffin-embedded tissues were sectioned coronally in 5 equally spacedlocations in the cephalocaudal direction of the neonatal cerebrum andcerebellum. Sections (5mm) were then obtained and stained withhematoxylin and eosin. For the detection of apoptotic nuclei,corresponding 5-mm sections were stained by direct immunoperox-idase detection of digoxigenin-labeled 39-OH DNA strand breaks byuse of the terminal deoxynucleotidyl transferase–mediated dUTPnick end-labeling (TUNEL) method.27 The procedures used wereoutlined in the commercially available Apop Tag Kit (Oncor Inc).
Hematoxylin and eosin–stained and TUNEL-stained sections wereexamined for regions of ischemic damage and the presence ofapoptotic nuclei (TUNEL-positive nuclei with clumped chromatin).
Immunohistochemical Staining of IntravenouslyInjected Biotin-AnnexinSubgroups of animals were as follows: acute hypoxia (n52), chronichypoxia (n52), and control (n52); all 6 animals were coinjectedwith biotin-labeled annexin V (300mg/kg protein, Molecular Probes)and radiolabeled annexin V. Two hours after coinjection, ex vivobrain specimens were imaged and then flash-frozen on dry ice(220°C) without formalin fixation. Frozen histological sections(20mm) were obtained in the coronal plane, including the cortex andmidbrain of each animal. These sections were then fixed with 75%acetone/25% ethanol, washed with 0.003% hydrogen peroxide,digested for 15 minutes with proteinase K solution, and placed instreptavidin-conjugated horseradish peroxidase PBS bath for 40
minutes. Sigma Fast DAB (tablets) solution was applied for 10minutes, followed by quenching. After identifying cells positive forannexin V–biotin (brown stain), sections were then colabeled withcell-type markers to identify neurons and astrocytes. Sections weretreated with 0.5% Triton X-100 for 20 minutes and then blocked in5% normal serum. Primary antibodies to identify neurons (MAP2Bantibody, 1:100 dilution; M41420, Transduction Laboratories) orastrocytes (GFAP antibody cocktail, 1:200 dilution; 60341D, Pharm-ingen International) were applied at room temperature for 1 hour.Sections were then incubated in biotinylated secondary antibodies,followed by an alkaline phosphatase–based avidin-biotin complexand then Vector Blue as the chromogen (all reagents were purchasedfrom Vector Laboratories).
ResultsMR ImagingAnimals in the acute group showed decreased ADC through-out the ipsilateral cortex and subcortical white matter and avariable degree of overshoot to the contralateral cortex atpeak hypoxia. In all animals, these decreases resolved com-pletely after reversal of hypoxia during recovery. The regionsof focally increased annexin V uptake were primarily in thefrontal/frontoparietal region and midbrain, which did notprecisely match regions of ADC change despite some clearregions of overlap. Note that no MRI was performed on thechronic group during the hypoxic interval.
In the acute experimental animals, decreased ADC in theipsilateral hemisphere was'50% of baseline (range 46% to55%), and there was essentially no change in the contralateraluninvolved brain tissue. All brains, control and experimental,showed no areas of decreased ADC in the DWI images beforeradionuclide injection. T1-weighted images also showed nocontrast leakage before annexin injection V, as shown inFigure 1.
The animal in Figure 1 showed focally increased annexinV uptake primarily in the ipsilateral hemispheric, bifrontal,
Figure 1. MRI of acute hypoxia. Axial ADC at 60 minutes ofhypoxia (A) and maps (B) and Gd-enhanced T1-weighted (T1 W)images (C) after hypoxia in a representative animal from theacute experimental group. Diffusion maps at the peak of theinsult (A) at 60 minutes show regions of decreased ADC (black)bilaterally (right greater than left hemisphere). Maps after hypox-ia and before annexin V imaging show that the brain has recov-ered to its prehypoxic state. There is no leakage of contrast(white) into the extravascular space, indicating a functional BBB.The right side of the brain (R) is indicated; the arrow points tothe position of the nose.
2694 Stroke November 2000
by guest on July 8, 2018http://stroke.ahajournals.org/
Dow
nloaded from
and basilar regions. These areas of uptake did not preciselymatch those seen in the ADC images, although there wassome degree of overlap.
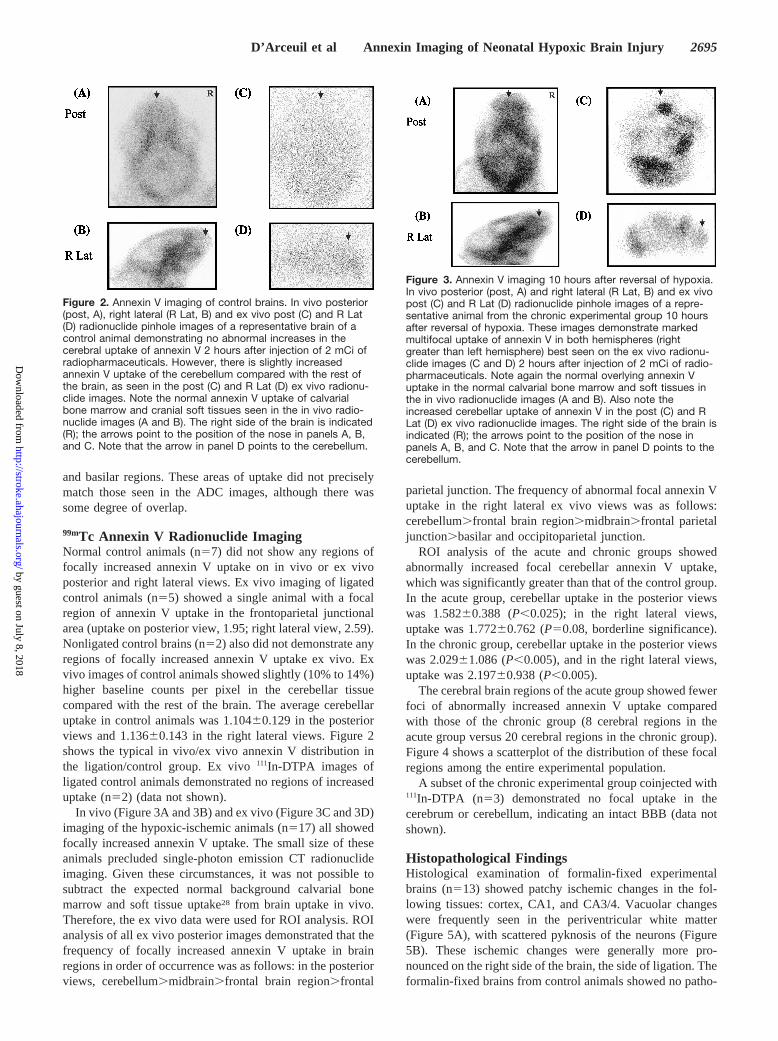
99mTc Annexin V Radionuclide ImagingNormal control animals (n57) did not show any regions offocally increased annexin V uptake on in vivo or ex vivoposterior and right lateral views. Ex vivo imaging of ligatedcontrol animals (n55) showed a single animal with a focalregion of annexin V uptake in the frontoparietal junctionalarea (uptake on posterior view, 1.95; right lateral view, 2.59).Nonligated control brains (n52) also did not demonstrate anyregions of focally increased annexin V uptake ex vivo. Exvivo images of control animals showed slightly (10% to 14%)higher baseline counts per pixel in the cerebellar tissuecompared with the rest of the brain. The average cerebellaruptake in control animals was 1.10460.129 in the posteriorviews and 1.13660.143 in the right lateral views. Figure 2shows the typical in vivo/ex vivo annexin V distribution inthe ligation/control group. Ex vivo111In-DTPA images ofligated control animals demonstrated no regions of increaseduptake (n52) (data not shown).
In vivo (Figure 3A and 3B) and ex vivo (Figure 3C and 3D)imaging of the hypoxic-ischemic animals (n517) all showedfocally increased annexin V uptake. The small size of theseanimals precluded single-photon emission CT radionuclideimaging. Given these circumstances, it was not possible tosubtract the expected normal background calvarial bonemarrow and soft tissue uptake28 from brain uptake in vivo.Therefore, the ex vivo data were used for ROI analysis. ROIanalysis of all ex vivo posterior images demonstrated that thefrequency of focally increased annexin V uptake in brainregions in order of occurrence was as follows: in the posteriorviews, cerebellum.midbrain.frontal brain region.frontal
parietal junction. The frequency of abnormal focal annexin Vuptake in the right lateral ex vivo views was as follows:cerebellum.frontal brain region.midbrain.frontal parietaljunction.basilar and occipitoparietal junction.
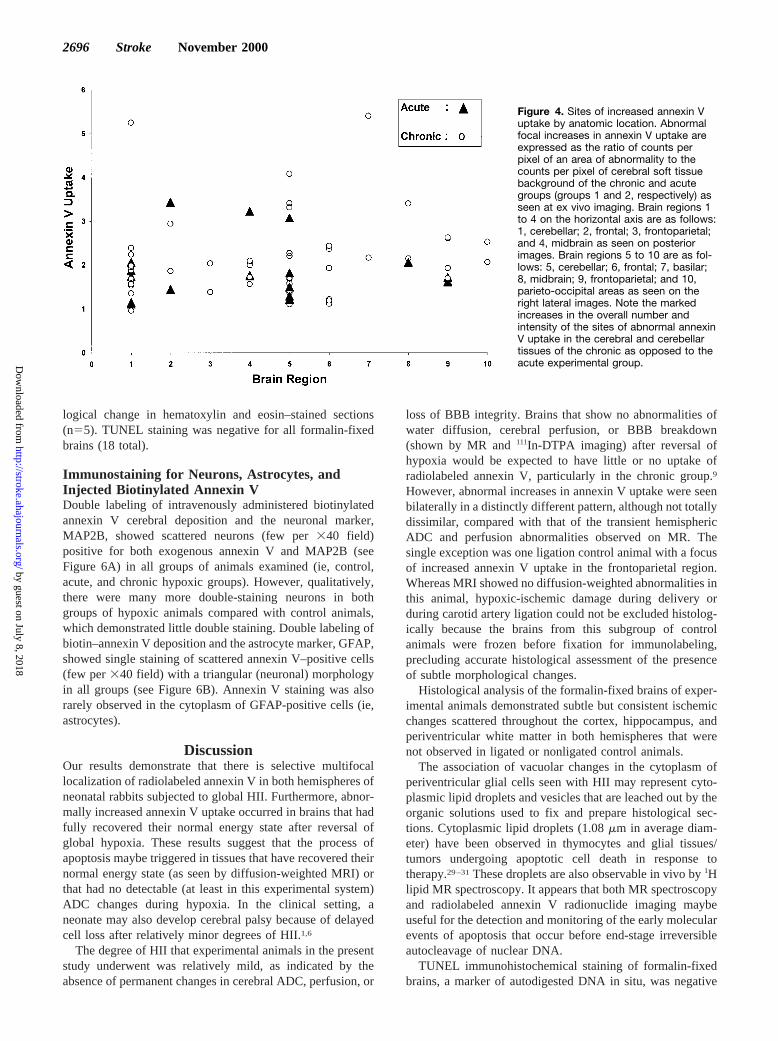
ROI analysis of the acute and chronic groups showedabnormally increased focal cerebellar annexin V uptake,which was significantly greater than that of the control group.In the acute group, cerebellar uptake in the posterior viewswas 1.58260.388 (P,0.025); in the right lateral views,uptake was 1.77260.762 (P50.08, borderline significance).In the chronic group, cerebellar uptake in the posterior viewswas 2.02961.086 (P,0.005), and in the right lateral views,uptake was 2.19760.938 (P,0.005).
The cerebral brain regions of the acute group showed fewerfoci of abnormally increased annexin V uptake comparedwith those of the chronic group (8 cerebral regions in theacute group versus 20 cerebral regions in the chronic group).Figure 4 shows a scatterplot of the distribution of these focalregions among the entire experimental population.
A subset of the chronic experimental group coinjected with111In-DTPA (n53) demonstrated no focal uptake in thecerebrum or cerebellum, indicating an intact BBB (data notshown).
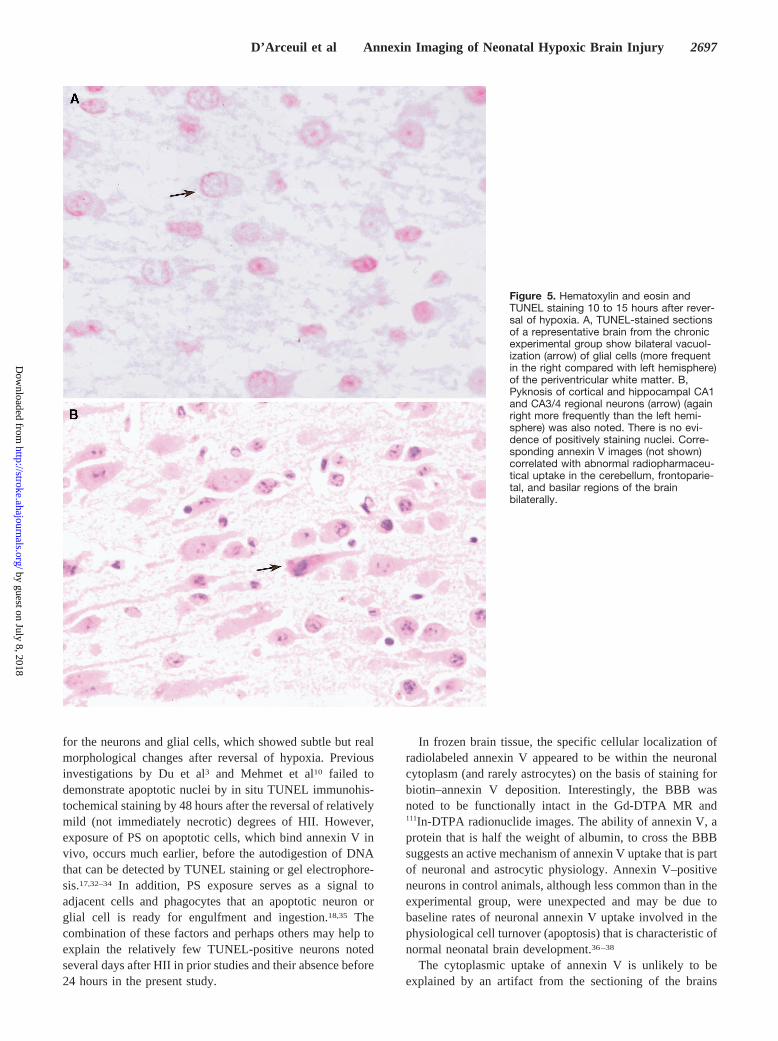
Histopathological FindingsHistological examination of formalin-fixed experimentalbrains (n513) showed patchy ischemic changes in the fol-lowing tissues: cortex, CA1, and CA3/4. Vacuolar changeswere frequently seen in the periventricular white matter(Figure 5A), with scattered pyknosis of the neurons (Figure5B). These ischemic changes were generally more pro-nounced on the right side of the brain, the side of ligation. Theformalin-fixed brains from control animals showed no patho-
Figure 2. Annexin V imaging of control brains. In vivo posterior(post, A), right lateral (R Lat, B) and ex vivo post (C) and R Lat(D) radionuclide pinhole images of a representative brain of acontrol animal demonstrating no abnormal increases in thecerebral uptake of annexin V 2 hours after injection of 2 mCi ofradiopharmaceuticals. However, there is slightly increasedannexin V uptake of the cerebellum compared with the rest ofthe brain, as seen in the post (C) and R Lat (D) ex vivo radionu-clide images. Note the normal annexin V uptake of calvarialbone marrow and cranial soft tissues seen in the in vivo radio-nuclide images (A and B). The right side of the brain is indicated(R); the arrows point to the position of the nose in panels A, B,and C. Note that the arrow in panel D points to the cerebellum.
Figure 3. Annexin V imaging 10 hours after reversal of hypoxia.In vivo posterior (post, A) and right lateral (R Lat, B) and ex vivopost (C) and R Lat (D) radionuclide pinhole images of a repre-sentative animal from the chronic experimental group 10 hoursafter reversal of hypoxia. These images demonstrate markedmultifocal uptake of annexin V in both hemispheres (rightgreater than left hemisphere) best seen on the ex vivo radionu-clide images (C and D) 2 hours after injection of 2 mCi of radio-pharmaceuticals. Note again the normal overlying annexin Vuptake in the normal calvarial bone marrow and soft tissues inthe in vivo radionuclide images (A and B). Also note theincreased cerebellar uptake of annexin V in the post (C) and RLat (D) ex vivo radionuclide images. The right side of the brain isindicated (R); the arrows point to the position of the nose inpanels A, B, and C. Note that the arrow in panel D points to thecerebellum.
D’Arceuil et al Annexin Imaging of Neonatal Hypoxic Brain Injury 2695
by guest on July 8, 2018http://stroke.ahajournals.org/
Dow
nloaded from
logical change in hematoxylin and eosin–stained sections(n55). TUNEL staining was negative for all formalin-fixedbrains (18 total).
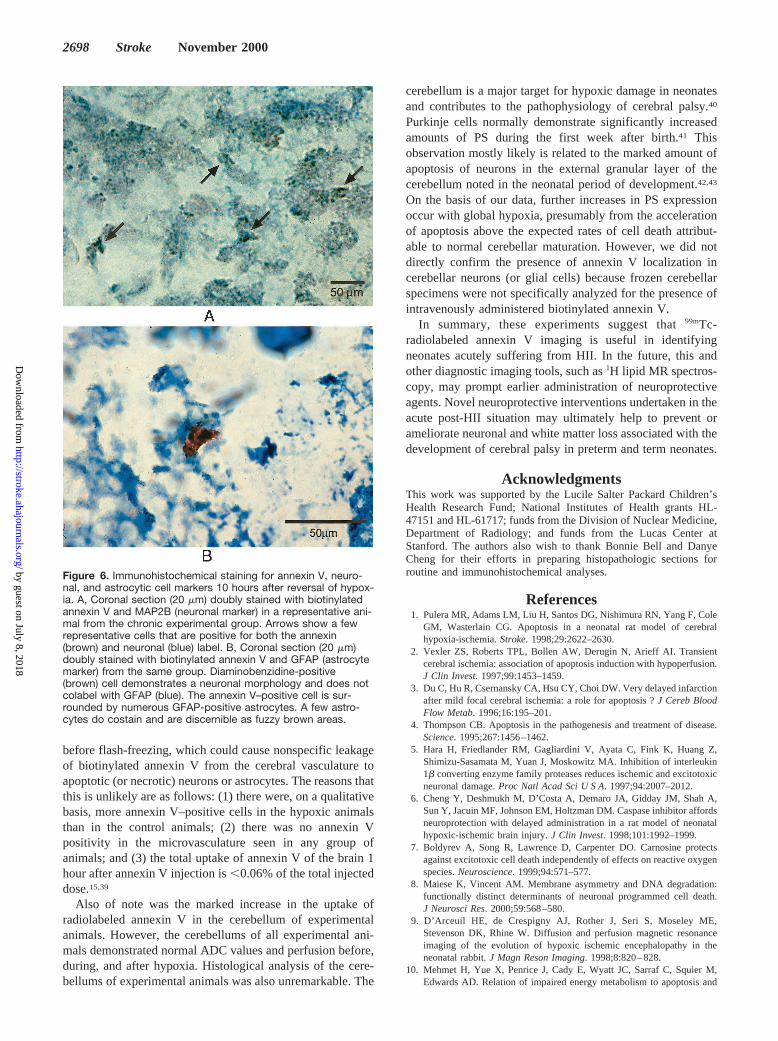
Immunostaining for Neurons, Astrocytes, andInjected Biotinylated Annexin VDouble labeling of intravenously administered biotinylatedannexin V cerebral deposition and the neuronal marker,MAP2B, showed scattered neurons (few per340 field)positive for both exogenous annexin V and MAP2B (seeFigure 6A) in all groups of animals examined (ie, control,acute, and chronic hypoxic groups). However, qualitatively,there were many more double-staining neurons in bothgroups of hypoxic animals compared with control animals,which demonstrated little double staining. Double labeling ofbiotin–annexin V deposition and the astrocyte marker, GFAP,showed single staining of scattered annexin V–positive cells(few per340 field) with a triangular (neuronal) morphologyin all groups (see Figure 6B). Annexin V staining was alsorarely observed in the cytoplasm of GFAP-positive cells (ie,astrocytes).
DiscussionOur results demonstrate that there is selective multifocallocalization of radiolabeled annexin V in both hemispheres ofneonatal rabbits subjected to global HII. Furthermore, abnor-mally increased annexin V uptake occurred in brains that hadfully recovered their normal energy state after reversal ofglobal hypoxia. These results suggest that the process ofapoptosis maybe triggered in tissues that have recovered theirnormal energy state (as seen by diffusion-weighted MRI) orthat had no detectable (at least in this experimental system)ADC changes during hypoxia. In the clinical setting, aneonate may also develop cerebral palsy because of delayedcell loss after relatively minor degrees of HII.1,6
The degree of HII that experimental animals in the presentstudy underwent was relatively mild, as indicated by theabsence of permanent changes in cerebral ADC, perfusion, or
loss of BBB integrity. Brains that show no abnormalities ofwater diffusion, cerebral perfusion, or BBB breakdown(shown by MR and111In-DTPA imaging) after reversal ofhypoxia would be expected to have little or no uptake ofradiolabeled annexin V, particularly in the chronic group.9
However, abnormal increases in annexin V uptake were seenbilaterally in a distinctly different pattern, although not totallydissimilar, compared with that of the transient hemisphericADC and perfusion abnormalities observed on MR. Thesingle exception was one ligation control animal with a focusof increased annexin V uptake in the frontoparietal region.Whereas MRI showed no diffusion-weighted abnormalities inthis animal, hypoxic-ischemic damage during delivery orduring carotid artery ligation could not be excluded histolog-ically because the brains from this subgroup of controlanimals were frozen before fixation for immunolabeling,precluding accurate histological assessment of the presenceof subtle morphological changes.
Histological analysis of the formalin-fixed brains of exper-imental animals demonstrated subtle but consistent ischemicchanges scattered throughout the cortex, hippocampus, andperiventricular white matter in both hemispheres that werenot observed in ligated or nonligated control animals.
The association of vacuolar changes in the cytoplasm ofperiventricular glial cells seen with HII may represent cyto-plasmic lipid droplets and vesicles that are leached out by theorganic solutions used to fix and prepare histological sec-tions. Cytoplasmic lipid droplets (1.08mm in average diam-eter) have been observed in thymocytes and glial tissues/tumors undergoing apoptotic cell death in response totherapy.29–31These droplets are also observable in vivo by1Hlipid MR spectroscopy. It appears that both MR spectroscopyand radiolabeled annexin V radionuclide imaging maybeuseful for the detection and monitoring of the early molecularevents of apoptosis that occur before end-stage irreversibleautocleavage of nuclear DNA.
TUNEL immunohistochemical staining of formalin-fixedbrains, a marker of autodigested DNA in situ, was negative
Figure 4. Sites of increased annexin Vuptake by anatomic location. Abnormalfocal increases in annexin V uptake areexpressed as the ratio of counts perpixel of an area of abnormality to thecounts per pixel of cerebral soft tissuebackground of the chronic and acutegroups (groups 1 and 2, respectively) asseen at ex vivo imaging. Brain regions 1to 4 on the horizontal axis are as follows:1, cerebellar; 2, frontal; 3, frontoparietal;and 4, midbrain as seen on posteriorimages. Brain regions 5 to 10 are as fol-lows: 5, cerebellar; 6, frontal; 7, basilar;8, midbrain; 9, frontoparietal; and 10,parieto-occipital areas as seen on theright lateral images. Note the markedincreases in the overall number andintensity of the sites of abnormal annexinV uptake in the cerebral and cerebellartissues of the chronic as opposed to theacute experimental group.
2696 Stroke November 2000
by guest on July 8, 2018http://stroke.ahajournals.org/
Dow
nloaded from
for the neurons and glial cells, which showed subtle but realmorphological changes after reversal of hypoxia. Previousinvestigations by Du et al3 and Mehmet et al10 failed todemonstrate apoptotic nuclei by in situ TUNEL immunohis-tochemical staining by 48 hours after the reversal of relativelymild (not immediately necrotic) degrees of HII. However,exposure of PS on apoptotic cells, which bind annexin V invivo, occurs much earlier, before the autodigestion of DNAthat can be detected by TUNEL staining or gel electrophore-sis.17,32–34 In addition, PS exposure serves as a signal toadjacent cells and phagocytes that an apoptotic neuron orglial cell is ready for engulfment and ingestion.18,35 Thecombination of these factors and perhaps others may help toexplain the relatively few TUNEL-positive neurons notedseveral days after HII in prior studies and their absence before24 hours in the present study.
In frozen brain tissue, the specific cellular localization ofradiolabeled annexin V appeared to be within the neuronalcytoplasm (and rarely astrocytes) on the basis of staining forbiotin–annexin V deposition. Interestingly, the BBB wasnoted to be functionally intact in the Gd-DTPA MR and111In-DTPA radionuclide images. The ability of annexin V, aprotein that is half the weight of albumin, to cross the BBBsuggests an active mechanism of annexin V uptake that is partof neuronal and astrocytic physiology. Annexin V–positiveneurons in control animals, although less common than in theexperimental group, were unexpected and may be due tobaseline rates of neuronal annexin V uptake involved in thephysiological cell turnover (apoptosis) that is characteristic ofnormal neonatal brain development.36–38
The cytoplasmic uptake of annexin V is unlikely to beexplained by an artifact from the sectioning of the brains
Figure 5. Hematoxylin and eosin andTUNEL staining 10 to 15 hours after rever-sal of hypoxia. A, TUNEL-stained sectionsof a representative brain from the chronicexperimental group show bilateral vacuol-ization (arrow) of glial cells (more frequentin the right compared with left hemisphere)of the periventricular white matter. B,Pyknosis of cortical and hippocampal CA1and CA3/4 regional neurons (arrow) (againright more frequently than the left hemi-sphere) was also noted. There is no evi-dence of positively staining nuclei. Corre-sponding annexin V images (not shown)correlated with abnormal radiopharmaceu-tical uptake in the cerebellum, frontoparie-tal, and basilar regions of the brainbilaterally.
D’Arceuil et al Annexin Imaging of Neonatal Hypoxic Brain Injury 2697
by guest on July 8, 2018http://stroke.ahajournals.org/
Dow
nloaded from
before flash-freezing, which could cause nonspecific leakageof biotinylated annexin V from the cerebral vasculature toapoptotic (or necrotic) neurons or astrocytes. The reasons thatthis is unlikely are as follows: (1) there were, on a qualitativebasis, more annexin V–positive cells in the hypoxic animalsthan in the control animals; (2) there was no annexin Vpositivity in the microvasculature seen in any group ofanimals; and (3) the total uptake of annexin V of the brain 1hour after annexin V injection is,0.06% of the total injecteddose.15,39
Also of note was the marked increase in the uptake ofradiolabeled annexin V in the cerebellum of experimentalanimals. However, the cerebellums of all experimental ani-mals demonstrated normal ADC values and perfusion before,during, and after hypoxia. Histological analysis of the cere-bellums of experimental animals was also unremarkable. The
cerebellum is a major target for hypoxic damage in neonatesand contributes to the pathophysiology of cerebral palsy.40
Purkinje cells normally demonstrate significantly increasedamounts of PS during the first week after birth.41 Thisobservation mostly likely is related to the marked amount ofapoptosis of neurons in the external granular layer of thecerebellum noted in the neonatal period of development.42,43
On the basis of our data, further increases in PS expressionoccur with global hypoxia, presumably from the accelerationof apoptosis above the expected rates of cell death attribut-able to normal cerebellar maturation. However, we did notdirectly confirm the presence of annexin V localization incerebellar neurons (or glial cells) because frozen cerebellarspecimens were not specifically analyzed for the presence ofintravenously administered biotinylated annexin V.
In summary, these experiments suggest that99mTc-radiolabeled annexin V imaging is useful in identifyingneonates acutely suffering from HII. In the future, this andother diagnostic imaging tools, such as1H lipid MR spectros-copy, may prompt earlier administration of neuroprotectiveagents. Novel neuroprotective interventions undertaken in theacute post-HII situation may ultimately help to prevent orameliorate neuronal and white matter loss associated with thedevelopment of cerebral palsy in preterm and term neonates.
AcknowledgmentsThis work was supported by the Lucile Salter Packard Children’sHealth Research Fund; National Institutes of Health grants HL-47151 and HL-61717; funds from the Division of Nuclear Medicine,Department of Radiology; and funds from the Lucas Center atStanford. The authors also wish to thank Bonnie Bell and DanyeCheng for their efforts in preparing histopathologic sections forroutine and immunohistochemical analyses.
References1. Pulera MR, Adams LM, Liu H, Santos DG, Nishimura RN, Yang F, Cole
GM, Wasterlain CG. Apoptosis in a neonatal rat model of cerebralhypoxia-ischemia.Stroke. 1998;29:2622–2630.
2. Vexler ZS, Roberts TPL, Bollen AW, Derugin N, Arieff AI. Transientcerebral ischemia: association of apoptosis induction with hypoperfusion.J Clin Invest.1997;99:1453–1459.
3. Du C, Hu R, Csernansky CA, Hsu CY, Choi DW. Very delayed infarctionafter mild focal cerebral ischemia: a role for apoptosis ?J Cereb BloodFlow Metab. 1996;16:195–201.
4. Thompson CB. Apoptosis in the pathogenesis and treatment of disease.Science. 1995;267:1456–1462.
5. Hara H, Friedlander RM, Gagliardini V, Ayata C, Fink K, Huang Z,Shimizu-Sasamata M, Yuan J, Moskowitz MA. Inhibition of interleukin1b converting enzyme family proteases reduces ischemic and excitotoxicneuronal damage.Proc Natl Acad Sci U S A. 1997;94:2007–2012.
6. Cheng Y, Deshmukh M, D’Costa A, Demaro JA, Gidday JM, Shah A,Sun Y, Jacuin MF, Johnson EM, Holtzman DM. Caspase inhibitor affordsneuroprotection with delayed administration in a rat model of neonatalhypoxic-ischemic brain injury.J Clin Invest. 1998;101:1992–1999.
7. Boldyrev A, Song R, Lawrence D, Carpenter DO. Carnosine protectsagainst excitotoxic cell death independently of effects on reactive oxygenspecies.Neuroscience. 1999;94:571–577.
8. Maiese K, Vincent AM. Membrane asymmetry and DNA degradation:functionally distinct determinants of neuronal programmed cell death.J Neurosci Res. 2000;59:568–580.
9. D’Arceuil HE, de Crespigny AJ, Rother J, Seri S, Moseley ME,Stevenson DK, Rhine W. Diffusion and perfusion magnetic resonanceimaging of the evolution of hypoxic ischemic encephalopathy in theneonatal rabbit.J Magn Reson Imaging. 1998;8:820–828.
10. Mehmet H, Yue X, Penrice J, Cady E, Wyatt JC, Sarraf C, Squier M,Edwards AD. Relation of impaired energy metabolism to apoptosis and
Figure 6. Immunohistochemical staining for annexin V, neuro-nal, and astrocytic cell markers 10 hours after reversal of hypox-ia. A, Coronal section (20 mm) doubly stained with biotinylatedannexin V and MAP2B (neuronal marker) in a representative ani-mal from the chronic experimental group. Arrows show a fewrepresentative cells that are positive for both the annexin(brown) and neuronal (blue) label. B, Coronal section (20 mm)doubly stained with biotinylated annexin V and GFAP (astrocytemarker) from the same group. Diaminobenzidine-positive(brown) cell demonstrates a neuronal morphology and does notcolabel with GFAP (blue). The annexin V–positive cell is sur-rounded by numerous GFAP-positive astrocytes. A few astro-cytes do costain and are discernible as fuzzy brown areas.
2698 Stroke November 2000
by guest on July 8, 2018http://stroke.ahajournals.org/
Dow
nloaded from
necrosis following transient cerebral hypoxia-ischaemia.Cell DeathDiffer. 1998;5:321–329.
11. Huppi PS, Barnes PD. Magnetic resonance techniques in the evaluation ofthe newborn brain.Clin Perinatol. 1997;24:693–723.
12. Wick M, Nagatomo Y, Prielmeier F, Frahm J. Alteration of intracellularmetabolite diffusion in rat brain in vivo during ischemia and reperfusion.Stroke. 1995;26:1930–1933.
13. Rupalla K, Allegrini PR, Sauer D, Wiessner C. Time course of microgliaactivation and apoptosis in various brain regions after permanent focalcerebral ischemia in mice.Acta Neuropathol (Berl). 1998;96:172–178.
14. Blankenberg FG, Katsikis PD, Tait JF, Davis RE, Naumovski L, OhtsukiK, Kopiwoda S, Abrams MJ, Darkes M, Robbins RC, et al. In vivodetection and imaging of phosphatidylserine expression during pro-grammed cell death.Proc Natl Acad Sci U S A. 1998;95:6349–6354.
15. Blankenberg FG, Katsikis PD, Tait JF, Davis RE, Naumovski L, OhtsukiK, Kopiwoda S, Abrams MJ, Strauss HW. Imaging of apoptosis (pro-grammed cell death) with99 mTc annexin V. J Nucl Med. 1999;40:184–191.
16. Naito M, Nagashima K, Mashima T, Tsuruo T. Phosphatidylserine exter-nalization is a downstream event of interleukin-1b-converting enzymefamily protease activation during apoptosis.Blood. 1997;89:2060–2066.
17. Allen RT, Hunter WJ, Agrawal DK. Morphological and biochemicalcharacterization and analysis of apoptosis.J Pharmacol Toxicol Methods.1997;37:215–228.
18. Zwaal FA, Schroit AJ. Pathophysiologic implications of membrane phos-pholipid asymmetry in blood cells.Blood. 1997;89:1121–1132.
19. Vriens PW, Blankenberg FG, Stoot JH, Ohtsuki K, Berry GJ, Tait JF,Strauss HW, Robbins RC. The use of 99m technetium labeled annexin Vfor in vivo imaging of apoptosis during cardiac allograft rejection.J Thorac Cardiovasc Surg. 1998;116:844–853.
20. Blankenberg FG, Robbins RC, Stoot JH, Vriens PW, Berry GJ, Tait JF,Strauss HW. Radionuclide imaging of acute lung transplant rejection withannexin V.Chest. 2000;117:834–840.
21. Ogura Y, Krams SM, Martinez OM, Kopiwoda S, Higgins JPT, EsquivelCO, Strauss HW, Tait JF, Blankenberg FG. Radiolabeled annexin Vimaging: diagnosis of allograft rejection in an experimental rodent modelof liver transplantation.Radiology. 2000;214:795–800.
22. Rimon G, Bazenet CE, Philpott KL, Rubin LL. Increased surface phos-phatidylserine is an early marker of neuronal apoptosis.J Neurosci Res.1997;48:563–570.
23. Vincent AM, Maiese K. Direct temporal analysis of apoptosis inductionin living adherent neurons.J Histochem Cytochem. 1999;47:661–672.
24. Levine S. Anoxic-ischemic encephalopathy in rats.Am J Pathol. 1960;36:1–17.
25. LeBihan D, Breton E, Lallemand D. Separation of diffusion and perfusionin intravoxel incoherent motion (IVIM) MR imaging.Radiology. 1986;168:497–502.
26. Abrams MJ, Juweid M, tenTake CI, Schwartz DA, Hauser MM, Gaul FE,Fuccello AJ, Rubin RH, Strauss HW, Fischman AJ. Technetium-99m-human polyclonal IgG radiolabeled via the hydrazino nicotinamidederivative for imaging focal sites of infection in rats.J Nucl Med.1990;31:2022–2028.
27. Gavrieli Y, Sherman Y, Ben-Sasson SA. Identification of programmedcell death in situ via specific labeling of nuclear DNA fragmentation.J Cell Biol. 1992;119:493–501.
28. Blankenberg FG, Tait JF, Strauss HW. Apoptotic cell death: its impli-cations for imaging in the next millennium.Eur J Nucl Med. 2000;27:359–367
29. Veale MF, Dingley AJ, King GF, King NJC.1H-NMR visible neutrallipids in activated T lymphocytes: relationship to phosphatidylcholinecycling. Biochim Biophys Acta. 1996;1303:215–221.
30. Remy C, Fouilhe N, Barba I, Sam-Lai E, Lahrech H, Cucurella M-G,Izquierdo M, Moreno A, Ziegler A, Massarelli R, et al. Evidence ThatMobile Lipids Detected in Rat Brain Glioma by1H Nuclear MagneticResonance Correspond to Lipid Droplets.Cancer Res. 1997;57:407–414.
31. Hakumaki JM, Poptani H, Sandmair AM, Yla-Herttuala S, KauppinenRA. 1H MRS detects polyunsaturated fatty acid accumulation duringgene therapy of glioma: implications for the in vivo detection of apopto-sis. Nat Med. 1999;5:1323–1327.
32. van Heerde WL, de Groot PG, Reutelingsperger CPM. The complexity ofthe phospholipid binding protein annexin V.Thromb Haemost. 1995;73:172–179.
33. van Engeland M, Nieland LJW, Ramaekers FCS, Schutte B, Reuteling-sperger CPM. Annexin V-affinity assay: a review on an apoptosisdetection system based on phosphatidylserine exposure.Cytometry. 1998;31:1–9.
34. van Engeland M, Kuijpers HJH, Ramaekers FCS, Reutelingsperger CPM,Schutte B. Plasma membrane alterations and cytoskeletal changes inapoptosis.Exp Cell Res. 1997;235:421–430.
35. Fadok VA, Bratton DL, Rose DM, Pearson A, Ezekewitz RA, HensonPM. A receptor for phosphatidylserine-specific clearance of apoptoticcells.Nature. 2000;405:85–90
36. Burek MJ, Oppenheim RW. Programmed cell death in the developingnervous system.Brain Pathol. 1996;6:427–446.
37. Voyvodic JT. Cell death in cortical development: how much? why? sowhat?Neuron.1999;16:693–696.
38. Bayer SA, Altman J, Russo RJ, Zhang X. Timetables of neurogenesis inthe human brain based on experimentally determined patterns in the rat.Neurotoxicology. 1993;14:83–144.
39. Ohtsuki K, Akashi K, Aoka Y, Blankenberg FG, Kopiwoda S, Tait JF,Strauss HW. Technetium-99m HYNIC-annexin V: a potential radiophar-maceutical for the in-vivo detection of apoptosis.Eur J Nucl Med.1999;26:1251–1258.
40. Lee JD, Kim DI, Ryu YH, Whang GJ, Park CI, Kim DG. Technetium-99m-ECD brain SPECT in cerebral palsy: comparison with MRI.J NuclMed. 1998;39:619–623.
41. Miyazawa A, Inoue H, Yoshioka T, Horikoshi T, Yanagisawa K, UmedaM, Inoue K. Monoclonal antibody analysis of phosphatidylserine andprotein kinase C localizations in developing rat cerebellum.J Neurochem.1992;59:1547–1554.
42. Migheli A, Attanasio A, Lee WH, Bayer SA, Ghetti B. Detection ofapoptosis in weaver cerebellum by electron microscopic in situ end-labeling of fragmented DNA.Neurosci Lett. 1995;199:53–56.
43. Tanaka M, Sawada M, Miura M, Marunouchi T. Insulin-like growthfactor-1 analogue prevents apoptosis mediated through an interleukin-1bconverting enzyme (caspase-1)-like protease of cerebellar externalgranular layer neurons: developmental stage-specific mechanisms ofneuronal cell death.Neuroscience. 1998;84:89–100.
Editorial Comment
The article by D’Arceuil et al describes a novel imagingtechnique of apoptosis with radiolabeled annexin V. Thistechnique is applied to hypoxic/ischemic injury in theneonatal rabbit brain to observe the role of apoptosis in thedevelopment of the ischemic injury. This study also usesdiffusion MRI techniques to monitor the time course of theischemia and to confirm the transient nature of the ische-mia under the hypoxic/ischemic protocol used. This tech-nique is clearly novel, and the results are important forunderstanding hypoxic/ischemic injury. Previous efforts to
image neonatal hypoxic/ischemic injury have centered onMR techniques. However, none of these have been dem-onstrated to be perfectly adequate. In this study, theauthors tested the ability of99mTc-labeled annexin V todetect cerebral expression of phosphatidyl serine in re-sponse to transient microcirculatory disturbances as de-fined by diffusion-weighted imaging and gadolinium–diethylenetriamine pentaacetic acid MR imaging duringthe induction of neonatal hypoxic/ischemic injury. Theauthors’ results are fascinating in that there was selective
D’Arceuil et al Annexin Imaging of Neonatal Hypoxic Brain Injury 2699
by guest on July 8, 2018http://stroke.ahajournals.org/
Dow
nloaded from
multifocal localization of radiolabeled annexin V in bothhemispheres of these neonatal rabbits subjected to globalhypoxic/ischemic injury. Abnormally increased annexin Vuptake occurred in brains that had fully recovered theirnormal energy state after reversal of global hypoxia. Theauthors indicate that these results suggest that the processof apoptosis may be triggered in tissues which haverecovered their normal energy state or which had nodetectable average diffusion coefficient changes duringhypoxia. These experiments suggest that99mTc-labeledannexin V imaging is useful to identify neonates sufferingfrom acute hypoxic/ischemic injury. This diagnostic tool
and, potentially, other diagnostic MR spectroscopy toolsmay lead to early administration of neuroprotective agents,if and when these neuroprotective agents are identified.The use of this technique in the future in children may leadto a better understanding of hypoxic/ischemic injury inthese children.
Richard J. Traystman, PhD, Guest EditorA/CCM Laboratories
Johns Hopkins University School of MedicineBaltimore, Maryland
2700 Stroke November 2000
by guest on July 8, 2018http://stroke.ahajournals.org/
Dow
nloaded from
Strauss, Tobias Engelhorn, Andreas Kastrup, Michael Moseley and Francis G. BlankenbergHelen D'Arceuil, William Rhine, Alex de Crespigny, Midori Yenari, John F. Tait, William H.
Tc Annexin V Imaging of Neonatal Hypoxic Brain Injury99m
Print ISSN: 0039-2499. Online ISSN: 1524-4628 Copyright © 2000 American Heart Association, Inc. All rights reserved.
is published by the American Heart Association, 7272 Greenville Avenue, Dallas, TX 75231Stroke doi: 10.1161/01.STR.31.11.2692
2000;31:2692-2700Stroke.
http://stroke.ahajournals.org/content/31/11/2692World Wide Web at:
The online version of this article, along with updated information and services, is located on the
http://stroke.ahajournals.org//subscriptions/
is online at: Stroke Information about subscribing to Subscriptions:
http://www.lww.com/reprints Information about reprints can be found online at: Reprints:
document. Permissions and Rights Question and Answer process is available in the
Request Permissions in the middle column of the Web page under Services. Further information about thisOnce the online version of the published article for which permission is being requested is located, click
can be obtained via RightsLink, a service of the Copyright Clearance Center, not the Editorial Office.Strokein Requests for permissions to reproduce figures, tables, or portions of articles originally publishedPermissions:
by guest on July 8, 2018http://stroke.ahajournals.org/
Dow
nloaded from