Embed Size (px)
Citation preview
ARTICLE IN PRESS
0097-8493/$ - se
doi:10.1016/j.ca
�CorrespondE-mail addr
Computers & Graphics 31 (2007) 350–360
www.elsevier.com/locate/cag
Visual Analytics
A 2D–3D visualization support for human-centered rule mining
Julien Blanchard�, Bruno Pinaud, Pascale Kuntz, Fabrice Guillet
KnOwledge & Decision Team (KOD), LINA–FRE CNRS 2729, Polytechnic School of Nantes University, France
Abstract
On account of the enormous amounts of rules that can be produced by data mining algorithms, knowledge post-processing is a
difficult stage in an association rule discovery process. In order to find relevant knowledge, the user needs to rummage through the rules.
To make this task easier, we propose a new interactive mining methodology based on well adapted dynamic visual representations. It
allows the user to drive the discovery process by focusing his/her attention on limited subsets of rules. We have implemented our
methodology with two complementary 2D and 3D visualization supports. These implementations exploit the user’s focus to guide the
generation of the rules by means of a specific constraint-based rule-mining algorithm.
r 2007 Elsevier Ltd. All rights reserved.
Keywords: Knowledge discovery in databases; Association rules; Interactive visualization; Interactive mining; Rule focusing
1. Introduction
Although during the first decade of knowledge discoveryin databases (KDD) most of the research works wereconcerned with the development of efficient automaticalgorithms able to deal with large amount of data, todaythe user’s role has become a major concern. This need forintegration has recently lead to the design of manyvisualization tools [1,2]. Traditional visualization techni-ques in KDD are used essentially in the stages whichprecede and follow the data mining automatic procedures.Upstream the process, they assist the selection and pre-processing tasks. Downstream, they help the users topresent the results intelligibly in order to make theirinterpretation easier. Besides, stemming from exploratorydata analysis [3,4], the so-called ‘‘visual data mining’’ hasbeen developed to highlight the intrinsic properties of dataand assist hypothesis generation [5]. The challenge is herethe development of representations of huge data sets welladapted to the human perception abilities [6].
The current ambition of the visualization tools is to gobeyond a technological assistance to the manipulation andinterpretation of data by explicitly considering the user as afull component of the discovery process; ‘‘The process of
e front matter r 2007 Elsevier Ltd. All rights reserved.
g.2007.01.026
ing author.
ess: [email protected] (J. Blanchard).
KDD: a human-centered approach’’ as Brachman andAnand [7] say. Let us note that this objective was stressedfrom the early 1990s in the seminal paper of Frawley et al.[8]: in the part dedicated to the future directions in KDD,they pointed out that the user has to be integrated in the‘‘discovery loop’’ in order to combine the human sub-jectivity and the machine processing capacities.In this paper, we focus on one of the most popular
challenges in KDD, the association rule discovery, and wepropose a new interactive mining environment based onvisual representations where the user acts as an explorationheuristics. Introduced in KDD in the early 1990s byAgrawal et al. [9] to simply express implicative tendenciesbetween conjunctions of items (binary attributes) in arelational database, the association rules have rapidlyknown an intensive use. An association rule of the formX ! Y means that most of the records which verify X inthe database generally verify Y too. For instance, in marketdata analysis, an association rule pizza; crisps! beer
means that if a customer buys a pizza and crisps then(s)he most probably buys beer too. Many automaticalgorithms have been proposed in the literature to extractthe potentially relevant association rules from largedatabases (e.g. [10] for a survey). However, it is now wellknown that in real-life situations they produce a prohibi-tive number of rules for a direct analysis in extenso. Thismay be explained by the unsupervised nature of the task. In
ARTICLE IN PRESSJ. Blanchard et al. / Computers & Graphics 31 (2007) 350–360 351
a rule-mining process, the user can neither a priori expresshis/her requests explicitly in the data terminology norspecify the endogenous variables. Thus, the automaticalgorithms compute all the valid associations existing in thedatabase, and consequently generate an amount of rulesexponentially growing with the number of items.
To overcome these difficulties, we propose to integrate asupervised phase by allowing the user to drive the discoveryprocess via a well adapted interactive interface. Previousworks in knowledge discovery [11] and decision aid [12]have shown how the users focus on successive restrictivesubsets of attributes to process information. From acognitive point of view, the suggested explanation is theintensive resort to the short-term working memory.Consequently, our methodology allows the user to explorelarge rule sets by iteratively exploiting the informationbrought by limited subsets. More precisely, the architectureof our interactive process is structured around threeconnected components which dynamically evolve with theuser’s requests:
1.
a database which contains the studied data andadditional tables too optimize the response times;2.
a heuristics which computes in the database the rulesubsets associated with the user’s requests—this heur-istics is a local version of the a priori algorithm [13];3.
an interactive visualization support which allows theuser to choose a subset of rules to be explored.In this paper we detail the interaction process and wepresent two complementary interfaces: a 2D interfacewhich represents the rules by a graph and a 3D interfacewhich represents the rules by objects in virtual worlds.Section 2 presents the cognitive constraints of the userduring the rule-mining process and describes the dynamicexploration methodology of the search space modeled hereas a graph. Section 3 details the two interactive visualiza-tion supports. In Section 4, we give an illustration of therule-mining process with the 3D visualization interface. InSection 5, we present related works, and finally discuss inSection 6 the complementarity between the 2D and 3Dinterfaces.
2. Dynamic exploration methodology
2.1. Cognitive hypotheses
On account of the human ‘‘bounded rationality’’hypothesis [14], a decision process can be seen as a searchfor a dominance structure. More precisely, the decision-maker faced with a set of multiattribute alternatives tries tofind an alternative (s)he considers dominant over theothers, i.e., an alternative (s)he thinks better thanthe others according to his/her current representation ofthe decision situation [15]. This type of models of decisionprocess can be transferred to the post-processing ofassociation rules by considering the rules as a particular
kind of alternatives with items and interestingness mea-sures as attributes. According to Montgomery, thedecision-maker isolates a limited subset of potentiallyuseful alternatives and makes comparisons among them.This can be done iteratively during the decision process.More precisely, he has pointed out that: ‘‘The decisionprocess acquires a certain directionality in the sense thatcertain alternatives and attributes will receive moreattention than others ½. . .�. The directionality of the processmay be determined more or less consciously. Shifts in thedirectionality may occur several times in the process,particularly when the decision-maker fails to find adominance structure’’.Furthermore, a KDD methodology called ‘‘attribute
focusing’’ has been proposed in [11]. It results fromexperimental data concerning the user’s behavior in thediscovery process. This methodology is based on a filterwhich automatically detects a small number of potentiallyinteresting attributes. The filter guides the user’s attentionon a small, and therefore more intelligible, subset of thedatabase. The importance of focusing on a small number ofattributes in human information processing has also beenwidely confirmed with works on decision strategies (cf. forexample the moving basis heuristics in Barthelemy andMullet [12]). Indeed, on account of his/her limited cognitiveabilities, the decision-maker examines only a small amountof information at each moment.Taking these different works into account, the dynamic
exploration methodology must enable the user to focus his/her attention on limited subsets of rules. Thanks to a visualrepresentation which evolves interactively according to his/her requests, the user can navigate among the rules andmake comparisons.
2.2. Dynamic exploration
2.2.1. The navigation space modeled as a graph
In our interactive exploration methodology, the searchspace is modeled as a graph. Among visualizationtechniques, graphs often have a privileged place, inparticular for rule relationship representation. They canbe used both as powerful theoretical models (combinatorialobjects) and as efficient representation tools that allowusers to access complex structures without getting lost ininformation [16].In the simplest graph representation of a set O of
association rules, the nodes are the antecedents andconsequence of the rules, and the edges symbolize theimplications [17]. Such a graph allows, without a key, tograsp the equivalence classes on O of the relations ‘‘havingthe same antecedent/consequent’’, and to generate apartition on O of the connex parts of the graph. On theother hand, except for transitivity when it exists, such agraph does not allow to deduce other relations easily. Thislimit has led to develop other graph-based models which inparticular enable deductive inferences in the form of paths[18,19].
ARTICLE IN PRESS
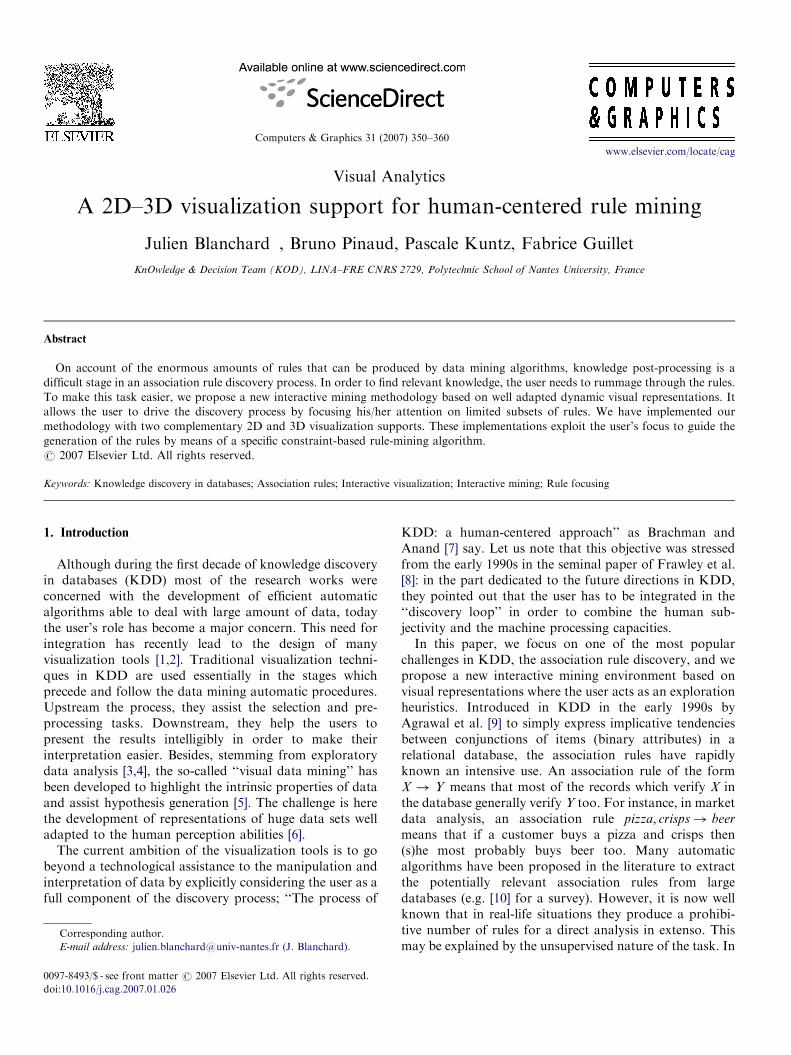
Fig. 1. A graph showing the rules a! b, a! c, a! e, a ^ b! c,
a ^ c! b, a ^ c! e, and a ^ e! c.
J. Blanchard et al. / Computers & Graphics 31 (2007) 350–360352
The model that we favor is similar to the one ofHorschka and Klosgen [18]. Let us note A ¼ fa1; a2; . . . ; apg
the set of items (binary attributes) of the database. Anassociation rule fai; ajg ! fakg, written ai ^ aj ! ak forsimplification, is modeled as an edge which begins at nodeai ^ aj (the antecedent of the rule) and finishes at nodeai ^ aj ^ ak (all the items of the rule). The relation attachedto the edges is the inclusive relation among the subsets ofitems. Thus, this graph is directed and acyclic (Fig. 1).Besides, this is a subgraph of the itemset lattice.
From a logical point of view, relying on the classicsupport-confidence framework for rule interestingnessassessment [9], this model allows to represent deductiveinferences in the form of paths in the graph. Let usconsider, for instance, the rules a! b and a ^ b! c,respectively, represented by the edges ða; a ^ bÞ and ða ^b; a ^ b ^ cÞ (Fig. 1). The confidence of the rule a! b ^ c
that would be represented by the edge ða; a ^ b ^ cÞ issimply the product of the confidences of the rules of thepath ða; a ^ b; a ^ b ^ cÞ.
2.2.2. Exploring the graph with neighborhood relations
Given an itemset1 g in the graph, the user can beinterested in two kinds of rules:
�
1
the more specific rules with g as antecedent,
�2Support is the proportion of records which verify a rule in the
database; it evaluates the generality of the rule. Confidence is the
the more general rules whose antecedent is strictlyincluded in g.
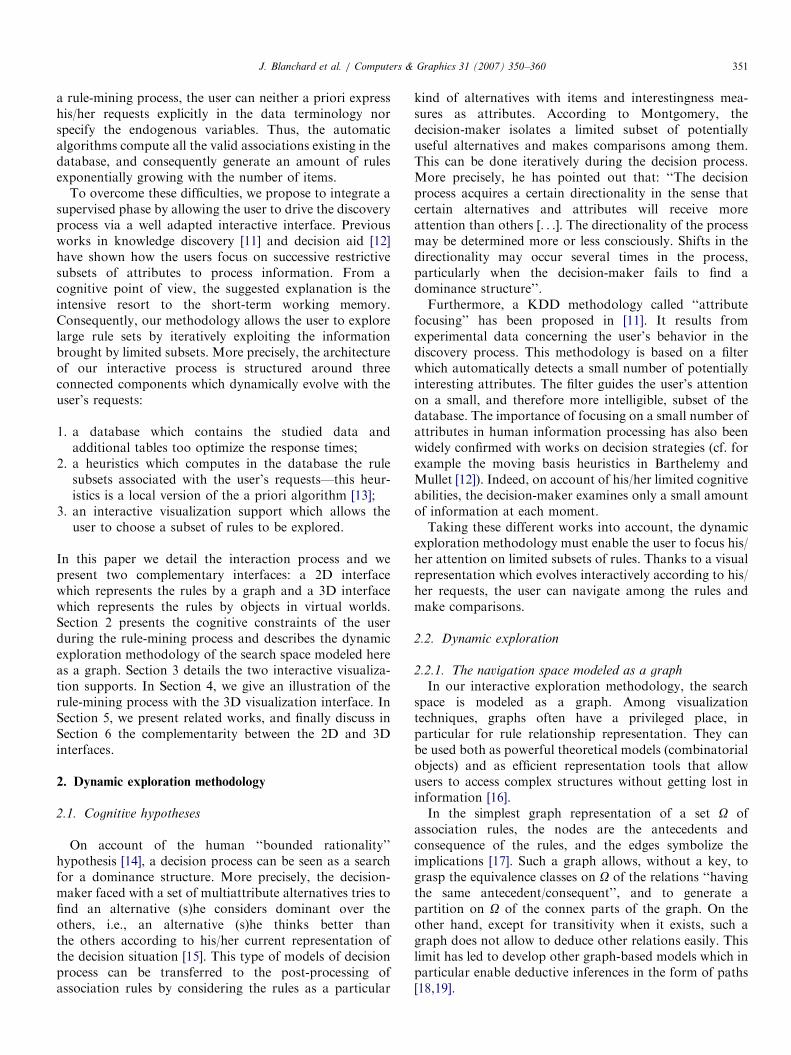
From one rule a! b, the user can therefore access foursubsets of rules:
Case 1: The more specific rules for a (cf. example inFig. 2(1)),
Case 2: The more specific rules for b (Fig. 2(2)),Case 3: The more general rules for a (Fig. 2(3)),Case 4: The more general rules for b (Fig. 2(4)).So the graph-based model induces four relations that
allow the user to navigate among the rules (i.e. accessing anew subset of rules from one selected rule). We call themneighborhood relations, since each of them define a notionof closeness between rules which makes sense for the user:
Case 1: The neighbors of a! b are all the rules with a asantecedent. This relation is named same_antecedent. It is anequivalence relation.
Case 2: The neighbors of a! b are all the rules witha ^ b as antecedent. This relation is named forward_chaining
An itemset is a conjunction of items.
since it is inspired by forward chaining in inference enginesfor expert systems: when the rule a! b is fired, the conceptb becomes active and can be used with a to fire new rulesand deduce new concepts. The relation is neither reflexive,nor symmetric, nor transitive.
Case 3: The neighbors of a! b are all the rules that canbe built with the items in a. This relation is namedantecedent_generalization and is complementary to for-
ward_chaining: after applying forward_chaining on a rule r,one can effectively come back to r by applying ante-
cedent_generalization. The relation is neither reflexive, norsymmetric, nor transitive.
Case 4: The neighbors of a! b are all the rules that canbe built with the items in a ^ b. This relation is namedsame_items since it allows to reorder the items in a rule. Allthe rules connected by the relation concern the samepopulation of records in the database. This relation is anequivalence relation.During the interactive exploration process, the user
navigates among the subsets of rules by using theneighborhood relations. Each time a relation is applied, aheuristics computes the rules wanted (the neighbors) whichare then displayed. Thus, the rule set is explored subset bysubset so that the user does not need to appropriate itentirely.
2.3. Additional filters
To allow the user to focus on potentially interestingknowledge, the rules are filtered with interestingnessmeasures thanks to thresholds set by the user (cf. [20] fora survey on interestingness measures). Only the good rules(with measures greater than the thresholds) are accessible,the others not being displayed. In our methodology, wemainly use the following measures:
�
pro
ver
the classic support and confidence2 [9],
� the implication intensity, an asymmetric probabilisticindex which evaluates the statistical significance of therules by quantifying the unlikelihood of the number ofcounter-examples [21,22].3. Interactive visualization supports
In this section we present two complementary interfaceswe have developed for rule exploration:
�
a 2D interface named Felix which represents the rules bya graph, � a 3D interface named ARVis which represents the rulesby objects in virtual worlds.portion of records which verify the consequent among those which
ify the antecedent; it evaluates the validity of the rule (success rate).
ARTICLE IN PRESS
Fig. 2. The four subsets of rules that can be accessed from a ^ b! c.
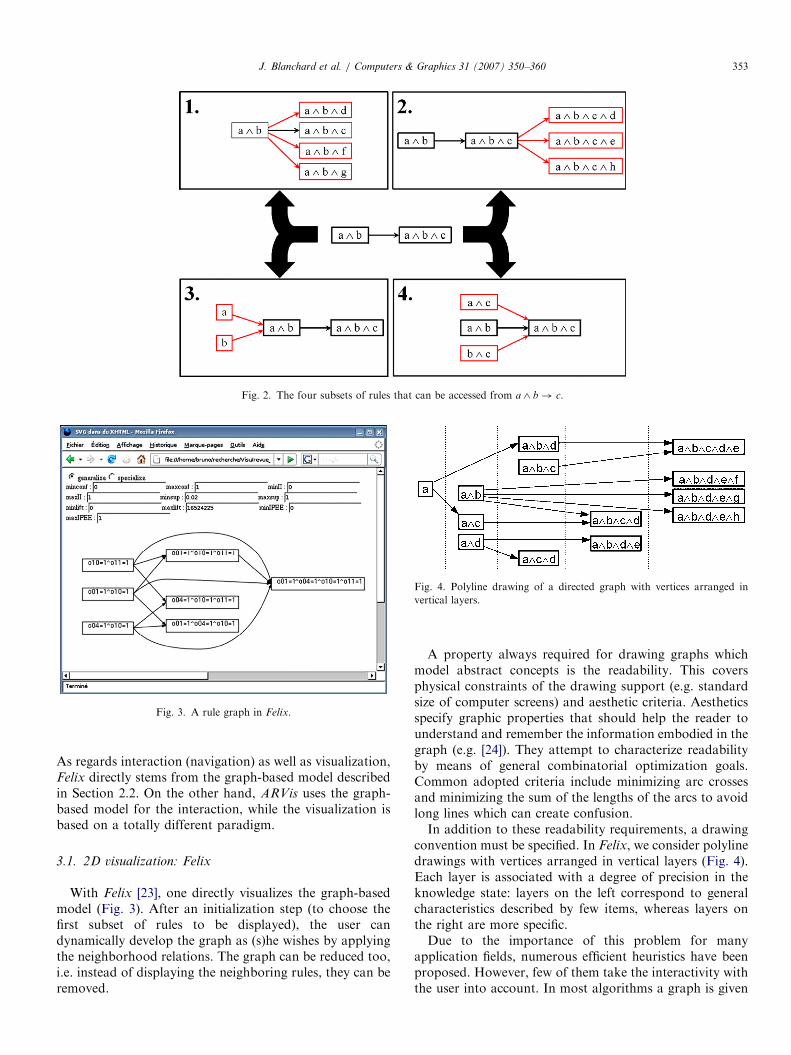
Fig. 4. Polyline drawing of a directed graph with vertices arranged in
vertical layers.
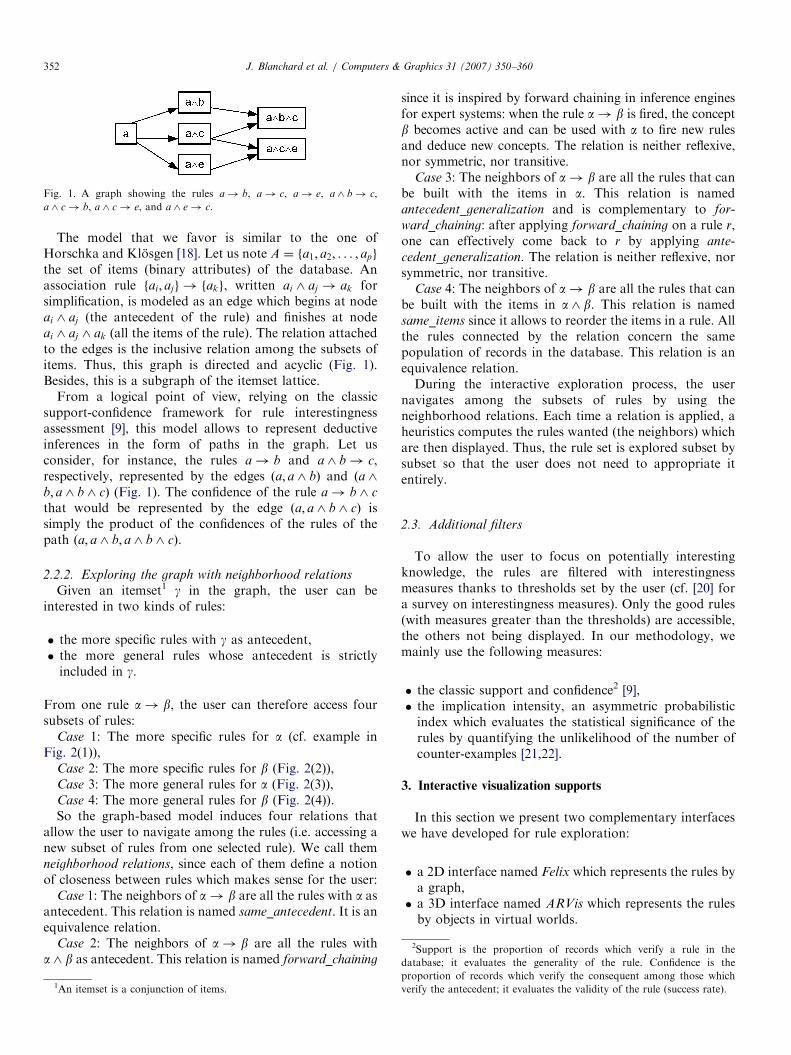
Fig. 3. A rule graph in Felix.
J. Blanchard et al. / Computers & Graphics 31 (2007) 350–360 353
As regards interaction (navigation) as well as visualization,Felix directly stems from the graph-based model describedin Section 2.2. On the other hand, ARVis uses the graph-based model for the interaction, while the visualization isbased on a totally different paradigm.
3.1. 2D visualization: Felix
With Felix [23], one directly visualizes the graph-basedmodel (Fig. 3). After an initialization step (to choose thefirst subset of rules to be displayed), the user candynamically develop the graph as (s)he wishes by applyingthe neighborhood relations. The graph can be reduced too,i.e. instead of displaying the neighboring rules, they can beremoved.
A property always required for drawing graphs whichmodel abstract concepts is the readability. This coversphysical constraints of the drawing support (e.g. standardsize of computer screens) and aesthetic criteria. Aestheticsspecify graphic properties that should help the reader tounderstand and remember the information embodied in thegraph (e.g. [24]). They attempt to characterize readabilityby means of general combinatorial optimization goals.Common adopted criteria include minimizing arc crossesand minimizing the sum of the lengths of the arcs to avoidlong lines which can create confusion.In addition to these readability requirements, a drawing
convention must be specified. In Felix, we consider polylinedrawings with vertices arranged in vertical layers (Fig. 4).Each layer is associated with a degree of precision in theknowledge state: layers on the left correspond to generalcharacteristics described by few items, whereas layers onthe right are more specific.Due to the importance of this problem for many
application fields, numerous efficient heuristics have beenproposed. However, few of them take the interactivity withthe user into account. In most algorithms a graph is given
ARTICLE IN PRESS
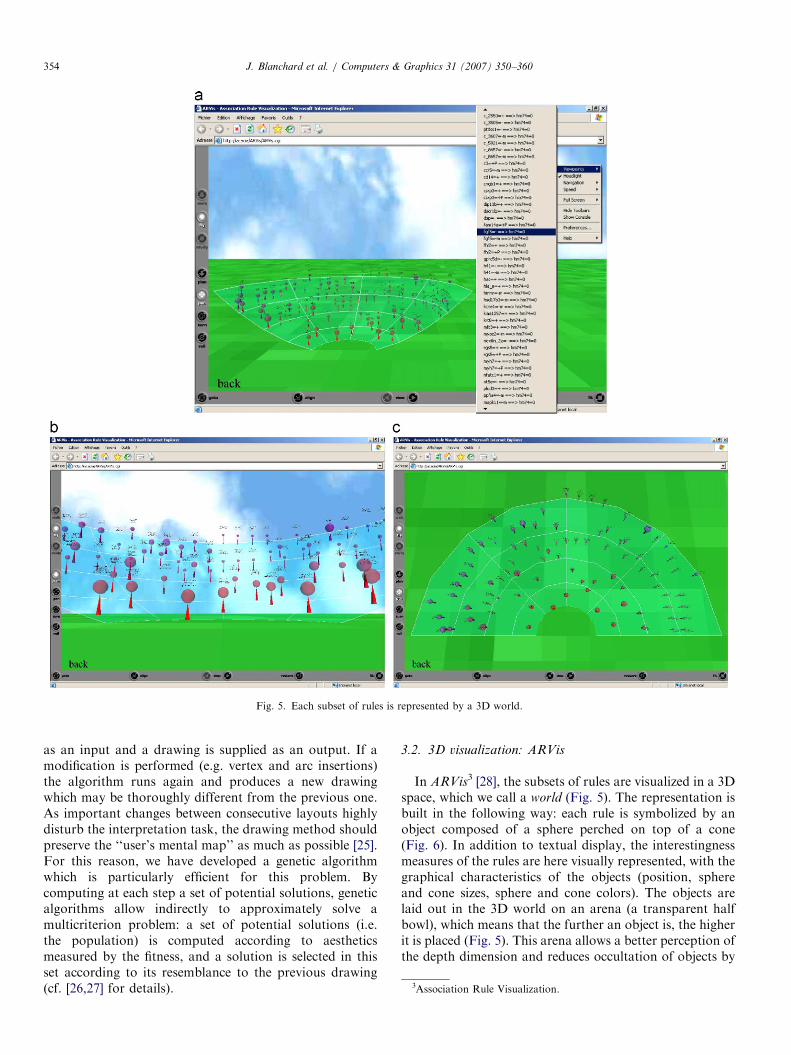
Fig. 5. Each subset of rules is represented by a 3D world.
3Association Rule Visualization.
J. Blanchard et al. / Computers & Graphics 31 (2007) 350–360354
as an input and a drawing is supplied as an output. If amodification is performed (e.g. vertex and arc insertions)the algorithm runs again and produces a new drawingwhich may be thoroughly different from the previous one.As important changes between consecutive layouts highlydisturb the interpretation task, the drawing method shouldpreserve the ‘‘user’s mental map’’ as much as possible [25].For this reason, we have developed a genetic algorithmwhich is particularly efficient for this problem. Bycomputing at each step a set of potential solutions, geneticalgorithms allow indirectly to approximately solve amulticriterion problem: a set of potential solutions (i.e.the population) is computed according to aestheticsmeasured by the fitness, and a solution is selected in thisset according to its resemblance to the previous drawing(cf. [26,27] for details).
3.2. 3D visualization: ARVis
In ARVis3 [28], the subsets of rules are visualized in a 3Dspace, which we call a world (Fig. 5). The representation isbuilt in the following way: each rule is symbolized by anobject composed of a sphere perched on top of a cone(Fig. 6). In addition to textual display, the interestingnessmeasures of the rules are here visually represented, with thegraphical characteristics of the objects (position, sphereand cone sizes, sphere and cone colors). The objects arelaid out in the 3D world on an arena (a transparent halfbowl), which means that the further an object is, the higherit is placed (Fig. 5). This arena allows a better perception ofthe depth dimension and reduces occultation of objects by
ARTICLE IN PRESS
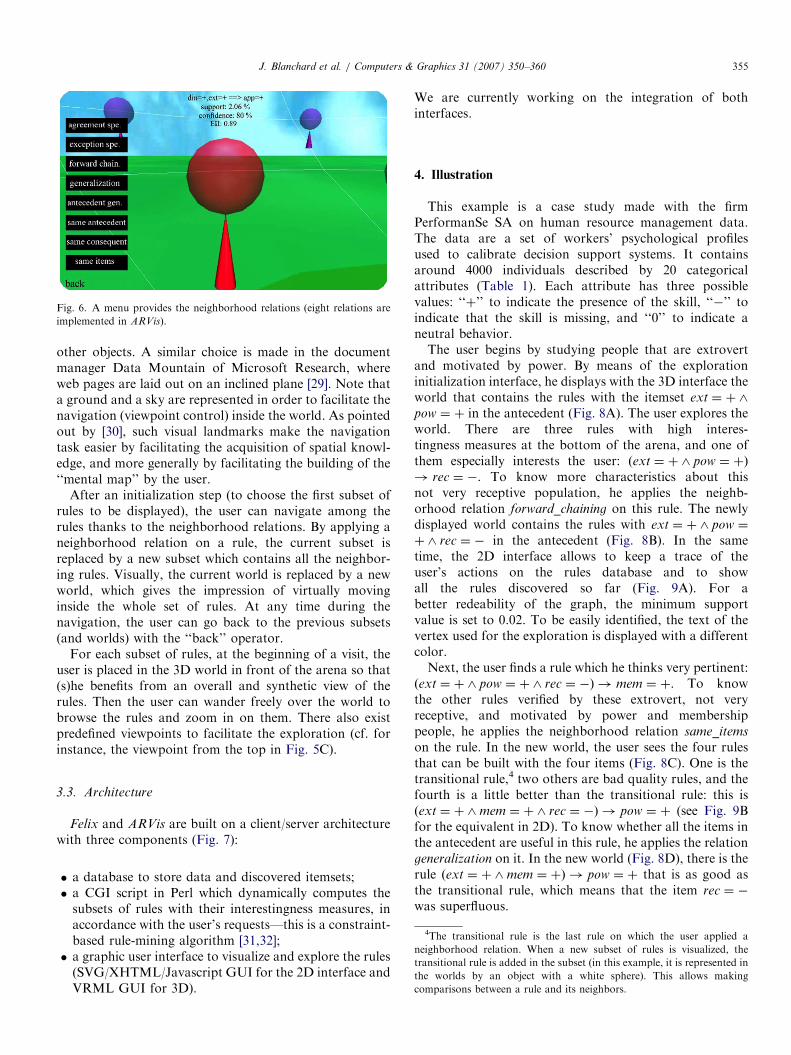
Fig. 6. A menu provides the neighborhood relations (eight relations are
implemented in ARVis).
J. Blanchard et al. / Computers & Graphics 31 (2007) 350–360 355
other objects. A similar choice is made in the documentmanager Data Mountain of Microsoft Research, whereweb pages are laid out on an inclined plane [29]. Note thata ground and a sky are represented in order to facilitate thenavigation (viewpoint control) inside the world. As pointedout by [30], such visual landmarks make the navigationtask easier by facilitating the acquisition of spatial knowl-edge, and more generally by facilitating the building of the‘‘mental map’’ by the user.
After an initialization step (to choose the first subset ofrules to be displayed), the user can navigate among therules thanks to the neighborhood relations. By applying aneighborhood relation on a rule, the current subset isreplaced by a new subset which contains all the neighbor-ing rules. Visually, the current world is replaced by a newworld, which gives the impression of virtually movinginside the whole set of rules. At any time during thenavigation, the user can go back to the previous subsets(and worlds) with the ‘‘back’’ operator.
For each subset of rules, at the beginning of a visit, theuser is placed in the 3D world in front of the arena so that(s)he benefits from an overall and synthetic view of therules. Then the user can wander freely over the world tobrowse the rules and zoom in on them. There also existpredefined viewpoints to facilitate the exploration (cf. forinstance, the viewpoint from the top in Fig. 5C).
3.3. Architecture
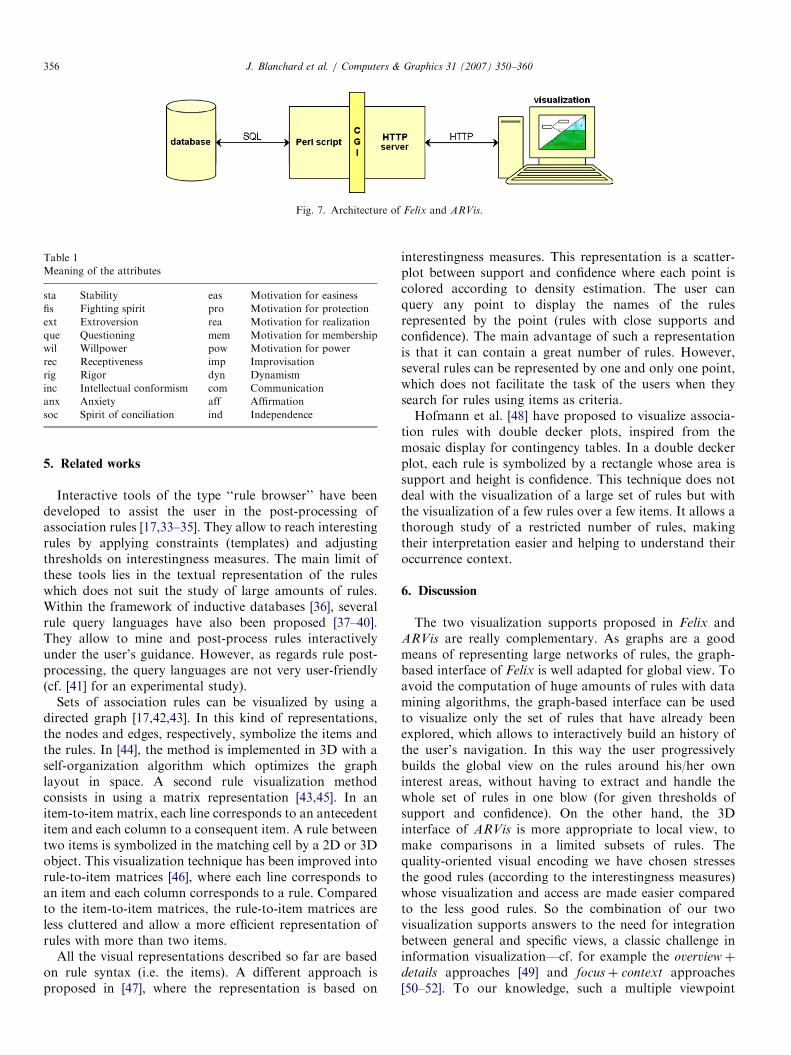
Felix and ARVis are built on a client/server architecturewith three components (Fig. 7):
�
a database to store data and discovered itemsets; �4The transitional rule is the last rule on which the user applied a
a CGI script in Perl which dynamically computes thesubsets of rules with their interestingness measures, inaccordance with the user’s requests—this is a constraint-based rule-mining algorithm [31,32];
neighborhood relation. When a new subset of rules is visualized, the
�transitional rule is added in the subset (in this example, it is represented in
the worlds by an object with a white sphere). This allows making
comparisons between a rule and its neighbors.
a graphic user interface to visualize and explore the rules(SVG/XHTML/Javascript GUI for the 2D interface andVRML GUI for 3D).
We are currently working on the integration of bothinterfaces.
4. Illustration
This example is a case study made with the firmPerformanSe SA on human resource management data.The data are a set of workers’ psychological profilesused to calibrate decision support systems. It containsaround 4000 individuals described by 20 categoricalattributes (Table 1). Each attribute has three possiblevalues: ‘‘þ’’ to indicate the presence of the skill, ‘‘�’’ toindicate that the skill is missing, and ‘‘0’’ to indicate aneutral behavior.The user begins by studying people that are extrovert
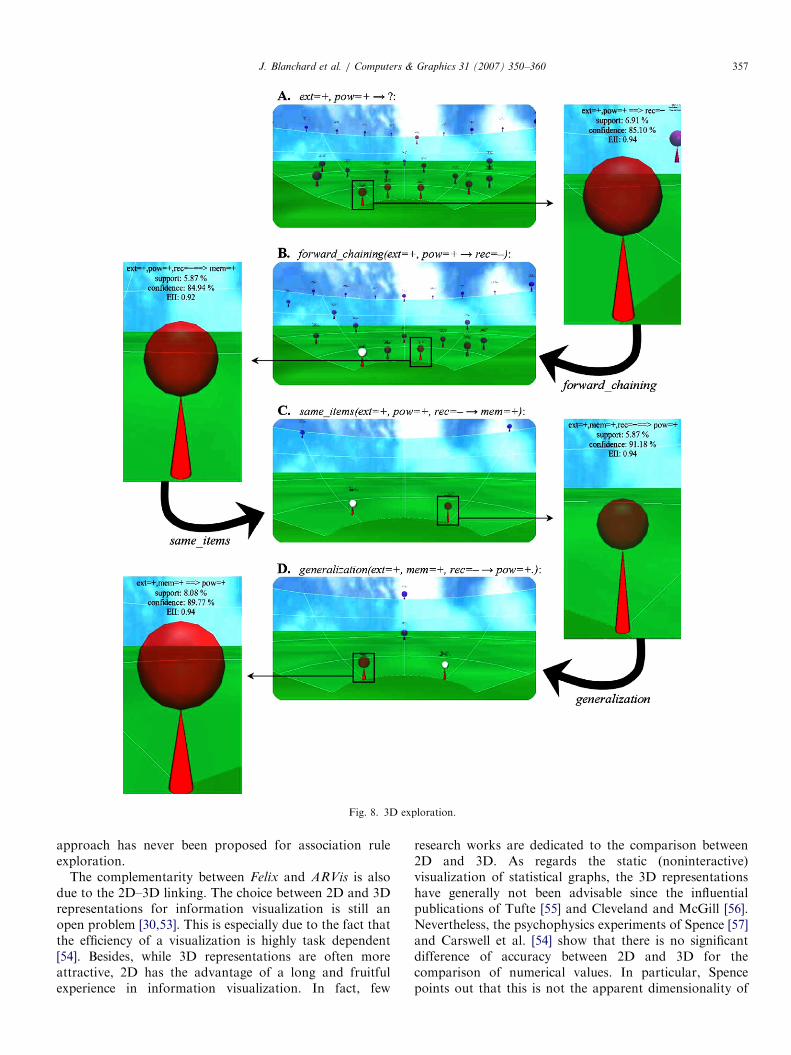
and motivated by power. By means of the explorationinitialization interface, he displays with the 3D interface theworld that contains the rules with the itemset ext ¼ þ^
pow ¼ þ in the antecedent (Fig. 8A). The user explores theworld. There are three rules with high interes-tingness measures at the bottom of the arena, and one ofthem especially interests the user: ðext ¼ þ^ pow ¼ þÞ
! rec ¼ �. To know more characteristics about thisnot very receptive population, he applies the neighb-orhood relation forward_chaining on this rule. The newlydisplayed world contains the rules with ext ¼ þ^ pow ¼
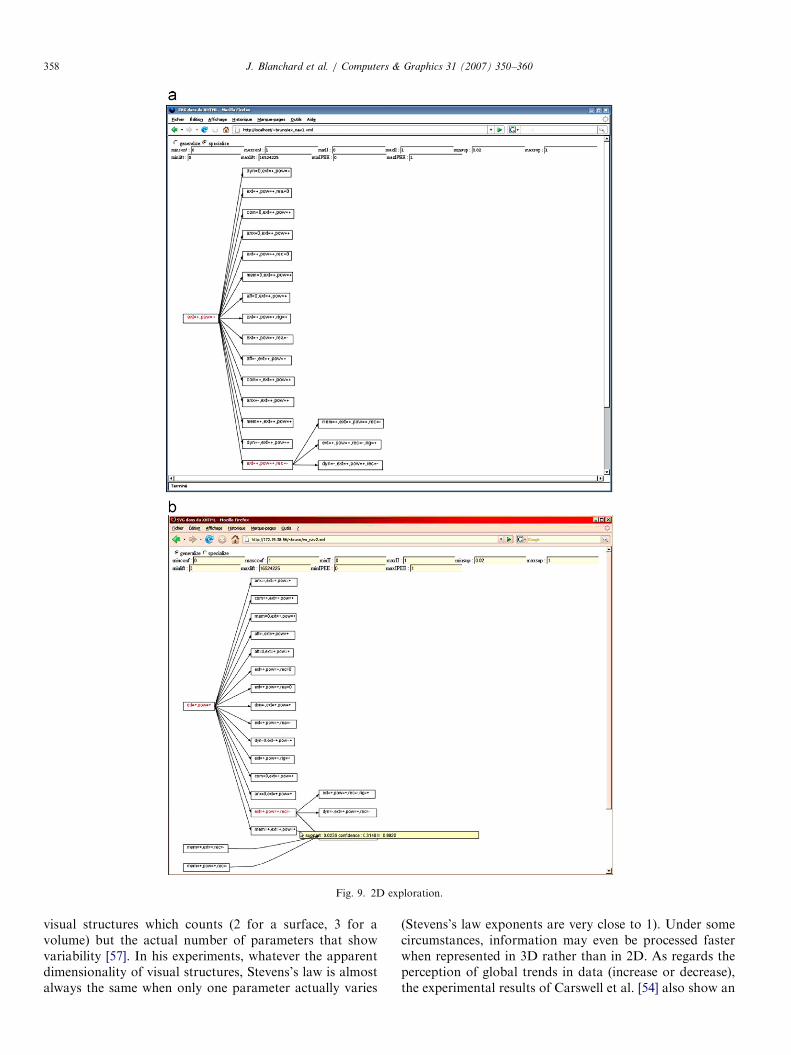
þ^ rec ¼ � in the antecedent (Fig. 8B). In the sametime, the 2D interface allows to keep a trace of theuser’s actions on the rules database and to showall the rules discovered so far (Fig. 9A). For abetter redeability of the graph, the minimum supportvalue is set to 0.02. To be easily identified, the text of thevertex used for the exploration is displayed with a differentcolor.Next, the user finds a rule which he thinks very pertinent:ðext ¼ þ ^ pow ¼ þ^ rec ¼ �Þ ! mem ¼ þ. To knowthe other rules verified by these extrovert, not veryreceptive, and motivated by power and membershippeople, he applies the neighborhood relation same_items
on the rule. In the new world, the user sees the four rulesthat can be built with the four items (Fig. 8C). One is thetransitional rule,4 two others are bad quality rules, and thefourth is a little better than the transitional rule: this isðext ¼ þ ^mem ¼ þ^ rec ¼ �Þ ! pow ¼ þ (see Fig. 9Bfor the equivalent in 2D). To know whether all the items inthe antecedent are useful in this rule, he applies the relationgeneralization on it. In the new world (Fig. 8D), there is therule ðext ¼ þ ^mem ¼ þÞ ! pow ¼ þ that is as good asthe transitional rule, which means that the item rec ¼ �
was superfluous.
ARTICLE IN PRESS
Fig. 7. Architecture of Felix and ARVis.
Table 1
Meaning of the attributes
sta Stability eas Motivation for easiness
fis Fighting spirit pro Motivation for protection
ext Extroversion rea Motivation for realization
que Questioning mem Motivation for membership
wil Willpower pow Motivation for power
rec Receptiveness imp Improvisation
rig Rigor dyn Dynamism
inc Intellectual conformism com Communication
anx Anxiety aff Affirmation
soc Spirit of conciliation ind Independence
J. Blanchard et al. / Computers & Graphics 31 (2007) 350–360356
5. Related works
Interactive tools of the type ‘‘rule browser’’ have beendeveloped to assist the user in the post-processing ofassociation rules [17,33–35]. They allow to reach interestingrules by applying constraints (templates) and adjustingthresholds on interestingness measures. The main limit ofthese tools lies in the textual representation of the ruleswhich does not suit the study of large amounts of rules.Within the framework of inductive databases [36], severalrule query languages have also been proposed [37–40].They allow to mine and post-process rules interactivelyunder the user’s guidance. However, as regards rule post-processing, the query languages are not very user-friendly(cf. [41] for an experimental study).
Sets of association rules can be visualized by using adirected graph [17,42,43]. In this kind of representations,the nodes and edges, respectively, symbolize the items andthe rules. In [44], the method is implemented in 3D with aself-organization algorithm which optimizes the graphlayout in space. A second rule visualization methodconsists in using a matrix representation [43,45]. In anitem-to-item matrix, each line corresponds to an antecedentitem and each column to a consequent item. A rule betweentwo items is symbolized in the matching cell by a 2D or 3Dobject. This visualization technique has been improved intorule-to-item matrices [46], where each line corresponds toan item and each column corresponds to a rule. Comparedto the item-to-item matrices, the rule-to-item matrices areless cluttered and allow a more efficient representation ofrules with more than two items.
All the visual representations described so far are basedon rule syntax (i.e. the items). A different approach isproposed in [47], where the representation is based on
interestingness measures. This representation is a scatter-plot between support and confidence where each point iscolored according to density estimation. The user canquery any point to display the names of the rulesrepresented by the point (rules with close supports andconfidence). The main advantage of such a representationis that it can contain a great number of rules. However,several rules can be represented by one and only one point,which does not facilitate the task of the users when theysearch for rules using items as criteria.Hofmann et al. [48] have proposed to visualize associa-
tion rules with double decker plots, inspired from themosaic display for contingency tables. In a double deckerplot, each rule is symbolized by a rectangle whose area issupport and height is confidence. This technique does notdeal with the visualization of a large set of rules but withthe visualization of a few rules over a few items. It allows athorough study of a restricted number of rules, makingtheir interpretation easier and helping to understand theiroccurrence context.
6. Discussion
The two visualization supports proposed in Felix andARVis are really complementary. As graphs are a goodmeans of representing large networks of rules, the graph-based interface of Felix is well adapted for global view. Toavoid the computation of huge amounts of rules with datamining algorithms, the graph-based interface can be usedto visualize only the set of rules that have already beenexplored, which allows to interactively build an history ofthe user’s navigation. In this way the user progressivelybuilds the global view on the rules around his/her owninterest areas, without having to extract and handle thewhole set of rules in one blow (for given thresholds ofsupport and confidence). On the other hand, the 3Dinterface of ARVis is more appropriate to local view, tomake comparisons in a limited subsets of rules. Thequality-oriented visual encoding we have chosen stressesthe good rules (according to the interestingness measures)whose visualization and access are made easier comparedto the less good rules. So the combination of our twovisualization supports answers to the need for integrationbetween general and specific views, a classic challenge ininformation visualization—cf. for example the overviewþ
details approaches [49] and focusþ context approaches[50–52]. To our knowledge, such a multiple viewpoint
ARTICLE IN PRESS
Fig. 8. 3D exploration.
J. Blanchard et al. / Computers & Graphics 31 (2007) 350–360 357
approach has never been proposed for association ruleexploration.
The complementarity between Felix and ARVis is alsodue to the 2D–3D linking. The choice between 2D and 3Drepresentations for information visualization is still anopen problem [30,53]. This is especially due to the fact thatthe efficiency of a visualization is highly task dependent[54]. Besides, while 3D representations are often moreattractive, 2D has the advantage of a long and fruitfulexperience in information visualization. In fact, few
research works are dedicated to the comparison between2D and 3D. As regards the static (noninteractive)visualization of statistical graphs, the 3D representationshave generally not been advisable since the influentialpublications of Tufte [55] and Cleveland and McGill [56].Nevertheless, the psychophysics experiments of Spence [57]and Carswell et al. [54] show that there is no significantdifference of accuracy between 2D and 3D for thecomparison of numerical values. In particular, Spencepoints out that this is not the apparent dimensionality of
ARTICLE IN PRESS
Fig. 9. 2D exploration.
J. Blanchard et al. / Computers & Graphics 31 (2007) 350–360358
visual structures which counts (2 for a surface, 3 for avolume) but the actual number of parameters that showvariability [57]. In his experiments, whatever the apparentdimensionality of visual structures, Stevens’s law is almostalways the same when only one parameter actually varies
(Stevens’s law exponents are very close to 1). Under somecircumstances, information may even be processed fasterwhen represented in 3D rather than in 2D. As regards theperception of global trends in data (increase or decrease),the experimental results of Carswell et al. [54] also show an
ARTICLE IN PRESSJ. Blanchard et al. / Computers & Graphics 31 (2007) 350–360 359
improvement in the answer times with 3D but to thedetriment of accuracy.
7. Conclusion
In this article we have presented a new interactive rule-mining methodology based on two kinds of visualrepresentations: a 2D interface which represents the rulesby a graph and a 3D interface which represents the rules byobjects in virtual worlds. Our methodology allows the userto drive the discovery process by focusing his/her attentionon limited subsets of rules. It relies on
1.
a database which contains the studied data andadditional tables too optimize the response times,2.
a heuristics which dynamically computes the rule subsetsassociated with the user’s requests,3.
an interactive visualization support which allows theuser to choose a subset of rules to be explored.The originality of our methodology in comparison withthe existing rule exploration techniques mainly lies in theconcept of neighborhood relations, predefined relationswhich enable the user to navigate among the rules. Witha query language or an interactive interface like a rulebrowser, the user can reach any subset of rules but (s)hemust explicitly specify the constraints which delimit it.With our approach, the constraint specification is implicitsince it is hidden in the neighborhood relations. Actually,the neighborhood relations can be seen as generalizationsof constraints (classes of constraints). We think that theuser’s task is made easier with neighborhood relations thanwith explicit constraints.
References
[1] Fayyad UM, Grinstein GG, Wierse A. Information visualization in
data mining and knowledge discovery. Los Altos, CA: Morgan
Kaufmann; 2001.
[2] Grinstein GG. Harnessing the human in knowledge discovery. In:
Proceedings of the second ACM SIGKDD international conference
on knowledge discovery and data mining. Menlo Park, CA: AAAI
Press; 1996. p. 384–5.
[3] Tukey JW. Exploratory data analysis. Reading, MA: Addison-
Wesley; 1977.
[4] Cleveland WS. The elements of graphing data. Hobart Press; 1985.
[5] Keim DA, Kriegel H-P. Visualization techniques for mining large
databases: a comparison. IEEE Transactions on Knowledge and
Data Engineering 1996;8(6):923–38.
[6] Spence R. Information visualization. Reading, MA: Addison-Wesley;
2000.
[7] Brachman JR, Anand T. The process of knowledge discovery in
databases: a human-centered approach. In: Fayyad UM, Piatetsky-
Shapiro G, Smyth P, Uthurusamy R, editors. Advances in knowledge
discovery and data mining. Menlo Park, CA, Cambridge, MA:
AAAI, MIT Press; 1996. p. 37–58.
[8] Frawley WJ, Piatetsky-Shapiro G, Matheus CJ. Knowledge dis-
covery in databases: an overview. In: Piatetsky-Shapiro G, Frawley
WJ, editors. Knowledge discovery in databases. Menlo Park, CA,
Cambridge, MA: AAAI, MIT Press; 1991. p. 1–30.
[9] Agrawal R, Imielinski T, Swami A. Mining association rules between
sets of items in large databases. In: Proceedings of the 1993 ACM
SIGMOD international conference on management of data. New
York: ACM Press; 1993. p. 207–16.
[10] Hipp J, Guntzer U, Nakhaeizadeh G. Algorithms for association rule
mining—a general survey and comparison. SIGKDD explorations,
vol. 2. New York: ACM Press, 2000. pp. 58–64.
[11] Bhandari I. Attribute focusing: machine-assisted knowledge discov-
ery applied to software production process control. Knowledge
Acquisition 1994;6(3):271–94.
[12] Barthelemy J-P, Mullet E. A model of selection by aspects. Acta
Psychologica 1992;79(1):1–19.
[13] Agrawal R, Srikant R. Fast algorithms for mining association rules.
In: Proceedings of the 20th international conference on very large
data bases (VLDB). Los Altos, CA: Morgan Kaufmann; 1994.
p. 487–99.
[14] Simon HA. Models of thought. Yale University Press; 1979.
[15] Montgomery H. Decision rules and the search for a dominance
structure: towards a process model of decision making. In:
Humphreys PC, Svenson O, Vari A, editors. Analysing and aiding
decision processes. Amsterdam: North-Holland; 1983. p. 343–69.
[16] Buntine W. Graphical models for discovering knowledge. In: Fayyad
UM, Piatetsky-Shapiro G, Smyth P, Uthurusamy R, editors.
Advances in knowledge discovery and data mining. Menlo Park,
CA, Cambridge, MA: AAAI, MIT Press; 1996. p. 59–82.
[17] Klemettinen M, Mannila H, Ronkainen P, Toivonen H, Verkamo
AI. Finding interesting rules from large sets of discovered association
rules. In: Proceedings of the third international conference on
information and knowledge management (CIKM). New York:
ACM Press; 1994. p. 401–7.
[18] Horschka P, Klosgen W. A support system for interpreting statistical
data. In: Piatetsky-Shapiro G, Frawley WJ, editors. Knowledge
discovery in databases. Menlo Park, CA, Cambridge, MA: AAAI,
MIT Press; 1991. p. 325–45.
[19] Lehn R. An interactive rule visualization system for knowledge
discovery in databases. Ph.D. thesis, University of Nantes; 2000.
[20] Hamilton H, Guillet F. Quality measures for data mining. In: Studies
in Computational intelligence, vol. 43. Berlin: Springer; 2007.
[21] Gras R. L’implication statistique: nouvelle methode exploratoire de
donnees. La Pensee Sauvage Editions, 1996 [in French].
[22] Blanchard J, Kuntz P, Guillet F, Gras R. Implication intensity: from
the basic statistical definition to the entropic version. In: Bozdogan
H, editor. Statistical data mining and knowledge discovery. London,
Boca Raton, FL: Chapman & Hall, CRC Press; 2003. p. 473–85.
[23] Kuntz P, Guillet F, Lehn R, Briand H. A user-driven process for
mining association rules. In: Proceedings of the fourth European
conference on principles of data mining and knowledge discovery
(PKDD-2000). Berlin: Springer; 2000. p. 483–9.
[24] Purchase H. Which aesthetic has the greatest effect on human
understanding? In: Proceedings of graph drawing’97, Lecture notes in
computer science, vol. 1353. Berlin: Springer; 1997. p. 248–61.
[25] Eades P, Lai W, Misue K, Sugiyama K. Preserving the mental map of
a diagram. In: Proceedings of compugraphics; 1991. p. 24–33.
[26] Kuntz P, Lehn R, Briand H. Dynamic rule graph drawing by genetic
search. In: Proceedings of the IEEE international conference on
system man and cybernetics. New York: IEEE Press; 2000. p. 45–58.
[27] Pinaud B, Kuntz P, Lehn R. Dynamic graph drawing with a
hybridized genetic algorithm. In: Proceedings of automatic comput-
ing in design and manufacture VI. Berlin: Springer; 2004. p. 365–75.
[28] Blanchard J, Guillet F, Briand H. A user-driven and quality-oriented
visualization for mining association rules. In: Proceedings of the third
IEEE international conference on data mining ICDM’03. Silver
Spring, MD: IEEE Computer Society; 2003. p. 493–6.
[29] Robertson G, Czerwinski M, Larson K, Robbins DC, Thiel D, van
Dantzich M. Data mountain: using spatial memory for document
management. In: UIST’98: Proceedings of the 11th annual ACM
symposium on user interface software and technology. New York:
ACM Press; 1998. p. 153–62.
ARTICLE IN PRESSJ. Blanchard et al. / Computers & Graphics 31 (2007) 350–360360
[30] Chen C. Information visualization: beyond the horizon. Berlin:
Springer; 2004.
[31] Ng RT, Lakshmanan LVS, Han J, Pang A. Exploratory mining and
pruning optimizations of constrained associations rules. In: Proceed-
ings of the 1998 ACM SIGMOD international conference on
management of data. New York: ACM Press; 1998. p. 13–24.
[32] Jeudy B, Boulicaut J-F. Optimization of association rule mining
queries. Intelligent Data Analysis 2002;6(4):341–57.
[33] Ma Y, Liu B, Wong CK. Web for data mining: organizing and
interpreting the discovered rules using the Web. SIGKDD explora-
tions, vol. 2(1). New York: ACM Press; 2000. p. 16–23.
[34] Tuzhilin A, Adomavicius G. Handling very large numbers of
association rules in the analysis of microarray data. In: KDD’02:
Proceedings of the eighth ACM SIGKDD international conference
on knowledge discovery and data mining. New York: ACM Press;
2002. p. 396–404.
[35] Fule P, Roddick JF. Experiences in building a tool for navigating
association rule result sets. In: Hogan J, Montague P, Purvis M,
Steketee C, editors. CRPIT’04: Proceedings of the second Australa-
sian workshop on data mining and web intelligence. Australian
Computer Society Inc.; 2004. p. 103–8.
[36] Imielinski T, Mannila H. A database perspective on knowledge
discovery. Communications of the ACM 1996;39(11):58–64.
[37] Han J, Fu Y, Wang W, Koperski K, Zaiane O. DMQL: a data
mining query language for relational databases. In: Proceedings of
the 1996 SIGMOD workshop on research issues on data mining and
knowledge discovery (DMKD); 1996.
[38] Meo R, Psaila G, Ceri S. An extension to SQL for mining association
rules. Data Mining and Knowledge Discovery 1998;2(2):195–224.
[39] Imielinski T, Virmani A. MSQL: a query language for database
mining. Data Mining and Knowledge Discovery 1999;3(4):373–408.
[40] Braga D, Campi A, Klemettinen M, Lanzi PL. Mining association
rules from XML data. In: Proceedings of the fourth international
conference on data warehousing and knowlege discovery (DaWaK
2002), Lecture notes in computer science, vol. 2454. Berlin: Springer;
2002. p. 21–30.
[41] Botta M, Boulicaut JF, Masson C, Meo R. A comparison between
query languages for the extraction of association rules. In: Proceed-
ings of the fourth international conference on data warehousing and
knowlege discovery (DaWaK 2002), Lecture notes in computer
science, vol. 2454. Berlin: Springer; 2002. p. 1–10.
[42] Rainsford CP, Roddick JF. Visualisation of temporal interval
association rules. In: Proceedings of the second international
conference on intelligent data engineering and automated learning
(IDEAL 2000). Berlin: Springer; 2000. p. 91–6.
[43] Han J, Chiang JY, Chee S, Chen J, Chen Q, Cheng S, et al. DBMiner:
a system for data mining in relational databases and data warehouses.
In: Proceedings of CASCON’97: meeting of minds; 1997. p. 249–60.
[44] Hao MC, Dayal U, Hsu M, Sprenger T, Gross MH. Visualization of
directed associations in e-commerce transaction data. In: Proceedings
of VisSym 2001; 2001. p. 185–92.
[45] Hofmann H, Wilhelm A. Visual comparison of association rules.
Computational Statistics 2001;16(3):399–415.
[46] Wong PC, Whitney P, Thomas J. Visualizing association rules for
text mining. In: Proceedings of the 1999 IEEE symposium on
information visualization. Silver Spring, MD: IEEE Computer
Society; 1999. p. 120–3.
[47] Unwin AR, Hofmann H, Bernt K. The TwoKey plot for multiple
association rules control. In: Proceedings of the fifth
European conference on principle and practice of knowledge
discovery in databases (PKDD’01). Berlin: Springer; 2001.
p. 472–83.
[48] Hofmann H, Siebes AP, Wilhelm AF. Visualizing association rules
with interactive mosaic plots. In: Proceedings of the sixth ACM
SIGKDD international conference on knowledge discovery and data
mining. New York: ACM Press; 2000. p. 227–35.
[49] Shneiderman B. The Eyes Have It: a task by data type taxonomy for
information visualization. In: Proceedings of the IEEE symposium on
visual languages VL’96. Silver Spring, MD: IEEE Computer Society;
1996. p. 336–43.
[50] Furnas GW. Generalized fisheye views. In: CHI’86: Proceedings of
the SIGCHI conference on human factors in computing systems.
New York: ACM Press; 1986. p. 16–23.
[51] Sarkar M, Brown MH. Graphical fisheye views of graphs. In:
CHI’92: Proceedings of the SIGCHI conference on human factors in
computing systems. New York: ACM Press; 1992. p. 83–91.
[52] Lamping J, Rao R, Pirolli P. A focusþ context technique based on
hyperbolic geometry for visualizing large hierarchies. In: CHI’95:
Proceedings of the SIGCHI conference on human factors in
computing systems. New York, Reading, MA: ACM Press,
Addison-Wesley Publishing Co; 1995. p. 401–8.
[53] Card SK, Mackinlay JD, Schneiderman B, editors. Readings in
information visualization: using vision to think. Los Altos, CA:
Morgan Kaufmann; 1999.
[54] Carswell CM, Frankenberger S, Bernhard D. Graphing in depth:
perspectives on the use of three-dimensional graphs to represent
lower-dimensional data. Behaviour & Information Technology
1991;10(6):459–74.
[55] Tufte E. The visual display of quantitative information. Graphics
Press; 1983.
[56] Cleveland WS, McGill R. Graphical perception: theory, experimen-
tation, and application to the development of graphical methods.
Journal of the American Statistical Association 1984;79(387):531–54.
[57] Spence I. Visual psychophysics of simple graphical elements. Journal
of Experimental Psychology: Human Perception and Performance
1990;16(4):683–92.