Embed Size (px)
Citation preview
A 3D-printed miniature gas cell for photoacoustic spectroscopy of trace gases
Ralf Bauer,1,* George Stewart,1 Walter Johnstone,1 Euan Boyd,2 and Michael Lengden1
1Centre for Microsystems & Photonics, Department of Electronic & Electrical Engineering, University of Strathclyde, 204 George Street, Glasgow, G1 1XW, U.K.
2Wolfson Microelectronics, Westfield House, 26 Westfield Road, Edinburgh, EH11 2QB, UK *Corresponding author: [email protected]
Received Month X, XXXX; revised Month X, XXXX; accepted Month X, XXXX; posted Month X, XXXX (Doc. ID XXXXX); published Month X, XXXX
A new methodology for the development of miniature photoacoustic trace gas sensors using 3D printing is presented. A near-infrared distributed feedback (DFB) laser is used together with a polymer based gas cell, off the shelf fiber optic collimators and a microelectromechanical system (MEMS) microphone to measure acetylene at 1532.83nm. The resonance behavior of the miniature gas cell is analyzed using a theoretical and experimental approach, with a measured resonance frequency of 15.25kHz and a Q-factor of 15. A minimum normalized noise equivalent absorption of 4.5·10-9Wcm-1Hz-1/2 is shown together with a 3σ detection limit of 750 parts per billion (ppb) for signal averaging times of 35seconds. The fiber coupled delivery and miniature cost-effective cell design allows for use in multi-point and remote detection applications. © 2014 Optical Society of America
OCIS Codes: (120.0280) Remote sensing and sensors; (120.6200) Spectrometers and spectroscopic instrumentation; (280.4788) Optical sensing and sensors; (300.6430) Spectroscopy, photothermal. http://dx.doi.org/10.1364/OL.99.099999
Photoacoustic spectroscopy (PAS) has been continually developed as a measurement tool for trace gas detection since its discovery by Bell in 1880 [1]. The technique can be used in a number of fields, including environmental pollution monitoring [2], industrial process control [3], diagnostic applications in medicine and biology [4] and gas leak detection [5]. Considering a direct comparison to standard tunable diode laser spectroscopy, the advantages of PAS include the considerable reduction of the background signal, due to acoustic detection of only the laser-gas interaction, the reduced sensor dimensions and their simplicity [6], and the ability to use high optical powers [7], leading to demonstrated minimum detection limits in the part per trillion (ppt) range [8, 9]. The use of a resonant gas cell creates an additional increase of the signal strength, with a multitude of cell designs investigated so far [7, 10–13]. Typically, increased complex designs are based on acoustic resonance evaluations using numerical finite element methods (FEM), as no closed form analytic expressions are available for these.
In recent years, miniaturization efforts for PAS sensors have been presented in three main categories: the use of miniature quartz tuning forks as acoustic sensors, known as quartz-enhanced PAS (QEPAS) [8-9, 14], the use of fiber tip sensors [15–17] and the use of miniaturized resonant gas cells based on scaling of standard cell designs [5, 18–20]. The use of miniaturized standard cells with medium or low cell Q-factors allows for less stringent control requirements of the overlap between cell resonances and sensing element resonances, while having the general advantage of increased signals due to reduction of the resonator radius. Microelectromechanical systems (MEMS) scale sensors, based on microfabrication using bonded silicon wafer stacks [18–20] or miniature
milling [5], have been demonstrated recently with all approaches requiring coupling of the excitation laser through free space optics and gas cell windows.
To the best of our knowledge, we present for the first time the combination of a miniature 3D printed resonant gas cell with off the shelf fiber optic components and a MEMS microphone sensing element. This 3D printing technique allows for rapid prototyping of the gas cell structure with high accuracy (~ four hours per print run), leading to a low cost, mass producible, small scale system. The 3D printed PAS gas cell used in this work consists of a cylinder resonator, terminated with two cylinder buffer volumes. This design has been chosen due to the reduction of flow noise and acoustic noise, created through the gas inlet/outlet connected to the buffer volumes (see Fig. 1) [21]. A miniature MEMS microphone (Wolfson Microelectronics WM7131) is used as the acoustic sensor and connected via a small inlet to the longitudinal centre of the resonator. The dimensions of the central acoustic resonator were chosen to accommodate the incident laser beam, whose diameter is defined by the fiber coupled gradient index (GRIN) collimators (Photop KFCS-A-900T-1550-N-100-C-NN). However, further consideration had to be taken in order to place the microphone as close as possible to the resonator. The chosen resonator has a length of 10mm and a diameter of 1.8mm, equaling the clear aperture of the collimators.. The λ/4-buffer volumes have a diameter of 10.8mm, which is six times greater than the resonator, and include connections for the collimators and the gas inlet/outlet pipes. The collimators are housed flush to the end of the buffer volume in a 3mm diameter, 2.3mm long holder, which is designed to give a clear optical path through the resonator and avoid excessive acoustic noise through absorption of the laser on the resonator walls. The MEMS microphone is connected
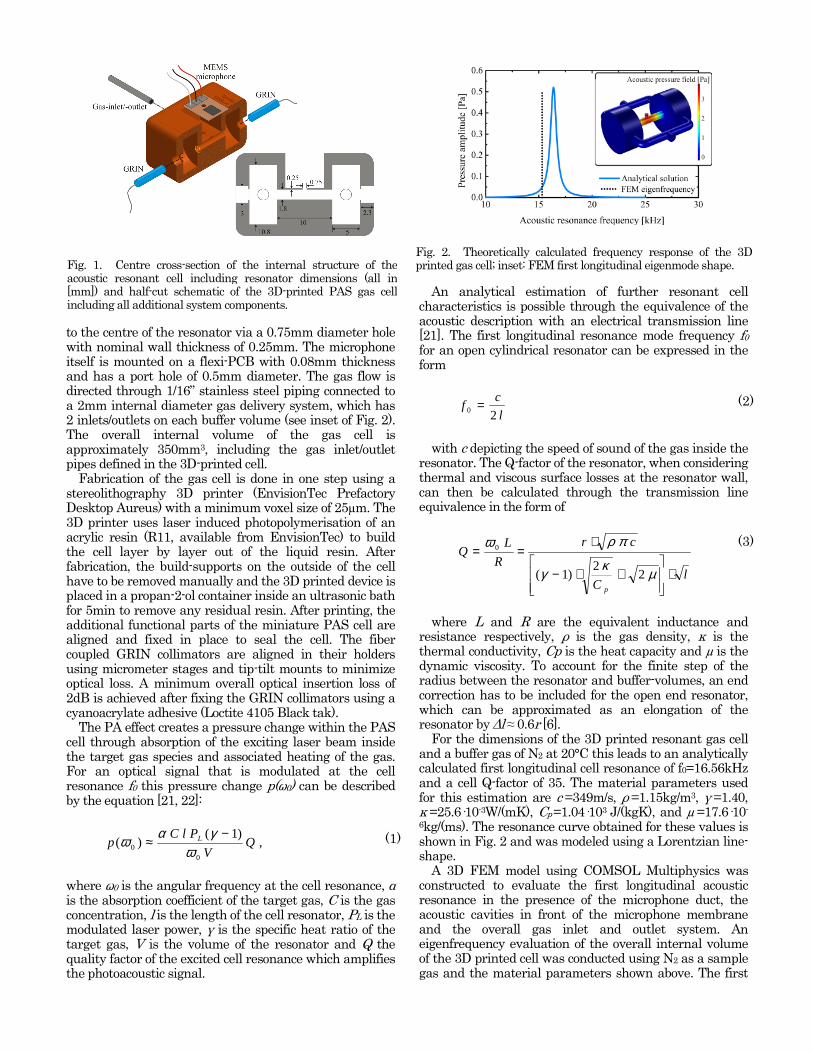
to the centre of the resonator via a 0.75mm diameter hole with nominal wall thickness of 0.25mm. The microphone itself is mounted on a flexi-PCB with 0.08mm thickness and has a port hole of 0.5mm diameter. The gas flow is directed through 1/16” stainless steel piping connected to a 2mm internal diameter gas delivery system, which has 2 inlets/outlets on each buffer volume (see inset of Fig. 2). The overall internal volume of the gas cell is approximately 350mm3, including the gas inlet/outlet pipes defined in the 3D-printed cell.
Fabrication of the gas cell is done in one step using a stereolithography 3D printer (EnvisionTec Prefactory Desktop Aureus) with a minimum voxel size of 25µm. The 3D printer uses laser induced photopolymerisation of an acrylic resin (R11, available from EnvisionTec) to build the cell layer by layer out of the liquid resin. After fabrication, the build-supports on the outside of the cell have to be removed manually and the 3D printed device is placed in a propan-2-ol container inside an ultrasonic bath for 5min to remove any residual resin. After printing, the additional functional parts of the miniature PAS cell are aligned and fixed in place to seal the cell. The fiber coupled GRIN collimators are aligned in their holders using micrometer stages and tip-tilt mounts to minimize optical loss. A minimum overall optical insertion loss of 2dB is achieved after fixing the GRIN collimators using a cyanoacrylate adhesive (Loctite 4105 Black tak).
The PA effect creates a pressure change within the PAS cell through absorption of the exciting laser beam inside the target gas species and associated heating of the gas. For an optical signal that is modulated at the cell resonance f0 this pressure change p(ω0) can be described by the equation [21, 22]:
,)1(
)(0
0 QV
PlCp L
ωγαω −
≈ (1)
where ω0 is the angular frequency at the cell resonance, α is the absorption coefficient of the target gas, C is the gas concentration, l is the length of the cell resonator, PL is the modulated laser power, γ is the specific heat ratio of the target gas, V is the volume of the resonator and Q the quality factor of the excited cell resonance which amplifies the photoacoustic signal.
An analytical estimation of further resonant cell characteristics is possible through the equivalence of the acoustic description with an electrical transmission line [21]. The first longitudinal resonance mode frequency f0 for an open cylindrical resonator can be expressed in the form
l
cf
20 = (2)
with c depicting the speed of sound of the gas inside the
resonator. The Q-factor of the resonator, when considering thermal and viscous surface losses at the resonator wall, can then be calculated through the transmission line equivalence in the form of
lC
cr
R
LQ
p
⋅
+⋅−
⋅==
µκγ
πρω
22
)1(
0 (3)
where L and R are the equivalent inductance and
resistance respectively, ρ is the gas density, κ is the thermal conductivity, Cp is the heat capacity and µ is the dynamic viscosity. To account for the finite step of the radius between the resonator and buffer-volumes, an end correction has to be included for the open end resonator, which can be approximated as an elongation of the resonator by ∆l ≈ 0.6r [6].
For the dimensions of the 3D printed resonant gas cell and a buffer gas of N2 at 20°C this leads to an analytically calculated first longitudinal cell resonance of f0=16.56kHz and a cell Q-factor of 35. The material parameters used for this estimation are c =349m/s, ρ =1.15kg/m3, γ =1.40, κ =25.6�10-3W/(mK), Cp =1.04�103 J/(kgK), and µ =17.6�10-
6kg/(ms). The resonance curve obtained for these values is shown in Fig. 2 and was modeled using a Lorentzian line-shape.
A 3D FEM model using COMSOL Multiphysics was constructed to evaluate the first longitudinal acoustic resonance in the presence of the microphone duct, the acoustic cavities in front of the microphone membrane and the overall gas inlet and outlet system. An eigenfrequency evaluation of the overall internal volume of the 3D printed cell was conducted using N2 as a sample gas and the material parameters shown above. The first
Fig. 1. Centre cross-section of the internal structure of the acoustic resonant cell including resonator dimensions (all in [mm]) and half-cut schematic of the 3D-printed PAS gas cell including all additional system components.
Fig. 2. Theoretically calculated frequency response of the 3D printed gas cell; inset: FEM first longitudinal eigenmode shape.
longitudinal resonance of the cell was found at 15.31kHz showing a maximum acoustic pressure variation at the microphone (see Fig. 2). This simulated first longitudinal resonance frequency is within the order of 0.5% of the experimentally measured cell resonance of 15.25kHz determined below, and is therefore thought to be in good agreement. Variations between the simulated and measured eigenfrequency can be attributed to minimal tolerances during the cell assembly as well as non-consideration of the sidewall roughness of the 3D printed resonator.
The measurement setup for testing the 3D printed PAS gas sensor is shown in Fig. 3. A near infrared, fiber coupled, distributed feedback (DFB) semiconductor diode laser (Anritsu AB5A234P1) with an emission wavelength around 1532nm and an average output power of 22mW is used as the PA excitation source. The laser temperature is kept constant using a Thorlabs TED200 temperature controller, with the laser current being controlled using a Thorlabs LDC202 laser diode driver (LDC). An Agilent 33250A signal generator is used to create a 5Hz current ramp with 40mA amplitude from the LDC, resulting in a laser wavelength scan of 300pm. To generate the higher frequency laser modulation, a second Agilent 33250A signal generator with a sinusoidal modulation of frequency f is used in combination with an electrical bias-T circuit. The generated PA signals are detected using the microphone, whose signal is filtered and demodulated using a Stanford Research SR830 lock-in amplifier (LIA). The LIA output signal is visualized using an Agilent DSO5014A Oscilloscope and recorded using a custom LabView program.
Acetylene (C2H2) was chosen as the sample gas, using calibrated gas concentrations of 1% and 100ppm. The interrogated gas line is centered at 1532.83nm (6523.879cm-1) with a half width half maximum (HWHM) of 18.7pm at atmospheric pressure and room temperature, and a normalized absorption coefficient of 0.4415cm-1.
To experimentally characterize the gas cell resonance behavior a gas concentration of 1% C2H2 was used with a constant flow rate of 50ml/min through the 3D printed cell. A laser modulation index (defined as ratio of the modulation frequency shift δν to the HWHM γ of the target absorption line, m = δν/γ) of m =1 was chosen. Modulation frequencies ranging between 10kHz and 30kHz were applied in 50Hz steps, and the resulting 1f signals were to be demodulated using the LIA. In order to remove any signal distortion caused by residual amplitude modulation (RAM), the phase angle φ of the
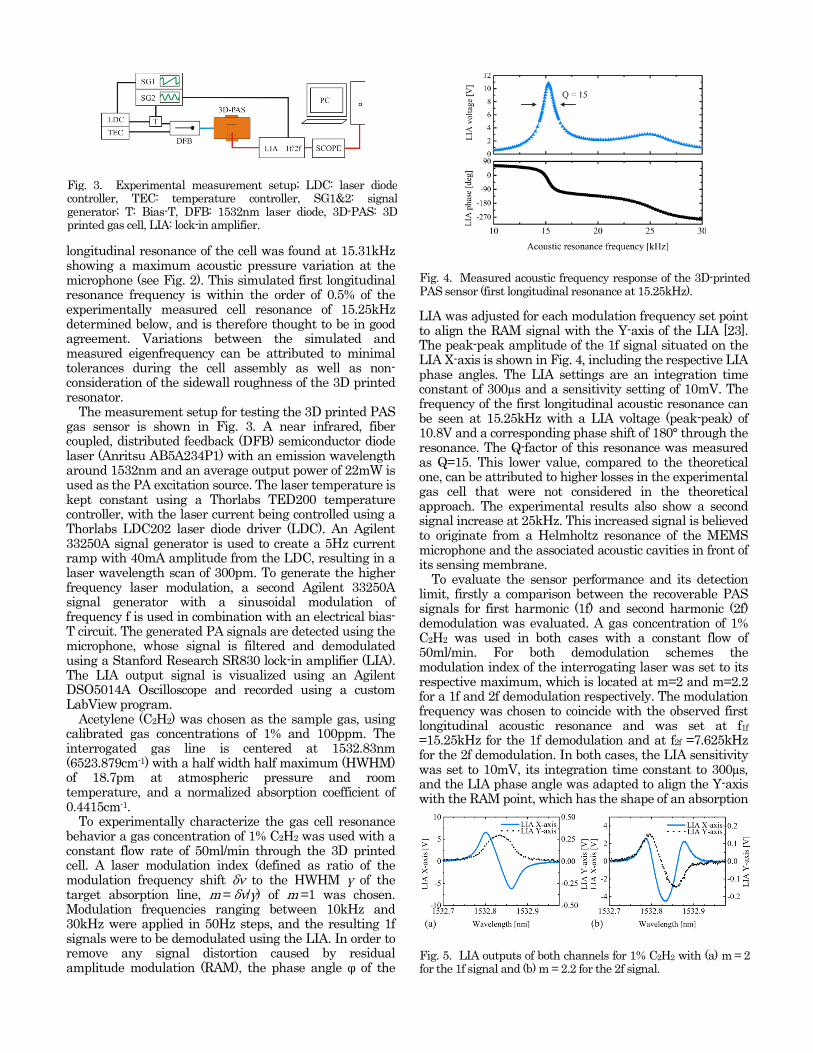
LIA was adjusted for each modulation frequency set point to align the RAM signal with the Y-axis of the LIA [23]. The peak-peak amplitude of the 1f signal situated on the LIA X-axis is shown in Fig. 4, including the respective LIA phase angles. The LIA settings are an integration time constant of 300µs and a sensitivity setting of 10mV. The frequency of the first longitudinal acoustic resonance can be seen at 15.25kHz with a LIA voltage (peak-peak) of 10.8V and a corresponding phase shift of 180° through the resonance. The Q-factor of this resonance was measured as Q=15. This lower value, compared to the theoretical one, can be attributed to higher losses in the experimental gas cell that were not considered in the theoretical approach. The experimental results also show a second signal increase at 25kHz. This increased signal is believed to originate from a Helmholtz resonance of the MEMS microphone and the associated acoustic cavities in front of its sensing membrane.
To evaluate the sensor performance and its detection limit, firstly a comparison between the recoverable PAS signals for first harmonic (1f) and second harmonic (2f) demodulation was evaluated. A gas concentration of 1% C2H2 was used in both cases with a constant flow of 50ml/min. For both demodulation schemes the modulation index of the interrogating laser was set to its respective maximum, which is located at m=2 and m=2.2 for a 1f and 2f demodulation respectively. The modulation frequency was chosen to coincide with the observed first longitudinal acoustic resonance and was set at f1f =15.25kHz for the 1f demodulation and at f2f =7.625kHz for the 2f demodulation. In both cases, the LIA sensitivity was set to 10mV, its integration time constant to 300µs, and the LIA phase angle was adapted to align the Y-axis with the RAM point, which has the shape of an absorption
Fig. 3. Experimental measurement setup; LDC: laser diode controller, TEC: temperature controller, SG1&2: signal generator; T: Bias-T, DFB: 1532nm laser diode, 3D-PAS: 3D printed gas cell, LIA: lock-in amplifier.
Fig. 4. Measured acoustic frequency response of the 3D-printed PAS sensor (first longitudinal resonance at 15.25kHz).
Fig. 5. LIA outputs of both channels for 1% C2H2 with (a) m = 2 for the 1f signal and (b) m = 2.2 for the 2f signal.
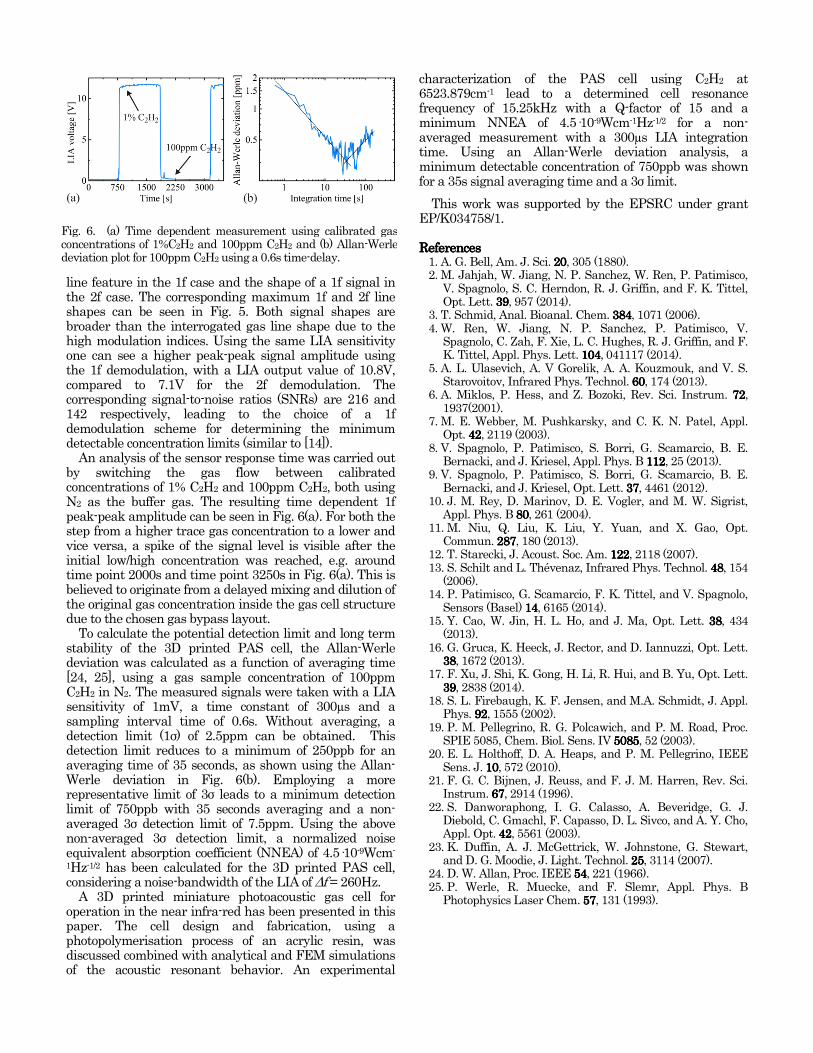
line feature in the 1f case and the shape of a 1f signal in the 2f case. The corresponding maximum 1f and 2f line shapes can be seen in Fig. 5. Both signal shapes are broader than the interrogated gas line shape due to the high modulation indices. Using the same LIA sensitivity one can see a higher peak-peak signal amplitude using the 1f demodulation, with a LIA output value of 10.8V, compared to 7.1V for the 2f demodulation. The corresponding signal-to-noise ratios (SNRs) are 216 and 142 respectively, leading to the choice of a 1f demodulation scheme for determining the minimum detectable concentration limits (similar to [14]).
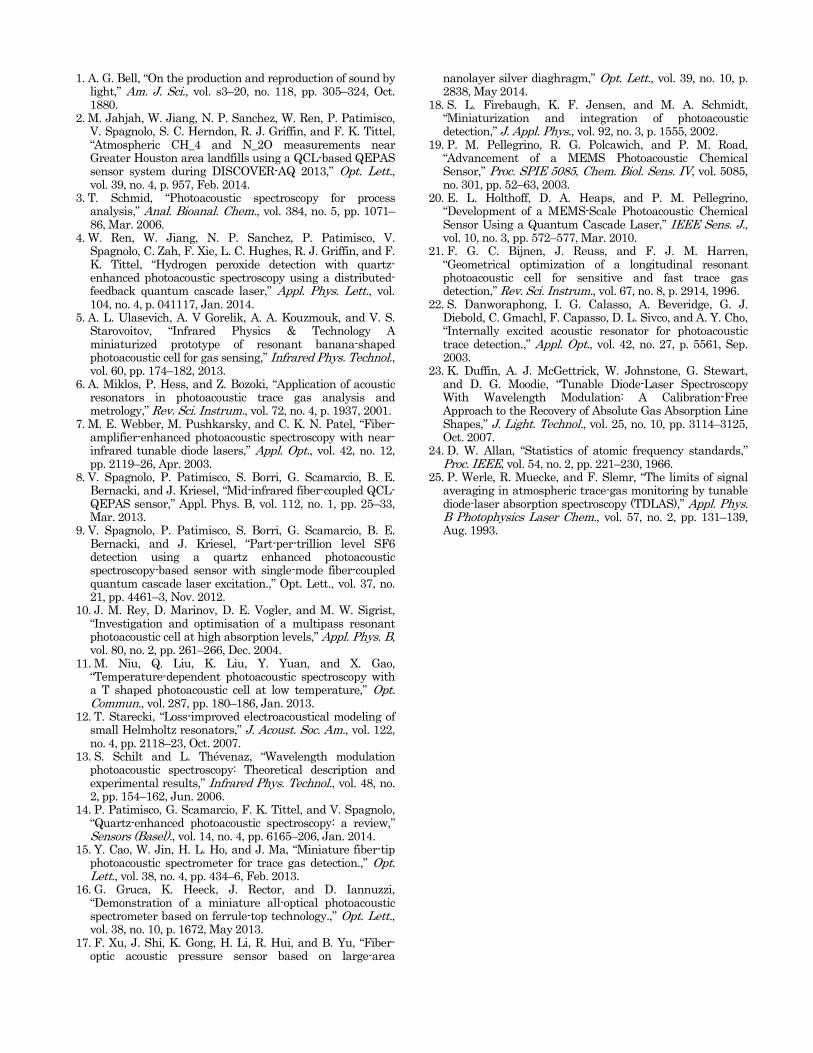
An analysis of the sensor response time was carried out by switching the gas flow between calibrated concentrations of 1% C2H2 and 100ppm C2H2, both using N2 as the buffer gas. The resulting time dependent 1f peak-peak amplitude can be seen in Fig. 6(a). For both the step from a higher trace gas concentration to a lower and vice versa, a spike of the signal level is visible after the initial low/high concentration was reached, e.g. around time point 2000s and time point 3250s in Fig. 6(a). This is believed to originate from a delayed mixing and dilution of the original gas concentration inside the gas cell structure due to the chosen gas bypass layout.
To calculate the potential detection limit and long term stability of the 3D printed PAS cell, the Allan-Werle deviation was calculated as a function of averaging time [24, 25], using a gas sample concentration of 100ppm C2H2 in N2. The measured signals were taken with a LIA sensitivity of 1mV, a time constant of 300µs and a sampling interval time of 0.6s. Without averaging, a detection limit (1σ) of 2.5ppm can be obtained. This detection limit reduces to a minimum of 250ppb for an averaging time of 35 seconds, as shown using the Allan-Werle deviation in Fig. 6(b). Employing a more representative limit of 3σ leads to a minimum detection limit of 750ppb with 35 seconds averaging and a non-averaged 3σ detection limit of 7.5ppm. Using the above non-averaged 3σ detection limit, a normalized noise equivalent absorption coefficient (NNEA) of 4.5�10-9Wcm-
1Hz-1/2 has been calculated for the 3D printed PAS cell, considering a noise-bandwidth of the LIA of ∆f = 260Hz.
A 3D printed miniature photoacoustic gas cell for operation in the near infra-red has been presented in this paper. The cell design and fabrication, using a photopolymerisation process of an acrylic resin, was discussed combined with analytical and FEM simulations of the acoustic resonant behavior. An experimental
characterization of the PAS cell using C2H2 at 6523.879cm-1 lead to a determined cell resonance frequency of 15.25kHz with a Q-factor of 15 and a minimum NNEA of 4.5�10-9Wcm-1Hz-1/2 for a non-averaged measurement with a 300µs LIA integration time. Using an Allan-Werle deviation analysis, a minimum detectable concentration of 750ppb was shown for a 35s signal averaging time and a 3σ limit.
This work was supported by the EPSRC under grant EP/K034758/1. ReferencesReferencesReferencesReferences
1. A. G. Bell, Am. J. Sci. 20202020, 305 (1880). 2. M. Jahjah, W. Jiang, N. P. Sanchez, W. Ren, P. Patimisco,
V. Spagnolo, S. C. Herndon, R. J. Griffin, and F. K. Tittel, Opt. Lett. 39393939, 957 (2014).
3. T. Schmid, Anal. Bioanal. Chem. 384384384384, 1071 (2006). 4. W. Ren, W. Jiang, N. P. Sanchez, P. Patimisco, V.
Spagnolo, C. Zah, F. Xie, L. C. Hughes, R. J. Griffin, and F. K. Tittel, Appl. Phys. Lett. 104104104104, 041117 (2014).
5. A. L. Ulasevich, A. V Gorelik, A. A. Kouzmouk, and V. S. Starovoitov, Infrared Phys. Technol. 60606060, 174 (2013).
6. A. Miklos, P. Hess, and Z. Bozoki, Rev. Sci. Instrum. 72727272, 1937(2001).
7. M. E. Webber, M. Pushkarsky, and C. K. N. Patel, Appl. Opt. 42424242, 2119 (2003).
8. V. Spagnolo, P. Patimisco, S. Borri, G. Scamarcio, B. E. Bernacki, and J. Kriesel, Appl. Phys. B 112112112112, 25 (2013).
9. V. Spagnolo, P. Patimisco, S. Borri, G. Scamarcio, B. E. Bernacki, and J. Kriesel, Opt. Lett. 37373737, 4461 (2012).
10. J. M. Rey, D. Marinov, D. E. Vogler, and M. W. Sigrist, Appl. Phys. B 80808080, 261 (2004).
11. M. Niu, Q. Liu, K. Liu, Y. Yuan, and X. Gao, Opt. Commun. 287287287287, 180 (2013).
12. T. Starecki, J. Acoust. Soc. Am. 122122122122, 2118 (2007). 13. S. Schilt and L. Thévenaz, Infrared Phys. Technol. 48484848, 154
(2006). 14. P. Patimisco, G. Scamarcio, F. K. Tittel, and V. Spagnolo,
Sensors (Basel) 14141414, 6165 (2014). 15. Y. Cao, W. Jin, H. L. Ho, and J. Ma, Opt. Lett. 38383838, 434
(2013). 16. G. Gruca, K. Heeck, J. Rector, and D. Iannuzzi, Opt. Lett.
38383838, 1672 (2013). 17. F. Xu, J. Shi, K. Gong, H. Li, R. Hui, and B. Yu, Opt. Lett.
39393939, 2838 (2014). 18. S. L. Firebaugh, K. F. Jensen, and M.A. Schmidt, J. Appl.
Phys. 92929292, 1555 (2002). 19. P. M. Pellegrino, R. G. Polcawich, and P. M. Road, Proc.
SPIE 5085, Chem. Biol. Sens. IV 5085508550855085, 52 (2003). 20. E. L. Holthoff, D. A. Heaps, and P. M. Pellegrino, IEEE
Sens. J. 10101010, 572 (2010). 21. F. G. C. Bijnen, J. Reuss, and F. J. M. Harren, Rev. Sci.
Instrum. 67676767, 2914 (1996). 22. S. Danworaphong, I. G. Calasso, A. Beveridge, G. J.
Diebold, C. Gmachl, F. Capasso, D. L. Sivco, and A. Y. Cho, Appl. Opt. 42424242, 5561 (2003).
23. K. Duffin, A. J. McGettrick, W. Johnstone, G. Stewart, and D. G. Moodie, J. Light. Technol. 25252525, 3114 (2007).
24. D. W. Allan, Proc. IEEE 54545454, 221 (1966). 25. P. Werle, R. Muecke, and F. Slemr, Appl. Phys. B
Photophysics Laser Chem. 57575757, 131 (1993).
Fig. 6. (a) Time dependent measurement using calibrated gas concentrations of 1%C2H2 and 100ppm C2H2 and (b) Allan-Werle deviation plot for 100ppm C2H2 using a 0.6s time-delay.
1. A. G. Bell, “On the production and reproduction of sound by light,” Am. J. Sci., vol. s3–20, no. 118, pp. 305–324, Oct. 1880.
2. M. Jahjah, W. Jiang, N. P. Sanchez, W. Ren, P. Patimisco, V. Spagnolo, S. C. Herndon, R. J. Griffin, and F. K. Tittel, “Atmospheric CH_4 and N_2O measurements near Greater Houston area landfills using a QCL-based QEPAS sensor system during DISCOVER-AQ 2013,” Opt. Lett., vol. 39, no. 4, p. 957, Feb. 2014.
3. T. Schmid, “Photoacoustic spectroscopy for process analysis,” Anal. Bioanal. Chem., vol. 384, no. 5, pp. 1071–86, Mar. 2006.
4. W. Ren, W. Jiang, N. P. Sanchez, P. Patimisco, V. Spagnolo, C. Zah, F. Xie, L. C. Hughes, R. J. Griffin, and F. K. Tittel, “Hydrogen peroxide detection with quartz-enhanced photoacoustic spectroscopy using a distributed-feedback quantum cascade laser,” Appl. Phys. Lett., vol. 104, no. 4, p. 041117, Jan. 2014.
5. A. L. Ulasevich, A. V Gorelik, A. A. Kouzmouk, and V. S. Starovoitov, “Infrared Physics & Technology A miniaturized prototype of resonant banana-shaped photoacoustic cell for gas sensing,” Infrared Phys. Technol., vol. 60, pp. 174–182, 2013.
6. A. Miklos, P. Hess, and Z. Bozoki, “Application of acoustic resonators in photoacoustic trace gas analysis and metrology,” Rev. Sci. Instrum., vol. 72, no. 4, p. 1937, 2001.
7. M. E. Webber, M. Pushkarsky, and C. K. N. Patel, “Fiber-amplifier-enhanced photoacoustic spectroscopy with near-infrared tunable diode lasers,” Appl. Opt., vol. 42, no. 12, pp. 2119–26, Apr. 2003.
8. V. Spagnolo, P. Patimisco, S. Borri, G. Scamarcio, B. E. Bernacki, and J. Kriesel, “Mid-infrared fiber-coupled QCL-QEPAS sensor,” Appl. Phys. B, vol. 112, no. 1, pp. 25–33, Mar. 2013.
9. V. Spagnolo, P. Patimisco, S. Borri, G. Scamarcio, B. E. Bernacki, and J. Kriesel, “Part-per-trillion level SF6 detection using a quartz enhanced photoacoustic spectroscopy-based sensor with single-mode fiber-coupled quantum cascade laser excitation.,” Opt. Lett., vol. 37, no. 21, pp. 4461–3, Nov. 2012.
10. J. M. Rey, D. Marinov, D. E. Vogler, and M. W. Sigrist, “Investigation and optimisation of a multipass resonant photoacoustic cell at high absorption levels,” Appl. Phys. B, vol. 80, no. 2, pp. 261–266, Dec. 2004.
11. M. Niu, Q. Liu, K. Liu, Y. Yuan, and X. Gao, “Temperature-dependent photoacoustic spectroscopy with a T shaped photoacoustic cell at low temperature,” Opt. Commun., vol. 287, pp. 180–186, Jan. 2013.
12. T. Starecki, “Loss-improved electroacoustical modeling of small Helmholtz resonators,” J. Acoust. Soc. Am., vol. 122, no. 4, pp. 2118–23, Oct. 2007.
13. S. Schilt and L. Thévenaz, “Wavelength modulation photoacoustic spectroscopy: Theoretical description and experimental results,” Infrared Phys. Technol., vol. 48, no. 2, pp. 154–162, Jun. 2006.
14. P. Patimisco, G. Scamarcio, F. K. Tittel, and V. Spagnolo, “Quartz-enhanced photoacoustic spectroscopy: a review,” Sensors (Basel)., vol. 14, no. 4, pp. 6165–206, Jan. 2014.
15. Y. Cao, W. Jin, H. L. Ho, and J. Ma, “Miniature fiber-tip photoacoustic spectrometer for trace gas detection.,” Opt. Lett., vol. 38, no. 4, pp. 434–6, Feb. 2013.
16. G. Gruca, K. Heeck, J. Rector, and D. Iannuzzi, “Demonstration of a miniature all-optical photoacoustic spectrometer based on ferrule-top technology.,” Opt. Lett., vol. 38, no. 10, p. 1672, May 2013.
17. F. Xu, J. Shi, K. Gong, H. Li, R. Hui, and B. Yu, “Fiber-optic acoustic pressure sensor based on large-area
nanolayer silver diaghragm,” Opt. Lett., vol. 39, no. 10, p. 2838, May 2014.
18. S. L. Firebaugh, K. F. Jensen, and M. A. Schmidt, “Miniaturization and integration of photoacoustic detection,” J. Appl. Phys., vol. 92, no. 3, p. 1555, 2002.
19. P. M. Pellegrino, R. G. Polcawich, and P. M. Road, “Advancement of a MEMS Photoacoustic Chemical Sensor,” Proc. SPIE 5085, Chem. Biol. Sens. IV, vol. 5085, no. 301, pp. 52–63, 2003.
20. E. L. Holthoff, D. A. Heaps, and P. M. Pellegrino, “Development of a MEMS-Scale Photoacoustic Chemical Sensor Using a Quantum Cascade Laser,” IEEE Sens. J., vol. 10, no. 3, pp. 572–577, Mar. 2010.
21. F. G. C. Bijnen, J. Reuss, and F. J. M. Harren, “Geometrical optimization of a longitudinal resonant photoacoustic cell for sensitive and fast trace gas detection,” Rev. Sci. Instrum., vol. 67, no. 8, p. 2914, 1996.
22. S. Danworaphong, I. G. Calasso, A. Beveridge, G. J. Diebold, C. Gmachl, F. Capasso, D. L. Sivco, and A. Y. Cho, “Internally excited acoustic resonator for photoacoustic trace detection.,” Appl. Opt., vol. 42, no. 27, p. 5561, Sep. 2003.
23. K. Duffin, A. J. McGettrick, W. Johnstone, G. Stewart, and D. G. Moodie, “Tunable Diode-Laser Spectroscopy With Wavelength Modulation: A Calibration-Free Approach to the Recovery of Absolute Gas Absorption Line Shapes,” J. Light. Technol., vol. 25, no. 10, pp. 3114–3125, Oct. 2007.
24. D. W. Allan, “Statistics of atomic frequency standards,” Proc. IEEE, vol. 54, no. 2, pp. 221–230, 1966.
25. P. Werle, R. Muecke, and F. Slemr, “The limits of signal averaging in atmospheric trace-gas monitoring by tunable diode-laser absorption spectroscopy (TDLAS),” Appl. Phys. B Photophysics Laser Chem., vol. 57, no. 2, pp. 131–139, Aug. 1993.