Embed Size (px)
Citation preview

A Better Way
To
Keep Your LP Accurate
Presented at:
Haverly Systems 43rd Annual MUG Conference
San Antonio, TX
September 13 – 16, 2009
Sandy Master Optimization Specialist
Refinery Business Development
Suncor Energy Products Inc
Sarnia, Ontario N7T 7J3
William Korchinski President
Advanced Industrial Modeling, Inc.
Santa Barbara, California 93108
805.969.4449
August 25, 2009 Final
2
Abstract
In this paper, we discuss a new approach to improving LP model accuracy. Advanced Industrial Modeling
Inc. developed this LP Assurance solution, which is now running at a number of sites- most recently at
Suncor’s Sarnia refinery. The solution makes it easy for Planners and Engineers to find and correct errors
between LP predictions and actual plant operation. Benefits include a single user interface for every site
and submodel, automated data collection and screening, graphical and statistical representations of
model mismatch, and an easy way to get improved submodel coefficients into the LP.
Background & terminology
Oil refiners and petrochemical plant operators all use Linear Programs (LP) to help run their operations
and to plan future operations. There are many uses for these LPs including monthly planning, shutdown
planning, equipment selection, and capital planning. Normally each site (refinery or plant) has at least
one LP at its disposal, and normally the LPs select feedstocks and operating modes, in a way that
satisfies current demands, and maximizes profit.
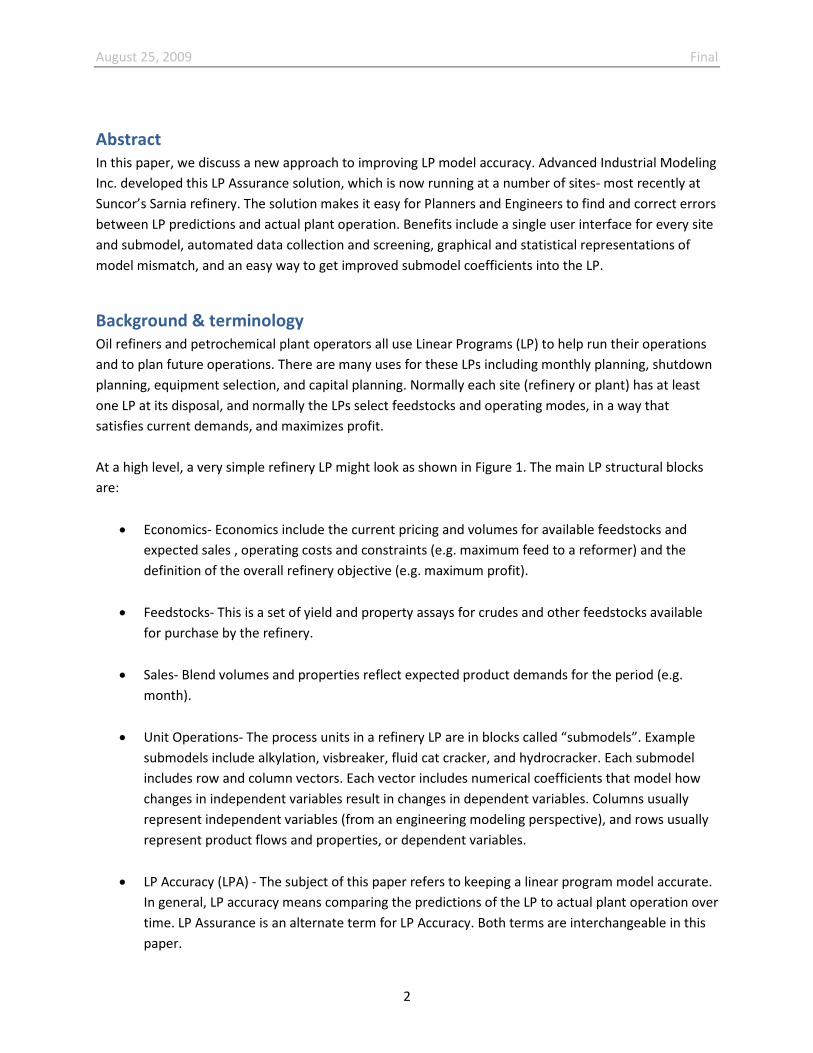
At a high level, a very simple refinery LP might look as shown in Figure 1. The main LP structural blocks
are:
• Economics- Economics include the current pricing and volumes for available feedstocks and
expected sales , operating costs and constraints (e.g. maximum feed to a reformer) and the
definition of the overall refinery objective (e.g. maximum profit).
• Feedstocks- This is a set of yield and property assays for crudes and other feedstocks available
for purchase by the refinery.
• Sales- Blend volumes and properties reflect expected product demands for the period (e.g.
month).
• Unit Operations- The process units in a refinery LP are in blocks called “submodels”. Example
submodels include alkylation, visbreaker, fluid cat cracker, and hydrocracker. Each submodel
includes row and column vectors. Each vector includes numerical coefficients that model how
changes in independent variables result in changes in dependent variables. Columns usually
represent independent variables (from an engineering modeling perspective), and rows usually
represent product flows and properties, or dependent variables.
• LP Accuracy (LPA) - The subject of this paper refers to keeping a linear program model accurate.
In general, LP accuracy means comparing the predictions of the LP to actual plant operation over
time. LP Assurance is an alternate term for LP Accuracy. Both terms are interchangeable in this
paper.
August 25, 2009 Final
3
Figure 1- A simple refinery LP
LP Assurance Defined
How closely does an LP submodel match actual plant operation? One way to quantify this is to calculate
the difference between the LP predictions and the measured values corresponding to each of these
predictions. Table 1 is an example of this calculation. Quantifying the difference between each LP
stream prediction and its corresponding measured value is a typical way to report LP accuracy. In this
example, the errors range from -3% (Heavy distillate) to 50% (Bottoms).
Stream Measured LP prediction LP Error (%)
Light ends 5 6 20
LPG 8 7 -13
Naphtha 20 23 15
Light distillate 25 17 -32
Heavy distillate 30 29 -3
Bottoms 12 18 50
Table 1- LP prediction error at a single point
August 25, 2009 Final
4
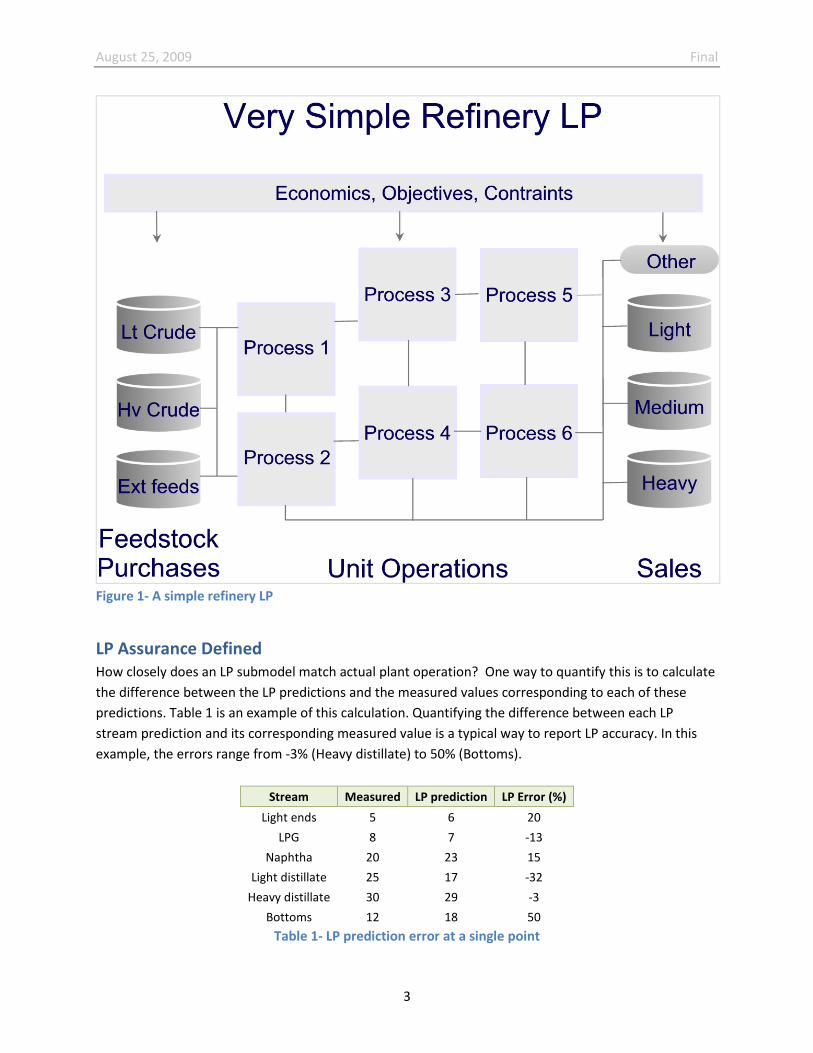
Looking at LP prediction errors over time provides a better measure as to how the LP errors behave. In
Figure 2 below, the decant oil LP prediction is offset persistently from the plant measurement of the
stream. By contrast, the HCO LP prediction is sometimes above and sometimes below its plant
measurement; but it generally tracks the measurement. Diagnostics like these help to locate where the
largest errors are in the LP submodel, and help to prioritize where to spend time to improve the
submodel. The diagnostics also help to identify and prioritize which submodels need tuning.
Figure 2- Example of LP error over time
Why LP Assurance Matters
As a refinery’s LP prediction errors drift over time, the LP’s ability to correctly forecast future operation
decreases. Some of the reasons for increased plant / LP mismatch include:
• Problems with process equipment (tower trays, catalyst changes, exchanger fouling)
• Lack of time or resources to tune LP submodels
• Unanticipated yield shifts due to new feed types
• Lack of a consistent methodology for keeping LP submodels tuned
August 25, 2009 Final
5
• Frequent staffing rotation between jobs- little time to learn LP maintenance
Amongst the consequences of inaccurate LP predictions are:
• The refinery runs against wrong constraints
• Sub-optimal crude selection / spend too much on crudes
• Buy unnecessary and expensive external feedstocks
• Buy unnecessary and expensive blending components
• Make too much product- then sell excess at a loss
• Make too little of a product- then buy at a premium
It is common for refiners to experience some or all of the above. Although it is highly desirable to
address these concerns, it is not always easy in practice as refinery engineers and managers get
busier every year. Also, priorities change over time, as market and regulatory forces cause
management focus to periodically shift between safety, environmental, capital expansion, union
negotiations, cost-cutting, acquisitions and so on. On top of all this, special projects are ongoing and
account for significant fractions of refinery technical and management time each year.
Given all of the above, refinery Planners often find themselves with limited time to attend to
measuring and improving submodel accuracy, with the consequence that over time refinery margins
suffer.
Motivations for the project
Suncor Energy sees a robust LP Assurance solution as a low-cost way to increase refining margins.
Having one solution for all submodels means that Planners and Operations Engineers can more
frequently measure and improve submodel accuracy. The general characteristics of the LP Assurance
solution are that it:
• Can be easily used by Planners
• Has automated data handling & screening
• Has a single user interface for all Planners & Engineers
• Does not require much time to use
• Quickly calculates updated base coefficients
• Provides quick statistical measurements on the quality of the LP predictions
• Produces coefficients in a form that can be directly imported into the LP
August 25, 2009 Final
6
Project Implementation
We began the Suncor project early in 2009, selecting the Houdriflow Catalytic Cracker (HCC ) as the first
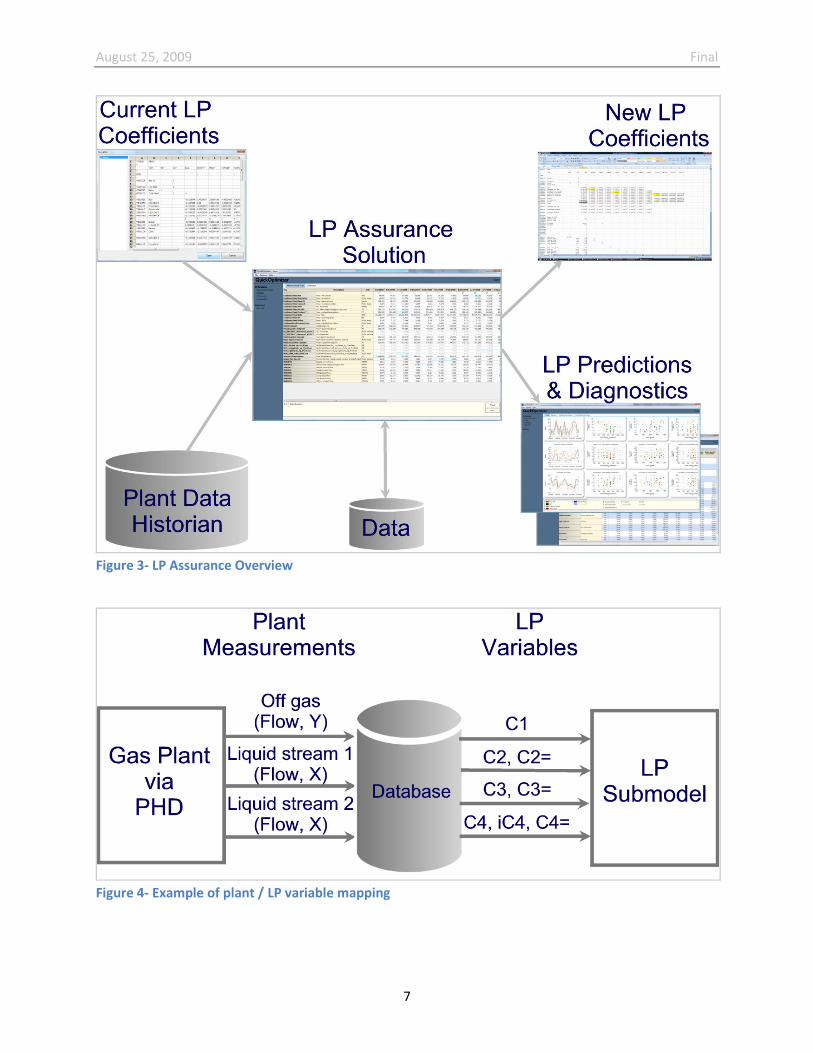
submodel. Figure 3 shows a high-level view of the application.
The implementation process involved the following steps:
• Write & review Functional Specification
• Assemble & check HCC unit material balance
• Configure application:
o to read points from PHD
o to map PHD points to LP variables
o add plant data & current LP coefficients
• Test application:
o calculate new LP base vectors
o make statistical comparisons of current and new LP predictions
• Training:
o Remote (web-based)
o On-site
• Application support
Using the application’s configuration screens and database calculation engine allows mapping plant
measurements to match the variable structure in the LP submodel. Figure 4 shows an example of this
kind of data mapping. Typically, plant measurements and the LP variable structure correlate in only a
general sense. A gas plant is illustrative, in that the plant measurements might include an off gas flow,
two liquid flows and their associated compositions. The LP, on the other hand might contain rows
measuring pure component flows for methane, ethane, ethylene and so on. Even in a simple example
like this, matching plant measurements with LP variables can require many calculations. Fortunately,
much of this data mapping is automatic, and is a one-time activity.
A second application-building step is to configure database variables to hold the rows, columns (and
coefficients) of the HCC submodel. Again, much of this configuration is automatic, but there is still a
need to provide flexibility to cover the wide range of LP submodel structures that occur in practice.
Having configured the application to recognize plant measurements and the LP submodel structure, we
collected real plant data and began testing the application’s capabilities, including data screening,
material balance checking, LP predictions, calculation of new vectors, statistics and diagnostics.
August 25, 2009 Final
7
Figure 3- LP Assurance Overview
Figure 4- Example of plant / LP variable mapping
August 25, 2009 Final
8
Workflow
The application is now installed and running at Suncor, and we are beginning application training. We
anticipate running the LP Assurance application at least once per quarter to check HCC submodel
accuracy, and that the workflow will be split between the Planner and Operations Engineers.
Note that the figures here are illustrative of the Suncor Energy project, but have been disguised to
remove references to actual numerical values, actual LP structure, or actual plant data.
The workflow steps for the Planner and Engineers include:
• Export spreadsheet of LP submodel to LP Assurance tool
• Collect plant data
• Validate plant data
• Measure LP submodel accuracy
• Calculate new submodel coefficients
• Validate accuracy of new coefficients
• Import spreadsheet with new coefficients into LP model
• Test new coefficients
August 25, 2009 Final
9
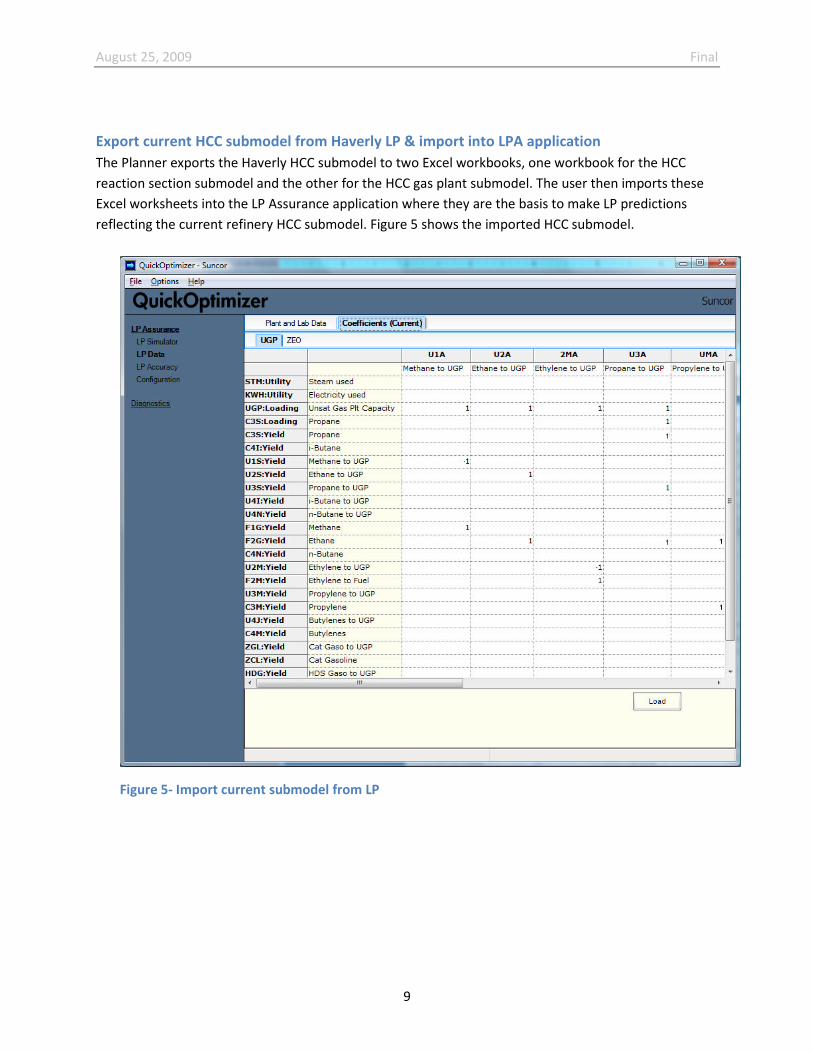
Export current HCC submodel from Haverly LP & import into LPA application
The Planner exports the Haverly HCC submodel to two Excel workbooks, one workbook for the HCC
reaction section submodel and the other for the HCC gas plant submodel. The user then imports these
Excel worksheets into the LP Assurance application where they are the basis to make LP predictions
reflecting the current refinery HCC submodel. Figure 5 shows the imported HCC submodel.
Figure 5- Import current submodel from LP
August 25, 2009 Final
10
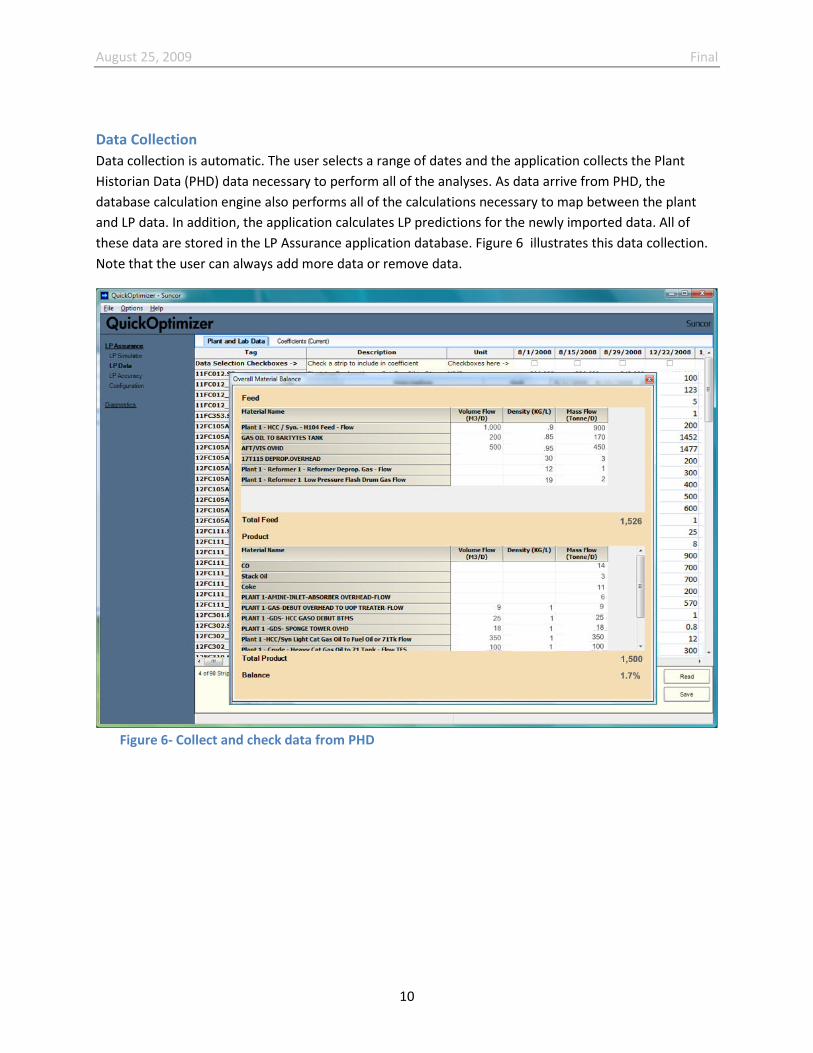
Data Collection
Data collection is automatic. The user selects a range of dates and the application collects the Plant
Historian Data (PHD) data necessary to perform all of the analyses. As data arrive from PHD, the
database calculation engine also performs all of the calculations necessary to map between the plant
and LP data. In addition, the application calculates LP predictions for the newly imported data. All of
these data are stored in the LP Assurance application database. Figure 6 illustrates this data collection.
Note that the user can always add more data or remove data.
Figure 6- Collect and check data from PHD
August 25, 2009 Final
11
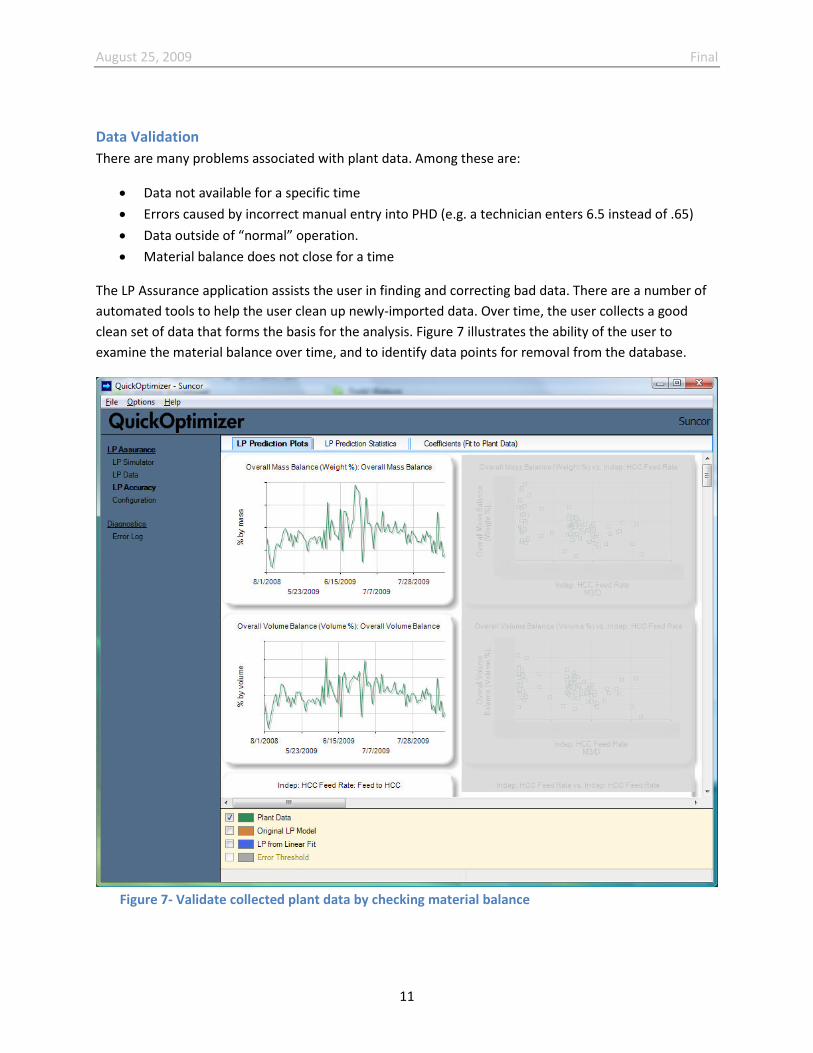
Data Validation
There are many problems associated with plant data. Among these are:
• Data not available for a specific time
• Errors caused by incorrect manual entry into PHD (e.g. a technician enters 6.5 instead of .65)
• Data outside of “normal” operation.
• Material balance does not close for a time
The LP Assurance application assists the user in finding and correcting bad data. There are a number of
automated tools to help the user clean up newly-imported data. Over time, the user collects a good
clean set of data that forms the basis for the analysis. Figure 7 illustrates the ability of the user to
examine the material balance over time, and to identify data points for removal from the database.
Figure 7- Validate collected plant data by checking material balance
August 25, 2009 Final
12
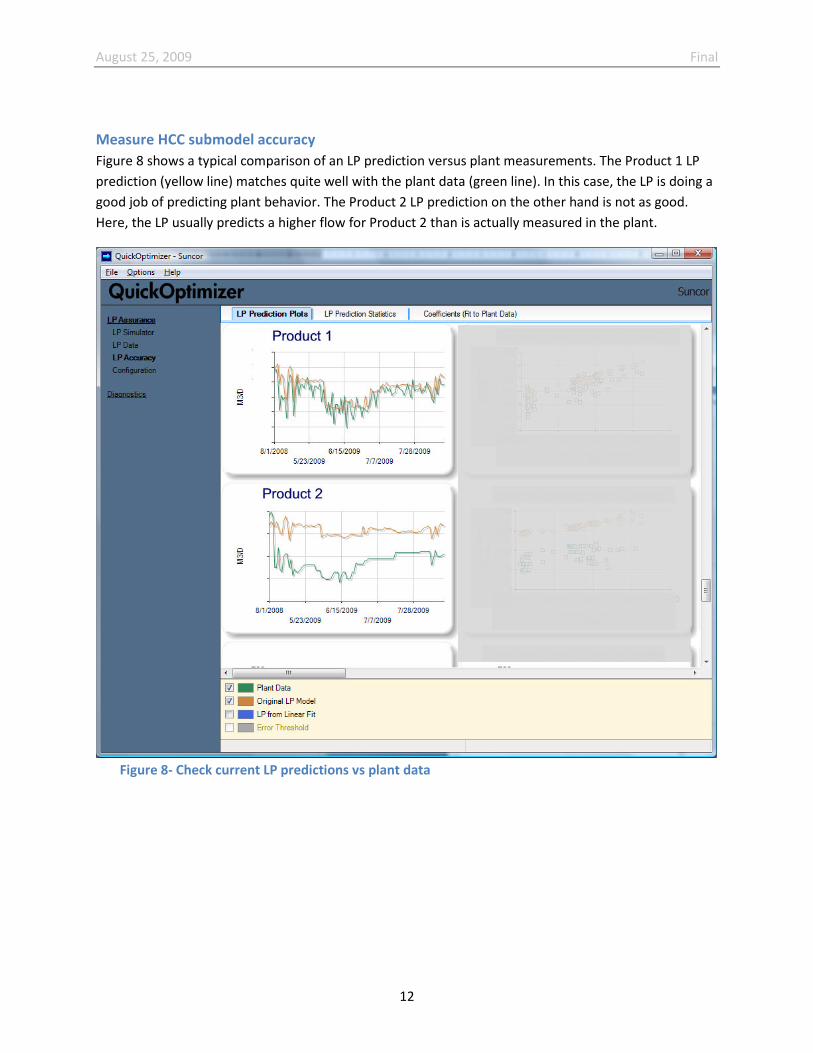
Measure HCC submodel accuracy
Figure 8 shows a typical comparison of an LP prediction versus plant measurements. The Product 1 LP
prediction (yellow line) matches quite well with the plant data (green line). In this case, the LP is doing a
good job of predicting plant behavior. The Product 2 LP prediction on the other hand is not as good.
Here, the LP usually predicts a higher flow for Product 2 than is actually measured in the plant.
Figure 8- Check current LP predictions vs plant data
August 25, 2009 Final
13
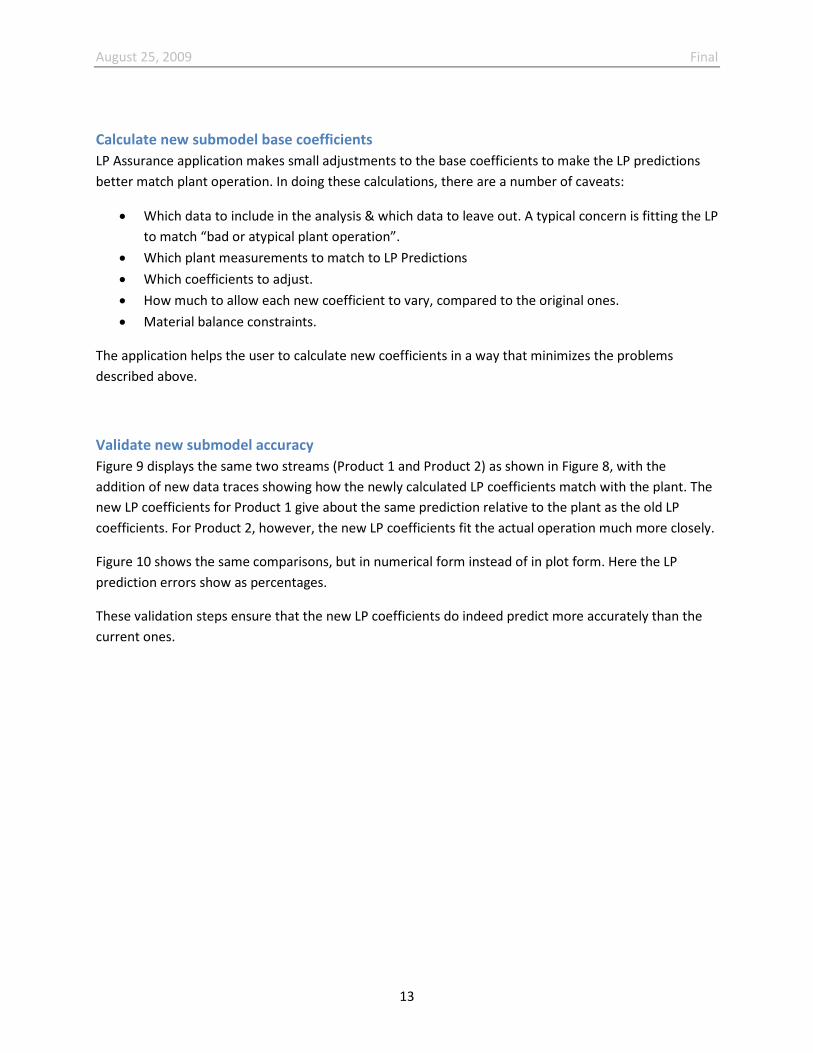
Calculate new submodel base coefficients
LP Assurance application makes small adjustments to the base coefficients to make the LP predictions
better match plant operation. In doing these calculations, there are a number of caveats:
• Which data to include in the analysis & which data to leave out. A typical concern is fitting the LP
to match “bad or atypical plant operation”.
• Which plant measurements to match to LP Predictions
• Which coefficients to adjust.
• How much to allow each new coefficient to vary, compared to the original ones.
• Material balance constraints.
The application helps the user to calculate new coefficients in a way that minimizes the problems
described above.
Validate new submodel accuracy
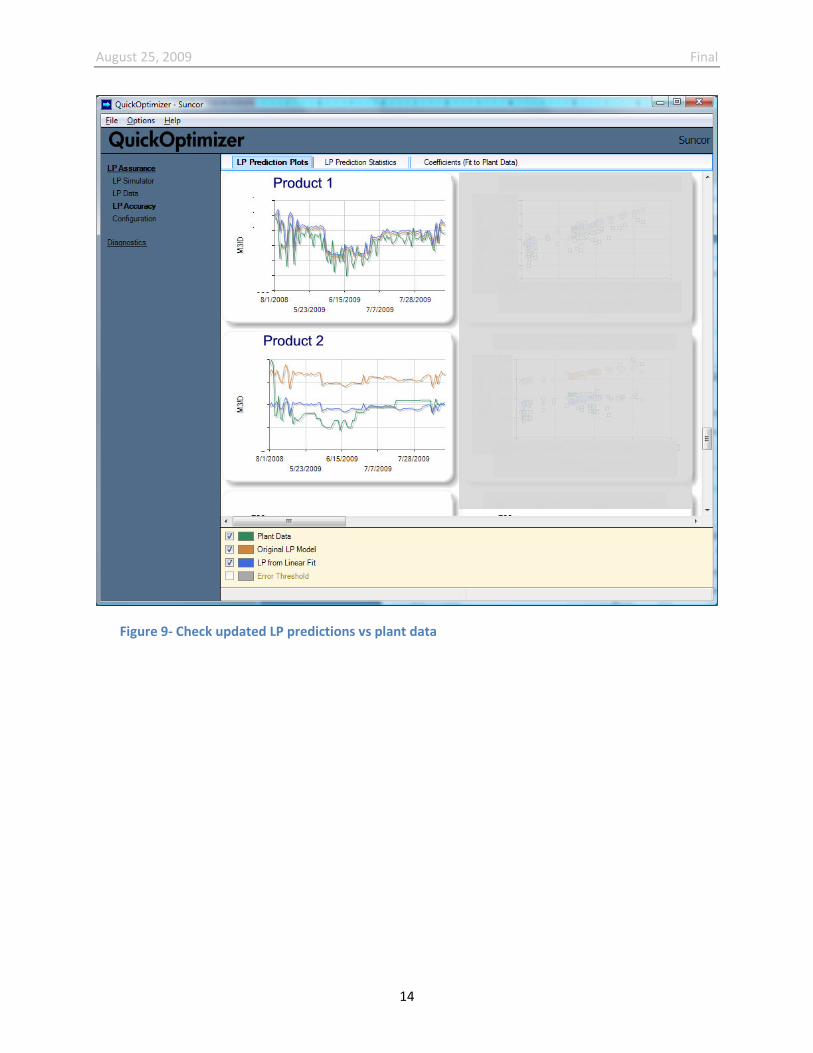
Figure 9 displays the same two streams (Product 1 and Product 2) as shown in Figure 8, with the
addition of new data traces showing how the newly calculated LP coefficients match with the plant. The
new LP coefficients for Product 1 give about the same prediction relative to the plant as the old LP
coefficients. For Product 2, however, the new LP coefficients fit the actual operation much more closely.
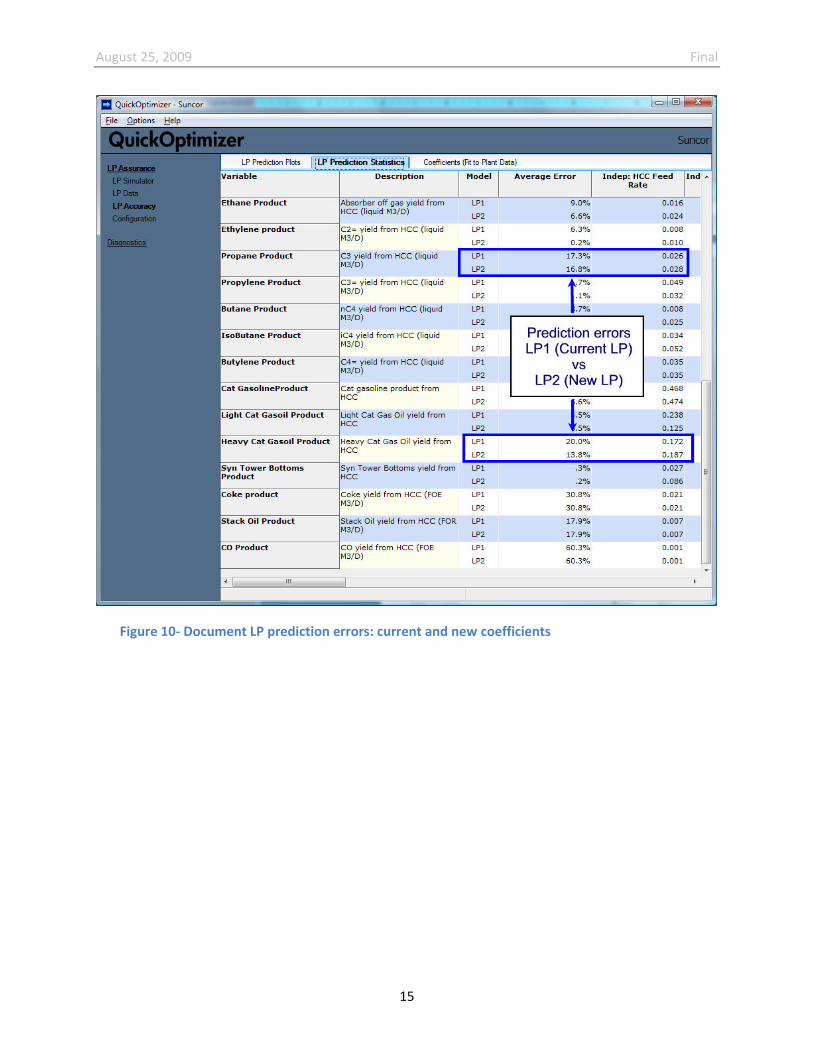
Figure 10 shows the same comparisons, but in numerical form instead of in plot form. Here the LP
prediction errors show as percentages.
These validation steps ensure that the new LP coefficients do indeed predict more accurately than the
current ones.
August 25, 2009 Final
14
Figure 9- Check updated LP predictions vs plant data
August 25, 2009 Final
15
Figure 10- Document LP prediction errors: current and new coefficients
August 25, 2009 Final
16
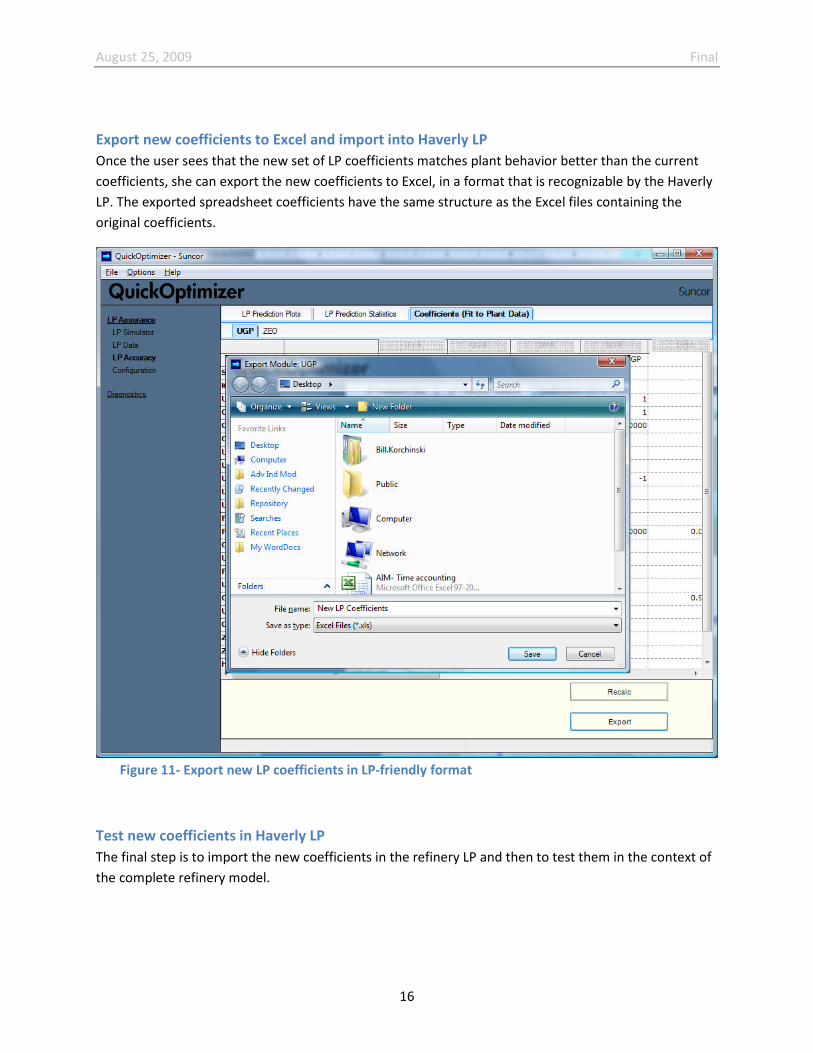
Export new coefficients to Excel and import into Haverly LP
Once the user sees that the new set of LP coefficients matches plant behavior better than the current
coefficients, she can export the new coefficients to Excel, in a format that is recognizable by the Haverly
LP. The exported spreadsheet coefficients have the same structure as the Excel files containing the
original coefficients.
Figure 11- Export new LP coefficients in LP-friendly format
Test new coefficients in Haverly LP
The final step is to import the new coefficients in the refinery LP and then to test them in the context of
the complete refinery model.
August 25, 2009 Final
17
Benefits
Suncor Energy sees a number of qualitative benefits from deploying the LP Assurance application. These
include:
• LP Assurance helps Planners prioritize where to spend time to improve the LP submodels.
• Ensures that the LP more closely matches actual operation.
• Gives Planners and Operations Engineers a single approach for checking LP accuracy.
• Gives refinery staff the choice to either check LP accuracy more frequently or to continue with
the same frequency, but spend less time on the activity.
• Allows the Planners and Engineers to monitor LP accuracy without the need for complex process
simulators and/or plant surveys.
• Provides an offline tool for unit Engineers to understand LP predictions for their unit without
knowledge of the entire LP model.
Other studies have shown that finding and correcting LP errors faster typically result in benefits of from
a few cents per BBL of crude for each submodel up to 30-40 cents1. In the case of the Suncor HCC LP
model it had been difficult to tune the HCC yield coefficients as process unit simulation tools are not
available and surveys have been infrequent. This tool will also allow the HCC sulfur balance to be tuned
based on actual fractionation tower performance. These changes will have direct impact on the
optimization of feedstock selection and downstream unit operation.
Summary & Conclusions
Suncor Energy and Advanced Industrial Modeling are in the final stages of installing an LP Assurance
application on the HCC LP submodel at the Sarnia refinery. The application is running in Sarnia and we
have built up a representative set of plant data. Now we are in the process of testing the application and
are in the early stages of user training. Suncor Energy sees this approach as a cost effective way to
improve refining margins, without putting any significant additional burden on its Planning and
Engineering staff.
1 Study by Advanced Industrial Modeling, Inc. 2008