Embed Size (px)
Citation preview
A COMPARISON OF BIRD ABUNDANCE AND NESTING
IN HARVEST UNITS, HABITAT ISLANDS,
AND MATURE CONIFEROUS FORESTS IN SOUTHWESTERN OREGON
byJaime L. Stephens
A thesis submitted to the Department of Biology and theGraduate School of Southern Oregon University
in partial fulfillment of the requirements for the degree of
MASTER OF SCIENCEin
SCIENCE
Ashland, Oregon2005

THESIS APPROVAL PAGE
Approved:
I L _, I _
Date
2b .1_M5Date
ate' ' &O,
Date
Michael Parker, Committee Member
Chares Welden, Committee Member
Josep rafkean, Scho ciences
ii

Hope is the thing with feathers that perches in the soul,And sings the tune without the words, and never stops at all.
-Emily Dickinson
In memory of my father, Gary Heinzelmann, who encouragedand supported me in all of my endeavors.
iii
ACKNOWLEDGEMENTS
I would like to thank my major advisor Stewart Janes and my graduatecommittee; Michael Parker, Charles Welden and John Alexander for their advice andsupport throughout this project. Thanks to Boise Corporation for instigating andfunding this study and to Tim Burnett for his logistical support. Additional thanks toKlamath Bird Observatory for their role in study design, implementation andcompletion of this thesis. Thanks also to Nat Seavy, for his assistance with statisticalanalysis and review. And lastly, I would like to thank the field crews who assistedwith data collection, including Ken Etzel, April Harding, Cara Joos and Trina Stauff.
Iv
ABSTRACT OF THESIS
A COMPARISON OF BIRD ABUNDANCE AND NESTING
IN HARVEST UNITS, HABITAT ISLANDS,
AND MATURE CONIFEROUS FORESTS IN SOUTHWESTERN OREGON
By Jaime L. Stephens
This study compared bird abundance and nesting to determine whether habitat
islands retained within timber harvests (Wildlife Protection Areas, WPAs) were
effective in providing habitat for birds in the years shortly after harvest. Two years of
point counts revealed that bird abundance in WPAs was more similar to abundance in
clearcuts than mature forests, and that species richness did not differ between
clearcuts, WPAs, clearcuts and WPAs combined, and mature forests. Nest monitoring
results showed WPAs within clearcuts provided nesting habitat similar to clearcuts
and WPAs within thins contained less nesting species than thins. Results from both
abundance and nesting data concur that WPAs are providing habitat for the forest
species Cassin's Vireos (Vireo cassinii) and two habitat generalists; Western Tanagers
(Piranga ludoviciana) and Yellow-rumped Warblers (Dendroica coronata).
v
TABLE OF CONTENTS
CHAPTER PAGE
I INTRODUCTION I
II. A COMPARISON OF BIRD ABUNDANCE IN CLEARCUTS,HABITAT ISLANDS, AND MATURE CONIFEROUS FORESTSIN SOUTHWESTERN OREGON 6
Abstract 6Introduction 7Methods 9Results 1 7Discussion 21Conclusion 3 1Literature Cited 44
III. A COMPARISON OF NESTING BIRDS IN HARVEST UNITS,HABITAT ISLANDS, AND MATURE CONIFEROUS FORESTSIN SOUTHWESTERN OREGON 50
Abstract 50Introduction 5 1Methods 53Results 57Discussion 58Conclusion and Recommendations 61Literature Cited 70
IV. CONCLUSION AND RECOMMENDATIONS 74
Abundance and Nest Fate of Focal Species 74Recommendations for Further Study 77
APPENDIX 1 81
vi
LIST OF TABLES
CHAPTER II.
CHAPTER IIm.
CHAPTER IV.
Table 1.
Table 2.
Table 3.
Table 4.
Table 5.
Table 6.
WPA Size
Predicted Species Abundance between Treatments
Nest Guilds
Vegetative Cover
GEE Bird Abundance Analysis
Probability of Detection and WPA Size
Page
32
32
33
34
35
36
64
64
65
66
Table 1. Nest Searching and Monitoring Focal Species
Table 2. WPA Size
Table 3. Nest Quantity and Fate for Non-focal Species
Table 4. Nest Quantity and Fate for Forest Interior/Late Successional Species
Table 5. Nest Quantity and Fate for Forest Edge/Early Successional Species
Table 6. Nest Quantity and Fate for Habitat GeneralistSpecies
Table 1. Abundance and Nest Fate for Focal Species
67
67
80
vii
LIST OF FIGURES
CHAPTER II. Figure 1.
Figure 2.
Figure 3.
Figure 4.
Figure 5.
CHAPTER III. Figure 1.
Figure 2.
Map of Study Area
Box Plots of Vegetative Cover
Species Richness in Treatments
Index of Abundance by Treatment
Probability of Detection and WPA Size
Map of Study Area
Nesting Species Richness
Page
37
38
39
40
43
68
69
viii
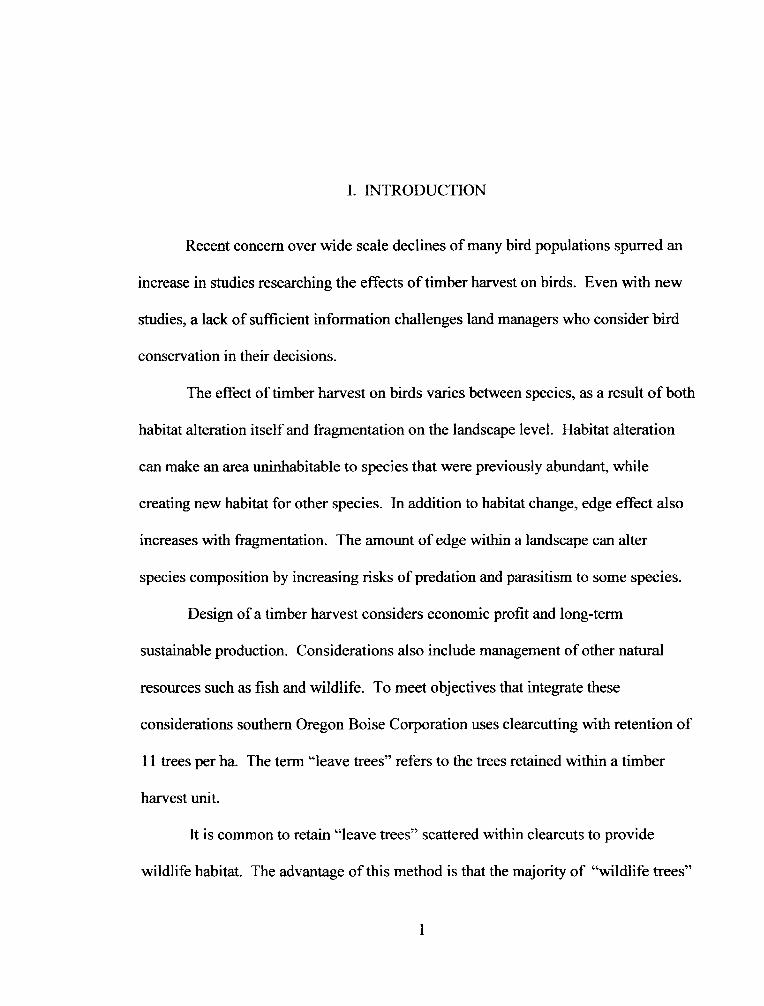
I. INTRODUCTION
Recent concern over wide scale declines of many bird populations spurred an
increase in studies researching the effects of timber harvest on birds. Even with new
studies, a lack of sufficient information challenges land managers who consider bird
conservation in their decisions.
The effect of timber harvest on birds varies between species, as a result of both
habitat alteration itself and fragmentation on the landscape level. Habitat alteration
can make an area uninhabitable to species that were previously abundant, while
creating new habitat for other species. In addition to habitat change, edge effect also
increases with fragmentation. The amount of edge within a landscape can alter
species composition by increasing risks of predation and parasitism to some species.
Design of a timber harvest considers economic profit and long-term
sustainable production. Considerations also include management of other natural
resources such as fish and wildlife. To meet objectives that integrate these
considerations southern Oregon Boise Corporation uses clearcutting with retention of
11 trees per ha. The term "leave trees" refers to the trees retained within a timber
harvest unit.
It is common to retain "leave trees" scattered within clearcuts to provide
wildlife habitat. The advantage of this method is that the majority of "wildlife trees"
I
2
are retained. "Wildlife trees" provide particular benefit to wildlife; including broken
top live trees, snags, trees with deformation used for roosting and nesting, and trees
with cavities. Regeneration of "wildlife trees" is slow because the beneficial
characteristics are atypical and often associated with older trees, making them
particularly important over the long term.
In contrast, Southern Oregon Boise Corporation retains "leave trees" in
islands, referred to as Wildlife Protection Areas (WPAs) within harvests to minimize
the detrimental effects of clearcuts and thins to wildlife over the short and long term.
In addition, individual snags and other monetarily invaluable deformed trees, which
often include "wildlife trees," remain standing throughout the harvest unit. Harvest
prescriptions do not specify number or size of WPAs. With a prescription for a 10 ha
harvest unit that designates 11 "leave trees" per ha, 1 10 trees are retained in various
numbers of islands with a varying number of trees per island. It is left to the
discretion of wildlife and fisheries biologists to determine which trees would provide
the most benefit.
The short-term objective of tree retention prescriptions for timber harvest is to
maintain specific types of habitat for fish and wildlife within the harvest units. The
long term objective is to create multi-aged stands beneficial to a diversity of wildlife.
In situations without riparian habitat, the strategy of Southern Oregon Boise
3
Corporation has been to create WPAs between 0.1 and 0.8 ha and to spread them
relatively evenly throughout harvest units.
Retaining "leave trees" as islands meets the long term objective because
patches of older trees provide diverse habitat, as well as maintain structural
complexity such as snags and downed wood. The WPAs will exist on the landscape
indefinitely, through many harvest rotations. This long term objective is an important
component of WPAs because they will provide habitat to diverse and changing species
through time. The assemblage of species using WPAs will partially depend on the
changing habitat that surrounds them.
The objective of this study was to determine whether WPAs were effective in
providing habitat for birds in the years directly after harvest, and thus reaching the
short term objective of WPAs for avifauna. Birds provide an effective monitoring tool
because they allow for the monitoring of a number of species that have unique habitat
preferences, and thus can be used as indicators of habitat change. The study objective
was split into two components, the first addressed bird abundance and the second
considered bird reproduction.
The first objective, which is presented in chapter two, compared species
richness and bird abundance among WPAs within clearcuts, clearcuts, and mature
forests. Due to spatial constraints and sample size requirements there were not enough
thinned harvests to attain statistical power in this component of the study. Abundance
4
was compared to determine whether WPAs within clearcuts were effective in
providing habitat for birds, and if so, whether those species were abundant in mature
forests and/or clearcuts. In addition, I assessed whether nesting guild was associated
with abundance patterns and whether the probability of detecting a species was
associated with WPA size.
The objective of the second component of this study, presented in Chapter 3,
was to compare nesting attempts and nest fate of birds nesting within thins (55%
canopy cover retentions) and clearcuts, WPAs contained in thins and clearcuts, and
mature forests in order to determine whether WPAs are providing nesting habitat that
differs from the surrounding harvest unit. I focused on 13 focal species that are
representative of forest interior/late successional habitat, forest edge/early successional
habitat, and habitat generalists.
The two complimentary components of this study were integrated to determine
whether WPAs provided habitat for birds over the short term. Collecting data on bird
abundance is a cost effective method to attain information about a number of species
with a single effort. However, abundance data also has limitations because while it is
often correlated with habitat characteristics it can be a misleading indicator of
reproductive success. The second component of this study was more labor intensive;
it addresses only 13 species and the data is further limited by small sample size.
However, combined with the abundance data, reproductive data is used as anecdotal
5
evidence and compared with results of chapter two in order to infer habitat quality for
the focal species. The two study components are integrated in chapter four to
conclude whether WVPAs provide habitat for birds in the years following timber
harvests.
-__ --- - __ __
11. A COMPARISON OF BIRD ABUNDANCE IN CLEARCUTS,
HABITAT ISLANDS, AND MATURE CONIFEROUS FORESTS
IN SOUTHWESTERN OREGON
Abstract
I compared bird abundance in mature forests, clearcuts and habitat islands
(Wildlife Protection Areas, WPAs) within clearcuts to determine whether WPAs
provide habitat for resident and neotropical migratory birds. Two years of off-road
variable radius point count bird censuses revealed that bird abundance in WPAs was
more similar to abundance in clearcuts than mature forests. Species richness did not
differ between clearcuts, WPAs, clearcuts and WPAs combined, and mature forests.
My results show that WPAs provided habitat for seven of the fifteen species detected
in each treatment in both years; two forest species; Red-breasted Nuthatch (Sitta
canadensis) and Cassin's Vireo (Vireo cassinii), one edge specialist; Dark-eyed Junco
(Junco hyemalis) and four habitat generalists; Western Tanager (Piranga ludoviciana),
Steller's Jay (Cyanocitta stelleri) Yellow-rumped Warbler (Dendroica coronata), and
House Wren (Troglodytes aedon). Differences in bird abundance between WPAs,
clearcuts and mature forests were not associated with nesting guild and the probability
of detecting species did not differ with WPA size.
6
7
Introduction
Populations of many bird species have declined in recent decades (Peterjohn et
al. 1995, Rich et al. 2004). Declines in Neotropical migratory birds were originally
attributed to the degradation of habitat on wintering grounds in Central and South
America (Morton 1992, Robbins et al. 1989b). More recently, however, habitat loss
and fragmentation on North American breeding grounds, especially forested areas, has
been implicated as a potential cause of declines in resident and Neotropical migratory
bird populations (Peterjohn et al. 1995, Rich et al. 2004). Recent concern over wide
scale declines of many bird populations spurred an increase in research on effects of
timber harvest on birds. Even with new studies, a lack of sufficient information
challenges land managers who consider bird conservation in their decisions (Arnett
and Sallabanks 1998, Hejl and Granillo 1998).
Alteration of habitat and habitat fragmentation affect bird species differently.
Habitat alteration such as clearcutting, can make an area uninhabitable to some
species, while creating new habitats for others (Hutto et al. 1992, Thompson et al.
1993). In addition, increased edge effect resulting from habitat change at the
landscape scale may alter species composition by increasing risks of predation and
parasitism for some species (Donovan et al. 1995, Tewksbury et al. 1 998).
Robbins et al. (I 989a) found that forest fragments smaller than 10 ha in size
contained few forest interior species in eastern and midwestern North America
w v- L
8
(Freemark and Collins 1989). However, Lance and Phinney (2001) found that
clearcuts with partial forest (15-22%) retention blocks had species richness and
abundance similar to mature, uncut stands in British Columbia, while clearcuts had
both fewer species and total birds. The partial retention sites contained species found
in both clearcuts and mature uncut stands, as well as species not found in either of
those habitats. Some forest species found in mature uncut stands were not in partial
retention blocks, while others were present but less abundant (Lance and Phinney
2001). Duguay et al. (2001) found that for four of five eastern species, neither
abundance nor nest success rate differed between a two-aged treatment (37-49 trees/ha
retained), a 15-year old clearcut, an adjacent unharvested forest, and an unharvested
forest not adjacent to harvest units.
While clearcutting has detrimental effects on late successional and forest
interior birds, other harvest methods being considered may or may not have similar
effects. Southern Oregon Boise Corporation retains habitat islands (Wildlife
Protection Areas, WPAs) within harvest units to minimize the detrimental effects of
clearcuts to wildlife over the short and long term. While not studied in western
coniferous forests, research suggests that clearcuts containing WPAs will maintain
overall bird abundance and richness, but will not provide habitat for forest interior or
mature forest species. However, similar studies have not been completed with patches
of the small size considered in this study, nor in the western states. My null
9
hypothesis was that WPAs would contain similar species abundance as clearcuts, and
thus are not providing additional forest habitat. Alternately, if WPAs are successful in
maintaining habitat for forest species, those species will be more abundant in WPAs
than clearcuts, with abundance more similar to mature forests.
The objective of this study was to determine whether WPAs were effective in
providing habitat for birds, and if so, whether those species were abundant in mature
forests and/or clearcuts. The study compared species richness and individual species
abundance within WPAs, clearcuts and mature forests. I assessed whether nesting
guild was associated with abundance patterns. Additionally, the probability of
detecting a species was compared with WPA size. This information will be useful for
designing harvest prescriptions that consider the maintenance of bird habitat as an
objective.
Methods
Study Area
The study took place at 12 sites within 20 km of Prospect Oregon, on the west
slope of the southern Cascade Mountains (Fig. 1). The area included coniferous
forests ranging from 750 to 1200 m in elevation with variable slope and aspect. The
terrain is mountainous with ridges dissected by valleys. Hot dry summers and wet
10
winters characterize this ecoregion with mean annual precipitation ranging from 51 to
300 cm (Johnson and O'Neil 2001).
The study area is contained within the Central and Southern Cascades Forests
ecoregion with the major habitat type of Temperate Coniferous Forest (Ricketts et al.
1999). The dominant tree species are Douglas fir (Pseudotsuga menziesii) and white
fir (Abies concolor) with large components of incense cedar (Calocedrus decurrens),
ponderosa pine (Pinus ponderosa) and sugar pine (Pinus lambertiana). Pacific
madrone (Arbutus menziesii) dominates the hardwood component (Hickman 1993).
Shrubs dominate the understory, including giant chinquapin (Chrysolepsis
chrysophylla), ceanothus (Ceanothus spp.), oceanspray (Holodiscus discolor),
Oregon-grape (Berberis nervosa), wood rose (Rosa gymnocarpa), and hazelnut
(Corylus cornuta; Hickman 1993).
The study area included five clearcuts containing WPAs, which were logged in
2000 and 2001 on Boise Corporation lands. Five mature forest patches were also
located on Boise Corporation land and public land managed by USDA Forest Service
within the Prospect Ranger District (Fig. 1). For the purposes of this study, mature
forest was defined as a multiage stand dominated by trees older than 80 years.
Clearcuts have no conifer canopy retained outside of WPAs and the majority of
standing hardwoods died as a result of an herbicide applied at the time of timber
harvest. The herbicides Atrazine and Round Up were applied to the clearcuts one to
11
three times after they were replanted (Burgess pers. comm.), maintaining nearly no
grass, herb, and shrub cover within clearcuts during this study.
WPAs ranged in size from 0.1 to 0.8 ha and were selected for specific
attributes that are particularly significant to wildlife (Table 1; Burnett pers. comm.).
Biologists of Boise Corporation assessed maps and walked throughout harvest units to
determine where WPAs would be most beneficial. WPAs commonly included snags,
downed wood and wildlife trees containing nests or nesting platforms. Other desirable
characteristics included talus, seeps, and large hardwoods (Burnett pers. comm.). In
general, tree density in mature stands and WPAs was ten trees/0.4 ha.
Bird Censuses
I established 76 census stations; 22 in clearcuts, 22 in WPAs and 32 in mature
forests, with a minimum separation of 150 m. Clearcut and WPA stations were
located within seven clearcuts, and mature forest stations were located within five
mature forests. Stations were located at the center of each WPA that was greater than
150 m from the harvest edge or from another sampled WPA. Point count stations
within clearcuts and mature forests were greater than 150 m apart and from the edge of
the harvest unit or forest stand. Stations were plotted in GIS and then located in the
field, however; in several instances they were determined in the field when unit
boundaries and harvest types differed from those delineated in GIS.
12
I completed off-road variable radius circular point count surveys following a
standardized protocol (Ralph et al. 1993, Fancy and Sauer 2000). I visited each census
station three times each year (2002-2003) between 15 May and 2 July with a minimum
of seven days separating the visits. During five-minute surveys I recorded all birds
seen or heard and estimated the distance of each bird to the nearest meter from the plot
center (Fancy and Sauer 2000). Estimating the distance to the nearest meter
minimized potential bias of including birds near 50 m that were actually outside of 50
m (Fancy and Sauer 2000). Point counts began at official sunrise and ended no later
than 10:00 (Ralph et al. 1993).
Vegetation Sampling
I collected vegetation data at each point count station using the releve
technique (Ralph et al. 1993), which described habitat characteristics relevant to bird
feeding and nesting and provided information on forest community composition and
structural characteristics. Heterogeneity of habitat determined plot size, resulting in an
average plot radius of 25 m and not exceeding 50 m. When the radius of WPAs was
less than 50 m, the WPA constituted the plot. Four classes of vegetation structure
were defined based solely on the plant height [overstory (Ž5 in), understory (Ž0.5 m
and <5 in), upper-ground, (Ž0.1 and <0.5 m), ground (<0.1 in)]. I quantified percent
'U__ ____ - - ___ __ -
13
cover of the four classes categorically (0 to 5%, 5 to 25%, 25 to 50%, 50 to 75% and
75 to 1 00%).
Data Analysis
Vegetation Composition
I converted the categorical cover variables to percentages using the midpoint
percent cover for each cover class for the analysis of the vegetative data. A PROC
UNIVARIATE calculated median values and interquartile range for overstory,
understory, upper-ground and ground cover (SAS Ver. 9 2002). A Kruskal-Wallis test
determined whether percent cover of the four vegetation layers varied among WPAs,
clearcuts and mature forests (SAS Ver. 9 2002).
The Nonparametric Multiple Comparison posthoc test, a nonparametric
equivalent to an ANOVA posthoc test, determined which treatments differed from
each other (R Ver. 1.9.0. 2004). The test used the Steel type procedure, designed for
nonparametric uncorrected data. I used a two-tailed test because I did not expect a
specific direction in the results. For all statistical analysis a p-value < 0.05 constituted
significance.
14
Species Richness and Abundance
I made a priori predictions of expected differences in species abundance
between clearcuts and mature forests using published studies on species distributions
and response to forest management in western coniferous forests (Table 2). I
predicted that forest interior obligate species or those that breed in late successional
forests would be more abundant in mature forests than clearcuts, while species that
prefer forest edge or early successional habitat would be less abundant in mature
forests than clearcuts. For species typically found in a wide range of habitats,
including both clearcuts and mature forests, I predicted that abundance between
clearcuts and mature forests would not differ.
Analysis included birds detected within 50 m of the point count station. This
is common practice because probability of detecting a bird within 50 m is theoretically
100%, and decreases at further distance (Schiek 1997). Additionally, the amount that
detection decreases at distances greater than 50 m varies among habitat type and bird
species (Schiek 1997). 1 omitted flyover detections and previously detected
individuals. I calculated average species richness by station per survey, and then
averaged the results for stations by treatment, for WPAs, clearcuts, WPAs and
clearcuts combined, and mature forests.
An index of abundance was calculated for the number of birds per station
(mean detection value per station by year) detected within 50 m in a five-minute

15
survey (abundance) and standard error (PROCMEAN, SAS Ver. 9 2002). I used the
mean number of detections from three visits to calculate abundance because I feel it is
more representative of the true number of birds, as opposed to the other standard
method of using maximum detections, and in addition this method decreases chances
of birds being double counted.
For all species detected in each treatment in both years abundance was
analyzed using a generalized linear model (PROC GENMOD, SAS Ver. 9 2002). The
model specified a Poisson distribution of bird abundance and log link (Seavy et al. In
press). Treatment and year were used as predictor variables in the model. When there
was no significant treatment by year interaction, I interpreted the main effects directly
and did not examine the year effect because a significant year effect alone would not
address the question of whether there were differences among treatments.
This study had two levels of potential pseudoreplication (Hurlbert 1984). The
first concern was that each point count station was visited multiple times in each year.
To mitigate for this concern, I used generalized estimating equations (GEE) that
adjusted for potential correlation among visits (Horton and Lipsitz 1999). 1 fit models
with treatment, year, and treatment by year interaction parameters, and used Score
statistics to determine whether these parameters significantly improved the fit of the
model to the data. I used the station as the repeated measure in analysis to take into
account replication between visits.
16
The second potential level of pseudoreplication resulted from the location of
stations in space. Although the distance between stations was sufficient to suggest
independence (Ralph et al. 1993), the stations were clustered as routes, and some
routes were clustered near one another. I ran a GEE model using maximum bird
detections per station per year as an attempt to account for spatial pseudoreplication,
but because the data were not normally distributed it was underdispersed, and could
not be fit to the model. I decided that the best way to analyze the data was with the
repeated station within the GEE that accounted for the single pseudoreplication issue
of repeated visits. I recognize that spatial layout was a confounding concern, thus I
interpreted the results with caution.
An additional analysis compared bird abundance by nest guild. Nest guilds for
the 15 species detected in each treatment in both years were drawn from Ehrlich et al.
(1988, Table 3). For those species, I determined whether abundance among treatments
was 1) similar between WPA and mature forest, 2) similar between WPA and clearcut
or 3) not different. I then assessed whether nest guild was correlated to the three
abundance relationships. Species abundance was not pooled among species within a
nest guild; as is typical in many studies, because results from such analysis do not
yield the percentage of species that drove the response. Rather, the data analyzed here
are the percentage of species within a nesting guild that exhibited a given relationship
between treatments.
17
In order to assess the effect of WPA size on the probability of species detection
(presence/absence) I used logistic regression (Agresti 1996). I limited this analysis to
the 2003 data because there was little variation in species presence at stations between
years. I scored a species as zero if it was not detected during any of the three surveys
and one if it was detected on any of the three surveys. I used PROC GENMOD and
specified binomial distribution and logit link; which output probability of detection
within WPA size classes based on the species scores (SAS Ver. 9 2002).
Results
Vegetation Composition
WPAs and mature forests had higher overstory, understory and ground cover
than clearcuts (Kruskal-Wallis test; Table 4, Fig. 2). Upper-ground cover was greatest
in mature forests, followed by WPAs and least in clearcuts (Table 4). The four cover
variables were significantly lower for clearcuts than for both WPAs and mature forests
(Nonparametric Multiple Comparison posthoc test; Table 4, Fig. 2). There was
significantly less upper-ground cover in WPAs compared with mature forests (Table
4, Fig. 2). The median value for upper-ground cover in WPAs falls at the lower end of
the interquartile range of values for mature forests (Fig. 2).
face
18
Species Richness and Bird Abundance
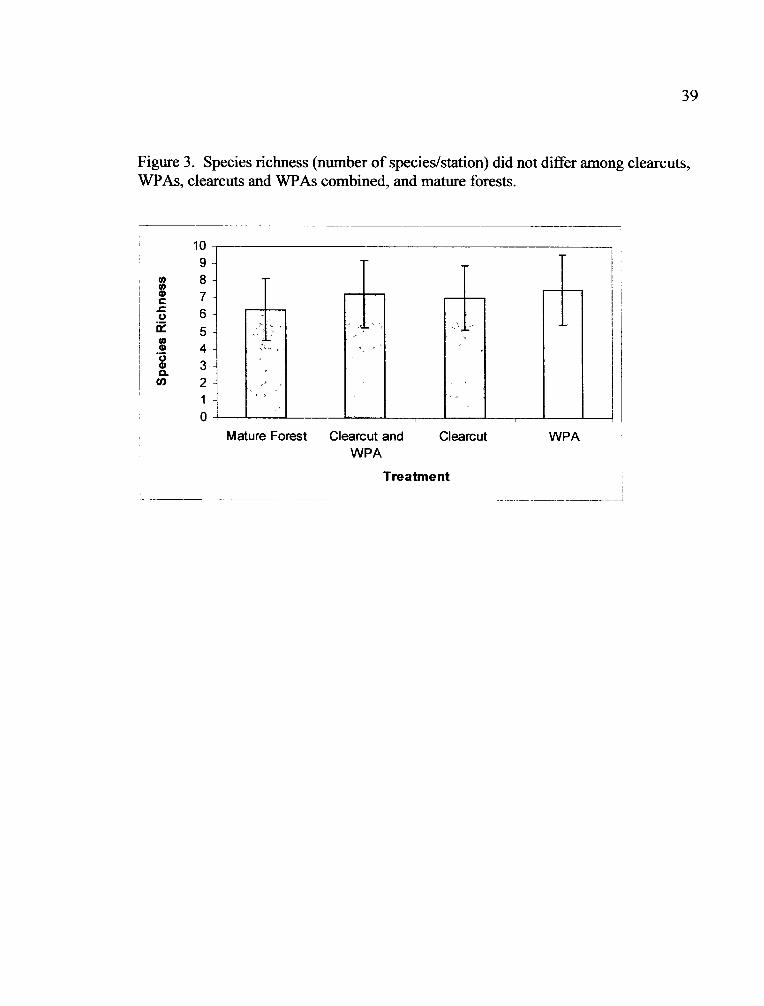
Species richness did not differ between clearcuts, WPAs, clearcuts and WPAs
combined, and mature forests (Fig. 3). A total of 62 bird species were detected over
the two years of the study (Appendix 1). Fifteen species occurred in all treatments in
both years (Table 5).
Predicted to be more abundant in mature forests than clearcuts
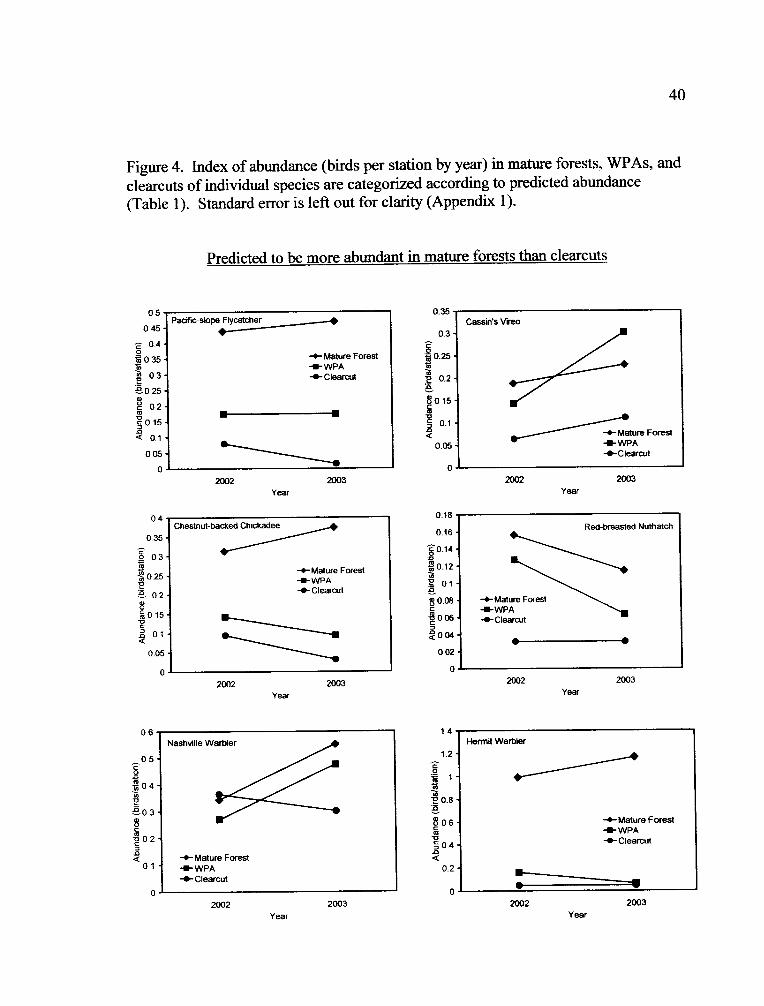
Six species were predicted to be more abundant in mature forests than
clearcuts (Table 1). Of those, Pacific-slope Flycatcher (Empidonax difficilis), Cassin's
Vireo (Vireo cassinii), Chestnut-backed Chickadee (Poecile rufescens), Red-breasted
Nuthatch (Sitta canadensis), and Hermit Warbler (Dendroica occidentalis) were more
abundant in mature forests than clearcuts. Pacific-slope Flycatcher, Chestnut-backed
Chickadee, and Hermit Warbler abundance within WPAs was more similar to
clearcuts (Fig. 4). Whereas, Cassin's Vireo and Red-breasted Nuthatch abundance in
WPAs was more similar to mature forests. Nashville Warblers (Vermivora
ruficapilla) did not differ in abundance between mature forests and clearcuts.
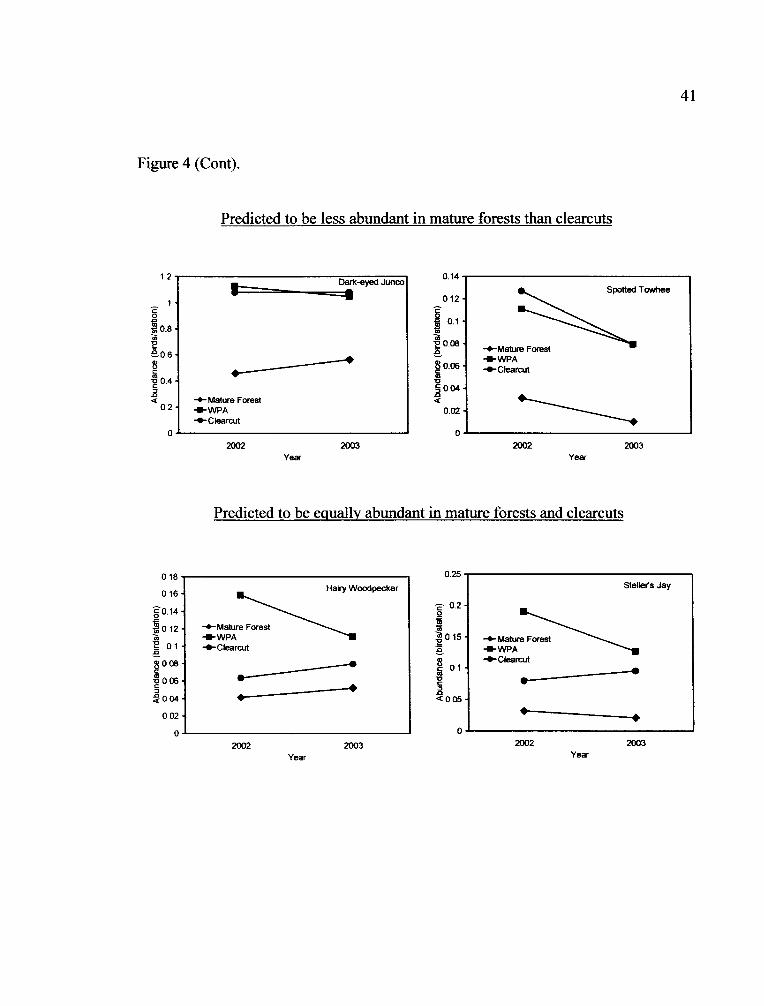
Predicted to be less abundant in mature forests than clearcuts
Two species were predicted to be less abundant in mature forests than clearcuts
(Table 1). The Dark-eyed Junco (Junco hyemalis) was less abundant in mature forests
19
than clearcuts and abundance within WPAs was more similar to clearcuts (Fig. 4).
Spotted Towhees (Pipilo maculatus) did not differ in abundance between mature
forests and clearcuts.
Predicted to be equally abundant in mature forests and clearcuts
Seven species were predicted not to differ in abundance between mature
forests and clearcuts (Table 1). Hairy Woodpecker (Picoides villosus), American
Robin (Turdus migratorius), and Black-headed Grosbeak (Pheucticus
melanocephalus) abundance did not differ between mature forests, clearcuts, and
WPAs. Steller's Jays (Cyanocitta stelleri) and Yellow-rumped Warblers (Dendroica
coronata) were more abundant in mature forests than clearcuts. Yellow-rumped
Warbler abundance within WPAs was more similar to mature forests and Steller's Jay
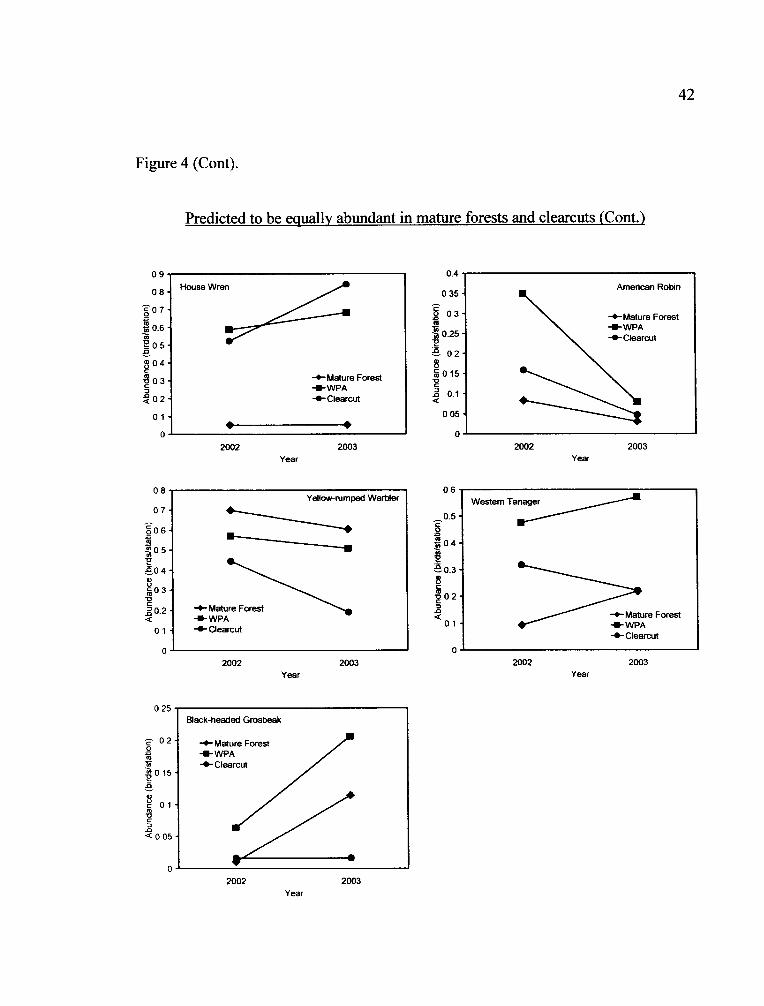
abundance in WPAs was in between clearcuts and mature forests (Fig. 4). House
Wrens (Troglodytes aedon) were less abundant in mature forests than clearcuts with
abundance in WPAs more similar to clearcuts. Abundance of Western Tanagers
(Piranga ludoviciana) differed between treatments and they were most abundant in
WPAs, followed by clearcuts, and least abundant in mature forests, with a treatment
by year interaction.
20
Nest Guild
Two of the four cavity nesting species, Chestnut-backed Chickadee and House
Wren, had similar abundance in WPAs and clearcuts (Table 3). Abundance of the
Red-breasted Nuthatch, which is a cavity nester, was more similar between WPAs and
mature forests. The fourth cavity nester, the Hairy Woodpecker did not differ in
abundance between treatments.
Of the eight cup nesting species, three had abundance in WPAs similar to
clearcuts: these were the Pacific-slope Flycatcher, Hermit Warbler, and Western
Tanager (Table 3). Two cup nesters, the Yellow-rumped Warbler and Cassin's Vireo,
had abundance in WPAs more similar to mature forests. The Steller's Jay had
abundance in WPAs between clearcuts and mature forests. Abundance did not differ
between treatments for the cup nesting Black-headed Grosbeak and American Robin.
Of the three ground nesters, only the Dark-eyed Junco had abundance in WPAs
more similar to clearcuts (Table 3). For the ground nesting Spotted Towhee and
Nashville Warbler abundance did not differ between treatments.
WPA Size
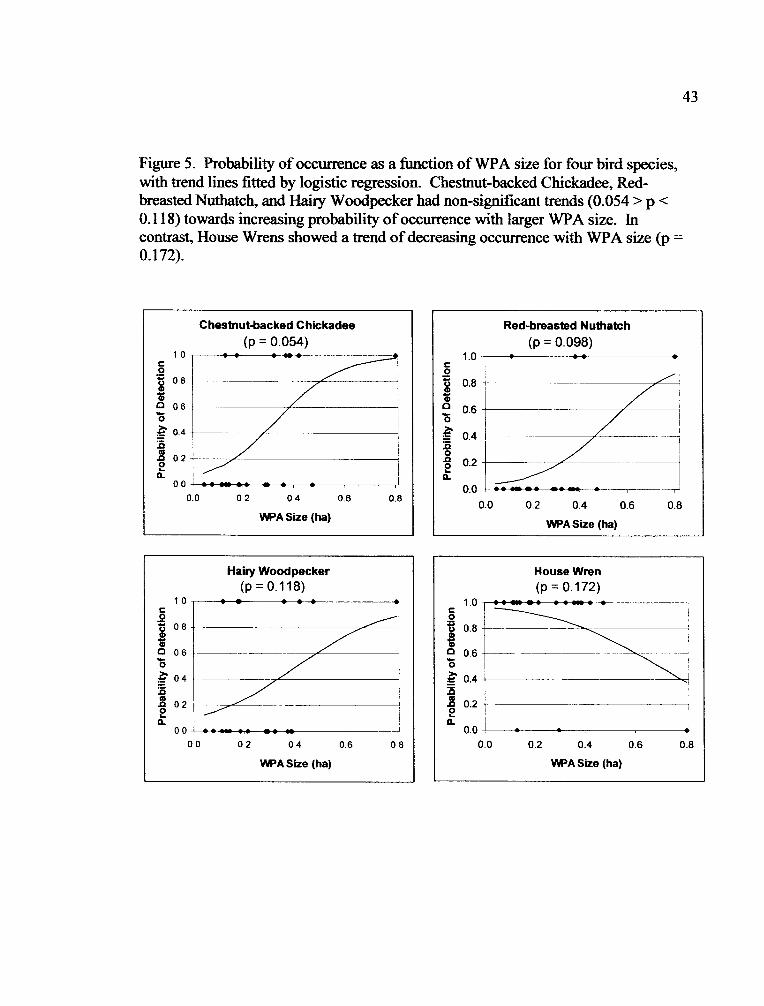
Results of logistic regression suggest the probability of detection of the 15
species detected in each treatment in both years was not correlated with WPA size.
However, the Chestnut-backed Chickadee, Red-breasted Nuthatch, and Hairy
lr�7_ ___ -
21
Woodpecker had non-significant trends of increasing probability of detection with
WPA size (Table 6, Fig. 5). The House Wren showed a non-significant decreased
probability of detection with increased WPA size (Table 6, Fig. 5).
Discussion
Species Richness and Bird Abundance
Although species richness did not differ between treatments (Fig. 3), my
results show that WPAs are providing habitat for only seven of the fifteen species
detected in each treatment in both years; two forest species, one edge specialist and
four habitat generalists (Table 5, Fig. 4). Cassin's Vireos and Red-breasted
Nuthatches were both more abundant in mature forests with abundance in WPAs more
similar to mature forests than to clearcuts, indicating that WPAs are providing habitat
for these two forest species. WPAs also provide habitat for Dark-eyed Juncos, an
edge specialist species with abundance higher in clearcuts than mature forests. In
addition, four habitat generalist species benefited from WPAs. Abundance of Steller's
Jays in WPAs was in between clearcuts and mature forests, with the highest
abundance in mature forests. Similarly, the Yellow-rumped Warbler was more
abundant in mature forests than clearcuts, with abundance in WPAs more similar to
mature forests. House Wrens, which were more abundant in clearcuts than mature
forests, had abundance in WPAs more similar to clearcuts. WPAs also appear to
or c --
22
benefit Western Tanagers, which were most abundant in WPAs, followed by clearcuts
and least abundant in mature forests.
Predicted to be more abundant in mature forests than clearcuts
Six species were predicted to be more abundant in mature forests than
clearcuts based on other scientific studies (Table 1), of those, five had similar results
in this study. Of those five species, three had abundance in WPAs more similar to
clearcuts and two more similar to mature forests. Only the Nashville Warbler did not
differ in abundance between treatments.
In agreement with current literature Pacific-slope Flycatchers were more
abundant in mature forests than clearcuts. In the Pacific Northwest, Pacific-slope
Flycatchers have been found with the highest densities in old growth forests, but have
also been found within habitats with trees of varying age classes (Carey et al. 1991,
Gilbert and Allwine 1991, Manuwal 1991, Ralph et al. 1991). However, Lehmkuhl
and Ruggiero (1991) ranked the vulnerability of the Pacific-slope Flycatcher to forest
fragmentation relatively low. Pacific-slope Flycatcher abundance within WPAs was
more similar to clearcuts than mature forests, suggesting that WPAs are not providing
habitat for this species.
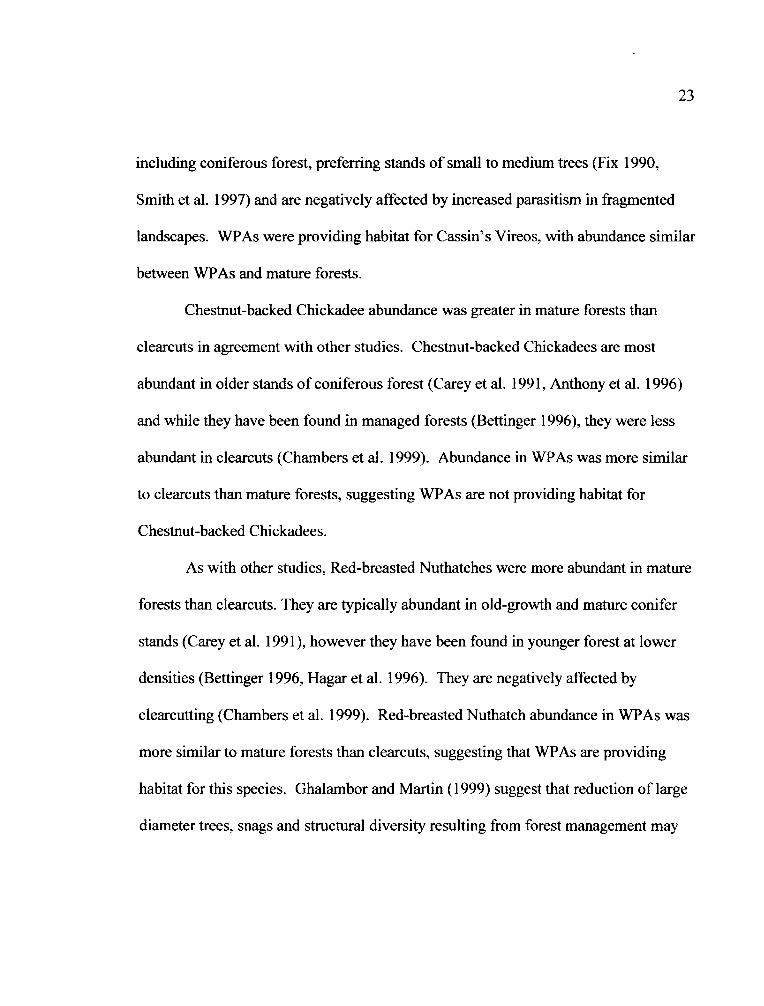
As with other scientific studies, Cassin's Vireo abundance was greater in
mature forests than clearcuts. Cassin's Vireos inhabit a variety of forest types
23
including coniferous forest, preferring stands of small to medium trees (Fix 1990,
Smith et al. 1997) and are negatively affected by increased parasitism in fragmented
landscapes. WPAs were providing habitat for Cassin's Vireos, with abundance similar
between WPAs and mature forests.
Chestnut-backed Chickadee abundance was greater in mature forests than
clearcuts in agreement with other studies. Chestnut-backed Chickadees are most
abundant in older stands of coniferous forest (Carey et al. 1991, Anthony et al. 1996)
and while they have been found in managed forests (Bettinger 1996), they were less
abundant in clearcuts (Chambers et al. 1999). Abundance in WPAs was more similar
to clearcuts than mature forests, suggesting WPAs are not providing habitat for
Chestnut-backed Chickadees.
As with other studies, Red-breasted Nuthatches were more abundant in mature
forests than clearcuts. They are typically abundant in old-growth and mature conifer
stands (Carey et al. 1991), however they have been found in younger forest at lower
densities (Bettinger 1996, Hagar et al. 1996). They are negatively affected by
clearcutting (Chambers et al. 1999). Red-breasted Nuthatch abundance in WPAs was
more similar to mature forests than clearcuts, suggesting that WPAs are providing
habitat for this species. Ghalambor and Martin (1999) suggest that reduction of large
diameter trees, snags and structural diversity resulting from forest management may
- ____ __ - ----- __ ___ __
24
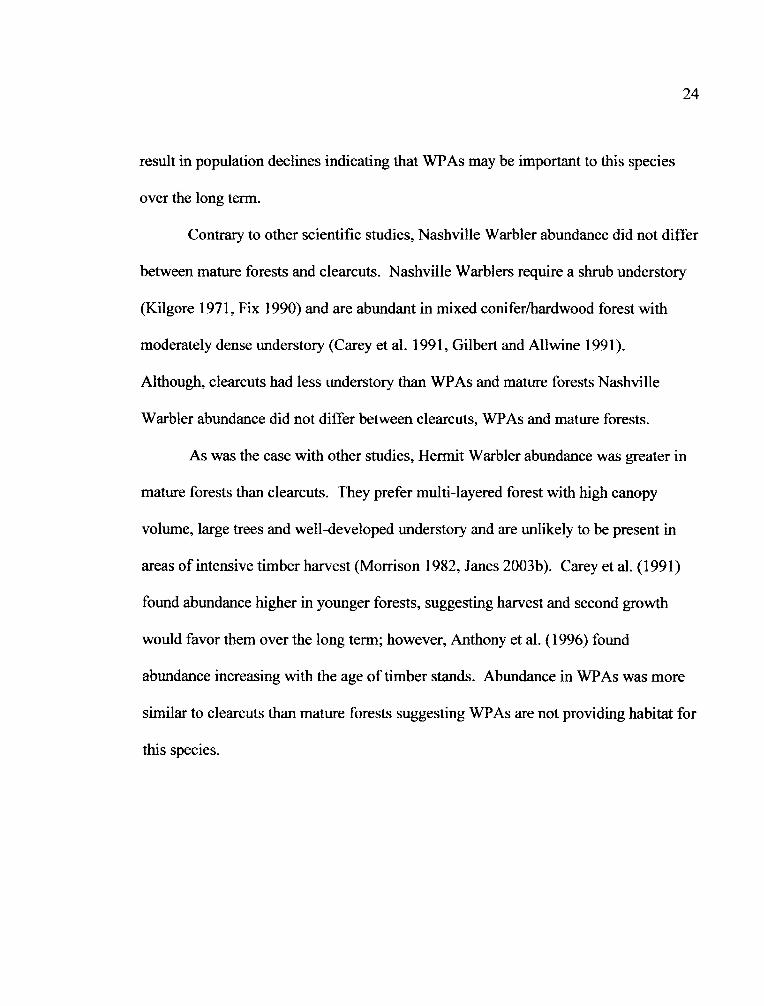
result in population declines indicating that WPAs may be important to this species
over the long term.
Contrary to other scientific studies, Nashville Warbler abundance did not differ
between mature forests and clearcuts. Nashville Warblers require a shrub understory
(Kilgore 1971, Fix 1990) and are abundant in mixed conifer/hardwood forest with
moderately dense understory (Carey et al. 1991, Gilbert and Allwine 1991).
Although, clearcuts had less understory than WPAs and mature forests Nashville
Warbler abundance did not differ between clearcuts, WPAs and mature forests.
As was the case with other studies, Hermit Warbler abundance was greater in
mature forests than clearcuts. They prefer multi-layered forest with high canopy
volume, large trees and well-developed understory and are unlikely to be present in
areas of intensive timber harvest (Morrison 1982, Janes 2003b). Carey et al. (1991)
found abundance higher in younger forests, suggesting harvest and second growth
would favor them over the long term; however, Anthony et al. (1996) found
abundance increasing with the age of timber stands. Abundance in WPAs was more
similar to clearcuts than mature forests suggesting WPAs are not providing habitat for
this species.
25
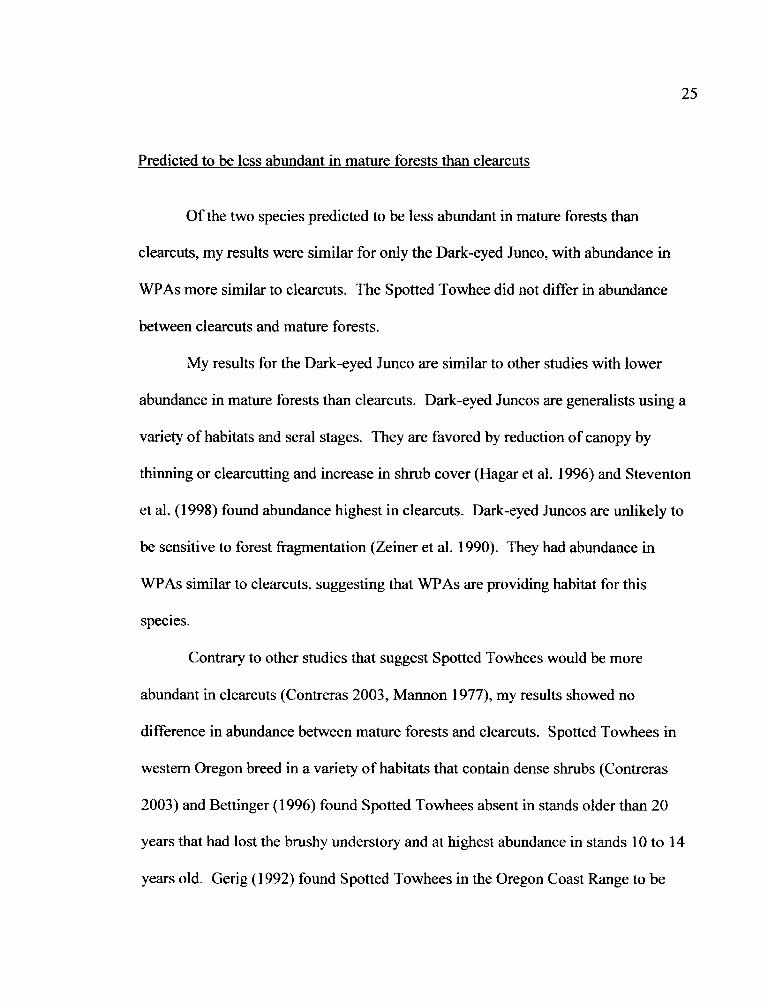
Predicted to be less abundant in mature forests than clearcuts
Of the two species predicted to be less abundant in mature forests than
clearcuts, my results were similar for only the Dark-eyed Junco, with abundance in
WPAs more similar to clearcuts. The Spotted Towhee did not differ in abundance
between clearcuts and mature forests.
My results for the Dark-eyed Junco are similar to other studies with lower
abundance in mature forests than clearcuts. Dark-eyed Juncos are generalists using a
variety of habitats and seral stages. They are favored by reduction of canopy by
thinning or clearcutting and increase in shrub cover (Hagar et al. 1996) and Steventon
et al. (1998) found abundance highest in clearcuts. Dark-eyed Juncos are unlikely to
be sensitive to forest fragmentation (Zeiner et al. 1990). They had abundance in
WPAs similar to clearcuts, suggesting that WPAs are providing habitat for this
species.
Contrary to other studies that suggest Spotted Towhees would be more
abundant in clearcuts (Contreras 2003, Mannon 1977), my results showed no
difference in abundance between mature forests and clearcuts. Spotted Towhees in
western Oregon breed in a variety of habitats that contain dense shrubs (Contreras
2003) and Bettinger (1996) found Spotted Towhees absent in stands older than 20
years that had lost the brushy understory and at highest abundance in stands 10 to 14
years old. Gerig (1992) found Spotted Towhees in the Oregon Coast Range to be
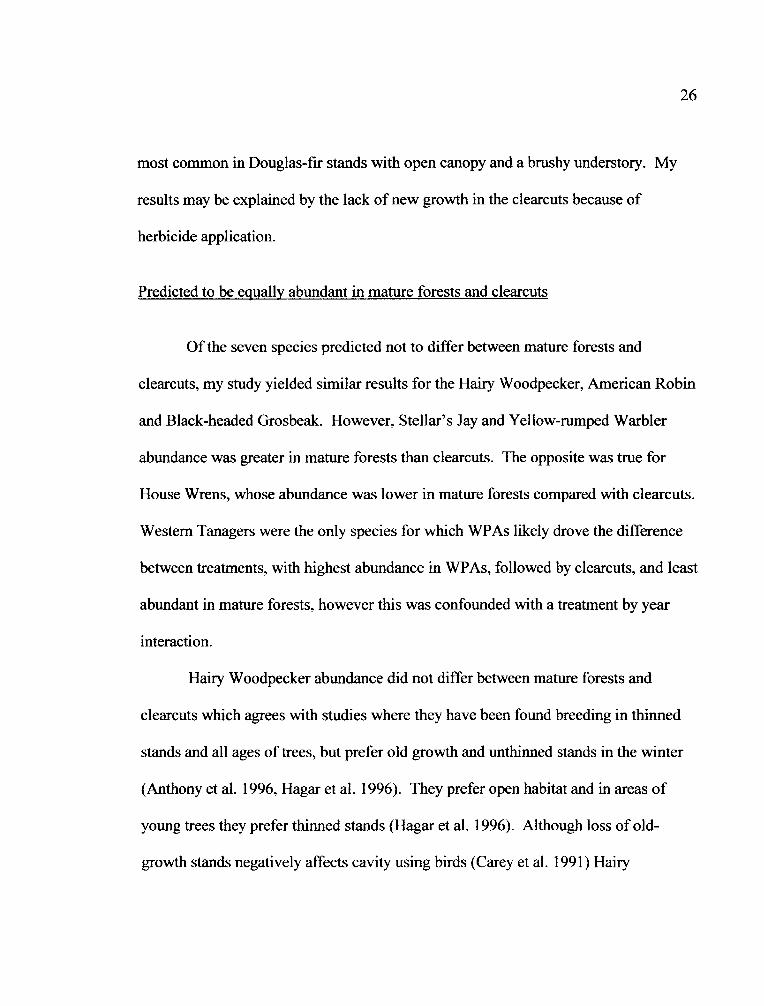
26
most common in Douglas-fir stands with open canopy and a brushy understory. My
results may be explained by the lack of new growth in the clearcuts because of
herbicide application.
Predicted to be equally abundant in mature forests and clearcuts
Of the seven species predicted not to differ between mature forests and
clearcuts, my study yielded similar results for the Hairy Woodpecker, American Robin
and Black-headed Grosbeak. However, Stellar's Jay and Yellow-rumped Warbler
abundance was greater in mature forests than clearcuts. The opposite was true for
House Wrens, whose abundance was lower in mature forests compared with clearcuts.
Western Tanagers were the only species for which WPAs likely drove the difference
between treatments, with highest abundance in WPAs, followed by clearcuts, and least
abundant in mature forests, however this was confounded with a treatment by year
interaction.
Hairy Woodpecker abundance did not differ between mature forests and
clearcuts which agrees with studies where they have been found breeding in thinned
stands and all ages of trees, but prefer old growth and unthinned stands in the winter
(Anthony et al. 1996, Hagar et al. 1996). They prefer open habitat and in areas of
young trees they prefer thinned stands (Hagar et al. 1996). Although loss of old-
growth stands negatively affects cavity using birds (Carey et al. 1991) Hairy
27
Woodpeckers can persist in managed forests and clearcuts if snags are retained
(Nelson 1988) and patches of foraging habitat are present (Weikel and Hayes 1999).
Steventon et al. (1998) found Hairy Woodpeckers nesting in scattered trees within
clearcuts.
Steller's Jays were more abundant in mature forest compared with clearcuts.
Although the literature was inconsistent (Greene et al. 1998, Weikel 2003), this result
fits with some other findings that although they are tolerant of many habitat types
(Carey et al. 1991, Gilbert and Allwine 1991, Bettinger 1996), they are less abundant
within clearcuts (Chambers et al. 1999, Hansen et al. 1995). Steller's Jay abundance
in WPAs was in between clearcuts and mature forests; suggesting WPAs may benefit
this species.
Contrary to other studies, House Wrens were less abundant in mature forests
than clearcuts. House Wrens use a variety of natural and human-influenced habitats
and are tolerant of habitat change. They nest in a variety of habitats, including open
conifer forests, thinned conifer forest and clearcuts (Gilligan 1994, Fix 1990).
In this study, lower abundance of House Wrens in mature forests may be explained by
higher understory density. Abundance within WPAs was more similar to clearcuts
than mature forests and hence, WPAs may benefit this species.
Consistent with current literature, no difference in American Robin abundance
was detected between mature forests and clearcuts. The American Robin is unlikely
28
sensitive to fragmentation because they are habitat generalists and do well in forests,
as well as human-dominated landscapes (Sallabanks 2003). Studies show no
difference in abundance of American Robins between various timber treatments,
including clearcuts, young, mature, and old-growth forests (McGarigal and McComb
1995, Chambers et al. 1999, Hansen et al. 1995).
Yellow-rumped Warblers are generalist feeders and use a variety of habitats
for breeding (Janes 2003a). Contrary to this generalist behavior, in this study they
were more abundant in mature forests than clearcuts. They inhabit open coniferous
forest (Janes 2003a). Steventon et al. (1998) found Yellow-rumped Warblers to be
most abundant in a 60% canopy removal thin, compared with 30% canopy removal
thin, clearcut, and uncut stands. Abundance within WPAs was more similar to mature
forests than clearcuts, suggesting WPAs are serving as habitat.
Contrary to other studies, Western Tanager abundance differed between
treatments. However, this is the only species included in this study for which the
relationship was likely driven by WPAs. They were most abundant in WPAs,
followed by clearcuts, and least abundant in mature forests, with a treatment by year
interaction. Western Tanagers will breed in coniferous forest with open canopy and
were not associated with stand age in the west Cascades (Bettinger 1996, Gilbert and
Allwine 1991), but in the southern Coast Range of Oregon they have been associated
with young forests (Carey et al. 1991). They are found in areas with broken canopy
face
29
within denser forests (Hansen et al. 1995). WPAs promoted abundance of Western
Tanagers.
As was the case in other studies, Black-headed Grosbeak abundance did not
differ between treatments. Several studies showed that Black-headed Grosbeaks breed
in a variety of habitats abundant in open mixed conifer hardwood forests often
indicative of younger forests (Carey et al. 1991, Gilbert and Allwine 1991) and prefer
habitat edges and patches (Trail 2003). However, Hutto et al. (1992) found that they
avoided clearcuts in the years immediately after harvest.
Nest Guild
I assessed whether nest guild explained differences in bird abundance among
treatments. For each of the three nest categories; cavity, cup, and ground, there were
species with no difference in abundance between treatments, species with abundance
in WPAs more similar to mature forests, and species with abundance in WPAs more
similar to clearcuts (Table 3). One out of four cavity nesting species had abundance
more similar in WPAs and mature forests, suggesting that WPAs do not provide
habitat for most cavity nesting species. This may be because WPAs do not maintain
sufficient standing dead wood for nest sites or may be related to larger habitat
insufficiencies. The abundance of cup nesters was split almost evenly between WPAs
lr�_ __ ___ - --- -- __ - __ --
30
more similar to clearcuts and WPAs more similar to mature forests. Overall, the data
did not show a relationship between nesting guild and bird abundance within WPAs.
WPA Size
No species showed a significant correlation between likelihood of detection
and WPA size (Table 6). However, the Chestnut-backed Chickadee had a non-
significant increase in presence with increased WPA size that promotes further study
(Fig. 5). McGarigal and McComb (1995) found abundance of Chestnut-backed
Chickadees strongly affected by habitat area at a larger scale. This literature suggests
that Chestnut-backed Chickadees may be able to utilize small patches like WPAs more
than clearcuts. Also non-significant, increasing trends of detection with WPA size
stood out for Hairy Woodpecker and Red-breasted Nuthatch and a non-significant
decreasing trend for the House Wren (Fig. 5). For species that are less abundant in
WPAs than in the mature forest, it is possible that WPA size is important. However,
studies have shown that forest patches less than 10 ha in size maintain few to no forest
interior species (Robbins et al. 1989a, Freemark and Collins 1989). Freemark and
Collins (1989) found that patches 54-65 ha in size maintained greater than half of the
local forest interior and area sensitive species, while Robbins et al. (1989) found that
forest fragments greater than 3000 ha were necessary to maintain all area sensitive
species in the Mid-Atlantic United States.
31
Conclusion
The objective of this study was to determine whether WPAs were effective in
providing habitat for birds, and if so, whether those species were as abundant in
mature forests or clearcuts. WPAs are meeting the short term goal of maintaining
wildlife habitat within clearcuts for seven of the fifteen species included in this
analysis; two forest species; Red-breasted Nuthatch and Cassin's Vireo, one edge
specialist; Dark-eyed Junco and four habitat generalists; Western Tanager, Steller's
Jay, Yellow-rumped Warbler, and House Wren. The alternate hypothesis, which
indicated that WPAs were successful in maintaining forest habitat, was true for the
Red-breasted Nuthatch and Cassin's Vireo, which had abundance in WPAs more
similar to mature forest and greater than clearcuts. WPAs sampled in this study did
not maintain habitat for most species predicted to be more abundant in mature forests
than clearcuts, which may be explained by the relatively small size of WPAs included
in this study. Although non-significant, several species had potential increasing trends
of presence with WPA size. Future study should include larger WPAs over a broader
range of sizes to assess whether WPAs have the potential to support additional forest
species at abundance similar to mature forests.
32
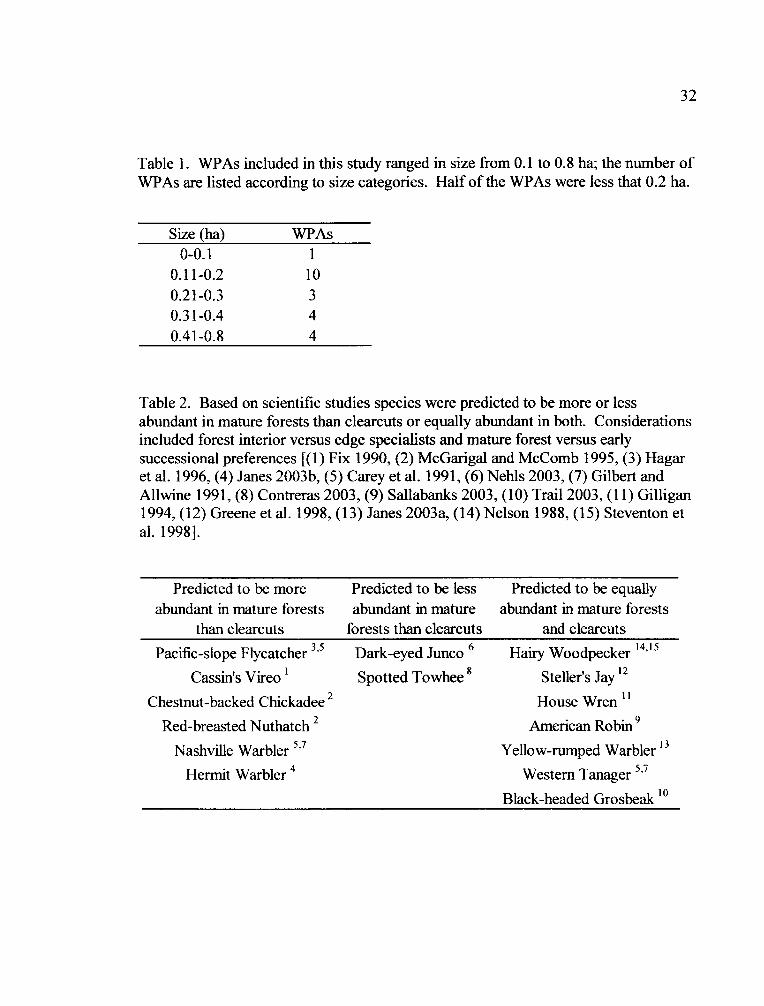
Table 1. WPAs included in this study ranged in size from 0.1 to 0.8 ha; the number ofWPAs are listed according to size categories. Half of the WPAs were less that 0.2 ha.
Size (ha) WPAs0-0.1 1
0.11-0.2 100.21-0.3 30.31-0.4 40.41-0.8 4
Table 2. Based on scientific studies species were predicted to be more or lessabundant in mature forests than clearcuts or equally abundant in both. Considerationsincluded forest interior versus edge specialists and mature forest versus earlysuccessional preferences [(1) Fix 1990, (2) McGarigal and McComb 1995, (3) Hagaret al. 1996, (4) Janes 2003b, (5) Carey et al. 1991, (6) Nehls 2003, (7) Gilbert andAllwine 1991, (8) Contreras 2003, (9) Sallabanks 2003, (10) Trail 2003, (11) Gilligan1994, (12) Greene et al. 1998, (13) Janes 2003a, (14) Nelson 1988, (15) Steventon etal. 1998].
Predicted to be more Predicted to be less Predicted to be equallyabundant in mature forests abundant in mature abundant in mature forests
than clearcuts forests than clearcuts and clearcuts
Pacific-slope Flycatcher 3'5 Dark-eyed Junco 6 Hairy Woodpecker 14,15
Cassin's Vireo 1 Spotted Towhee 8 Steller's Jay 12
Chestnut-backed Chickadee 2 House Wren 11
Red-breasted Nuthatch 2 American Robin 9
Nashville Warbler 5' 7 Yellow-rumped Warbler 13
Hermit Warbler 4 Western Tanager 5'7
Black-headed Grosbeak' 0
S -s7
33
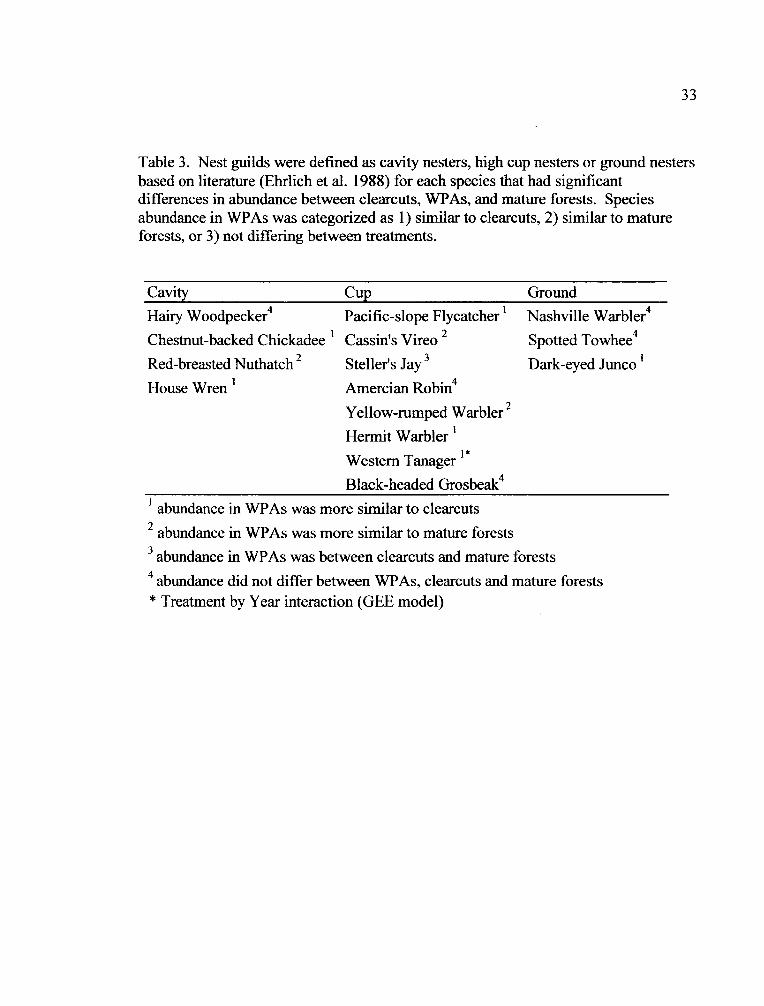
Table 3. Nest guilds were defined as cavity nesters, high cup nesters or ground nestersbased on literature (Ehrlich et al. 1988) for each species that had significantdifferences in abundance between clearcuts, WPAs, and mature forests. Speciesabundance in WPAs was categorized as 1) similar to clearcuts, 2) similar to matureforests, or 3) not differing between treatments.
Cavity Cup Ground
Hairy Woodpecker 4 Pacific-slope Flycatcher Nashville Warbler4
Chestnut-backed Chickadee ' Cassin's Vireo 2 Spotted Towhee4
23Red-breasted Nuthatch Steller's Jay 3 Dark-eyed Junco
House Wren Amercian Robin4
Yellow-rumped Warbler 2
Hermit Warbler l
Western Tanager *
Black-headed Grosbeak4
'abundance in WPAs was more similar to clearcuts
2abundance in WPAs was more similar to mature forests3 abundance in WPAs was between clearcuts and mature forests
4abundance did not differ between WPAs, clearcuts and mature forests* Treatment by Year interaction (GEE model)
34
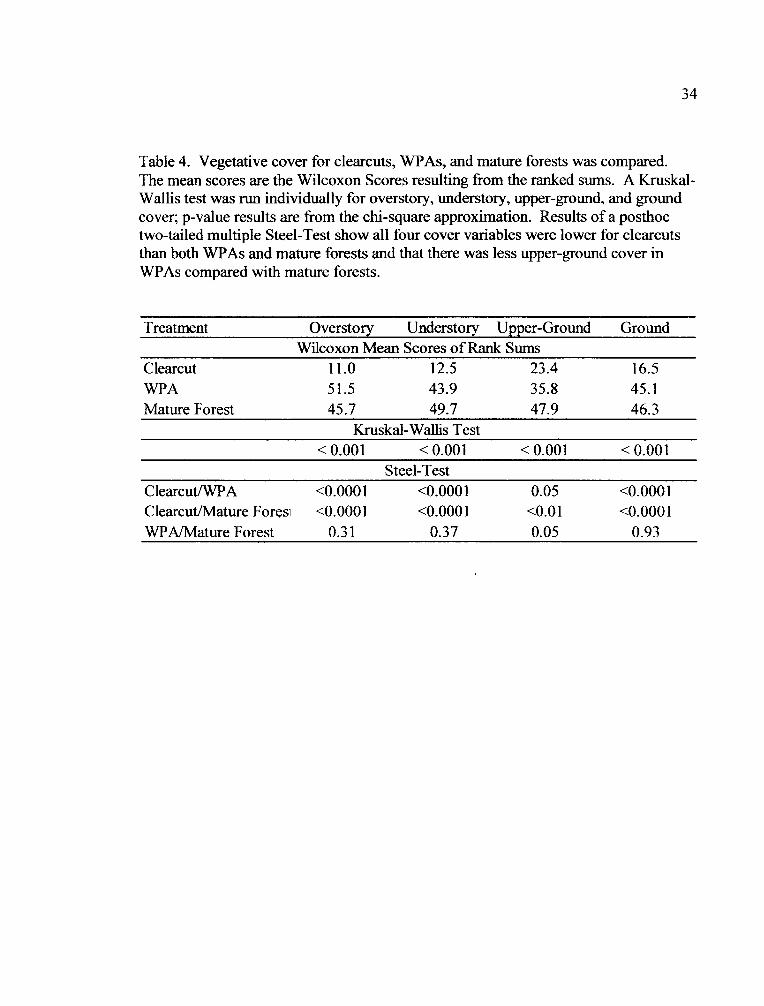
Table 4. Vegetative cover for clearcuts, WPAs, and mature forests was compared.The mean scores are the Wilcoxon Scores resulting from the ranked sums. A Kruskal-Wallis test was run individually for overstory, understory, upper-ground, and groundcover; p-value results are from the chi-square approximation. Results of a posthoctwo-tailed multiple Steel-Test show all four cover variables were lower for clearcutsthan both WPAs and mature forests and that there was less upper-ground cover inWPAs compared with mature forests.
Treatment Overstory Understory Upper-Ground GroundWilcoxon Mean Scores of Rank Sums
Clearcut 11.0 12.5 23.4 16.5WPA 51.5 43.9 35.8 45.1Mature Forest 45.7 49.7 47.9 46.3
Kruskal-Wallis Test<0.001 <0.001 <0.001 <0.001
Steel-TestClearcut/WPA <0.0001 <0.0001 0.05 <0.0001Clearcut/Mature Foresi <0.0001 <0.0001 <0.01 <0.0001WPA/Mature Forest 0.31 0.37 0.05 0.93
35
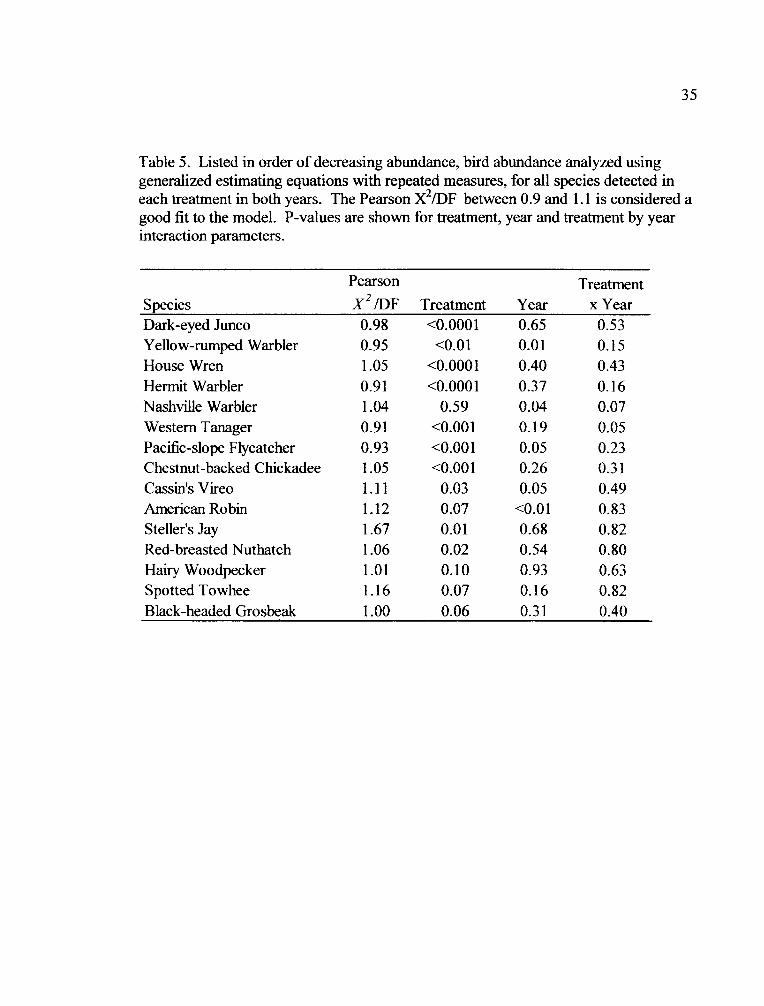
Table 5. Listed in order of decreasing abundance, bird abundance analyzed usinggeneralized estimating equations with repeated measures, for all species detected ineach treatment in both years. The Pearson X2/DF between 0.9 and 1.1 is considered agood fit to the model. P-values are shown for treatment, year and treatment by yearinteraction parameters.
Pearson Treatment
Species X 2 /DF Treatment Year x YearDark-eyed Junco 0.98 <0.0001 0.65 0.53Yellow-rumped Warbler 0.95 <0.01 0.01 0.15House Wren 1.05 <0.0001 0.40 0.43Hermit Warbler 0.91 <0.0001 0.37 0.16Nashville Warbler 1.04 0.59 0.04 0.07Western Tanager 0.91 <0.001 0.19 0.05Pacific-slope Flycatcher 0.93 <0.00 1 0.05 0.23Chestnut-backed Chickadee 1.05 <0.001 0.26 0.31Cassin's Vireo 1.11 0.03 0.05 0.49American Robin 1.12 0.07 <0.01 0.83Steller's Jay 1.67 0.01 0.68 0.82Red-breasted Nuthatch 1.06 0.02 0.54 0.80Hairy Woodpecker 1.01 0.10 0.93 0.63Spotted Towhee 1.16 0.07 0.16 0.82Black-headed Grosbeak 1.00 0.06 0.31 0.40
�L___ __ - __ - - __ - - --- - - - .-
36
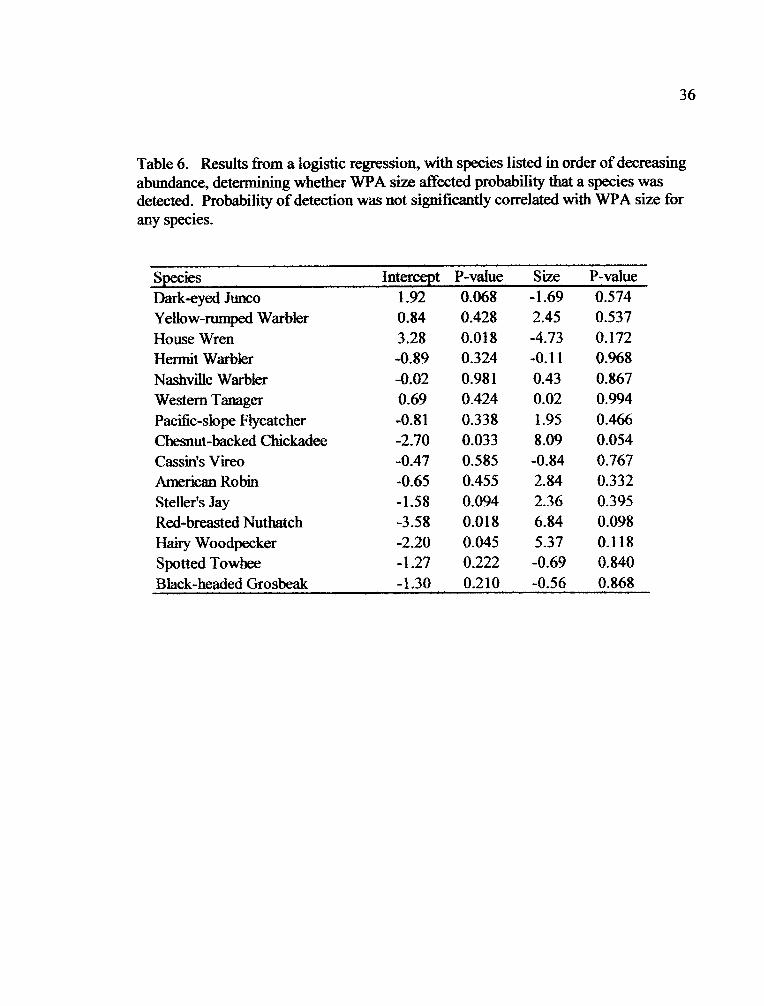
Table 6. Results from a logistic regression, with species listed in order of decreasingabundance, determining whether WPA size affected probability that a species wasdetected. Probability of detection was not significantly correlated with WPA size forany species.
SpeciesDark-eyed JuncoYellow-rumped WarblerHouse WrenHermit WarblerNashville WarblerWestern TanagerPacific-slope FlycatcherChesnut-backed ChickadeeCassin's VireoAmerican RobinSteller's JayRed-breasted NuthatchHairy WoodpeckerSpotted TowheeBlack-headed Grosbeak
Intercept1.920.843.28-0.89-0.020.69-0.81-2.70-0.47-0.65-1.58-3.58-2.20-1.27-1.30
P-value0.0680.4280.0180.3240.9810.4240.3380.0330.5850.4550.0940.0180.0450.2220.210
Size P-value-1.69 0.5742.45 0.537-4.73 0.172-0.11 0.9680.43 0.8670.02 0.9941.95 0.4668.09 0.054-0.84 0.7672.84 0.3322.36 0.3956.84 0.0985.37 0.118-0.69 0.840-0.56 0.868
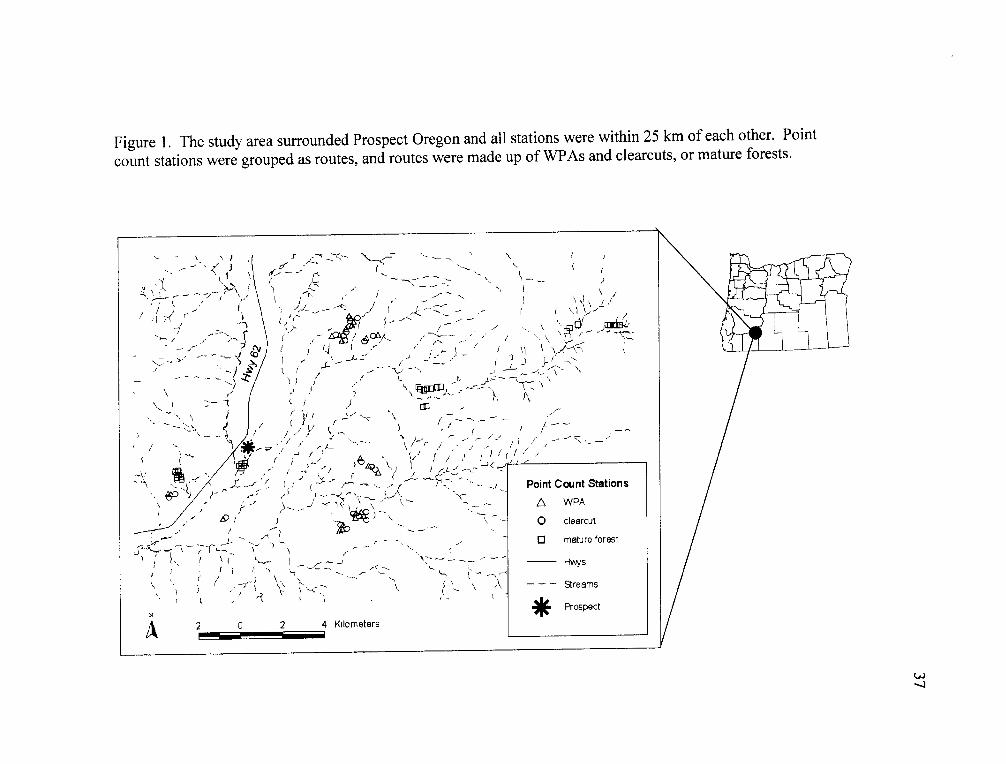
Figure 1. The study area surrounded Prospect Oregon and all stations were within 25 km of each other. Point
count stations were grouped as routes, and routes were made up of WPAs and clearcuts, or mature forests.
- \ *\)
I 'N
I �-. C
K
--
- K',-' &Ij
��1-
/ I I
Kx
r Y- N <
K~~~~~~~~
','00~~ 0 ' I ,o+
'2 !,.- -/ o -v \
) / * / N \
-t1 4 j< r ~ - / Point Count Stations
A_ / L; } r _ . WPA
2? -- ) \ .\~_ O clearcut
/ 9 r-- _ O~~~~~~~~~~[ mature forest
,r -N _ _ /H1
- - -Streams
* Prospect
Ai 2 0 2 4 Kilometers
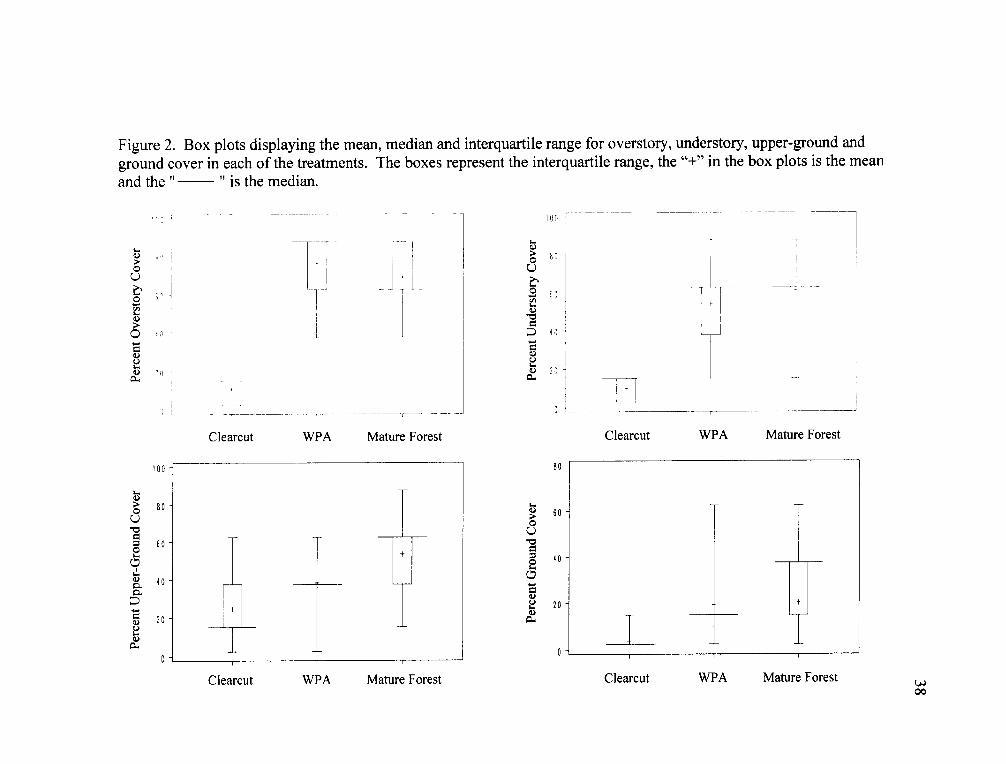
Figure 2. Box plots displaying the mean, median and interquartile range for overstory, understory, upper-ground andground cover in each of the treatments. The boxes represent the interquartile range, the "+" in the box plots is the meanand the " " is the median.
0(j0
01.
4)
U
a)
F_1Q.
0
U
3-
0.)7-
43 -- -- _ _
I 2o
60 r -I T _
?0 O -I I
Clearcut WPA Mature Forest
100 - s0 -
0)
0
L.-
U
0.)
C-
60
40
20
O
X I1-
0)
0U
I-
0.)
60 -
40 -
20 -
Clearcut WPA Mature Forest
T T~~~~~~~~~~
0 -
Clearcut WPA Mature Forest Clearcut WPA Mature Forest00
39
Figure 3. Species richness (number of species/station) did not differ among clearcuts,WPAs, clearcuts and WPAs combined, and mature forests.
U,00C
i000.
10987654321o i I I I_ _ I I _ _ _ I _ _ _
I ~~Mature Forest Clearcut and Clearcut WPA II ~~~~WPA
TreatmentI
40
Figure 4. Index of abundance (birds per station by year) in mature forests, WPAs, and
clearcuts of individual species are categorized according to predicted abundance(Table 1). Standard error is left out for clarity (Appendix 1).
Predicted to be more abundant in mature forests than clearcuts
05
045
c 04
1035
t 03
D 0 25
c8 0 2
cO 15
< 01-
005-
0-
04
0 35
2 03
u, 0 25
S 028I O 15
3 0 1
0.05
0
035 -
Pafic-slope Filycher
+-Mature Forest-0-WPA-*Clbarcut
0.3-c0E
j 0.25 -
X 0.2-D
iO O. 1Cco
, 0.1 .
0.05.
Cassin's Vreo
-4-Mature ForestWWPA
-0-Clearcut
2002 2003Year
O 2002 2003
Year
1R .O
Chestnut-backed Chickadee
-4-Mature Forest-_WPA--Clearcut
0.16
ZO-140~
Z 0.12-
-s 01-
80.08-C
vD 0 06-
D<o 004
0 02
Red-breasted Nuthatch
iiure Forest \'Aarcut
-4-Mat-WV-F-0-Cle
O,
2002 2003 2002 2003
Year Year
2002 2003 2002Year
2003Year
IFd o- - - - -
41
Figure 4 (Cont).
Predicted to be less abundant in mature forests than clearcuts
ro
72
8cXX
3'
I z - Dark-eyed Junco
,1 _
0.8
.06
04
--Mature Forest0 2 -U-WPA
-*-Clearcut
0.14
012
C0Ei 0.1
2 0.08
8 0.06c
, 0 04
0.02
Spote Towhee
--Mature Forest-U-WPA4- Clearcut
0 O
2002 2003 2002 2003Year Year
Predicted to be equally abundant in mature forests and clearcuts
0 18
0 16-
EO.14
,, 0 12Z0
0 1 -8008
'a 0 06.
iR 0 04
0 02
2002 2003Year
2002 2003Year
A;- -
42
Figure 4 (Cont).
Predicted to be equally abundant in mature forests and clearcuts (Cont.)
08
07
'M 06 -*0
804-a:9 0 3 (U
Zc 0 4203-
0 1
n.
.House Wren
-+-Mature Forest-_WPA-0-Clearcut
Iizi
(U-o!nS
u
2002 2003Year
0 8-Yellow-rumped Warbler
07 -
\06 _0 .
.04
03 -
0.2 -+-Mature Forest- WPA
0 1 4- Cearcut
0.2002 2003
Year
025 1
0.
03
C2 0o
Vi 0.2
* 0
C8
.o0.
0C
2
to
Cn
.0
4
5.-
3.-
5.-
2
5.-
'5.
2002 2003Year
Amencan Robin
-+-Mature Forest-N-WPA-0- Clearcut
i -
I -
I
Western Tanager
-- +Mature Forest_- WPA-0- Clearcut
0
2002 2003Year
c 02-0ii
a015 -
a
C8 0 1 v-0to
<0 05 -
0
Black-headed Grosbeak
-+-Mature Forest-_WPA-0- Clearcut
202 00
V2002 2003
Year
43
Figure 5. Probability of occurrence as a function of WPA size for four bird species,with trend lines fitted by logistic regression- Chestnut-backed Chickadee, Red-breasted Nuthatch, and Hairy Woodpecker had non-significant trends (0.054 > p <0. 118) towards increasing probability of occurrence with larger WPA size. Incontrast, House Wrens showed a trend of decreasing occurrence with WPTA size (p =
0.172).
Chestnut-backed Chickadee
(p =0.054)10 -D
0
Q 0 6__0
O064
0
0.
0.0 0 2 0 4 0.6 0.8
WVPA Size (ha)
Red-breasted Nuthatch(p = 0.098)
C0
0
.00a.
0.0 0.2 0.4 0.6 0.8
WPA Size (ha)
Hairy Woodpecker(p = 0.118)
1 0C0- 0 8
O 060
.0 024
.0
0.
0 0
pp pep
I .. -�______
i"� iZ
House Wren(p =0.172)
1.0 .. =.;:-
0.
~0.6 _-
04
02
0.0
0.0 0.2 0.4 0.6 0.8
WVPA Size (ha)
4--
:,e e
0 0 0 2 04 06 0
WVPA Size (ha)
0.6 0 8
44
Literature Cited
Agresti, A. 1996. An Introduction to Categorical Data Analysis. John Wiley andSons, Inc. New York, New York.
Anthony R.G., G.A. Green, E.D. Forsman, and S.K. Nelson. 1996. Avian abundancein riparian zones of three forest types in the Cascade Mountains, Oregon. WilsonBulletin 108:280-291.
Arnett, E.B. and R. Sallabanks. 1998. Land manager perceptions of avian researchand information needs: A case study. Pages 399-413 In Avian Conservation: Researchand Management. J. M. Marzlusff and R. Sallabanks, editors. Island, Covelo,California, USA.
Bettinger, K. 1996. Bird communities in 5- to 34- year old managed Douglas-firstands on the Willamette National Forest, Oregon Cascades. M.S. thesis, Oregon StateUniversity, Corvallis.
Carey, A.B., M.M. Hardt, S.P. Horton, and B.L. Biswell. 1991. Spring birdcommunities in the Oregon Coast Range. Pages 123-142 In Wildlife and Vegetationof Unmanaged Douglas-fir Forests. L.F. Ruggiero, K.B. Aubry, A.B. Carey, andM.H. Huff, editors. United States Department of Agriculture, Forest Service, GeneralTechnical Report PNW-GTR-285. Portland, OR.
Chambers, C.L., W.C. McComb, and J.C. Tappeiner II. 1999. Breeding bird responseto three silvicultural treatments in the Oregon Coast Range. Ecological Applications9:171-185.
Contreras, A.L. 2003. Spotted Towhee. Pages 533-536 In Birds of Oregon: AGeneral Reference. D.B. Marshall, M.G. Hunter and A.L. Contreras, editors. OregonState University Press, Corvallis, OR.
Donovon, T.M., F.R. Thompson III, J. Faaborg and J.R. Probst. 1995. Reproductivesuccess of migratory birds in habitat sources and sinks. Conservation Biology 9:1380-1385.
Duguay, J.P., P.B. Wood and J.V. Nichols. 2001. Songbird abundance and avian nestsurvival rates in forests fragmented by different silvicultural treatments. ConservationBiology 15:1405-1415.
fL-- __ - __ __
45
Ehrlich, P.R., D.S. Dobkin, D. Wheye. 1988. The Birder's Handbook. Simon andSchuster Inc. New York, New York.
Fancy, S.G. and J.R. Sauer. 2000. Recommended methods for inventorying andmonitoring landbirds in national parks.http://www.nature.nps.gov/im/monitor/birds/htm, Dec. 4, 2004.
Fix, D. 1990. Birds of Diamond Lake Ranger District. Unpublished Manuscript.URL=http://osu.orst.edu/pubs/birds/county/doug/dlrd, Sep. 20, 2002.
Freemark, K. and B. Collins. 1989. Landscape ecology of birds breeding in temperateforest fragments. Pages 443-454 In Ecology and Conservation of Neotropical MigrantBirds. Manomet Symposium.
Gerig, R. 1992. Breeding birds of the Coast Range: a comparison of the species mixin successional forest communities in Polk County. Oregon Birds 18:7-10.
Ghalamber, C.K. and T.E. Martin. 1999. Red-breasted Nuthatch (Sitta canadensis).The Birds of North America, No. 459. A. Poole and F. Gill, editors. The Birds ofNorth America, Inc., Philadelphia, PA.
Gilbert, F.F. and R. Allwine. 1991. Spring bird communities in the Oregon CascadeRange. Pages 144-158 In Wildlife and Vegetation of Unmanaged Douglas-fir Forests.L.F. Ruggiero, K.B. Aubry, A.B. Carey, and M.H. Huff, editors. United StatesDepartment of Agriculture, Forest Service, General Technical Report PNW-GTR-285.Portland, OR.
Gilligan, J. 1994. Field notes: Western Oregon, fall 1993. Oregon Birds 20:71-72.
Greene, E.W. Davidson, V.R. Muehter. 1998. Steller's Jay (Cyanocitta stelleri). TheBirds of North America, No 343. A. Poole and F. Gill, editors. The Birds of NorthAmerica, Inc. Philadelphia, PA.
Hagar, J.C., W.C. McComb, and W.H. Emmingham. 1996. Bird communities incommercially thinned and unthinned Douglas-fir stands of western Oregon. WildlifeSociety Bulletin 24:353-366.
Hansen, A.J., W.C. McComb, R. Vega, M.G. Raphael and M. Hunter. 1995. Birdhabitat relationships in natural and managed forests in the west Cascades of Oregon.Ecological Applications 5:555-569.
for
46
Hejl, S.J. and K.M. Granillo. 1998. What managers really need from avianresearchers. Pages 431-437 In Avian Conservation: Research and Management. J. M.Marzluff and R. Sallabanks, editors. Island Press, Washington, D.C.
Hickman, J.C. editor. 1993. The Jepson Manual. University of California Press.Berkeley and Los Angeles, California.
Horton, N.J. and S.R. Lipsitz. 1999. The American Statistician 53:160-169.
Hurlbert, S.H. 1984. Pseudoreplication and the design of ecological fieldexperiments. Ecological Monographs 54:187-211.
Hutto, R.L., S.J. Hejl, C.R. Preston and D.M. Finch. 1992. Effects of silviculturaltreatments on forest birds in the Rocky Mountains: Implications and managementrecommendations. Pages 386-391 In Status and Management of NeotropicalMigratory Birds. D.M. Finsh and P.W. Stangel, editors. United States Department ofAgriculture, Forest Service, General Technical Report GTR-RM-229.
Janes, S.W. 2003a. Yellow-rumped Warbler. Pages 510-512 In Birds of Oregon: AGeneral Reference. D.B. Marshall, M.G. Hunter, and A.L. Contreras, editors. OregonState University Press, Corvallis, OR.
Janes, S.W. 2003b. Hermit Warbler. Pages 510-512 In Birds of Oregon: A GeneralReference. D.B. Marshall, M.G. Hunter, and A.L. Contreras, editors. Oregon StateUniversity Press, Corvallis, OR.
Johnson, D.H. and T.A. O'Neil. 2001. Wildlife-Habitat Relationships in Oregon andWashington. Oregon State University Press. Corvallis, OR.
Kilgore, B.M. 1971. Response of breeding bird populations to habitat changes in agiant sequoia forest. American Midland Naturalist 85:135-152.
Lance, A.N and M. Phinney. 2001. Bird responses to partial retention timberharvesting in central interior British Columbia. Forest Ecology and Management142:267-280.
47
Lehmkuhl, J.F. and L.F. Ruggiero. 1991. Forest fragmentation in the PacificNorthwest and its potential effects on wildlife. Pages 35 to 44 In Wildlife andVegetation of Unmanaged Douglas-fir Forests. L.F. Ruggiero, K.B. Aubry, A.B.Carey, and M.H. Huff, editors. United States Department of Agriculture, ForestService, General Technical Report PNW-GTR-285. Portland, OR.
Manuwal, D. 1991. Spring bird communities in the southern Washington CascadeRange. Pages 161-174 In Wildlife and Vegetation of Unmanaged Douglas-fir Forests.L.F. Ruggiero, K.B. Aubry, A.B. Carey, and M.H. Huff, editors. United StatesDepartment of Agriculture, Forest Service, General Technical Report PNW-GTR-285.Portland, OR.
Mannan, R.W. 1977. Use of snags by birds, Douglas-fir region, western Oregon.M.S. thesis, Oregon State University, Corvallis.
McGarigal, K. and W.C. McComb. 1995. Relationships between landscape structureand breeding birds in the Oregon Coast Range. Ecological Monographs 65:235-260.
Morton, E.S. 1992. What do we know about the future of migrant landbirds? Pages579-589 In Ecology and Conservation of Neotropical Migrant Landbirds. J. M.Hagan III and D.W. Johnston, editors. Smithsonian Institution Press, Washington.
Morrison, M.L. 1982. The structure of western warbler assemblages:Ecomorphological analysis of the Black-throated Gray and Hermit warblers. Auk 99:503-515.
Nehls, H.B. 2003. Dark-eyed Junco. Pages 566-567 In Birds of Oregon: A GeneralReference. D.B. Marshall, M.G. Hunter, and A.L. Contreras, editors. Oregon StateUniversity Press, Corvallis, OR.
Nelson, S.K. 1988. Habitat use and densities of cavity-nesting birds in the OregonCoast Ranges. M.S. thesis, Oregon State University, Corvallis.
Peterjohn, B.G., J.R. Sauer and C.S. Robbins. 1995. Population trends from theNorth American Breeding Bird Survey. Pages 3-39 In Ecology and Management ofNeotropical Migratory Birds: A Synthesis and Review of Critical Issues. T.E. Martinand D.M. Finch, editors. Oxford University, New York, New York, USA.
R Foundation for Statistical Computing. 2004. R. Ver. 1.9.0. ISBN 3-9000051-00-3.
__ -- __ - -____ __ -
48
Ralph, C.J., G.R. Geupel, P. Pyle, T.E. Martin, D.F. DeSante. 1993. Handbook ofField Methods for Monitoring Landbirds. United States Department of Agriculture,Forest Service, General Technical Report PSW-GTR-144.
Ralph, C.J., P.W.C. Paton and C.A. Taylor. 1991. Habitat association patterns ofbreeding birds and small mammals in Douglas-fir/hardwood stands in northwesternCalifornia and southwestern Oregon. Pages 379-394 In Wildlife and Vegetation ofUnmanaged Douglas-fir Forests. L.F. Ruggiero, K.B. Aubry, A.B. Carey, and M.H.Huff, editors. United States Department of Agriculture, Forest Service, GeneralTechnical Report PNW-GTR-285. Portland, OR.
Rich, T.D., C.J. Beardmore, H. Berlanga, P.J. Blancher, M.S.W. Bradstreet, G.S.Butcher, D.W. Demarest, E.H. Dunn, W.C. Hunter, W.W. Iffigo-Elias, J.A. Kennedy,A.M. Martell, A.O. Panjabi, D.N. Pashley, K.V. Rosenberg, C.M. Rustay, J.SW.Wendt, T.C. Will. 2004. Partners in Flight North American Landbird ConservationPlan. Cornell Lab of Ornithology. Ithaca, NY.
Ricketts, T.H., E. Dinerstein, D.M. Olson, C.J. Louks, W. Eichbaum, D. DellaSala, K.Kavanagh, P. Hedao, K.M. Carney, R. Abell and S. Walters. 1999. TerrestrialEcoregions of North America A Conservation Assessment. Island Press, Washington,D.C.
Robbins, C.S., D.K. Dawson and B.A. Dowell. 1989a. Habitat area requirements ofbreeding forest birds of the Middle Atlantic States. Wildlife Monographs 103:1-34.
Robbins, C.S., J.R. Sauer, R. Greenberg and S. Droege. 1989b. Population declinesin North American birds that migrate to the Neotropics. Proceedings of the NationalAcademy of Sciences 86:7658-7662.
Sallabanks, R, 2003. American Robin. Pages 485-487 In Birds of Oregon: A GeneralReference. D.B. Marshall, M.G. Hunter, and A.L. Contreras, editors. Oregon StateUniversity Press, Corvallis, OR.
SAS Institute Inc. 2002. SAS Ver. 9. Cary, NC.
Schieck, J. 1997. Biased detection of bird vocalizations affects comparisons of birdabundance among forested habitats. Condor 99:179-191.
a s _ - _ _ _
49
Seavy, N.E., S. Quader, J.D. Alexander, and C.J. Ralph. In Press. Generalized linearmodels and point count data: Statistical considerations for the design and analysis ofmonitoring studies. In Bird Conservation Implementation and Integration in theAmericas. C.J. Ralph and T.D. Rich, editors. United States Department ofAgriculture, Forest Service, General Technical Report PSW-GTR- 191.
Smith, M.R., P.W. Mattocks, Jr., and K.M. Cassidy. 1997. Breeding birds ofWashington state, Vol. 4 in Washington state gap analysis- Final report. K.M.Cassidy, C.E. Gruel, M.R. Smith, and K.M. Dormice, editors. Seattle AudubonSociety Publications in Zoology No. 1, Seattle, Washington, 538 pp.
Steventon, J.D., K.L. Mackenzie and T.E. Mahon. 1998. Response of small mammaland birds to partial cutting and clearcutting in northwest British Colombia. ForestryChronicle 74:703-713.
Tewksbury, J..J., S.J. Heil and T.E. Martin. 1998. Breeding productivity does notdecline with increasing fragmentation in a western landscape. Ecology 79:2890-2903.
Thompson, F.R., Iml., J.R. Probst, and M.G. Raphael. 1993. Silvicultural options forNeotropical migratory birds. Pages 353-362 In Status and Management ofNeotropical Migratory Birds. D.M. Finch and P.W. Stangel, editors. United StatesDepartment of Agriculture, Forest Service, General Technical Report GTR-RM-229.Fort Collins, CO, USA.
Trail, P.W. 2003. Black-headed Grosbeak. Pages.570-572 In Birds of Oregon: AGeneral Reference. D.B. Marshall, M.G. Hunter, and A.L. Contreras, editors. OregonState University Press, Corvallis, OR.
Weikel, J.M. 2003. Steller's Jay. Pages 411-413 In Birds of Oregon: A GeneralReference. D.B. Marshall, M.G. Hunter, and A.L. Contreras, editors. Oregon StateUniversity Press, Corvallis, OR.
Weikel, J.M. and J.P. Hayes. 1999. Foraging ecology of cavity-nesting birds inyoung forests of the northern Coast Range of Oregon. Condor 101:58-66.
Zeiner, D.C., W.F. Laudenslayer, Jr., D.E. Mayer, and M. White, editors. 1990.California's Wildlife, Vol. II: Birds. California Department of Fish and Game,Sacramento, CA
III. A COMPARISON OF NESTING BIRDS IN HARVEST UNITS,
HABITAT ISLANDS, AND MATURE CONIFEROUS FORESTS
IN SOUTHWESTERN OREGON
Abstract
This study compared bird nesting attempts and success within clearcuts and
commercial thins, 0.1 to 1.3 ha habitat islands (Wildlife Protection Areas, WPAs)
remaining after clearcuts and commercial thins, and mature forests. I completed nest
searching and monitoring for two years on 12 monitoring plots. I located and
monitored sixty-seven nests of 13 focal species. Overall, WPAs within clearcuts
provided nesting habitat similar to clearcuts and WPAs within thins contained less
nesting species than thins. Hermit Warblers (Dendroica occidentalis), Red-breasted
Nuthatches (Sitta canadensis), and Yellow-rumped Warblers (Dendroica coronata)
nested in WPAs within clearcuts and in mature forests, but not in clearcuts. The
Yellow-rumped Warbler, a habitat generalist was found nesting in several WPAs of
varying sizes. However, Hermit Warblers and Red-breasted Nuthatches, both forest
interior/late successional species, were found exclusively in the largest (1.3 ha) WPA
suggesting that larger WPAs within clearcuts may maintain forested nesting habitat for
these birds.
50
; -
51
Introduction
Many bird species have experienced population declines in recent decades
(Peterjohn et al. 1995, Rich et al. 2004). Declines in Neotropical migratory birds were
originally attributed to the degradation of habitat on wintering grounds in Central and
South America (Morton 1992, Robbins et al. 1989a). More recently habitat
fragmentation on North American breeding grounds, particularly forested areas, has
been implicated as a potential cause of decline in resident and Neotropical migratory
bird populations (Peterjohn et al. 1995, Rich et al. 2004). Habitat fragmentation may
alter species composition as a result of increased predation and parasitism risk to birds
(Donovan et al. 1995, Tewksbury et al. 1998).
Although studies of bird abundance are often correlated with habitat features, it
is important to study nest success directly because using the abundance of birds to
infer the effects of habitat alteration on the reproductive success of birds can lead to
incorrect conclusions (Martin 1992). In certain instances abundance is negatively
correlated with nesting success (Hagan et al. 1996, Martin 1992). For example, high
abundance can occur in marginal or unsuitable habitat when preferred habitat is
limited (Martin 1992) or increased abundance in forest fragments remaining after
recent disturbance may result from displaced individuals (Hagan et al. 1996).
Abundance data can also be misleading in the years directly after a habitat change
occurs for birds that exhibit site fidelity (Hagan et al. 1996). These species may return
52
to a nest site from the previous year and stay there despite drastic habitat changes and
it may take several years of failed reproduction before they move to a different area.
This occurs more often for Neotropical migrants then residents because they spend
considerably less time on the breeding grounds, so they do not recognize the
insufficiency of habitat as quickly (Hagan et al. 1996).
Results from studies on nest success provide information on long-term
population stability in addition to short-term distribution responses; which combined
can be attributed to habitat quality. It is important for bird conservation that
management decisions consider habitat features that affect bird reproduction. Fitness
measurements provide more accurate information on habitat requirements than bird
abundance. Evolution suggests that birds choose habitats that increase reproductive
success over ecological time. Managing for forest characteristics associated with
reproductive success should have a positive short term effect on recruitment, as well
as a positive long term effect on population size, health, and stability. In addition,
studies of reproductive success result in a better understanding of life history traits,
which is important for species-specific management (Ralph et al. 1993, Martin 1992).
Southern Oregon Boise Corporation retains habitat islands (Wildlife Protection
Areas, WPAs) within harvest units to minimize the detrimental effects of both
clearcuts and commercial thins to wildlife over the short and long term. To my
knowledge, the impact of WPAs on breeding birds has not been the focus of any
53
scientific studies. Nest searching and monitoring focused on 13 focal species, which
were drawn from a Partners in Flight Conservation Plan (Altman 1999) and the Forest
Ecosystem Management Assessment Team (USDA Forest Service et al. 1993), along
with additional current literature, and are representative species of forest interior/late
successional habitat, forest edge/early successional habitat, and habitat generalists
(Table 1). The objective of this study was to compare nesting attempts and nest fate of
focal species between thins (55% canopy cover retentions), clearcuts, WPAs within
thins and clearcuts, and mature forests in order to determine whether WPAs are
providing nesting habitat that differs from the surrounding harvest unit.
Methods
Study Area
The study took place at five sites within 20 km of Prospect Oregon, on the
west slope of the southern Cascade Mountains at elevations ranging from 750 to 1200
m (Fig. 1). Mountain ridges dissected by valleys define the terrain (Johnson and
O'Neil 2001). Hot dry summers and wet winters characterize this ecoregion with
average yearly precipitation of 51 to 300 cm (Johnson and O'Neil 2001).
The study area is contained within the Central and Southern Cascades Forests
ecoregion with the major habitat type of Temperate Coniferous Forest (Ricketts et al.
1999). The dominant tree species are Douglas-fir (Pseudotsuga menziesii) and white
54
fir (Abies concolor) with strong components of incense cedar (Calocedrus decurrens),
ponderosa pine (Pinus ponderosa) and sugar pine (Pinus lambertiana). Pacific
madrone (Arbutus menziesii) dominates the hardwood component (Hickman 1993).
Shrubs dominate the understory, including giant chinquapin (Chrysolepsis
chrysophylla), ceanothus (Ceanothus spp.), oceanspray (Holodiscus discolor), oregon-
grape (Berberis nervosa), wood rose (Rosa gymnocarpa), and hazelnut (Corylus
cornuta, Hickman 1993).
The study area consisted of three timber harvest units on Boise Cascade
Corporation lands logged in 2000 and 2001. The harvest prescriptions for the units
differed, including one commercial thin with 55% canopy cover retention and two
clearcut harvests. The thins were selectively harvested to maintain the characteristics
of the preharvested stand, such as tree species composition and age structure (Burnett
pers. comm.). Clearcuts have no conifer canopy retained outside of WPAs and the
majority of standing hardwoods died as a result of an herbicide applied at the time of
timber harvest (Burnett pers. comm.). The herbicides Atrazine and Round Up were
applied to the clearcuts one to three times after they were replanted (Burgess pers.
comm.), maintaining nearly no grass, herb, and shrub cover within clearcuts during
this study.
I located two sites in mature forests on Boise Corporation land and public land
administered by the by USDA Forest Service within the Prospect Ranger District. The
I--- -
55
mature forests are contiguous, mature to late-successional forest habitat; defined for
the purposes of this study as a multiage stand dominated by trees older than 80 years
of age. Agricultural land was within 3 km of the thin and one of the mature forests.
The clearcuts and other mature forest were greater than 3 km from agricultural land.
The WPAs ranged in size from 0.1 to 1.3 ha. The WPAs were selected for
specific components significant to wildlife; including snags, downed wood, and
wildlife trees; which are trees with nests or nesting platforms. Other characteristics
selected for include talus, seeps and large hardwoods (Burnett pers. comm.).
Nest Monitoring
Twelve 1 ha intensive bird monitoring plots were established and visited once
every two to four days in 2002 and 2003 between I May and 15 July according to
standardized nest searching and monitoring protocols (Martin and Geupel 1993,
Martin et al. 1997). Spot mapping was completed simultaneously to the nest searching
following a standardized technique (Holmes and Barton 2002, Ralph et al. 1993).
I mapped breeding bird territories and located and monitored nests on the plots.
Four nest search plots encompassed WPAs within thins (thin-WPA), 4 encompassed
WPAs within clearcuts (clearcut-WPA), and 4 were located in mature forests. The
nest search plots were larger than WPAs in all cases except the largest WPA (1.3 ha),
and thus included the surrounding harvested area (clearcut, thin). Spot mapping was a
4 _-7- --- -__
56
tool used in nest searching and allowed me to determine whether nests were located
within WPAs or within the surrounding clearcut or thin.
During a nest search the plot was searched extensively and breeding behavior,
such as birds carrying food or nesting material, was observed and often lead me to
their nests (Martin et al. 1997). Once located, nests were observed every two to four
days to determine the fate of the nest (Martin et al. 1997). In addition to focal species,
I recorded select information on nests that I found incidentally. Cup nests less than 5
m from the ground were observed using a mirror pole, which extended to that height
and allowed me to view the nest contents in the mirror. I observed cavity nests and
nests above 5 m for up to 30 minutes per visit to determine the status of the nest based
on parental behavior.
Analysis
The numbers of focal and non-focal species nests located within each treatment
and nest fate were separated by habitat preference (forest interior/late successional,
forest edge/early successional, habitat generalist) for analysis. Nests were considered
successful if they fledged 1 or more of their own young. In instances where young
were not observed, I used standardized methods to deduce nest fate (Holmes and
Barton 2002, Martin et al. 1997). Total numbers of focal and non-focal species
nesting in each treatment are compared. I did not locate enough nests of any species
I-,
57
to determine nest success rate statistically (Mayfield 1975). However, the information
is presented as anecdotal evidence of species nesting in WPAs within thins and
clearcuts, and allows general comparisons among treatments and mature forests.
Results
I found 55 nests in 2002 and 39 nests in 2003. Incidental finds of non-focal
species accounted for 22 of the total 94 nests (Table 3). Five of the 94 nests located
were later determined to be false nests; created by birds to distract predators from their
true nests (Ehrlich et al. 1988). Three nests of House Wrens (Troglodytes aedon) and
Winter Wrens (Troglodytes troglodytes) were false nests and two Red-breasted
Nuthatch (Sitta canadensis) nests were observed during early excavation and never
completed; these nests were left out of further analysis. Nesting species richness for
focal and total species differed between treatments. The most focal species were
found nesting in mature forests, with nesting species richness of 8. This was followed
by nesting species richness of 7 in thins, 6 in clearcuts, and 5 in WPAs within
clearcuts. Only I focal species was found nesting in WPAs within thins. The
numbers of nests within treatments is presented with nest fate for forest interior/late
successional species (Table 4), edge/early successional species (Table 5) and habitat
generalists (Table 6).
58
Discussion
Overall, WPAs within clearcuts provided nesting habitat similar to clearcuts
and WPAs within thins contained less nesting species than thins. Two-thirds of focal
species nests found were in clearcuts and clearcut-WPAs (Fig. 2). This may be
attributed to varying levels of difficulty in nest searching between treatments. The
ability to visually detect and follow birds in clearcuts is substantially greater than in
thins and mature forests, which had more vegetation. Also species that favored
clearcuts were generally more conspicuous and easier to find, such as House Wrens
and Western Bluebirds (Sialia mexicana). Thus, it is not necessarily the case that
more birds are nesting in clearcuts or clearcut-WPAs than in the other treatments.
Less species were found nesting in thin-WPAs compared with thins and only
two focal species nests were found in thin-WPAs (Fig. 2). Interestingly, Brown
Creeper (Certhia americana), which is typically considered forest interior and an old
growth obligate species (USDA Forest Service et al. 1993, McGarigal and McComb
1995, Carey et al. 1991, Gilbert and Allwine 1991), maintained a successful nest in a
thin.
Overall, clearcut-WPAs provided nesting habitat for species similar to
clearcuts (Fig. 2). However, Hermit Warblers (Dendroica occidentalis), Red-breasted
Nuthatches, and Yellow-rumped Warblers (Dendroica coronata) nested within
clearcut-WPAs and in mature forests, but not in clearcuts. The Yellow-rumped
1-=
59
Warbler, a habitat generalist (Carey et al. 1991, Janes 2003a) was found nesting in
several WPAs of varying sizes. However, Hermit Warblers and Red-breasted
Nuthatches, both forest interior/late successional species (USDA Forest Service et
al.1993, Janes 2003b, Carey et al. 1991), were found exclusively in the largest (1.3 ha)
WPA suggesting that larger WPAs within clearcuts may maintain forested nesting
habitat for these birds.
Three Hermit Warbler nests were found, two in the largest clearcut-WPA and
one in mature forests. One nest was found in the clearcut-WPA in each year, which
was possibly the same breeding pair. The nest was collected after the first season and
in the next season the nest was located in the branch above where the 2002 nest (and
small branch) had been removed.
The largest numbers of nests were located for the Cassin's Vireo (Vireo
cassinii), with 14 nests found. According to current literature the Cassin's Vireo is a
forest interior/late succesional species (Gilbert and Allwine 1991), however four nests
were found in clearcut-WPAs. I found parasitism by the Brown-headed Cowbird
(Molothrus ater) only in the nests of Cassin's Vireos and in the 2 cases with cowbird
eggs the nests were abandoned. Parasitism was found in both clearcut-WPAs and
thins.
Future study should consider cause of nest failure in addition to nest fate.
There are several reasons why fragmentation may affect nesting success. Brood
60
parasitism plays a significant role in breeding success of parasite hosts. Although
parasitism increases with decreased forest cover, human development that provides
feeding habitat for cowbirds more strongly predicts cowbird presence (Tewksbury et
al. 1998). In this study, the clearcut with the Cassin's Vireo nest parasitized by
Brown-headed Cowbirds was 4 km from agricultural land. Brown-headed Cowbirds
were noted in both the thin and mature forest that were adjacent to agricultural land as
well, but nest parasitism was only detected within the thin.
The impact of brood parasitism on reproductive success has in some cases
been overestimated, by the failure to account for predation of parasitized nests.
Generally, nest predation is the largest limiting factor of nest success (Tewksbury et
al. 1998, Martin 1992) and increased predation also may result from fragmentation. In
western Oregon, typical nest predators include birds, snakes, squirrels and other small
mammals. Although results of many studies of fragmentation in the Midwest and
eastern United States have shown increased predator abundance, there is evidence that
this may not be representative of the western United States because the landscape is
naturally more fragmented. Natural fragmentation results from topographic variation
and disturbance by fires and floods. With increased fragmentation, forest predators
decline and generalist predators increase. As a result, the magnitude of predator effect
on breeding success will depend on the magnitude of this shift (Tewksbury et al.
61
1998). Further study should assess both nest failure cause, as well as predator
abundance.
Conclusion and Recommendations
The data presented here provides species composition of nesting birds, relative
number of breeding attempts and potential breeding success within treatments. Due to
the small scale of this nest searching project and the diverse group of focal species I
did not collect enough data to determine nest success rate (Mayfield 1975). The data
was anecdotal evidence, with the primary goal to complement a study completed
simultaneously on abundance. This pilot study was useful in determining whether a
larger scale reproductive study should be undertaken within these treatments, and if so
what species should be targeted.
Further study should address the following question: for species in which
WPAs provided nesting habitat, is nest success rate equal to that in other nesting
habitats of choice? This would require data for approximately 75 nests in each
treatment, which could be obtained by including more sample sites or continuing the
study over a longer time period (Nur et al. 1999). In general, WPAs less than 1.3 ha
did not provide nesting habitat for forest interior/late succesional species. I would
suggest completing a similar nest searching effort in WPAs larger than 1.3 ha within
clearcuts for one to three focal species. Robbins et al. (1 989b) and Freemark and
62
Collins (1989) agree that patches less than 10 ha in size maintain few to no forest
interior birds. Literature suggests much larger patch sizes are necessary. Robbins et
al. (1989b) found 50 ha maintained 50% and Freemark and Collins (1989) found 3000
ha maintained 100% of forest interior birds. In addition to the question of nest success
rate, causes of nest failure should be compared between treatments.
Red-breasted Nuthatches, which nested in the 1.3 ha WPA, make a good
candidate for a focal species. The nests of the Red-breasted Nuthatch are relatively
easy to find. They nest in conifer and mixed deciduous-conifer forest and prefer
mature stands with decaying large trees (Ehrlich et al. 1988). Red-breasted
Nuthatches nest in cavities of snags, and thus would be a good indicator of the use of
WPAs since WPAs are often selected for snag habitat. However, since they are cavity
nesters, nest monitoring can be time consuming and less conclusive without
specialized equipment to allow viewing of nest contents.
The Cassin's Vireo would also make an excellent focal species. They breed in
coniferous-deciduous woodlands (Ehrlich et al. 1988) and according to literature are
considered to be forest interior/late successional. Of the thirteen focal species in this
study, Cassin's Vireos were the easiest to find and monitor. The majority of nests
were low enough to be monitored with a mirror pole. In addition Cassin's Vireos are
of particular interest because of the incidence of parasitism by Brown-headed
Cowbirds found in this study.
63
Western Tanagers (Piranga ludoviciana), which breed in mixed conifer-
deciduous forest (Ehrlich et al. 1988), are another potential focal species candidate.
They would be a good indicator of the response of forest nesting generalists to WPAs.
The nests of Western Tanagers are not difficult to find, but they are typically too high
in the canopy to monitor with a mirror pole, so specialized equipment to view nest
contents would increase the accuracy of results. In this preliminary study, I found no
Western Tanager nests in mature forests so comparison among treatments may be
difficult.
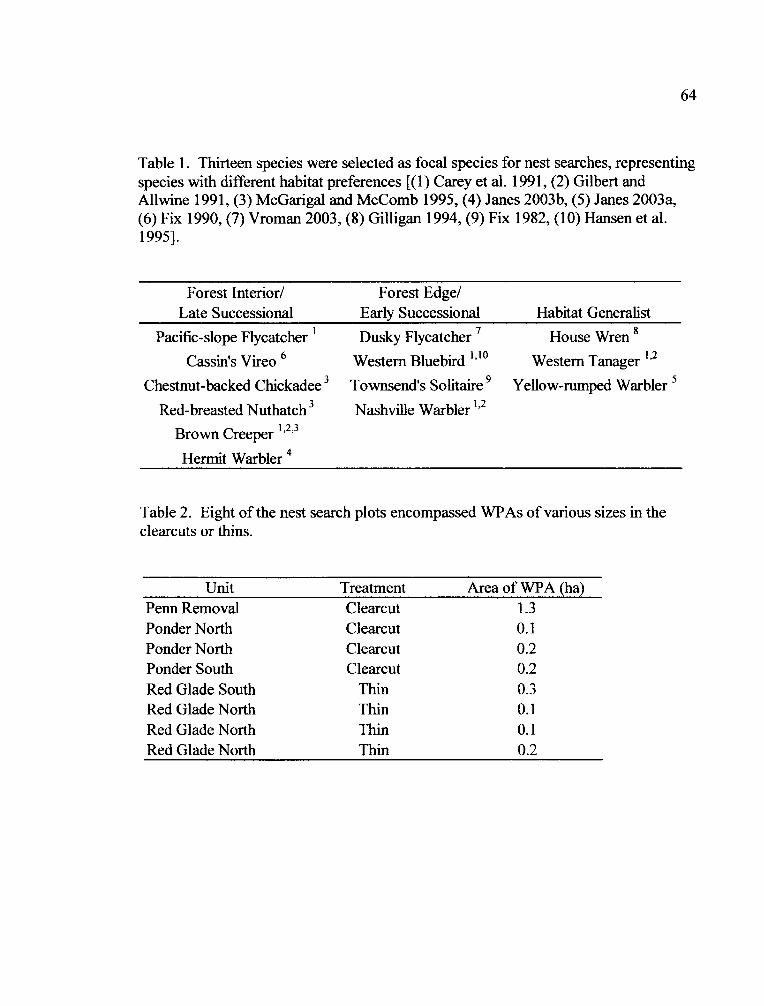
64
Table 1. Thirteen species were selected as focal species for nest searches, representingspecies with different habitat preferences [(1) Carey et al. 1991, (2) Gilbert andAllwine 1991, (3) McGarigal and McComb 1995, (4) Janes 2003b, (5) Janes 2003a,(6) Fix 1990, (7) Vroman 2003, (8) Gilligan 1994, (9) Fix 1982, (10) Hansen et al.1995].
Forest Interior/Late Successional
Pacific-slope Flycatcher '
Cassin's Vireo 6
Chestnut-backed Chickadee 3
Red-breasted Nuthatch 3
Brown Creeper 1,2,3
Hermit Warbler 4
Forest Edge/Early Successional
Dusky Flycatcher 7
Western Bluebird "l10
Townsend's Solitaire 9
Nashville Warbler 1,2
Habitat Generalist
House Wren 8
Western Tanager 1,2
Yellow-rumped Warbler 5
Table 2. Eight of the nest search plots encompassed WPAs of various sizes in theclearcuts or thins.
Unit Treatment Area of WPA (ha)Penn Removal Clearcut 1.3Ponder North Clearcut 0.1Ponder North Clearcut 0.2Ponder South Clearcut 0.2Red Glade South Thin 0.3Red Glade North Thin 0.1Red Glade North Thin 0.1Red Glade North Thin 0.2
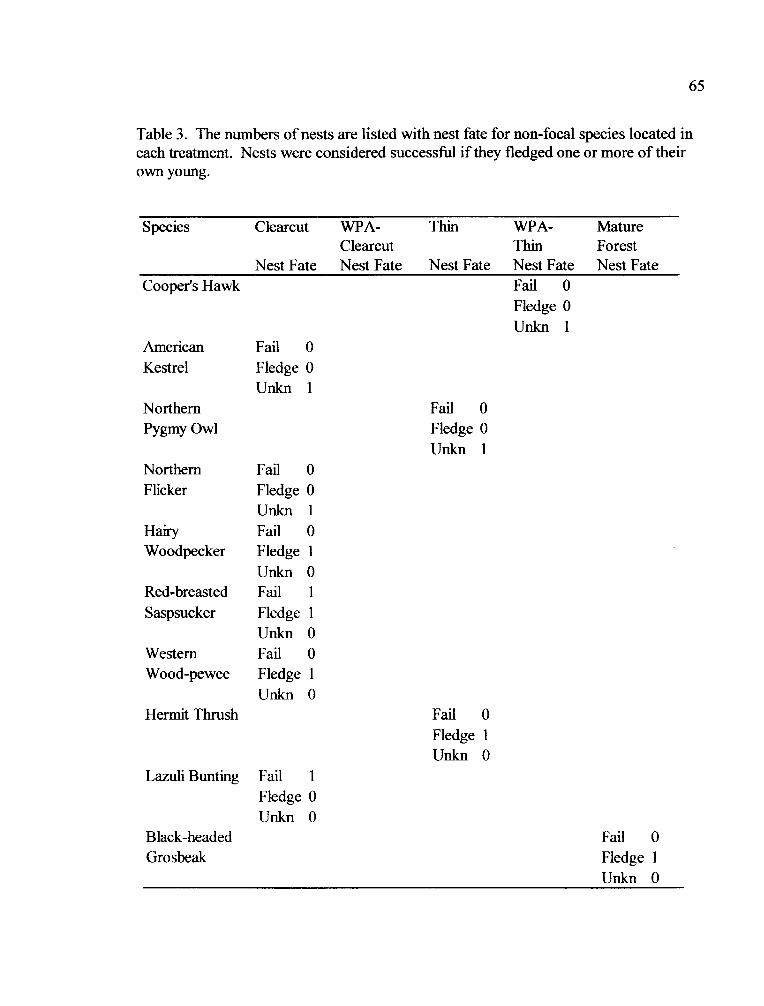
65
Table 3. The numbers of nests are listed with nest fate for non-focal species located ineach treatment. Nests were considered successful if they fledged one or more of theirown young.
Species Clearcut WPA- Thin WPA- MatureClearcut Thin Forest
Nest Fate Nest Fate Nest Fate Nest Fate Nest FateCooper's Hawk Fail 0
Fledge 0Unkn I
American Fail 0Kestrel Fledge 0
Unkn INorthern Fail 0Pygmy Owl Fledge 0
Unkn INorthern Fail 0Flicker Fledge 0
Unknl
Hairy Fail 0Woodpecker Fledge I
Unkn ORed-breasted Fail ISaspsucker Fledge I
Unkn OWestern Fail 0Wood-pewee Fledge 1
Unkn 0Hermit Thrush Fail 0
Fledge IUnkn 0
Lazuli Bunting Fail IFledge 0Unkn 0
Black-headed Fail 0Grosbeak Fledge I
Unkn 0
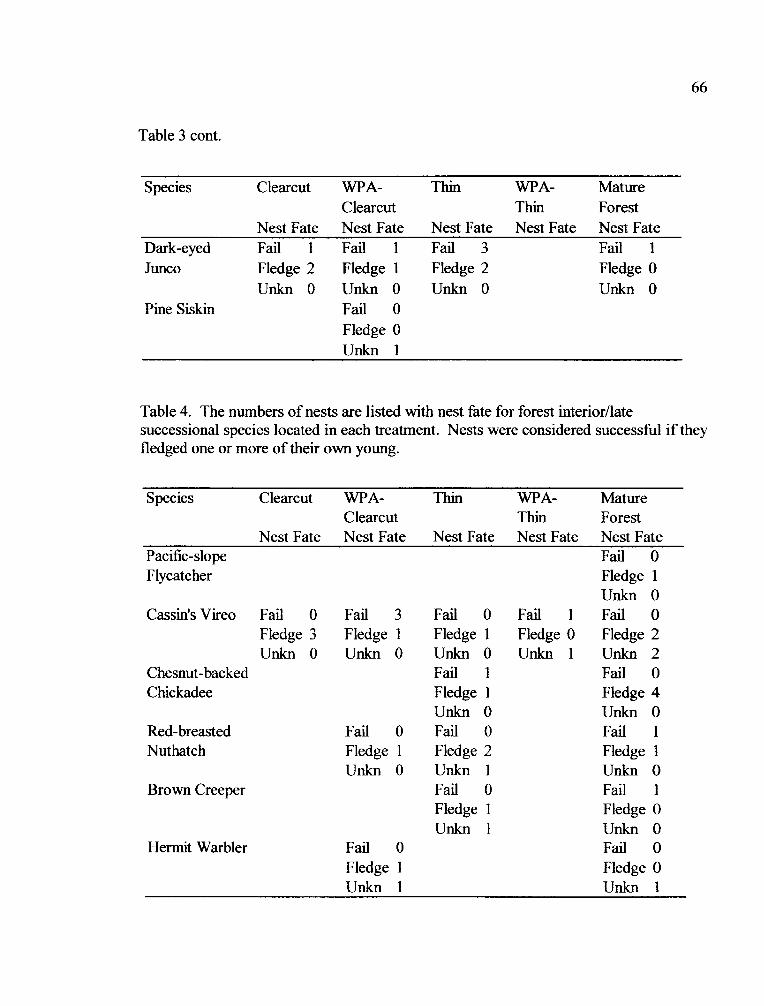
66
Table 3 cont.
Species Clearcut WPA- Thin WPA- MatureClearcut Thin Forest
Nest Fate Nest Fate Nest Fate Nest Fate Nest FateDark-eyed Fail I Fail 1 Fail 3 Fail 1Junco Fledge 2 Fledge I Fledge 2 Fledge 0
Unkn O Unkn O Unkn O Unkn 0Pine Siskin Fail 0
Fledge 0Unkn I
Table 4. The numbers of nests are listed with nest fate for forest interior/latesuccessional species located in each treatment. Nests were considered successful if theyfledged one or more of their own young.
Species Clearcut WPA- Thin WPA- MatureClearcut Thin Forest
Nest Fate Nest Fate Nest Fate Nest Fate Nest FatePacific-slope Fail 0Flycatcher Fledge I
Unkn 0Cassin's Vireo Fail 0 Fail 3 Fail 0 Fail I Fail 0
Fledge 3 Fledge I Fledge I Fledge 0 Fledge 2Unkn 0 Unkn 0 Unkn 0 Unkn I Unkn 2
Chesnut-backed Fail I Fail 0Chickadee Fledge 1 Fledge 4
Unkn 0 Unkn 0Red-breasted Fail 0 Fail 0 Fail 1Nuthatch Fledge I Fledge 2 Fledge 1
Unkn 0 Unkn I Unkn 0Brown Creeper Fail 0 Fail I
Fledge I Fledge 0Unkn I Unkn O
Hermit Warbler Fail 0 Fail 0Fledge I Fledge OUnkn I Unkn I
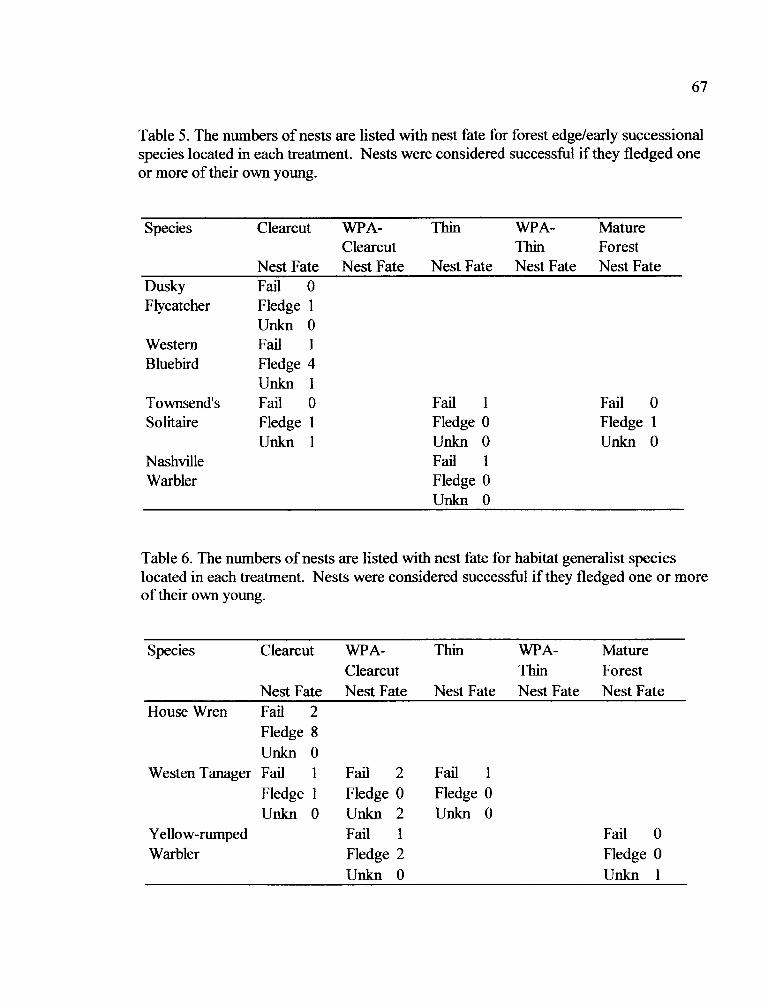
67
Table 5. The numbers of nests are listed with nest fate for forest edge/early successionalspecies located in each treatment. Nests were considered successful if they fledged oneor more of their own young.
Species Clearcut WPA- Thin WPA- MatureClearcut Thin Forest
Nest Fate Nest Fate Nest Fate Nest Fate Nest FateDusky Fail 0Flycatcher Fledge I
Unkn OWestern Fail 1Bluebird Fledge 4
Unkn ITownsend's Fail 0 Fail I Fail 0Solitaire Fledge I Fledge 0 Fledge I
Unkn I Unkn 0 Unkn 0Nashville Fail IWarbler Fledge 0
Unkn O
Table 6. The numbers of nests are listed with nest fate for habitat generalist specieslocated in each treatment. Nests were considered successful if they fledged one or moreof their own young.
Species Clearcut WPA- Thin WPA- MatureClearcut Thin Forest
Nest Fate Nest Fate Nest Fate Nest Fate Nest FateHouse Wren Fail 2
Fledge 8Unkn 0
Westen Tanager Fail I Fail 2 Fail 1Fledge I Fledge 0 Fledge 0Unkn 0 Unkn 2 Unkn 0
Yellow-rumped Fail I Fail 0Warbler Fledge 2 Fledge 0
Unkn O Unkn I
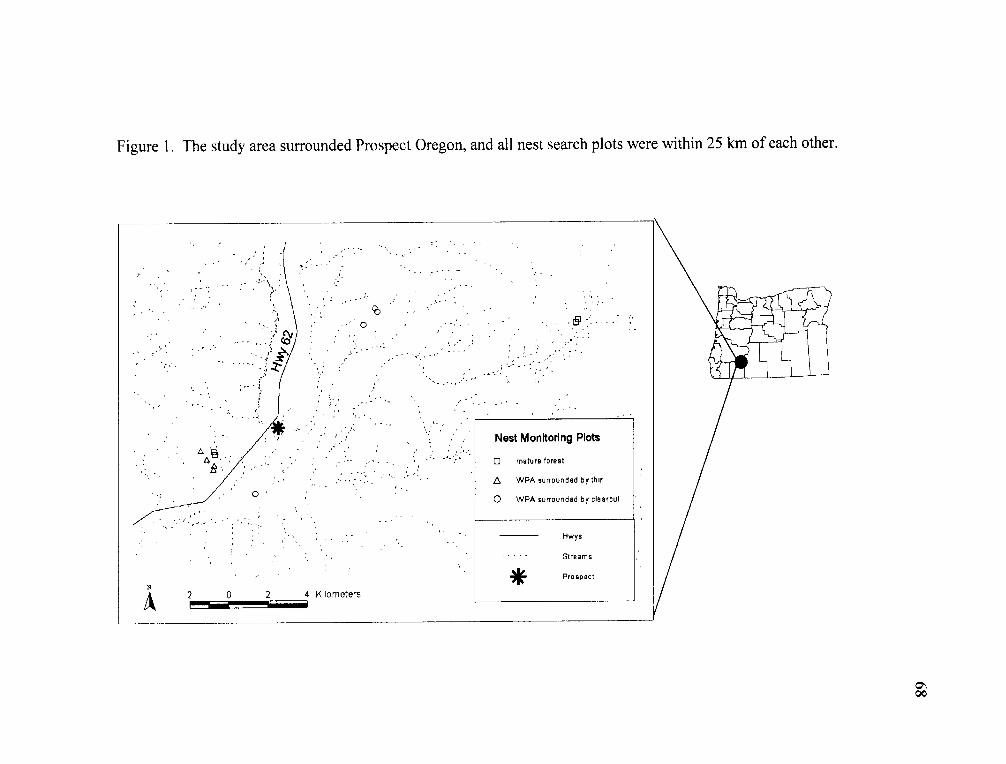
Figure 1. The study area surrounded Prospect Oregon, and all nest search plots were within 25 km of each other.
-' '3 -I ( n0,., A.. \ ..~~(
., , . ,-,- A,,\ 0-
-
.
. . .
. . . ..
, ... ..
. , . - EU - -
. . . . . .
* . , t * j
if ' t .. ..... . . . .
'. .- ;'-'-' . . '. , 4 . -. . .
, . . .
. .
. . . ... ... . ,
.-
Nest Moni'foring Plots
C1 mature forest
I
7
A WPA surrounded by thin
0 WPA surrounded by clearcut
Hwys
- -- Streams
* Prospect
2 0 2 4 Kllometers
ON0 0
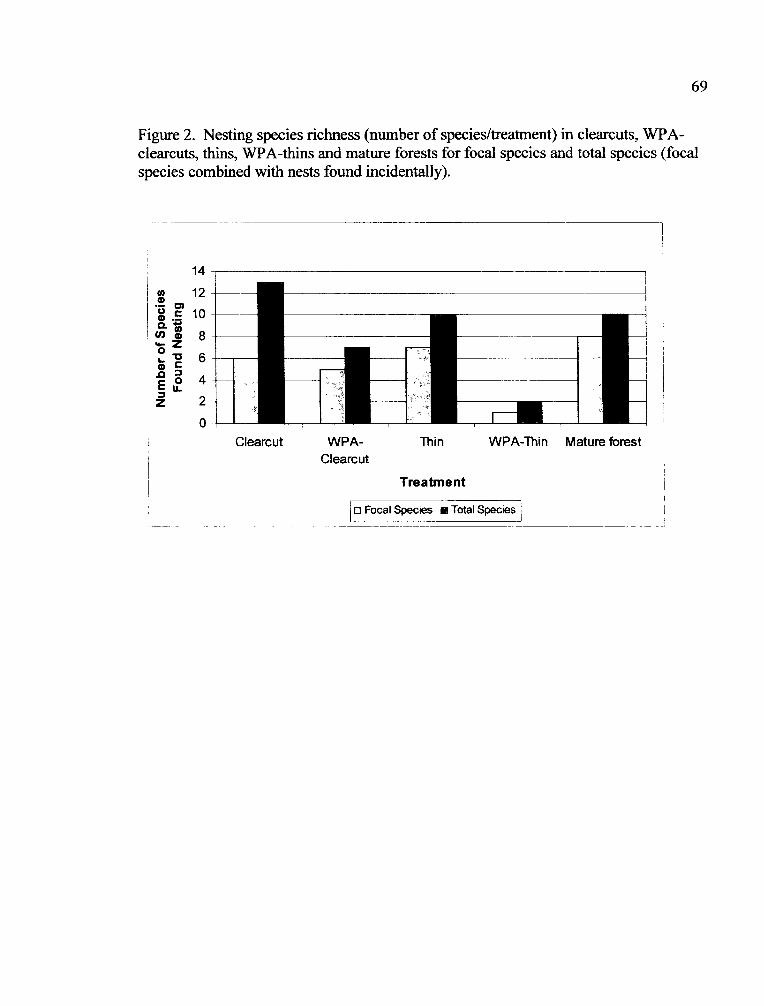
69
Figure 2. Nesting species richness (number of species/treatment) in clearcuts, WPTA-clearcuts, thins, WPA-thins and mature forests for focal species and total species (focalspecies combined with nests found incidentally).
14-
12 -_ _ _ _
8 _ _ _ _ _
0
Clearcut Thin WPA-Thin Mature forestClearcut
Treatment
o Focal Species m Total Species r
70
Literature Cited
Altman, B. 1999. Conservation Strategy for Landbirds in Coniferous Forests of Oregonand Washington, Version 1.0. Oregon-Washington Partners In Flight, American BirdConservancy. Boring, OR.
Carey, A.B., M.M. Hardt, S.P. Horton, and B.L. Biswell. 1991. Spring birdcommunities in the Oregon Coast Range. Pages 123-142 In Wildlife and Vegetation ofUnmanaged Douglas-fir Forests. L.F. Ruggiero, K.B. Aubry, A.B. Carey, and M.H.Huff, editors. United States Department of Agriculture, Forest Service, GeneralTechnical Report PNW-GTR-285. Portland, OR.
Donovon, T.M., F.R. Thompson III, J. Faaborg and J.R. Probst. 1995. Reproductivesuccess of migratory birds in habitat sources and sinks. Conservation Biology 9:1380-1385.
Ehrlich, P.R., D.S. Dobkin, D. Wheye. 1988. The Birder's Handbook. Simon andSchuster Inc. New York, New York.
Fix, D. 1982. Distribution: Townsend's Solitaire, western Cascades. Oregon Birds8:168-170.
Fix, D. 1990. Birds of Diamond Lake Ranger District. Unpublished Manuscript.URL=http://osu.orst.edu/pubs/birds/county/doug/dlrd, Sep. 20, 2002.
Freemark, K. and B. Collins. 1989. Landscape ecology of birds breeding in temperateforest fragments. Pages 443-454 In Ecology and Conservation of Neotropical MigrantBirds. Manomet Symposium.
Gilbert, F.F. and R. Allwine. 1991. Spring bird communities in the Oregon CascadeRange. Pages 144-158 In Wildlife and Vegetation of Unmanaged Douglas-fir Forests.L.F. Ruggiero, K.B. Aubry, A.B. Carey, and M.H. Huff, editors. United StatesDepartment of Agriculture, Forest Service, General Technical Report PNW-GTR-285.Portland, OR.
Gilligan, J. 1994. Field notes: Western Oregon, fall 1993. Oregon Birds 20:71-72.
Hagan, J.M., W.M. Vander Haegen and P.S. McKinley. 1996. The early developmentof forest fragmentation effects on birds. Conservation Biology 10:188-202.
71
Hansen, A.J., W.C. McComb, R. Vega, M.G. Raphael and M. Hunter. 1995. Birdhabitat relationships in natural and managed forests in the west Cascades of Oregon.Ecological Applications 5:555-569.
Hickman, J.C. editor. 1993. The Jepson Manual. University of California Press.Berkeley and Los Angeles, California.
Holmes, A.L. and D.C. Barton. 2002. Unpublished. The Shrubsteppe Handbook: AProcedures Manual for the Shrubsteppe Program of PRBO Conservation Science,Version 1, PRBO Conservation Science, Stinson Beach, CA 94970.
Janes, S.W. 2003a. Yellow-rumped Warbler. Pages 510-512 In Birds of Oregon: AGeneral Reference. D.B. Marshall, M.G. Hunter, and A.L. Contreras, editors. OregonState University Press, Corvallis, OR.
Janes, S.W. 2003b. Hermit Warbler. Pages 510-512 In Birds of Oregon: A GeneralReference. D.B. Marshall, M.G. Hunter, and A.L. Contreras, editors. Oregon StateUniversity Press, Corvallis, OR.
Johnson, D.H. and T.A. O'Neil. 2001. Wildlife-Habitat Relationships in Oregon andWashington. Oregon State University Press. Corvallis, OR.
Martin, T.E. 1992. Breeding productivity considerations: What are the appropriatehabitat features for management? Pages 455-473 In J.M. Hagan, III and D.W.Johnston, editors. Avian Conservation: Research and Management. Island, Covelo,California, USA.
Martin, T.E. and G.R. Geupel. 1993. Nest-monitoring plots: Methods for locating nestsand monitoring success. Journal of Field Ornithology 64:507-519.
Martin, T. E., C.R. Paine, C.J. Conway, W.M. Hochachka, P. Allen and W. Jenkins.1997. BBird Field Protocol. Montana Cooperative Wildlife Research Unit, Universityof Montana, Missoula, Montana, USA.
Mayfield, H.F. 1975. Suggestions for calculating nesting success. The Wilson Bulletin87:456-466.
McGarigal, K. and W.C. McComb. 1995. Relationships between landscape structureand breeding birds in the Oregon Coast Range. Ecological Monographs 65: 235-260.
72
Morton, E.S. 1992. What do we know about the future of migrant landbirds? Pages579-589 In Ecology and Conservation of Neotropical Migrant Landbirds. J. M. Haganm and D.W. Johnston, editors. Smithsonian Institution Press, Washington.
Nur, N., S.L. Jones, and G.R. Geupel. 1999. A Statistical Guide to Data Analysis ofAvian Monitoring Programs. U.S. Department of the Interior, Fish and WildlifeService, BTP-R6001-1999, Washington, D.C.
Peterjohn, B.G., J.R. Sauer and C.S. Robbins. 1995. Population trends from the NorthAmerican Breeding Bird Survey. Pages 3-39 In Ecology and Management ofNeotropical Migratory Birds: A Synthesis and Review of Critical Issues. T.E. Martinand D.M. Finch, editors. Oxford University, New York, New York, USA.
Ralph, C.J., G.R. Geupel, P. Pyle, T.E. Martin, D.F. DeSante. 1993. Handbook ofField Methods for Monitoring Landbirds. United States Department of Agriculture,Forest Service, General Technical Report PSW-GTR-144.
Rich, T.D., C.J. Beardmore, H. Berlanga, P.J. Blancher, M.S.W. Bradstreet, G.S.Butcher, D.W. Demarest, E.H. Dunn, W.C. Hunter, W.W. Iffigo-Elias, J.A. Kennedy,A.M. Martell, A.O. Panjabi, D.N. Pashley, K.V. Rosenberg, C.M. Rustay, J.SW.Wendt, T.C. Will. 2004. Partners in Flight North American Landbird ConservationPlan. Cornell Lab of Ornithology. Ithaca, NY.
Ricketts, T.H., E. Dinerstein, D.M. Olson, C.J. Louks, W. Eichbaum, D. DellaSala, K.Kavanagh, P. Hedao, K.M. Carney, R. Abell and S. Walters. 1999. TerrestrialEcoregions of North America A Conservation Assessment. Island Press, Washington,D.C.
Robbins, C.S., D.K. Dawson and B.A. Dowell. 1989a. Habitat area requirements ofbreeding forest birds of the Middle Atlantic States. Wildlife Monographs 103:1-34.
Robbins, C.S., J.R. Sauer, R. Greenberg and S. Droege. 1989a. Population declines inNorth American birds that migrate to the Neotropics. Proceedings of the NationalAcademy of Sciences 86: 7658-7662.
Schreiber, B. and D.S. deCalesta. 1992. The relationship between cavity-nesting birdsand snags on clearcuts in western Oregon. Forest Ecology and Management 50:299-316.
Tewksbury, J.J., S.J. Heil and T.E. Martin. 1998. Breeding productivity does notdecline with increasing fragmentation in a western landscape. Ecology 79:2890-2903.
73
USDA Forest Service, USDI Fish and Wildlife Service, National Park Service andBureau of Land Management, USDC National Oceanic and AtmosphericAdministration and National Marine Fisheries Service, and Enivironmental ProtectionAgency. 1993. Forest Ecosystem Management: An Ecological, Economic, and SocialAssessment Report of the Forest Ecosystem Management Assessment Team.
Vroman, D.W. 2003. Dusky Flycatcher. Pages 384-386 In Birds of Oregon: AGeneral Reference. D.B. Marshall, M.G. Hunter, and A.L. Contreras, editors. OregonState University Press, Corvallis, OR.
IV. CONCLUSION AND RECOMMENDATIONS
I integrated the results of chapter two and chapter three to determine whether
the nesting data supported the conclusions reached from the abundance data. In
chapter two, I determined whether WPAs within clearcuts provided habitat for species
based on comparisons of abundance between treatments. However, nesting data
provides stronger evidence that species are benefiting from WPAs. Data on
abundance and nesting are summarized for eight of the fifteen species that were
detected in clearcuts, WPAs within clearcuts, and mature forests in both years and
were also focal species in the nesting component of this study (Table 1).
Abundance and Nest Fate of Focal Species
Predicted to be More Abundant in Mature Forests than Clearcuts
Abundance and nesting results concur that WPAs provided habitat for Cassin's
Vireos ( Vireo cassinii). However, WPAs were not benefiting Pacific-slope
Flycatchers (Empidonax difficilis), Chestnut-backed Chickadees (Poecile rufescens),
and Hermit Warblers (Dendroica occidentalis) based on both abundance and nesting
results. The results from the two study components disagreed only for the Red-
breasted Nuthatch (Sitta canadensis), for which abundance suggested WPAs were
74
75
providing habitat, but they were not found nesting in WPAs between 0.1 and 0.8 ha.
The Pacific-slope Flycatcher was more abundant in mature forests than clearcuts, with
abundance in WPAs more similar to clearcuts suggesting WPAs were not benefiting
this species. The reproductive data concurs with this conclusion; they were not found
nesting in clearcuts or WPAs (Table 1).
Abundance was higher in mature forests than clearcuts for Cassin's Vireos,
with abundance in WPAs more similar to mature forests. They nested successfully in
WPAs, clearcuts and mature forests. However, Brown-headed Cowbird (Molothrus
ater) parasitism caused several nest failures. The results from both study components
suggest that WPAs benefit Cassin's Vireos.
Chestnut-backed Chickadee abundance was greater in mature forests than
clearcuts, with abundance in WPAs more similar to clearcuts. This suggested that
WPAs did not benefit this species and is further supported by the lack of nests found
in clearcuts or WPAs (Table 1).
Red-breasted Nuthatches were more abundant in mature forests than clearcuts,
with abundance in WPAs more similar to mature forests, suggesting that WPAs
provided habitat for this species. However, results of the nesting component indicate
that they were found nesting only in the largest (1.3 ha) WPA, which is consistent with
the non-significant increasing trend of the probability of detecting Red-breasted
Nuthatches with increased WPA size. Through integration of the two study
76
components, it appears that although abundance data suggested use of WPAs by Red-
breasted Nuthatches they were not found nesting in WPAs between 0.1 and 0.8 ha.
Hermit Warblers were more abundant in mature forests than clearcuts, with
abundance in WPAs more similar to clearcuts, indicating that WPAs were not
benefiting this species. The reproductive data concurs with this result for WPAs in the
size range of 0.1 to 0.8 ha, which are the WPAs included in the abundance component
of the study. However, a nest was found in the 1.3 ha WPA in both years (Table 1),
which suggests that larger WPAs may provide habitat for Hermit Warblers.
Predicted to be Equally Abundant in Mature Forests and Clearcuts
Results from both abundance and nesting data concur that WPAs are providing
habitat for Western Tanagers (Piranga ludoviciana) and Yellow-rumped Warblers
(Dendroica coronata). Abundance data suggested that WPAs were benefiting House
Wrens (Troglodytes aedon), however they were only found nesting in clearcuts,
indicating WPAs may not provide additional habitat for them.
House Wrens were less abundant in mature forests than clearcuts, with
abundance in WPAs more similar to clearcuts suggesting that WPAs provide habitat
for them. However, their nests were only found in clearcuts (Table 1) suggesting that
WPAs do not provide habitat different than clearcuts. This agrees with the results that
77
probability of detection of House Wrens showed a non-significant decreasing trend
with WPA size.
The Western Tanager, which was most abundant in WPAs, less abundant in
clearcuts and least abundant in mature forests, nested in both clearcuts and WPAs.
Results from both study components suggest that WPAs benefit Western Tanagers.
Nest site limitation within clearcuts could explain why Western Tanagers were more
abundant in WPAs (Table 1).
Yellow-rumped Warblers were more abundant in mature forests than clearcuts,
with abundance in WPAs more similar to mature forests, indicating that WPAs
provided habitat for this species. The anecdotal evidence from the nest monitoring
indicated that they were nesting in WPAs and not in clearcuts. Through the
integration of data from the two components of this study, I have concluded that
WPAs provided foraging and nesting habitat for Yellow-rumped Warblers, and
clearcuts did not (Table 1).
Recommendations for Further Studies
Future study should include WPAs over a broader size range, in order to assess
whether WPAs have the potential to support more species, and whether they can
support them at an abundance similar to mature forests. In order to meet the short-
term objective of WPAs to provide habitat for birds in the midst of clearcuts, it
78
appeared that WPAs needed to be larger than 0.8 ha for many forest species.
Additional nest data are needed to conclude whether or not the nest success rate of
species nesting in WPAs within clearcuts is comparable to that of mature forests.
This study should be periodically repeated to determine the long term effect of
WPAs on birds. I would suggest repeating two-year studies at least every ten years to
determine the benefits of WPAs over time. A different suite of species will benefit
from the structural diversity created by WPAs as the forest grows around them.
Species will benefit from many components of the structural complexity
developed by WPAs within mid and late successional forest. Structural complexity
provides diverse habitat and niches which are not typically maintained in managed
landscapes because they take longer than 80 years to form, examples include large
trees, large snags, closed canopy, and forest floor complexity. WPAs maintain large
trees that create a unique foraging niche with their deeply fissured bark, which
promotes bark-gleaning insectivores such as the Brown Creeper (Certhia americana).
In addition, WPAs provide large snags through both initial snag retention and the
retention of large live trees which will eventually become snags. Many species of
birds use snags for nesting and foraging, including the Pileated Woodpecker
(Dryocopus pileatus). The multi-layered forest and closed canopy benefit a number of
cup nesting canopy species, including the Hermit Warbler (Dendroica occidentalis).
The complextiy of the forest floor, which includes litter, large down logs, and low
v - w
79
understory, benefit another suite of species which forage or nest in this habitat, such as
Winter Wrens (Triglodytes troglodytes). Future study is necessary to determine
whether WPAs provide enough complexity within the managed forests as they
develop into mid and late successional stands to maintain bird species dependent on
those characteristics.
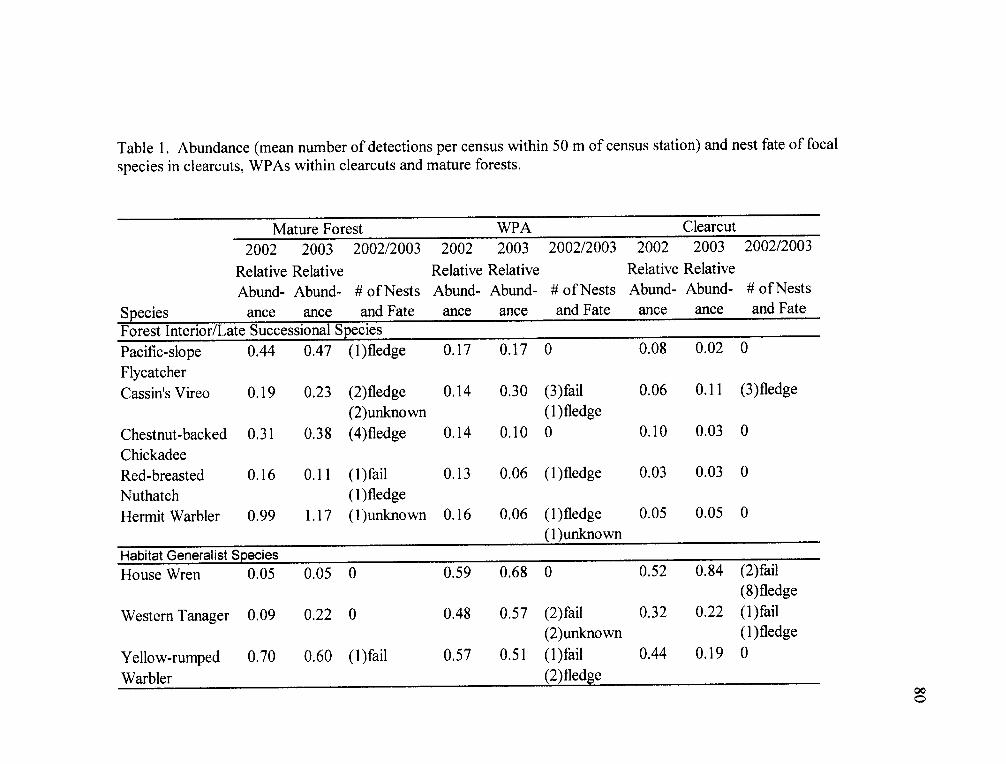
Table 1. Abundance (mean number of detections per census within 50 m of census station) and nest fate of focal
species in clearcuts, WPAs within clearcuts and mature forests.
Mature Forest WPA Clearcut
2002 2003 2002/2003 2002 2003 2002/2003 2002 2003 2002/2003
Relative Relative Relative Relative Relative Relative
Abund- Abund- # of Nests Abund- Abund- # of Nests Abund- Abund- # of Nests
Species ance ance and Fate ance ance and Fate ance ance and FateForest Interior/Late Successional Species
Pacific-slope 0.44 0.47 (1)fledge 0.17 0.17 0 0.08 0.02 0
FlycatcherCassin's Vireo 0.19 0.23 (2)fledge 0.14 0.30 (3)fail 0.06 0.11 (3)fledge
(2)unknown (1)fledge
Chestnut-backed 0.31 0.38 (4)fledge 0.14 0.10 0 0.10 0.03 0
ChickadeeRed-breasted 0.16 0.11 (I)fail 0.13 0.06 (I)fledge 0.03 0.03 0
Nuthatch (I)fledgeHermit Warbler 0.99 1.17 (I)unknown 0.16 0.06 (l)fledge 0.05 0.05 0
(1 )unknownHabitat Generalist Species
House Wren 0.05 0.05 0 0.59 0.68 0 0.52 0.84 (2)fail(8)fledge
Western Tanager 0.09 0.22 0 0.48 0.57 (2)fail 0.32 0.22 (I)fail(2)unknown (l)fledge
Yellow-rumped 0.70 0.60 (l)fail 0.57 0.51 (l)fail 0.44 0.19 0
Warbler (2)fledge000
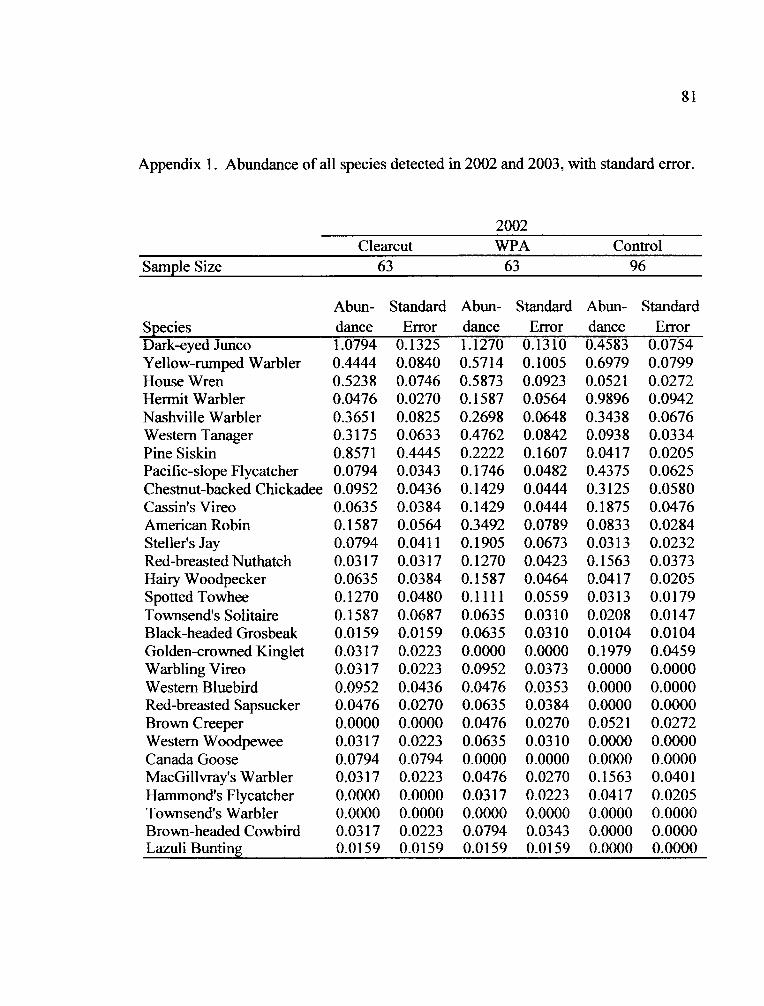
81
Appendix 1. Abundance of all species detected in 2002 and 2003, with standard error.
2002WPAClearcut Control
Sample Size 63 63 96
Abun- Standard Abun- Standard Abun- StandardSpecies dance Error dance Error dance ErrorDark-eyed Junco 1.0794 0.1325 1.1270 0.1310 0.4583 0.0754Yellow-rumped Warbler 0.4444 0.0840 0.5714 0.1005 0.6979 0.0799House Wren 0.5238 0.0746 0.5873 0.0923 0.0521 0.0272Hermit Warbler 0.0476 0.0270 0.1587 0.0564 0.9896 0.0942Nashville Warbler 0.3651 0.0825 0.2698 0.0648 0.3438 0.0676Western Tanager 0.3175 0.0633 0.4762 0.0842 0.0938 0.0334Pine Siskin 0.8571 0.4445 0.2222 0.1607 0.0417 0.0205Pacific-slope Flycatcher 0.0794 0.0343 0.1746 0.0482 0.4375 0.0625Chestnut-backed Chickadee 0.0952 0.0436 0.1429 0.0444 0.3125 0.0580Cassin's Vireo 0.0635 0.0384 0.1429 0.0444 0.1875 0.0476American Robin 0.1587 0.0564 0.3492 0.0789 0.0833 0.0284Steller's Jay 0.0794 0.0411 0.1905 0.0673 0.0313 0.0232Red-breasted Nuthatch 0.0317 0.0317 0.1270 0.0423 0.1563 0.0373Hairy Woodpecker 0.0635 0.0384 0.1587 0.0464 0.0417 0.0205Spotted Towhee 0.1270 0.0480 0.1111 0.0559 0.0313 0.0179Townsend's Solitaire 0.1587 0.0687 0.0635 0.0310 0.0208 0.0147Black-headed Grosbeak 0.0159 0.0159 0.0635 0.0310 0.0104 0.0104Golden-crowned Kinglet 0.0317 0.0223 0.0000 0.0000 0.1979 0.0459Warbling Vireo 0.0317 0.0223 0.0952 0.0373 0.0000 0.0000Western Bluebird 0.0952 0.0436 0.0476 0.0353 0.0000 0.0000Red-breasted Sapsucker 0.0476 0.0270 0.0635 0.0384 0.0000 0.0000Brown Creeper 0.0000 0.0000 0.0476 0.0270 0.0521 0.0272Western Woodpewee 0.0317 0.0223 0.0635 0.0310 0.0000 0.0000Canada Goose 0.0794 0.0794 0.0000 0.0000 0.0000 0.0000MacGillvray's Warbler 0.0317 0.0223 0.0476 0.0270 0.1563 0.0401Hammond's Flycatcher 0.0000 0.0000 0.0317 0.0223 0.0417 0.0205Townsend's Warbler 0.0000 0.0000 0.0000 0.0000 0.0000 0.0000Brown-headed Cowbird 0.0317 0.0223 0.0794 0.0343 0.0000 0.0000Lazuli Bunting 0.0159 0.0159 0.0159 0.0159 0.0000 0.0000
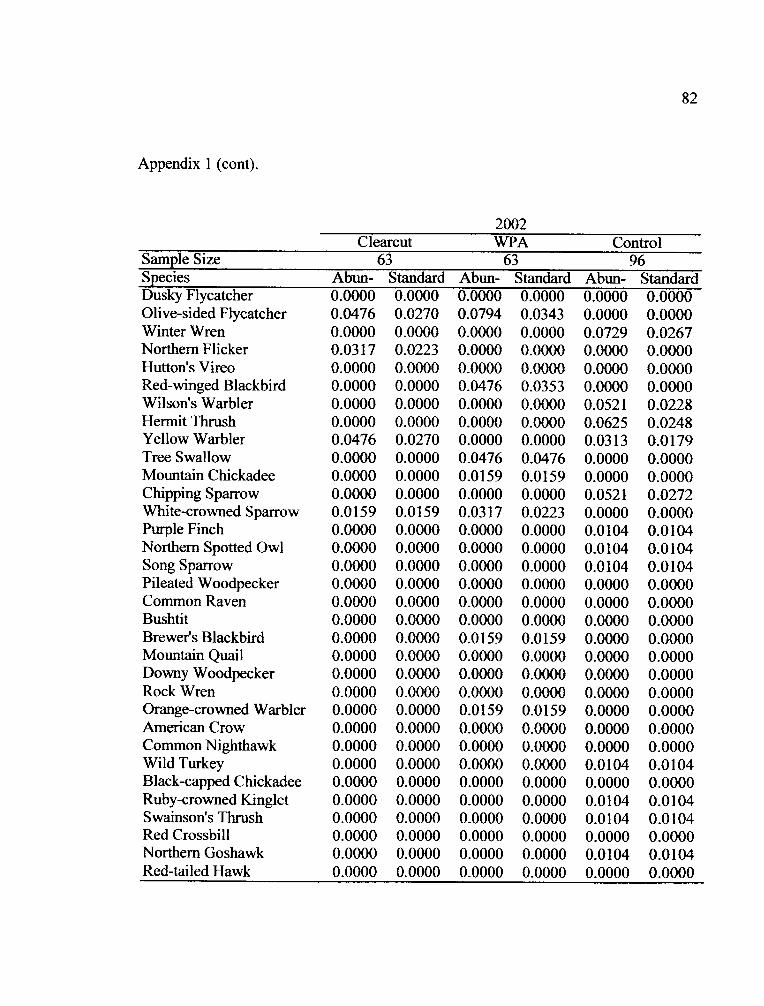
-f,
82
Appendix 1 (cont).
Sample SizeSpeciesDusky FlycatcherOlive-sided FlycatcherWinter WrenNorthern FlickerHutton's VireoRed-winged BlackbirdWilson's WarblerHermit ThrushYellow WarblerTree SwallowMountain ChickadeeChipping SparrowWhite-crowned SparrowPurple FinchNorthern Spotted OwlSong SparrowPileated WoodpeckerCommon RavenBushtitBrewer's BlackbirdMountain QuailDowny WoodpeckerRock WrenOrange-crowned WarblerAmerican CrowCommon NighthawkWild TurkeyBlack-capped ChickadeeRuby-crowned KingletSwainson's ThrushRed CrossbillNorthern GoshawkRed-tailed Hawk
2002Clearcut WPA Control
63 63 96Abun- Standard Abun- Standard Abun- Standard0.0000 0.0000 0.0000 0.0000 0.0000 0.00000.0476 0.0270 0.0794 0.0343 0.0000 0.00000.0000 0.0000 0.0000 0.0000 0.0729 0.02670.0317 0.0223 0.0000 0.0000 0.0000 0.00000.0000 0.0000 0.0000 0.0000 0.0000 0.00000.0000 0.0000 0.0476 0.0353 0.0000 0.00000.0000 0.0000 0.0000 0.0000 0.0521 0.02280.0000 0.0000 0.0000 0.0000 0.0625 0.02480.0476 0.0270 0.0000 0.0000 0.0313 0.01790.0000 0.0000 0.0476 0.0476 0.0000 0.00000.0000 0.0000 0.0159 0.0159 0.0000 0.00000.0000 0.0000 0.0000 0.0000 0.0521 0.02720.0159 0.0159 0.0317 0.0223 0.0000 0.00000.0000 0.0000 0.0000 0.0000 0.0104 0.01040.0000 0.0000 0.0000 0.0000 0.0104 0.01040.0000 0.0000 0.0000 0.0000 0.0104 0.01040.0000 0.0000 0.0000 0.0000 0.0000 0.00000.0000 0.0000 0.0000 0.0000 0.0000 0.00000.0000 0.0000 0.0000 0.0000 0.0000 0.00000.0000 0.0000 0.0159 0.0159 0.0000 0.00000.0000 0.0000 0.0000 0.0000 0.0000 0.00000.0000 0.0000 0.0000 0.0000 0.0000 0.00000.0000 0.0000 0.0000 0.0000 0.0000 0.00000.0000 0.0000 0.0159 0.0159 0.0000 0.00000.0000 0.0000 0.0000 0.0000 0.0000 0.00000.0000 0.0000 0.0000 0.0000 0.0000 0.00000.0000 0.0000 0.0000 0.0000 0.0104 0.01040.0000 0.0000 0.0000 0.0000 0.0000 0.00000.0000 0.0000 0.0000 0.0000 0.0104 0.01040.0000 0.0000 0.0000 0.0000 0.0104 0.01040.0000 0.0000 0.0000 0.0000 0.0000 0.00000.0000 0.0000 0.0000 0.0000 0.0104 0.01040.0000 0.0000 0.0000 0.0000 0.0000 0.0000
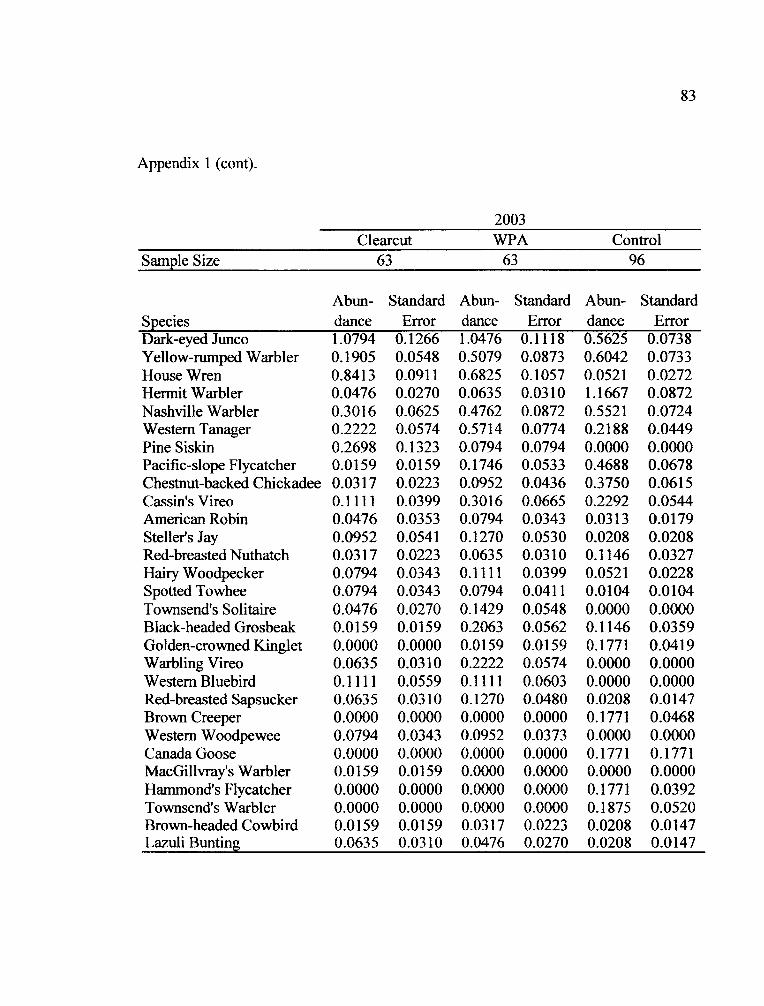
83
Appendix 1 (cont).
2003Clearcut WPA Control
Sample Size 63 63 96
Abun- Standard Abun- Standard Abun- StandardSpecies dance Error dance Error dance ErrorDark-eyed Junco 1.0794 0.1266 1.0476 0.1118 0.5625 0.0738Yellow-rumped Warbler 0.1905 0.0548 0.5079 0.0873 0.6042 0.0733House Wren 0.8413 0.0911 0.6825 0.1057 0.0521 0.0272Hermit Warbler 0.0476 0.0270 0.0635 0.03 10 1.1667 0.0872Nashville Warbler 0.3016 0.0625 0.4762 0.0872 0.552 1 0.0724Western Tanager 0.2222 0.0574 0.57 14 0.0774 0.2 188 0.0449Pine Siskin 0.2698 0.1323 0.0794 0.0794 0.0000 0.0000Pacific-slope Flycatcher 0.0159 0.0 159 0.1746 0.0533 0.4688 0.0678Chestnut-backed Chickadee 0.0317 0.0223 0.0952 0.0436 0.3750 0.0615Cassin's Vireo 0.1111 0.0399 0.3016 0.0665 0.2292 0.0544American Robin 0.0476 0.0353 0.0794 0.0343 0.03 13 0.0179Steller's Jay 0.0952 0.0541 0.1270 0.0530 0.0208 0.0208Red-breasted Nuthatch 0.0317 0.0223 0.0635 0.0310 0.1146 0.0327Hairy Woodpecker 0.0794 0.0343 0.1111 0.0399 0.0521 0.0228Spotted Towhee 0.0794 0.0343 0.0794 0.0411 0.0104 0.0104Townsend's Solitaire 0.0476 0.0270 0.1429 0.0548 0.0000 0.0000Black-headed Grosbeak 0.0159 0.0159 0.2063 0.0562 0.1146 0.0359Golden-crowned Kinglet 0.0000 0.0000 0.0159 0.0159 0.1771 0.0419Warbling Vireo 0.0635 0.03 10 0.2222 0.0574 0.0000 0.0000Western Bluebird 0.1111 0.0559 0.1111 0.0603 0.0000 0.0000Red-breasted Sapsucker 0.0635 0.0310 0.1270 0.0480 0.0208 0.0147Brown Creeper 0.0000 0.0000 0.0000 0.0000 0.1771 0.0468Western Woodpewee 0.0794 0.0343 0.0952 0.0373 0.0000 0.0000Canada Goose 0.0000 0.0000 0.0000 0.0000 0.1771 0.1771MacGillvray's Warbler 0.0159 0.0159 0.0000 0.0000 0.0000 0.0000Hammnond's Flycatcher 0.0000 0.0000 0.0000 0.0000 0.1771 0.0392Townsend's Warbler 0.0000 0.0000 0.0000 0.0000 0.1875 0.0520Brown-headed Cowbird 0.0159 0.0159 0.03 17 0.0223 0.0208 0.0147Lazuli Bunting 0.0635 0.03 10 0.0476 0.0270 0.0208 0.0147
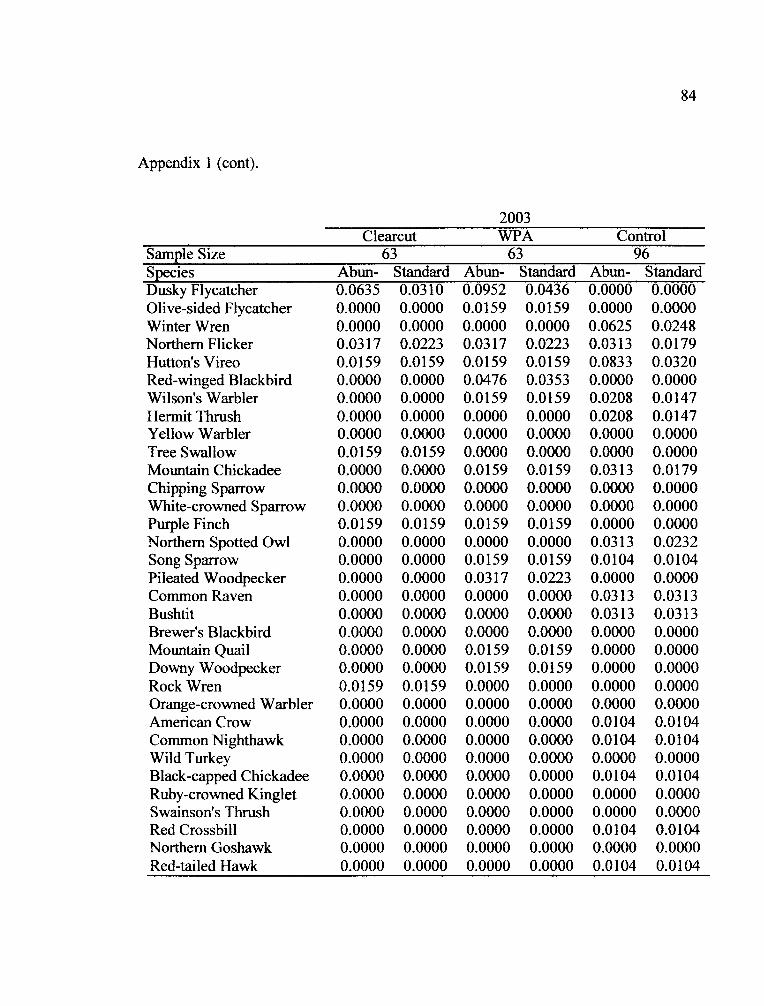
z ::= L ' -
84
Appendix I (cont).
Sample SizeSpeciesDusky FlycatcherOlive-sided FlycatcherWinter WrenNorthern FlickerHutton's VireoRed-winged BlackbirdWilson's WarblerHermit ThrushYellow WarblerTree SwallowMountain ChickadeeChipping SparrowWhite-crowned SparrowPurple FinchNorthern Spotted OwlSong SparrowPileated WoodpeckerCommon RavenBushtitBrewer's BlackbirdMountain QuailDowny WoodpeckerRock WrenOrange-crowned WarblerAmerican CrowCommon NighthawkWild TurkeyBlack-capped ChickadeeRuby-crowned KingletSwainson's ThrushRed CrossbillNorthern GoshawkRed-tailed Hawk
2003Clearcut WPA Control
63 63 96Abun- Standard Abun- Standard Abun- Standard0.0635 0.0310 0.0952 0.0436 0.0000 0.00000.0000 0.0000 0.0159 0.0159 0.0000 0.00000.0000 0.0000 0.0000 0.0000 0.0625 0.02480.0317 0.0223 0.0317 0.0223 0.0313 0.01790.0159 0.0159 0.0159 0.0159 0.0833 0.03200.0000 0.0000 0.0476 0.0353 0.0000 0.00000.0000 0.0000 0.0159 0.0159 0.0208 0.01470.0000 0.0000 0.0000 0.0000 0.0208 0.01470.0000 0.0000 0.0000 0.0000 0.0000 0.00000.0159 0.0159 0.0000 0.0000 0.0000 0.00000.0000 0.0000 0.0159 0.0159 0.0313 0.01790.0000 0.0000 0.0000 0.0000 0.0000 0.00000.0000 0.0000 0.0000 0.0000 0.0000 0.00000.0159 0.0159 0.0159 0.0159 0.0000 0.00000.0000 0.0000 0.0000 0.0000 0.0313 0.02320.0000 0.0000 0.0159 0.0159 0.0104 0.01040.0000 0.0000 0.0317 0.0223 0.0000 0.00000.0000 0.0000 0.0000 0.0000 0.0313 0.03130.0000 0.0000 0.0000 0.0000 0.0313 0.03130.0000 0.0000 0.0000 0.0000 0.0000 0.00000.0000 0.0000 0.0159 0.0159 0.0000 0.00000.0000 0.0000 0.0159 0.0159 0.0000 0.00000.0159 0.0159 0.0000 0.0000 0.0000 0.00000.0000 0.0000 0.0000 0.0000 0.0000 0.00000.0000 0.0000 0.0000 0.0000 0.0104 0.01040.0000 0.0000 0.0000 0.0000 0.0104 0.01040.0000 0.0000 0.0000 0.0000 0.0000 0.00000.0000 0.0000 0.0000 0.0000 0.0104 0.01040.0000 0.0000 0.0000 0.0000 0.0000 0.00000.0000 0.0000 0.0000 0.0000 0.0000 0.00000.0000 0.0000 0.0000 0.0000 0.0104 0.01040.0000 0.0000 0.0000 0.0000 0.0000 0.00000.0000 0.0000 0.0000 0.0000 0.0104 0.0104


![The following work, one file within the Rogue River ...soda.sou.edu/awdata/070417c1.pdf · dowever I do not bel]1ve ... The ayAtem Jeaoribed in the reoort on 'he 3reson National](https://img.pdfslide.net/doc/110x75/5aa2bbb27f8b9ac67a8d776c/the-following-work-one-file-within-the-rogue-river-sodasoueduawdata-i-do.jpg)