Embed Size (px)
Citation preview
Citation: Foran DR, Fischer AB, Stoloff ME. A Comparison of Mitochondrial DNA Amplification Strategies for Species Identification. J Forensic Investigation. 2015;3(2): 7.
J Forensic InvestigationOctober 2015 Vol.:3, Issue:2© All rights are reserved by Foran et al.
A Comparison of Mitochondrial DNA Amplification Strategies for Species Identification
Keywords: Forensic science; Species identification; Mitochondrial DNA; Universal primers; BLAST search; DNA sequencing
AbstractForensic scientists are regularly presented with biological material
of unknown origin, and determining if it is human or establishing what species it is can be critical to an investigation. Given this, several molecular methods have been developed for species identification of forensic samples, the most common of which is mtDNA amplification using universal primers followed by sequencing of the amplicon and comparison of the sequence to a database. In the current study, multiple mtDNA loci from a wide range of animal species were amplified using nine different universal primer pairs. Amplification success was measured, and a subset of amplicons was put through DNA sequencing to determine how effective each mtDNA locus was for species identification. Some loci amplified in a much wider range of species than did others, and smaller amplicons were more likely to amplify than were larger ones. However, there was a notable tradeoff between amplicon size and species identification success, wherein very small amplicons often failed to produce definitive species identification.
IntroductionForensic scientists regularly test evidence derived from human
perpetrators and victims of crime. However, in some instances it is not apparent if biological material is of human origin, and even if it is not, non-human material derived from animal or plant sources may have high evidentiary value. Further, the questions asked about non-human materials can be very different than those about material derived from people. For instance, human DNA analysis is generally designed to individualize the evidence, and thus identify its precise origin, while the question with biological material from an unknown source may be as simple as if it is human (e.g., in a missing person case). On the other hand, it may be critical to identify the actual species origin of a forensic sample, either because species identification is the ultimate goal (e.g., is it protected under local or international law?), or because knowing the species might make subsequent individualization of that evidence possible (e.g., a hair found on a suspect of a burglary and the homeowner’s cat).
Over the years, a number of molecular approaches have been developed for species determination. Most of these stemmed from evolutionary biology, using DNA-based strategies for examining the phylogenetic relationships among species (e.g., [1]), through which genetic similarity among even distantly related species became apparent. In 1989, Kocher et al. described ‘universal’ PCR primer sites in both the coding and non-coding regions of animal mtDNA that were conserved across a wide range of species, which could be used to successfully amplify DNA from mammals, fish, birds, amphibians, and in some instances insects or spiders [2]. Amplification of such regions, followed by sequence comparison based on restriction site mapping or DNA sequencing, became an important phylogenetic
David R. Foran1*, Andrew B. Fischer2 and Matthew E. Stoloff2
1Forensic Science Program, School of Criminal Justice and Department of Integrative Biology, Michigan State University, East Lansing, MI, USA2Michigan State University, 655 Auditorium Road, East Lansing, MI, USA
*Address for CorrespondenceDavid R. Foran, PhD, Forensic Science Program, School of Criminal Justice and Department of Integrative Biology, 560 Baker Hall, 655 Auditorium Road, Michigan State University, East Lansing, MI 48824, USA, Tel: +1-517-432-5439; Fax: +1-517-432-1787; E-mail: [email protected]
Submission: 21 September, 2015Accepted: 08 October, 2015Published: 12 October, 2015
Copyright: © 2015 Foran DR, et al. This is an open access article distributed under the Creative Commons Attribution License, which permits unrestricted use, distribution, and reproduction in any medium, provided the original work is properly cited.
Reviewed & Approved by: Dr. Robert Allen, Head of the School of Forensic Sciences, Oklahoma State University, Center for Health Sciences, USA
Research Article Open Access
Journal of
Forensic Investigation
Avens Publishing GroupInviting Innovations
Avens Publishing GroupInviting Innovations
tool. This methodology, now colloquially called DNA barcoding, was then adopted for identification of unknown wildlife samples (e.g., [3,4]). Universal primers are used to amplify DNA from a questioned sample, and a restriction map or complete DNA sequence is produced. For closely related species or populations within a species, the highly variable mtDNA control region can be assayed, while coding regions are often assayed for more distantly related organisms.
Early DNA-based species identifications were hampered by the need to obtain known samples to which the unknown material could be compared. Today, mtDNA sequence data for a huge number of species are available through on-line databases, the largest of which, GenBank®, is administered by the U.S. National Institutes of Health’s National Center for Biotechnology Information (http://www.ncbi.nlm.nih.gov/). There, sequences can be uploaded to the Basic Local Alignment Search Tool (BLAST; http://blast.ncbi.nlm.nih.gov/Blast.cgi) and ‘queried’, using a variety of stringency and algorithm variables (a ‘BLAST search’). Anywhere from a few to 20,000 results are returned (this number is selectable), which are ordered based on a score of sequence similarity and the amount of the queried sequence included. The species of origin, alignment of the queried and database sequence, and a link for more information on the database sequence (e.g., authors, the DNA source, publications) are also generated. For instance, a mtDNA sequence that originated from an unknown hair could produce results that are 100% matches to domestic dogs (Canis lupus familiaris), followed by 99% matches to other dogs, 98% matches, etc. Typically, related species then start to appear, such as dogs’ closest kin (gray wolf, dingo), other related species (other wolves), and then slightly more distant species (coyote, jackal, other canid genera). In this way, a BLAST query can be used
Citation: Foran DR, Fischer AB, Stoloff ME. A Comparison of Mitochondrial DNA Amplification Strategies for Species Identification. J Forensic Investigation. 2015;3(2): 7.
J Forensic Investigation 3(2): (2015) Page - 02
ISSN: 2330-0396
to quickly determine the biological origin of a questioned sample, or at a minimum eliminate the vast majority of other species, which is almost always adequate for forensic applications.
Since the Kocher et al. study [2], which utilized primers in the mtDNA control region, cytochrome b gene, and 12S ribosomal RNA (rRNA) gene, other researchers have published universal primers that target several other mtDNA loci (e.g., [5-11], and detailed below). Different forensic laboratories have successfully utilized a subset of these for species identification, however unlike most forensic biology methodologies, the locus or loci assayed have not been standardized across laboratories. This is likely because most forensic laboratories do not undertake DNA sequencing, thus there has been little demand for standardization, and also because once a laboratory has a method up and running there is little incentive to alter it. Unfortunately,
Common name Scientific name Common name Scientific nameMammals Reptiles Dog Canis lupus familiaris Corn snake Pantherophis guttatusWolf Canis lupus Central bearded dragon Pogona vittiicepsCoyote Canis latrans Blanding's turtle Chrysemys pictaGray fox Urocyon cinereoargenteus Painted turtle Emydoidea blandingiiRed fox Vulpes vulpes Snapping turtle Chelydra serpentinaBobcat Lynx rufus Birds Cat Felis catus Blue jay Cyanocitta cristataAmerican badger Mellivora capensis Chicken Gallus gallus domesticusAmerican marten Martes americana Common goldeneye Bucephala clangulaAmerican mink Neovison vison English sparrow Passer domesticusFerret Mustela putorius furo House finch Carpodacus mexicanusFisher Martes pennanti King eider Somateria spectabilisN. American river otter Lontra canadensis Amphibians Wolverine Gulo gulo African clawed frog Xenopus laevisCommon raccoon Procyon lotor Axolotl Ambystoma mexicanumAmerican black bear Ursus americanus Rough-skinned newt Taricha granulosaSpotted hyena Crocuta crocut Insects Virginia opossum Didelphis virginiana American cockroach Periplaneta americanaPig Sus scrofa domestica Asian lady beetle Harmonia axyridisCow Bos taurus Boxelder bug Boisea trivittataElk Cervus canadensis Click beetle Elateridae sppHorse Equus ferus caballus Darkling beetle Tenebrionidae sppWhite-tailed deer Odocoileus virginianus Fruit fly Drosophila melanogasterEastern cottontail rabbit Sylvilagus floridanus Moth Heterocera sppEastern chipmunk Tamias striatus Tent caterpillar Malacosoma americanumGolden hamster Mesocricetus auratus Yellow jacket Vespula spp.White-footed mouse Peromyscus leucopus Arthropods Fish House centipede Scutigera coleoptrataAlewife Alosa pseudoharengus Millipede Diplopoda sppAtlantic salmon Salmo salar Spider Araneae sppLake herring Coregonus artedi Annelid Lake sturgeon Acipenser fulvescens Earthworm Megadrilacea sppLake whitefish Coregonus clupeaformis Crustation Largemouth bass Micropterus salmoides Pill bug Armadillidium vulgareMottled sculpin Cottus bairdiiMuskellunge Esox masquinongyNinespine stickleback Pungitius pungitiusSea lamprey Petromyzon marinus
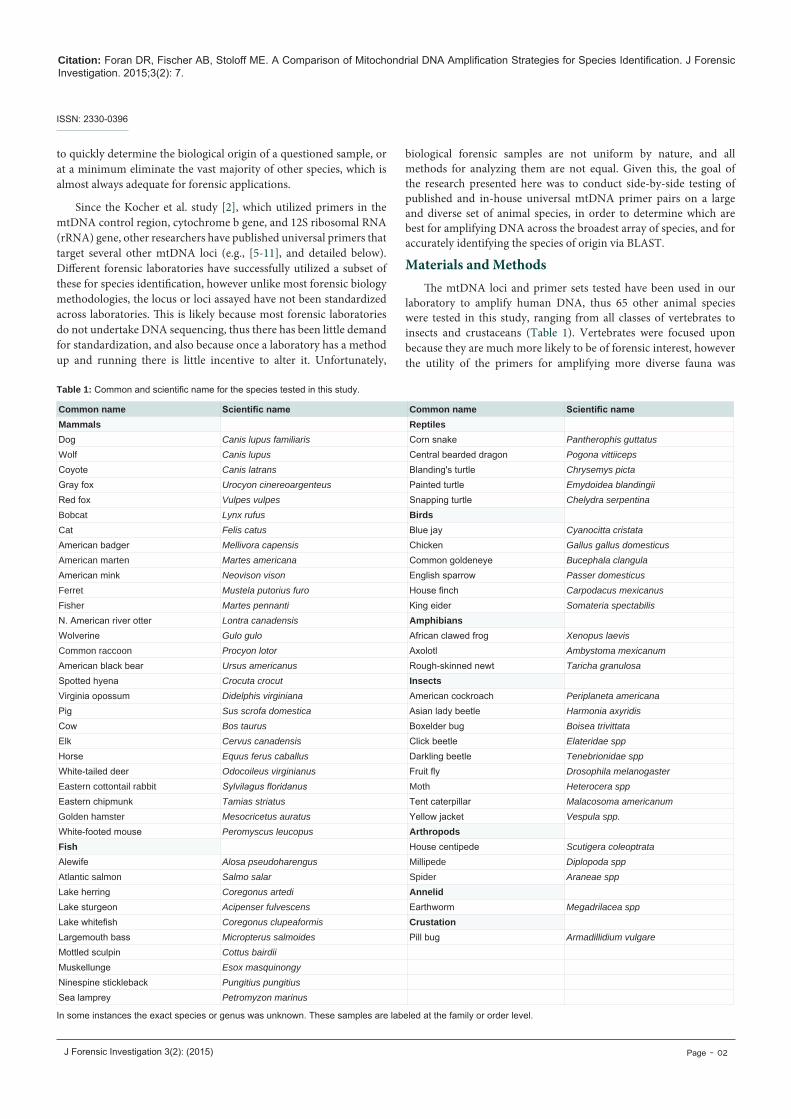
Table 1: Common and scientific name for the species tested in this study.
In some instances the exact species or genus was unknown. These samples are labeled at the family or order level.
biological forensic samples are not uniform by nature, and all methods for analyzing them are not equal. Given this, the goal of the research presented here was to conduct side-by-side testing of published and in-house universal mtDNA primer pairs on a large and diverse set of animal species, in order to determine which are best for amplifying DNA across the broadest array of species, and for accurately identifying the species of origin via BLAST.
Materials and MethodsThe mtDNA loci and primer sets tested have been used in our
laboratory to amplify human DNA, thus 65 other animal species were tested in this study, ranging from all classes of vertebrates to insects and crustaceans (Table 1). Vertebrates were focused upon because they are much more likely to be of forensic interest, however the utility of the primers for amplifying more diverse fauna was
Citation: Foran DR, Fischer AB, Stoloff ME. A Comparison of Mitochondrial DNA Amplification Strategies for Species Identification. J Forensic Investigation. 2015;3(2): 7.
J Forensic Investigation 3(2): (2015) Page - 03
ISSN: 2330-0396
also of interest. Samples in this study were collected as muscle, hair, buccal swabs, whole animals (e.g., insects), and previously prepared DNAs from other laboratories. Supplies and solutions used in DNA isolation and purification were UV irradiated for 5 min (~2.5 J/cm2) prior to use. DNAs were isolated by incubating samples in 500 µL of digestion buffer (20 mM Tris pH 7.5, 50 mM EDTA, 0.1% SDS) and 5 µL of proteinase K (20 mg/mL) at 55 °C overnight. The digestion was subsequently extracted with an equal volume of phenol, followed by an equal volume of chloroform. The aqueous layer was purified using a 30 kD Amicon Ultra-0.5 filter (Millipore Corporation, Billerica, MA) and three 300 µL washes of TE (10 mM Tris, 1 mM EDTA, pH 7.5), resulting in a final volume of approximately 25 µL. DNAs were stored at -20 °C.
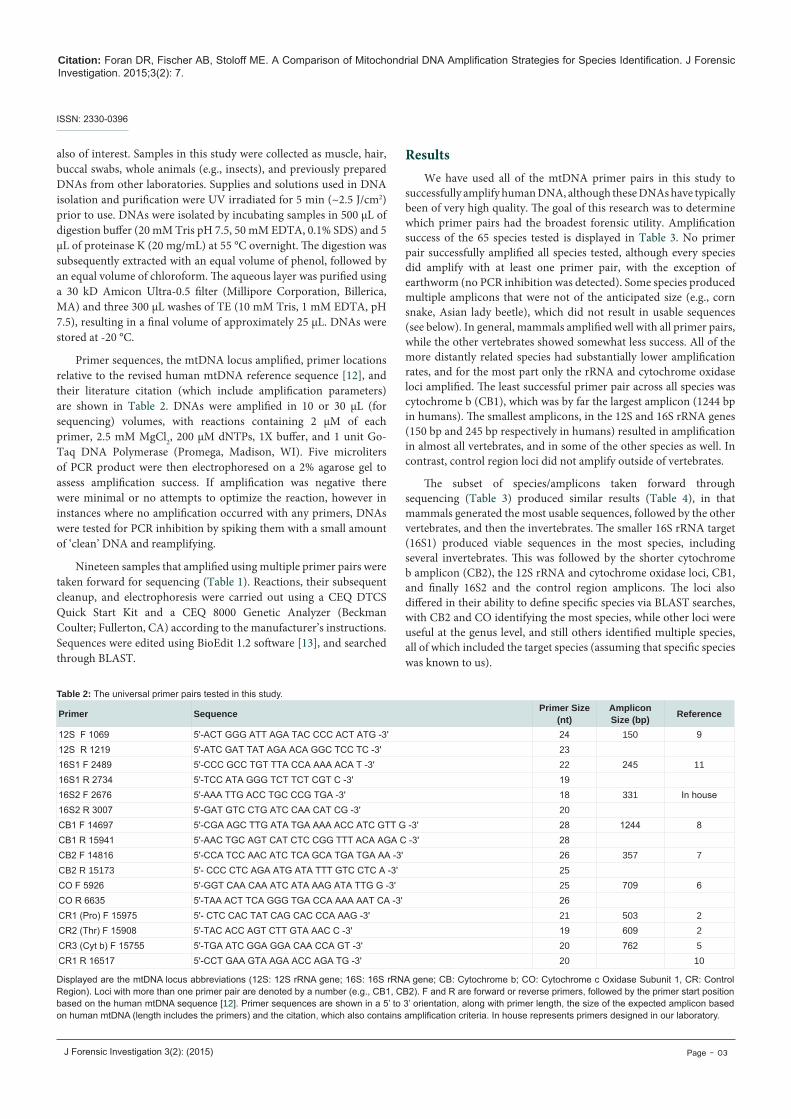
Primer sequences, the mtDNA locus amplified, primer locations relative to the revised human mtDNA reference sequence [12], and their literature citation (which include amplification parameters) are shown in Table 2. DNAs were amplified in 10 or 30 µL (for sequencing) volumes, with reactions containing 2 µM of each primer, 2.5 mM MgCl2, 200 μM dNTPs, 1X buffer, and 1 unit Go-Taq DNA Polymerase (Promega, Madison, WI). Five microliters of PCR product were then electrophoresed on a 2% agarose gel to assess amplification success. If amplification was negative there were minimal or no attempts to optimize the reaction, however in instances where no amplification occurred with any primers, DNAs were tested for PCR inhibition by spiking them with a small amount of ‘clean’ DNA and reamplifying.
Nineteen samples that amplified using multiple primer pairs were taken forward for sequencing (Table 1). Reactions, their subsequent cleanup, and electrophoresis were carried out using a CEQ DTCS Quick Start Kit and a CEQ 8000 Genetic Analyzer (Beckman Coulter; Fullerton, CA) according to the manufacturer’s instructions. Sequences were edited using BioEdit 1.2 software [13], and searched through BLAST.
ResultsWe have used all of the mtDNA primer pairs in this study to
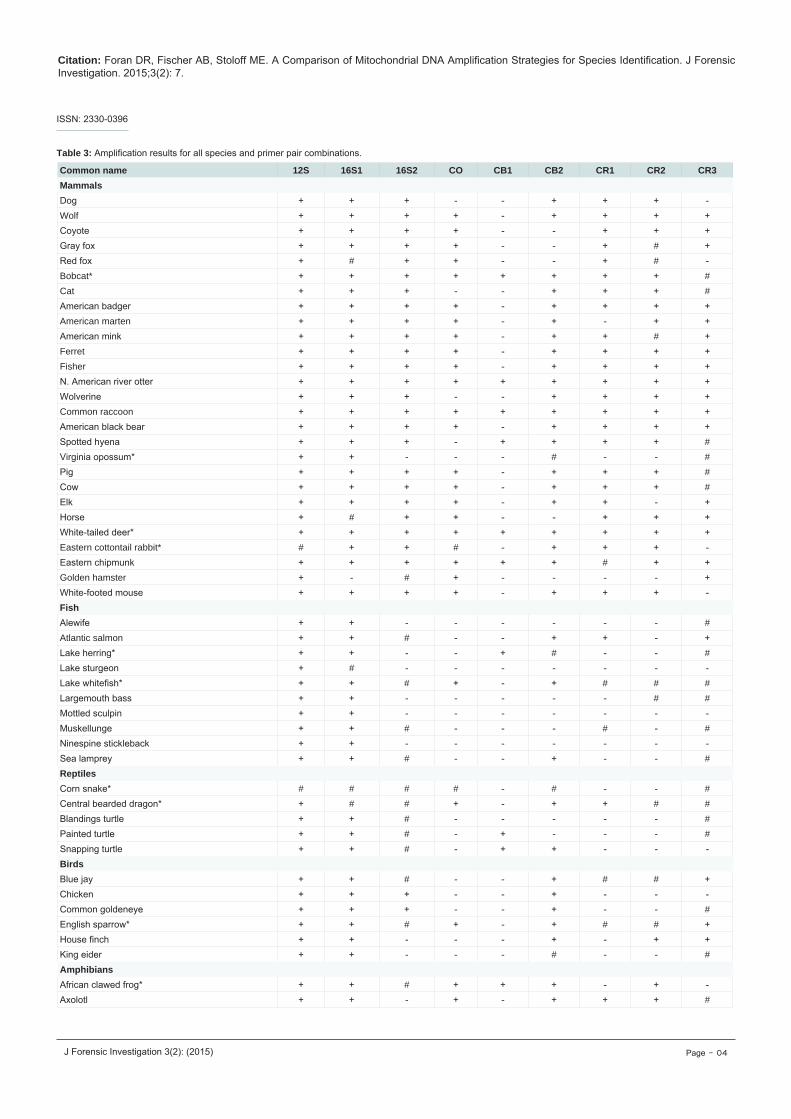
successfully amplify human DNA, although these DNAs have typically been of very high quality. The goal of this research was to determine which primer pairs had the broadest forensic utility. Amplification success of the 65 species tested is displayed in Table 3. No primer pair successfully amplified all species tested, although every species did amplify with at least one primer pair, with the exception of earthworm (no PCR inhibition was detected). Some species produced multiple amplicons that were not of the anticipated size (e.g., corn snake, Asian lady beetle), which did not result in usable sequences (see below). In general, mammals amplified well with all primer pairs, while the other vertebrates showed somewhat less success. All of the more distantly related species had substantially lower amplification rates, and for the most part only the rRNA and cytochrome oxidase loci amplified. The least successful primer pair across all species was cytochrome b (CB1), which was by far the largest amplicon (1244 bp in humans). The smallest amplicons, in the 12S and 16S rRNA genes (150 bp and 245 bp respectively in humans) resulted in amplification in almost all vertebrates, and in some of the other species as well. In contrast, control region loci did not amplify outside of vertebrates.
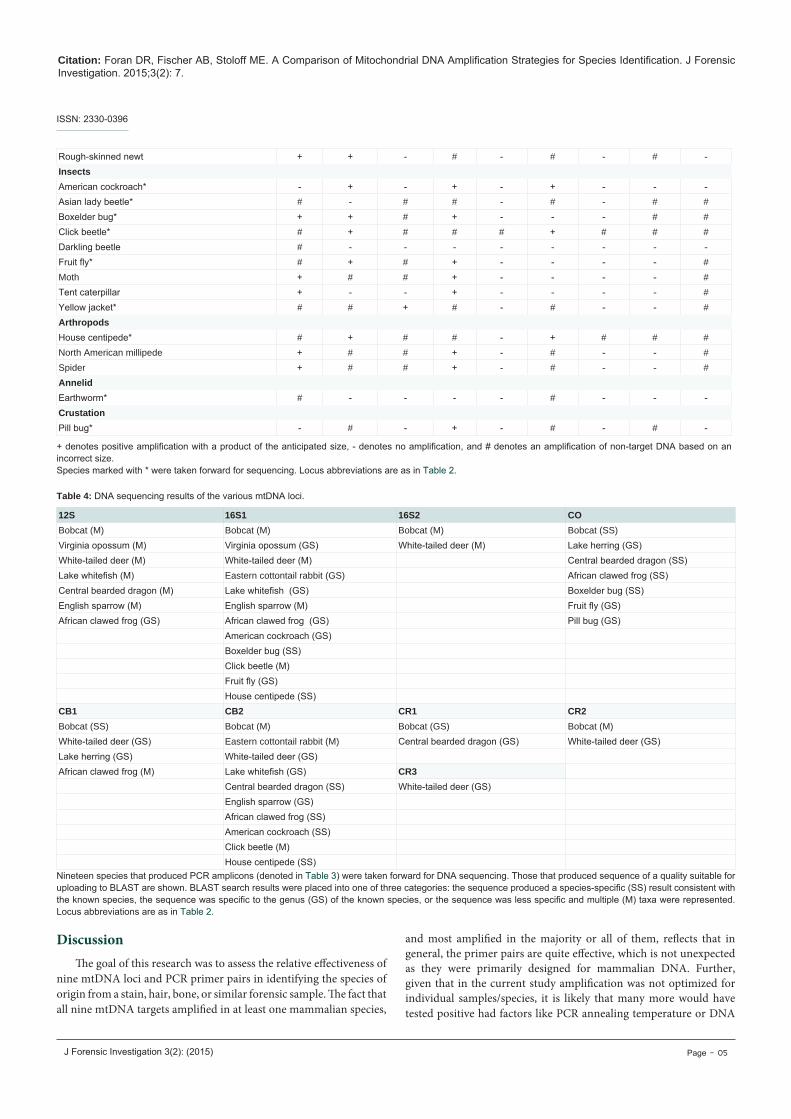
The subset of species/amplicons taken forward through sequencing (Table 3) produced similar results (Table 4), in that mammals generated the most usable sequences, followed by the other vertebrates, and then the invertebrates. The smaller 16S rRNA target (16S1) produced viable sequences in the most species, including several invertebrates. This was followed by the shorter cytochrome b amplicon (CB2), the 12S rRNA and cytochrome oxidase loci, CB1, and finally 16S2 and the control region amplicons. The loci also differed in their ability to define specific species via BLAST searches, with CB2 and CO identifying the most species, while other loci were useful at the genus level, and still others identified multiple species, all of which included the target species (assuming that specific species was known to us).
Primer Sequence Primer Size (nt)
Amplicon Size (bp) Reference
12S F 1069 5'-ACT GGG ATT AGA TAC CCC ACT ATG -3' 24 150 912S R 1219 5'-ATC GAT TAT AGA ACA GGC TCC TC -3' 23 16S1 F 2489 5'-CCC GCC TGT TTA CCA AAA ACA T -3' 22 245 1116S1 R 2734 5'-TCC ATA GGG TCT TCT CGT C -3' 19 16S2 F 2676 5'-AAA TTG ACC TGC CCG TGA -3' 18 331 In house16S2 R 3007 5'-GAT GTC CTG ATC CAA CAT CG -3' 20 CB1 F 14697 5'-CGA AGC TTG ATA TGA AAA ACC ATC GTT G -3' 28 1244 8CB1 R 15941 5'-AAC TGC AGT CAT CTC CGG TTT ACA AGA C -3' 28 CB2 F 14816 5'-CCA TCC AAC ATC TCA GCA TGA TGA AA -3' 26 357 7CB2 R 15173 5'- CCC CTC AGA ATG ATA TTT GTC CTC A -3' 25 CO F 5926 5'-GGT CAA CAA ATC ATA AAG ATA TTG G -3' 25 709 6CO R 6635 5'-TAA ACT TCA GGG TGA CCA AAA AAT CA -3' 26 CR1 (Pro) F 15975 5'- CTC CAC TAT CAG CAC CCA AAG -3' 21 503 2CR2 (Thr) F 15908 5'-TAC ACC AGT CTT GTA AAC C -3' 19 609 2CR3 (Cyt b) F 15755 5'-TGA ATC GGA GGA CAA CCA GT -3' 20 762 5CR1 R 16517 5'-CCT GAA GTA AGA ACC AGA TG -3' 20 10
Table 2: The universal primer pairs tested in this study.
Displayed are the mtDNA locus abbreviations (12S: 12S rRNA gene; 16S: 16S rRNA gene; CB: Cytochrome b; CO: Cytochrome c Oxidase Subunit 1, CR: Control Region). Loci with more than one primer pair are denoted by a number (e.g., CB1, CB2). F and R are forward or reverse primers, followed by the primer start position based on the human mtDNA sequence [12]. Primer sequences are shown in a 5’ to 3’ orientation, along with primer length, the size of the expected amplicon based on human mtDNA (length includes the primers) and the citation, which also contains amplification criteria. In house represents primers designed in our laboratory.
Citation: Foran DR, Fischer AB, Stoloff ME. A Comparison of Mitochondrial DNA Amplification Strategies for Species Identification. J Forensic Investigation. 2015;3(2): 7.
J Forensic Investigation 3(2): (2015) Page - 04
ISSN: 2330-0396
Common name 12S 16S1 16S2 CO CB1 CB2 CR1 CR2 CR3Mammals Dog + + + - - + + + -Wolf + + + + - + + + +Coyote + + + + - - + + +Gray fox + + + + - - + # +Red fox + # + + - - + # -Bobcat* + + + + + + + + #Cat + + + - - + + + #American badger + + + + - + + + +American marten + + + + - + - + +American mink + + + + - + + # +Ferret + + + + - + + + +Fisher + + + + - + + + +N. American river otter + + + + + + + + +Wolverine + + + - - + + + +Common raccoon + + + + + + + + +American black bear + + + + - + + + +Spotted hyena + + + - + + + + #Virginia opossum* + + - - - # - - #Pig + + + + - + + + #Cow + + + + - + + + #Elk + + + + - + + - +Horse + # + + - - + + +White-tailed deer* + + + + + + + + +Eastern cottontail rabbit* # + + # - + + + -Eastern chipmunk + + + + + + # + +Golden hamster + - # + - - - - +White-footed mouse + + + + - + + + -Fish Alewife + + - - - - - - #Atlantic salmon + + # - - + + - +Lake herring* + + - - + # - - #Lake sturgeon + # - - - - - - -Lake whitefish* + + # + - + # # #Largemouth bass + + - - - - - # #Mottled sculpin + + - - - - - - -Muskellunge + + # - - - # - #Ninespine stickleback + + - - - - - - -Sea lamprey + + # - - + - - #Reptiles Corn snake* # # # # - # - - #Central bearded dragon* + # # + - + + # #Blandings turtle + + # - - - - - #Painted turtle + + # - + - - - #Snapping turtle + + # - + + - - -Birds Blue jay + + # - - + # # +Chicken + + + - - + - - -Common goldeneye + + + - - + - - #English sparrow* + + # + - + # # +House finch + + - - - + - + +King eider + + - - - # - - #Amphibians African clawed frog* + + # + + + - + -Axolotl + + - + - + + + #
Table 3: Amplification results for all species and primer pair combinations.
Citation: Foran DR, Fischer AB, Stoloff ME. A Comparison of Mitochondrial DNA Amplification Strategies for Species Identification. J Forensic Investigation. 2015;3(2): 7.
J Forensic Investigation 3(2): (2015) Page - 05
ISSN: 2330-0396
Rough-skinned newt + + - # - # - # -Insects American cockroach* - + - + - + - - -Asian lady beetle* # - # # - # - # #Boxelder bug* + + # + - - - # #Click beetle* # + # # # + # # #Darkling beetle # - - - - - - - -Fruit fly* # + # + - - - - #Moth + # # + - - - - #Tent caterpillar + - - + - - - - #Yellow jacket* # # + # - # - - #Arthropods House centipede* # + # # - + # # #North American millipede + # # + - # - - #Spider + # # + - # - - #Annelid Earthworm* # - - - - # - - -Crustation Pill bug* - # - + - # - # -
+ denotes positive amplification with a product of the anticipated size, - denotes no amplification, and # denotes an amplification of non-target DNA based on an incorrect size.Species marked with * were taken forward for sequencing. Locus abbreviations are as in Table 2.
12S 16S1 16S2 COBobcat (M) Bobcat (M) Bobcat (M) Bobcat (SS)Virginia opossum (M) Virginia opossum (GS) White-tailed deer (M) Lake herring (GS)White-tailed deer (M) White-tailed deer (M) Central bearded dragon (SS)Lake whitefish (M) Eastern cottontail rabbit (GS) African clawed frog (SS)Central bearded dragon (M) Lake whitefish (GS) Boxelder bug (SS)English sparrow (M) English sparrow (M) Fruit fly (GS)African clawed frog (GS) African clawed frog (GS) Pill bug (GS)
American cockroach (GS)Boxelder bug (SS)Click beetle (M)Fruit fly (GS)House centipede (SS)
CB1 CB2 CR1 CR2Bobcat (SS) Bobcat (M) Bobcat (GS) Bobcat (M)White-tailed deer (GS) Eastern cottontail rabbit (M) Central bearded dragon (GS) White-tailed deer (GS)Lake herring (GS) White-tailed deer (GS)African clawed frog (M) Lake whitefish (GS) CR3
Central bearded dragon (SS) White-tailed deer (GS)English sparrow (GS)African clawed frog (SS)American cockroach (SS)Click beetle (M)House centipede (SS)
Table 4: DNA sequencing results of the various mtDNA loci.
Nineteen species that produced PCR amplicons (denoted in Table 3) were taken forward for DNA sequencing. Those that produced sequence of a quality suitable for uploading to BLAST are shown. BLAST search results were placed into one of three categories: the sequence produced a species-specific (SS) result consistent with the known species, the sequence was specific to the genus (GS) of the known species, or the sequence was less specific and multiple (M) taxa were represented. Locus abbreviations are as in Table 2.
DiscussionThe goal of this research was to assess the relative effectiveness of
nine mtDNA loci and PCR primer pairs in identifying the species of origin from a stain, hair, bone, or similar forensic sample. The fact that all nine mtDNA targets amplified in at least one mammalian species,
and most amplified in the majority or all of them, reflects that in general, the primer pairs are quite effective, which is not unexpected as they were primarily designed for mammalian DNA. Further, given that in the current study amplification was not optimized for individual samples/species, it is likely that many more would have tested positive had factors like PCR annealing temperature or DNA
Citation: Foran DR, Fischer AB, Stoloff ME. A Comparison of Mitochondrial DNA Amplification Strategies for Species Identification. J Forensic Investigation. 2015;3(2): 7.
J Forensic Investigation 3(2): (2015) Page - 06
ISSN: 2330-0396
concentration been adjusted. A notable exception was CB1, which failed to amplify not only in most mammals, but in other species as well (discussed below). Minus this, even the most variable mtDNA locus, the control region, amplified well in mammals, noting that all three control region amplicons utilize the same reverse primer, and the forward primers are located in coding regions flanking the control region, not in the control region itself.
The other vertebrate classes produced much different results; most loci amplified sporadically in only a few species. The exceptions were 12S and 16S1, which were effective throughout the phylum. CB2 could also be amplified in the other four classes, though in far fewer species (again, note that no optimization was attempted). Vertebrate DNAs that did amplify produced sequences consistent with their known origin based on BLAST searches.
DNAs from non-vertebrate species amplified sporadically with the various primer pairs. The cytochrome oxidase locus amplified with the greatest frequency, followed by 12S, 16S1, and CB2, although 12S did not result in any usable sequences.
One of the key factors affecting amplification success was, not surprisingly, the length of the amplicon, which is particularly important for forensic samples given the DNA is often degraded. CB1, with an amplicon size of over 1.2 kb, failed to amplify in all but a few instances. In contrast, 12S, at only 150 bp, amplified in almost all vertebrates, which was followed by 16S1 (245 bp), and then the other larger amplicons. However, there was a clear tradeoff between amplicon size and species identification. None of the 12S products identified a specific species during a BLAST search, but instead were consistent with a number of similar species, which would be beneficial for answering a human/non-human question, but far less so if identifying a specific species was important. The CO locus (709 bp), whose amplification was developed for invertebrates [6] but can still be amplified in vertebrate DNA, was highly effective down to the genus and species level, but the large amplicon size, perhaps in conjunction with the highly degenerative primer sequences, meant that many DNAs did not amplify. Still, this gene is widely used for DNA barcoding (http://ibol.org/) given how well it works at the species level. CB2 (357 bp) also identified DNAs to the genus or species level in most cases, while the small 16S1 marker was about equally distributed in identifying species, genus, or less.
The most variable region of mtDNA is, of course, the control region. We have used the control region for species identification in the past [3,4] and found it to be highly effective for species identification. However, owing to its variability, conserved primer sites in the control region can be difficult to locate. Further, because control region amplification often involves a primer site flanking the region (e.g., [2]), it is requisite that gene order be conserved, which is sometimes not the case, even among vertebrates. The control region in invertebrates is often completely different than that in vertebrates, as is gene order, meaning primers may not anneal or that amplicon size can be extremely large. For these reasons it is probably best to utilize primers that anneal within a gene/locus, not ones that span them. This is not to say that the control region has no forensic utility for non-human DNA; because it is so highly variable, once the species of origin is identified, the control region is useful for excluding individuals who could be the source of the evidence, and for including others (e.g., [14]) in the same way human mtDNA is utilized.
A final limitation in identifying species of origin using the strategies tested here lies in the database itself. The mitochondrial genomes of most mammals are generally well represented in GenBank, which is adequate for the vast majority of forensic inquiries. The same is true of many other vertebrates, and of course the various model organisms widely used in science. However, myriad other animals have not been highly studied at the molecular level and thus are absent in GenBank. In some instances a closely related species will be the best ‘match’, while in others it can be a species (or genus, family, or even class) more distant. This was demonstrated in the current study through the large and diverse number of species tested, where in some cases sequences from more obscure species did not generate a hit back to the correct species at all. For example, the click beetle (Elateridae) was not identified at the species level, however there are an estimated 900 species in North America alone (http://www.biokids.umich.edu/critters/Elateridae/), very few of which have had their mtDNA sequenced and uploaded to GenBank. Similarly, darkling beetles (Tenebrionidae) include as many as 20,000 species worldwide (http://www.britannica.com/EBchecked/topic/151709/darkling-beetle), the vast majority of which are undoubtedly not found in the database, meaning it was improbable that precise species identification would occur. Regardless, it was generally possible to differentiate a sample from anything likely to be of forensic interest, to place it with species that can help identify it (e.g., other beetles), and to estimate how precise an identification was based on the percent similarity between the questioned and database samples.
ConclusionsSpecies identification can be a critical undertaking for forensic
scientists, establishing if biological material is human/non-human in origin, or more specifically what the species of origin is. Amplification of mtDNA using universal primers followed by sequencing represents a very useful tool in this regard. Smaller amplicons are more likely to be successfully amplified than are larger ones, however the amount of identification data generated is inversely proportioned, thus it is important to consider both of these factors for species identifications. The results of this study indicate that the 12S and 16S1 rRNA loci amplify well in a wide variety of species, however they can be quite imprecise for species identification owing to small amplicon sizes. In contrast, the large CB1 locus produces abundant data, but is so large that it often does not result in successful amplification. Given this, a prudent strategy is to closely consider the question at hand, and proceed from there. If human/non-human is the primary uncertainty for a forensic sample, one of the small loci (12S or 16S1) can be amplified, as they will generate that differentiation (assuming comparisons are not among higher primates). When a more precise species identification is needed, larger loci such as CB2 or CO are desirable as both were able to identify a much broader set of species, ranging from insects to vertebrates. The CO primers are the most ‘universal’ of all tested, thus if the sample in question has no visual clue as to its origin they should be utilized, the major drawback being that the amplicon is quite large. Finally, amplification and sequencing of the control region can be used to differentiate samples within a species should this be important, utilizing either the ‘universal’ primers described here, or ones that are more species-specific. Overall, the most pragmatic approach for species identification is likely to attempt amplification and sequencing of CB2 or CO, and
Citation: Foran DR, Fischer AB, Stoloff ME. A Comparison of Mitochondrial DNA Amplification Strategies for Species Identification. J Forensic Investigation. 2015;3(2): 7.
J Forensic Investigation 3(2): (2015) Page - 07
ISSN: 2330-0396
The authors thank the many individuals who procured samples for this study, and in particular Dr. Kim Scribner, who supplied us with a large number of vertebrate tissues and DNAs.
Acknowledgements
if unsuccessful, target the smaller loci, followed by control region analysis for the most precise species identification and within-species differentiation.
References
1. Brown WM, George M Jr, Wilson AC (1979) Rapid evolution of animal mitochondrial DNA. Proc Natl Acad Sci U S A 76: 1967-1971.
2. Kocher TD, Thomas WK, Meyer A, Edwards SV, Paabo S, et al. (1989) Dynamics of mitochondrial DNA evolution in animals: amplification and sequencing with conserved primers. Proc Natl Acad Sci U S A 86: 6196-6200.
3. Foran DR, Crooks KR, Minta SC (1997) Species identification from scat: an unambiguous genetic method. Wildl Soc Bull 25: 835-839.
4. Foran DR, Minta SC Heinemeyer KS (1997) DNA-based analysis of hair to identify species, gender and individuals for population research and monitoring. Wildl Soc Bull 25: 840-847.
5. Shields GF, Kocher TD (1991) Phylogenetic relationship of North American ursids based on analysis of mitochondrial DNA. Evolution 45: 218-221.
6. Folmer O, Black M, Hoeh W, Lutz R, Vrijenhoek R (1994) DNA primers for amplification of mitochondrial cytochrome c oxidase subunit I from diverse metazoan invertebrates. Mol Mar Biol Biotechnol 3: 294-299.
7. Parson W, Pegoraro K, Niederstätter H, Föger M, Steinlechner M (2000)
Species identification by means of the cytochrome b gene. Int J Legal Med 114: 23-28.
8. Piaggio AJ, Spicer GS (2001) Molecular phylogeny of the chipmunks inferred from mitochondrial cytochrome b and cytochrome oxidase II gene sequences. Mol Phylogenet Evol 20: 335-350.
9. Melton T, Holland C (2007) Routine forensic use of the mitochondrial 12S ribosomal RNA gene for species identification. J Forensic Sci 52: 1305-1307.
10. Pun KM, Albrecht C, Castella V, Fumagalli L (2009) Species identification in mammals from mixed biological samples based on mitochondrial DNA control region length polymorphism. Electrophoresis 30: 1008-1014.
11. Mitani T, Akane A, Tokiyasu T, Yoshimura S, Okii Y, et al. (2009) Identification of animal species using the partial sequences in the mitochondrial 16S rRNA gene. Leg Med (Tokyo) 11 Suppl 1: S449-S450.
12. Andrews RM, Kubacka I, Chinnery PF, Lightowlers RN, Turnbull DM, et al. (1999) Reanalysis and revision of the Cambridge reference sequence for human mitochondrial DNA. Nat Genet 23: 147.
13. Hall TA (1999) BioEdit: a user-friendly biological sequence alignment editor and analysis program for Windows 95/98/NT. Nucleic Acids Symp Ser 41: 95-98.
14. Gundry RL, Allard MW, Moretti TR, Honeycutt RL, Wilson MR, et al. (2007) Mitochondrial DNA analysis of the domestic dog: control region variation within and among breeds. J Forensic Sci 52: 562-572.