Embed Size (px)
Citation preview
1
1
A comparison of the effect of angels and venture capitalists on innovation and value
creation1
Supradeep Dutta
SUNY Buffalo - School of Management
341 Jacobs Management Center
Buffalo, NY 14260-4000
Timothy B. Folta
University of Connecticut, School of Business
344, School of Business
2100 Hillside Road Unit 1041, Storrs, CT 06269-1041
Running title: Private equity and value creation
Key words: Innovation, Venture Capital, Angel investment, Patents, Value creation
1 The authors are grateful to Robert Wiltbank and Warren Boeker for providing the confidential venture names in the Kauffman Angel Investors Performance Project survey data, and to Vikas Aggarwal, Tim Cason, Gary Dushnitsky, Dan Elfenbein, David Hsu, Deepak Hegde, Martin Kenney, Bill Kerr, Ramana Nanda, Michael Roach, Jeff Reuer, and participants at Wharton Technology Conference and Academy of Management for helpful comments and suggestions.

2
2
Abstract: We examine the influence of private equity, in particular angel groups and venture
capital (VC) investments, in shaping the innovation of technology ventures and in realizing
successful exits. We consider the theoretical and empirical implications of angel group
investment and isolate the separate influences of angels and VCs towards a venture’s innovation
strategy and successful exit, revealing striking insights about their relative contribution. We do
so by tracking 350 technology ventures that receive angel group and VC investment. The
methodologies employed econometrically control for identification issues in the dynamic multi-
stage nature of external capital financing.
3
3
1. INTRODUCTION
Entrepreneurs launching technology-based ventures face considerable risks as they innovate
while assessing technological feasibility, business model credibility, and product or service
viability. These early-stage entrepreneurial risks severely limit capital sources, yet angel
investors and venture capitalists fill this need by assuming risk alongside company founders in
exchange for an equity stake in the company. Capital infusion is one important way private
equity fuels innovation that would not otherwise occur. A second way private equity investors
might fuel firm innovation is by actively engaging founders through strategic counsel around
development and production, and connecting them to key management talent. Accordingly,
private equity is believed to provide more than just money to technology entrepreneurs. In this
paper, we investigate whether private equity does, in fact, impact firm-level innovation beyond
mere capital infusion. Our emphasis is on assessing whether contributions to innovation due to
active engagement differ between angels and venture capitalists (VCs).
Examining the relative impact of angels and VCs on innovation is worthwhile in several
respects. Both have a high concentration of their total investment in seed and early-stage
ventures, where the risks associated with innovation are highest. In 2013, 91 percent of all angel
investment and 35 percent of all venture capital was invested (and 55.6 percent of all deals) in
seed and early stage ventures. It seems entrepreneurs increasingly have a choice between sources
of private equity, so understanding the relative contribution to innovation has considerable
practical importance.1 Of course, in many cases investment by angels or VCs might be viewed as
complements, occurring simultaneously, or sequenced where VCs invest subsequent to angels. In
these cases it is also important to distinguish how each contributes to venture innovation,
empiricists accounting for one type of private equity without accounting for the other risks
4
4
misstating the true effect on innovation. This has important implications for how we interpret
prior empirical research that has focused exclusively on how venture capital contributes to
innovation without considering angel contributions. Finally, there may be theoretical reasons to
expect a difference between how angels and VCs contribute to innovation. Dissimilarities on
such issues as board involvement, investment structure, exit requirement, and ownership control
might inspire varying degrees or effectiveness of active involvement in ventures.
There are a number of empirical challenges to overcome to address our research question.
A focus on angels invites consideration of the full spectrum of different types of angel investors,
ranging across wealthy individuals, former or existing entrepreneurs, or executives with or
without pertinent industry experience, and those organized into angel groups.2 Unfortunately,
there is a lack of data capturing this heterogeneity. Currently, the only data available is that
collected by angel associations from angel groups and networks (OECD, 2011). To overcome
this limitation, we focus on an available sample of technology ventures funded by angel groups.
This focus compromises generalizability of our findings, and may bias the results against finding
differences because angel groups are thought to be similar to early stage VCs along several
dimensions (OECD, 2011). It has the advantage, however, of a conservative test. Moreover, it is
a test worth undertaking because the angel investment sector is not only growing, but is
becoming increasingly more formalized and organized through groups (Ibrahim, 2008) to
leverage economies in due diligence, investment scale and staging, networks, and capability.
These are economies typically enjoyed within venture capital firms. Our analysis compares
innovation in early-stage venture capital backed firms with angel-group backed firms.
Another empirical challenge is in measuring the effects on innovation. This challenge has
two dimensions. On both dimensions we follow precedent. First, we follow precedent in
5
5
measuring innovation through patenting rates and patent citations, the latter of which accounts
for the importance of the patent. Specifically, Kortum and Lerner (2000) apply patent count and
citation per patent measures to examine the impact of venture capital funding on innovation at
industry level, and Lerner et al. (2011) use count measure of forward citations to analyze the
long run effect of private equity investments on innovation. While our approach is consistent
with the prior studies, we recognize that patents may not be a comprehensive measure of
innovation, and discuss this limitation later. Patents have the advantage, however, of being
covered by virtually every field of innovation. Moreover, they have long been used to construct
indicators that serve as proxies for the value of innovation. Therefore, we adopt this practice to
distinguish the value of innovation from commercialization, which is one way to exercise value.
The second dimension of the challenge is distinguishing whether innovation effects are
due to active contributions by investors through their value-added services to ventures
subsequent to investment. We will refer to active contributions as a “treatment” effect and
investment as a selection effect. Selection effects might drive the relationship if certain investors
are able to pick better ventures. For example, we might observe that VCs contribute more to
innovation than angels because VCs conduct more rigorous due diligence. Samila and Sorenson
(2011) argue that firm-level studies could overestimate the benefits of VC if it is merely a VC
selection issue. Treatment effects might drive the relationship if the investor facilitates the
innovation process through endorsement, networks, or governance. We are interested in
examining treatment effects, and our theoretical and empirical analysis gives this special
consideration. To control for the possibility that VCs or angels may merely fund better-quality
firms, which then go on to subsequently innovate more voraciously (in other words, to address
any potential endogeneity or selection issues related to private equity backing), we employ two
6
6
alternative methodologies.3 The first approach is a difference-in-differences estimation used to
measure the changes in venture innovation induced by either angel or VC backing. It enables us
to measure the effect of angels and VCs on patents at a given period of time before and after
investment, while controlling for firm and calendar year effects. The second approach is a
“switching regression” methodology to control for unobservable characteristics that affect both
the likelihood of receiving VC investment (selection effect) as well as ventures’ innovation
outcome. We use the switching regression results to perform a counterfactual analysis that
answers the questions: How would VC-backed ventures innovate if they had not received
venture capital but had only received angel funding, and how would angel-backed ventures
innovate if they have not received angel funding but had received VC funding?
We believe our results have important policy and managerial implications for technical
entrepreneurs seeking to understand the relative impact of angels and VCs in catalyzing
innovation. In the next section, we discuss the existing research linking private equity and
innovation, and present a theoretical rationale for why angel groups and VCs might differentially
influence innovation in their ventures.
2. PRIVATE EQUITY AND INNOVATION
A focus on understanding the relative contributions of VCs and angel groups to innovation
should be important for entrepreneurs of early-stage technology ventures. Such ventures are
notable for the amount of cash they require to move from inception to their early stages, and rely
heavily on capital provided by angels and VCs. Traditionally, angel investors were thought to fill
the niche between friends and family financing, and formal venture capital investors.
Increasingly it is recognized that the investment process is not necessarily as linear as was
presumed in the past (OECD, 2011). This is partly because of the growth of angel groups, which
7
7
tend to invest at a slightly later stage of venture development than traditional angels because they
can pool their resources, facilitating the larger investment often required later in a firm’s
development. It may also be because VCs have dramatically shifted their proportion of
investment allocated to early-stage ventures, and the proportion of deals has increased from 19.5
to 55.6 percent between 2002 and 2013.4 Consequently, angel groups and early stage VCs tend to
invest at the same stage of venture development (Ibrahim, 2008).
When entrepreneurs in technology ventures can choose to source capital either from
angel groups or early stage VCs, their choice might be guided by the terms of the financial
offering, or by the value-added services each may offer. VCs and angel groups are believed to
offer a number of value-added services that may spur innovation and commercialization. For
example, private equity investors might use their networking skills to recruit professional
managerial talent and advisory board members. Klausner and Litvak (2001) report that eBay was
a profitable start-up that did not require outside funding, yet it sought capital from venture
capital firm Benchmark Partners to leverage its connections to secure a seasoned CEO and other
executives. Private equity investors are also thought to create value by providing decision-
making expertise, facilitated by the fact that most have successful experiences in industry as
scientists, engineers, physicians, or entrepreneurs. Sometimes, investors are granted a seat on the
board of directors, enabling them direct involvement in venture decisions around recruiting,
product development, and production. Even if the actions of investors do not affect venture
innovation, it may be that their investment provides an indirect benefit by signaling venture
quality, enabling the venture to better attract partners or managerial talent.
The expectation that private equity investors contribute to venture innovation has inspired
researchers to investigate, and these efforts have several features. First, they focus exclusively on
8
8
how VCs contribute to innovation, at the exclusion of angels or angel groups. Second, they differ
on whether they provide evidence at the industry or firm level. Finally, they differ in the extent
to which they disentangle whether innovation effects are tied to the value-added services of
private equity investors (the treatment effect), or the investment decision (the selection effect).
Several studies report higher innovation rates in industries or regions corresponding to
higher VC investment. For example, Kortum and Lerner (2000) show that in the US, an
industry’s aggregate VC investment level is tied to its patenting rate, after controlling for
technological opportunity.5 Popov and Roosenboom (2012) use a similar approach to study
patenting rates in European industries and regions, and conclude there is a weak link with VC
investment.6 Samila and Sorenson (2011) demonstrate that aggregate regional VC investment
influences patenting rates in US metropolitan areas.7
There has been much research at the firm level of analysis, investigating whether VC
involvement is tied specifically to a venture’s innovation. For example, Kortum and Lerner
(2000) confirm a correlation with VC investment and patenting rates in 530 Middlesex County
ventures, although this effort did not attempt to distinguish between treatment and selection
effects. Engel and Keilbach (2007) confirm a weak relationship between VC investment and
higher patenting rates in German ventures, believing their results suggest a treatment affect (of
value-added services) because they control for selection effects by matching VC-backed ventures
to non-VC-backed ventures identical on certain observable attributes (i.e., industry, patent count
prior to investment, and location) using semi-parametric estimation of the nearest neighbor
match. It is worth noting, however, that a serious limitation of the semi-parametric matching
estimation is that it does not account for any unobservable heterogeneity that may influence VC
investment. VCs consider multiple factors (some of them are tacit) before making investment
9
9
decisions and therefore a matching technique based on some observable factors may not suffice
as an effective control for VC selection effect. A recent work by Lerner et al. (2011) provide
evidence that private equity backed leveraged buyouts (LBOs) pursue more influential
innovations as measured by the number of patent citations received in the years after private
equity investment.
Despite the lack of firm level analysis on the link between private equity and venture
innovation, there is some research pointing toward significant effects of value-added services on
other dimensions of venture success. Again, this evidence is more abundant for VCs than angels.
Below we outline this evidence, first for VCs and then angels, and outline a theory to explain
why we should expect significant treatment effects on innovation, before we test whether the
treatment effects are significantly different from one another.
2.1 VENTURE CAPITALISTS AND VALUE-ADDED SERVICES
The literature highlights three broad streams of research that explain how VCs may augment
innovation or enhance the likelihood of commercialization.
VC’s role as a quality signal and information intermediary. VCs are active investors with an
extended network providing industry information and contacts that are critical for early stage
ventures to establish a foothold in the industry (Sorenson and Stuart 2001). This stream argues
that the involvement of VCs serve as a quality signal, which increases venture visibility and
reduces the cost to search for potential partners. Scholars have found that the endorsement
effects of VCs make VC-backed ventures better able to attract research and commercial partners
(Hsu, 2006) and human capital (Hellmann and Puri, 2002) than non-VC-backed ventures.
Moreover, there is some evidence that endorsement effects are more pronounced when ventures
are in earlier stages (Stuart et al., 1999), where innovation is critical. In addition, VCs also act as
10
10
information intermediaries, providing privileged information access to ventures seeking
appropriate resource partners (Gans et al., 2002). In a similar vein, Burt (1992) and Lindsey
(2002) suggests that the information advantage obtained from VC backing provides access to
potential partners that allow ventures to form more strategic alliances. VC-backed ventures’
ability to garner enhanced cooperation from potential partners and increased visibility suggests
that VC-backed ventures may develop higher quality innovations that are cited more frequently
and thus have a higher economic value. Shan et al. (1994) and Baum et al. (2000) find evidence
that cooperative alliances are linked to ventures’ innovation output.
VC’s role in governance. A second stream emphasizes VCs role in governing their ventures
through efficient contract covenants and board membership, which facilitates the establishment
of a formal structure and monitoring of firm activities (Sahlman, 1990). Since VCs possess
strong business acumen and actively participate in a range of functions that span industrial
segments, they are more likely than founders or internal directors of the venture to be aware of
potential threats and opportunities in the business environment (Hsu, 2006). The impact of VC
governance is profound when ventures are in their early stages where perceived risk is high.
Sapienza (1992) provides empirical support showing that VCs intensify their governance effort
by increasing their interactions with founders in the early stages of development. Similarly, Giot
and Schwienbacher (2007) show that location proximity between the VC and the ventures helps
VCs to better assist and monitor the venture. Baum and Silverman (2004) suggest that while VCs
consider factors like patenting rates, alliance formation, and human capital to make investment
decisions, they also provide mentorship to enhance ventures’ intellectual capital and overall
performance. Implementation of an efficient governance mechanism by securing board
membership and enforcing control right covenants bestows significant decision making rights to
11
11
VCs that influence the ventures’ economic value, for example the timing of commercialization
and the mode of commercialization through IPO or acquisitions. To this effect, empirical
evidence shows VC-backed ventures have faster growth (Chemmanur et al., 2011) and a higher
likelihood of commercialization through an IPO (Hsu, 2006; Shane and Stuart, 2002).
VC’s as financial intermediary. A final way in which VCs may affect innovation and
commercialization is through the incentives to exit in a stipulated time frame (Berglöf, 1994),
which may expedite the development process. VCs are structured as financial intermediaries who
have to generate returns from their fund and exit within a stipulated time frame. While the time-
oriented nature of the VC market may make them less tolerant towards early innovation failures
(e.g., Tian and Wang, 2013), the disciplined approach to exit in a timely fashion may spur
innovation intensity and shorten the commercialization duration of VC-backed ventures.
Hellmann and Puri (2000) found empirical evidence that VC financing is associated with a
significant reduction in the time taken to bring a product to market.
2.2 ANGELS AND ADDED-VALUE TO VENTURE INNOVATION
Unfortunately, there exists no evidence at the industry or firm level about whether angels
influence venture innovation. However, Kerr et al. (2011) examine ventures soliciting funds
from two angel groups, and find that funded ventures have a higher likelihood of survival
compared to those unable to secure angel investment.8 Below, we develop theoretical arguments
about the relative contributions of angels and VCs to innovation.
Angel’s role as a quality signal and information intermediary: Similar to VCs, angel backing
may provide an early endorsement of quality that alleviates uncertainty around the initial stages
of technology development (OECD, 2011; Elitzur and Gavious, 2003). Evidence from field
12
12
interviews and surveys reveals that similar to VCs, angel-group members are active investors
with industry networks that facilitate the recruitment of human capital (Politis, 2008). Shane and
Stuart (2002) argue entrepreneurs’ network that includes angels and VCs enhance their ability to
acquire support from resource holders that can have a significant effect on venture performance.9
Angel’s role in governance: In contrast to VCs, angels generally have a flexible control
mechanism and prefer to adopt an informal hands-on approach instead of board membership
(Ibrahim, 2008). Active angels possess strong industry knowledge about the technology, the
commercialization process, and their prior entrepreneurial experience provides valuable guidance
to shape venture development (Shane, 2008; Politis, 2008). While both angels and VCs offer
mentorship roles in venture development, the flexible control mechanism adopted by angels may
create an environment where entrepreneurs work alongside angels that may eventually increase
venture innovation. Studies reveal that the stringent control rights imposed by VCs may create a
conflicting environment between VCs and entrepreneurs, and it occurs frequently in technology-
intensive ventures (Sapienza, 1992). However, a flexible control mechanism may also provide
challenges to the establishment of an efficient governance structure, affecting the type of
innovation pursued by technology ventures and the likelihood of commercialization.
Angels as direct investors: Angels employ their own capital in funding ventures, unlike VCs, and
do not have the time-oriented performance-based compensation (i.e., 2% management fees and
20% carried interest) omnipresent in the VC market. This basic economic distinction in the
funding structure suggests that there may be differences in the incentives for and challenges to
direct angel funding and indirect VC funding, which in turn may create differences in how angels
and VCs nurture innovation. Unlike VCs, angels have the flexibility to extend investment cycles
(Freear et al., 1994), which might enhance ventures’ long-term innovation. While this may allow
13
13
angels to show higher tolerance for early innovation failures compared to VCs, it may increase
the time and effort required by angels to develop and commercialize ventures’ innovation.
Similarities and differences between angels and VCs bear on their relative contributions
to venture innovation, and ultimately whether these differences influence the time and likelihood
of commercialization. The theoretical arguments suggest that the relative ability of angels and
VCs to nurture innovation may be complementary or substitutive and warrants an empirical
justification of the question.
3. DATA, METHODS, AND VARIABLES
3.1 DATA
Ascertaining whether angels and VCs differentially influence venture innovation is challenging
on a number of dimensions. First, it requires observing innovation for each venture over time,
which we accomplish by matching venture names to patent data.10 Second, it requires a
longitudinal sample of three types of private equity backed ventures: (a) those receiving angel
funding; (b) those receiving VC funding; and (c) those receiving both angel and VC funding. To
our knowledge, no such sample exists. The data collection effort is described below.
Angel-group-backed ventures. The sample of angel-group-backed ventures originates from the
Angel Investment Performance Project (AIPP) survey (Wiltbank and Boeker, 2007), the largest
available data on angel group investors in North America, funded by the Ewing Marion
Kauffman Foundation. It was collected in 2007 from 539 investors representing 86 angel groups
and 1,137 exits from their investments.11 Data were collected online through a questionnaire that
asked for information regarding the investor’s experience, the ventures in which they had
invested, and details about their investment in and exit from those ventures. 276 angel groups
were originally contacted and asked to distribute a survey to their members. Eighty-six of these
14
14
groups (31 percent) participated, and thirteen percent of the members of the eighty-six groups
completed the survey. Although the AIPP data is collected at the investor level, we use the
survey to obtain venture-level data. Since the ventures are anonymous in the publicly available
data, we obtained them directly from the authors. 433 separate ventures were listed in the AIPP
survey, but we focused only on the 218 technology-based ventures, as indicated by their presence
in one of the following SIC Codes: drugs (SIC 283), industrial machinery and equipment (SIC
35), electronic and electrical equipment (SIC 36), scientific instruments (SIC 38), and computer
programming, data processing, and other computer related services (SIC 7371, 7372, 7373). This
set of industries is similar to the study by Hsu (2006), which focused on VC-backed ventures.
The sample was further reduced to 137 after deleting ventures that were based in Canada, spin-
offs, or otherwise had incomplete information.12
We compared the list of 137 angel-group-backed ventures with Thomson One
VentureXpert and found that 58 ventures also received VC investment in the seed/early stage of
the venture. The information from the AIPP Kauffman survey and VentureXpert helps us to
identify the timing of each investment. Out of the 58 ventures, 39 ventures received the VC
investment in the same year they received angel-group investment, 14 ventures received VC
investment in the year following the angel-group investment, and 5 ventures received VC
investment within 2-3 years after the angel-group investment.
VC-backed ventures. Using the 137 angel-group-backed ventures as a starting point, we sought
to develop a representative sample of pure VC-backed ventures from the Thomson One
VentureXpert database that received the VC funding in their seed/early stage and were
comparable to angel-group-backed ventures along a number of dimensions. We adopted the
matching hierarchy technique employed by Hsu (2006), wherein ventures were matched by
15
15
industry 3-digit SIC, year of initial funding, and the founding year. If no match was found using
all three criteria, the founding year criterion was dropped. The funding year and SIC industry
match was always retained, otherwise, no match was declared. This enables us to control for
heterogeneity due to industry effects, time effects, and venture development cycle effects. We
adopted an iterative search process to ensure that the ventures sampled are only VC-backed,
without angel-group involvement, leading to the identification of 213 pure VC-backed
ventures.13
The sample selection and the identification process yielded a dataset of 350 ventures -
137 angel group backed ventures out which 58 ventures also received VC funding in the
seed/early stage, and 213 pure VC-backed ventures. The sources used to isolate these ventures
included information about financing amounts and investment year. To obtain other venture level
information we matched venture names to patent data, and other sources yielding information
about founding year, exits (IPOs, acquisitions, or bankruptcy), and venture location, which were
used to generate control variables, defined in the Appendix.14 From this information we created
an unbalanced panel dataset with observations for each venture running from the founding year
through 2010 or until venture termination. Since the most recent founding year is 2006, we are
able to construct a risk set for patents filed until 2010.
3.2 DEPENDENT VARIABLES
Venture Innovation. We identify all patents associated with ventures. The innovation measures
are based on patent application year (i.e. the year in which the patent application is filed) since it
is closer to the time of the actual innovation (e.g., Griliches et al., 1987). Patent count is
measured as the number of patent applications filed (and subsequently granted) by the venture in
a particular year. To capture the importance of each patent, we construct two measures of
16
16
innovation quality based on forward-citation counts. Following Hall et al. (2001, 2005), the
citation truncation problem is corrected using citation-lag distribution. Consistent with the
literature, we use two variables, (1) citation per patent defined as average number of forward
citations each patent receives in subsequent years, and (2) forward 4-year citation defined as the
number of forward citations within four years of filing for all patents filed in a given year. The
forward 4-year citation measure is constrained for patents filed before December 2008, to
observe forward citations received until 2012. Natural log transformation is used to counter the
right-skewness of the variables. For our sample of 350 firms we observe 2107 patents.
Exit and time to exit. Two types of exits are observed: IPOs and acquisition. Success is coded as
“1” for the year in which the venture exits either through IPO or acquisition, and “0” otherwise.
We also distinguished between exits by IPO and exits by Acquisition.
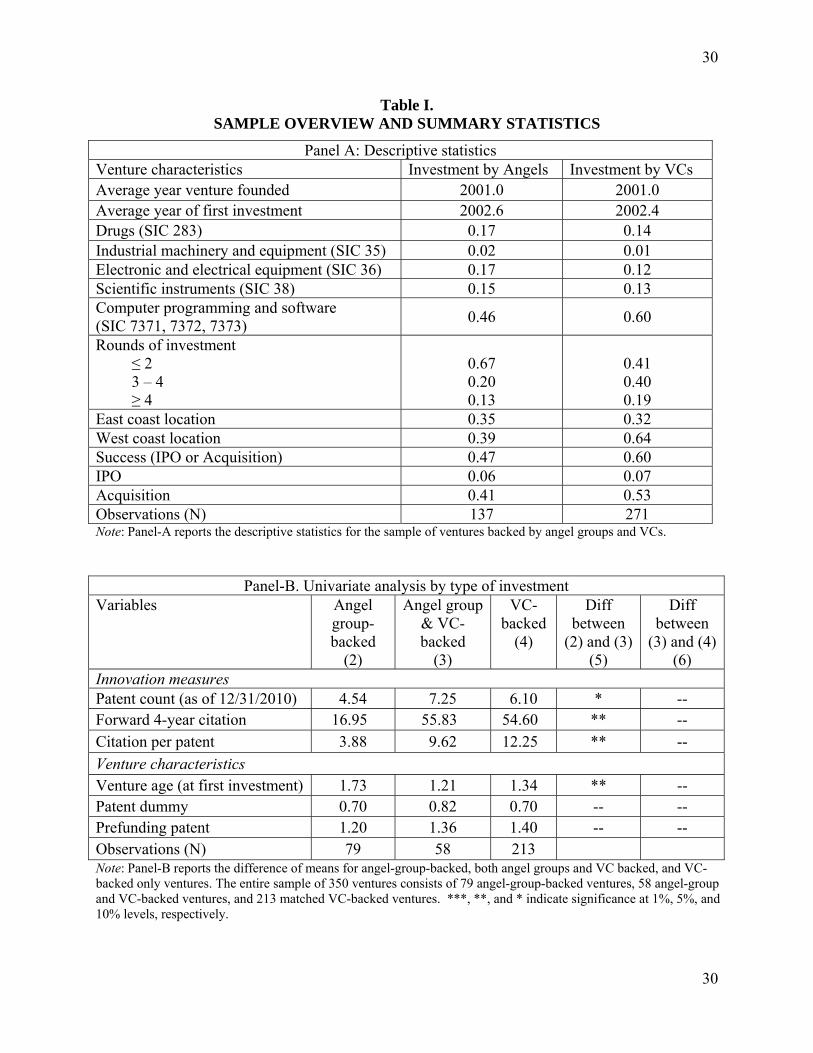
Summary statistics and univariate analysis. Table I, panel-A provides the summary statistics of
the ventures. The average angel-group-backed venture was founded in year 2001 and received its
first funding 19 months later. The average VC-backed venture was also founded in year 2001
and received its first investment 17 months later. The industrial representation of the ventures in
the sample is fairly typical of the broader set of industries funded by VCs. Of the sampled firms,
ventures in computer programming and software had a higher proportion of representation.15
Table I, panel-B reports the means of our variables across different types of private
equity backed ventures. Columns 2-4 report means for ventures backed by angel groups, both
angel groups and VCs, and VCs only, respectively. Columns 5 and 6 report significant
differences across these different types of ventures. While angel-group-backed ventures have
significantly lower values for patent count, citation per patent, and forward 4-year citation
compared to ventures backed by both angel group and VCs, there is no significant difference in

17
17
innovation measures between VC-backed ventures and ventures backed by both angel group and
VCs. We next implement multivariate tests to control for unobserved heterogeneity, and to
assure that attempts to isolate an investor’s ability to impact (or treat) venture innovation and
survival are not confounded with an investor’s ability to select ventures.
[Insert Table I, panel A and B about here]
3.3 MULTIVARIATE METHODS AND RESULTS
We exploit the data with two different methodologies commonly used to disentangle selection
effects from treatment effects and the specification includes firm and year fixed effects.
3.31 Difference-in-differences estimation. We document the dynamic pattern of venture
innovation changes from four years prior to the VC investment year and five years after the VC
investment year, benchmarked against ventures without VC investment (but receiving angel
group investment), and attempt to distinguish between the impact on innovation arising from
selection effects prior to funding and that arising due to the treatment effects of VCs subsequent
to funding. We implement this approach through the following regression specification:
, ∑ , ∑ , , . ,
, (1)
where i indexes ventures and t indexes time. Ln(Yi,t) is the natural log of the dependent variable
(venture innovation). Ln(cumm. dollar inflowi,t) is the natural log of the cumulative dollar ($Mn)
investment received by the venture until year t. Year(t) and Firm(i) captures year and firm fixed
effects. The independent variables include the event-time dummies around the year of first VC
investment that capture residual changes in innovation around the first VC investment year (base
year). The variable Beforeki,t takes the value of ‘1’ if the venture receives VC investment and the
observation is k years prior to the first VC investment year (k = 1, 2, 3, or 4), and ‘0’ otherwise.
18
18
Similarly, Afterki,t is equal to ‘1’ if the venture receives VC investment and the observation is k
years after the first VC investment year (k = 1, 2, 3, 4, or 5), and ‘0’ otherwise. The benchmark,
or control sample, consists of angel-group-backed ventures where Beforeki,t and Afterk
i,t is always
0. Standard errors are clustered at the firm level.16
The specification controls for fixed differences between VC-backed and angel-group-
backed ventures via the firm fixed effects. The coefficient estimates of the event-time dummies
reflect the difference in innovation between VC-backed and angel-group-backed ventures with
respect to the first VC investment year (base year). If it is the VC treatment effect that enhances
the innovation of the ventures, we should observe that VC-backed and angel-group-backed
ventures exhibit a similar innovation trend prior to the first VC investment year (the parallel
trends assumption) and a significant jump in innovation for VC-backed ventures after the first
VC investment year. If, however, VCs only have superior abilities in selecting more innovative
ventures instead of being better able to catalyze innovation, VC-backed ventures should show a
higher level of innovation compared to angel-group-backed ventures, even before the first
investment year and should not exhibit a significant jump in venture innovation compared to
angel-group-backed ventures after the first VC investment year. Therefore, the difference-in-
differences estimation effectively separates selection from treatment effects.
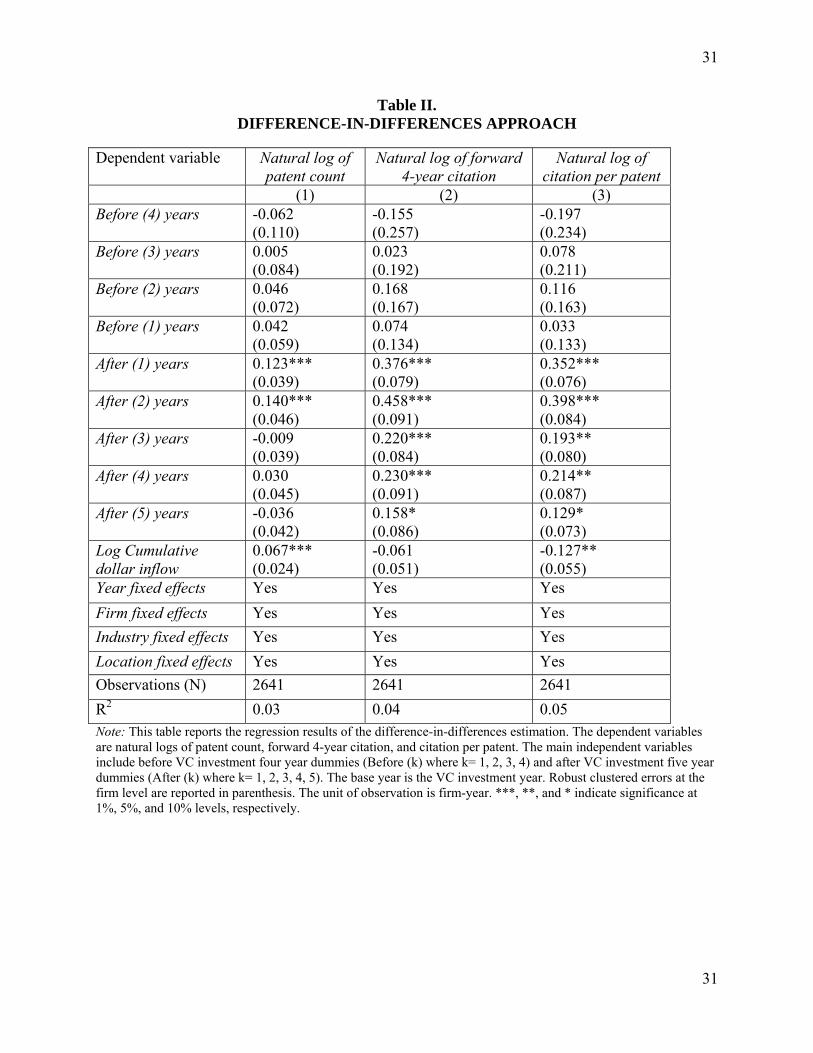
3.32 Difference-in-differences analysis. In Table II, the dependent variables (columns 1 – 3) are
natural logs of patent count, forward 4-year citation, and citation per patent. The coefficient
estimates of the before year dummies (Before (k)) are not significant in all three columns,
suggesting that angel group and VC-backed firms do not exhibit substantial differences in
innovation outcome before the first VC (angel group) investment year. It also supports the
parallel trends assumption of the differences-in-differences identification estimation. Analyzing
19
19
the after year dummies (After (k)), we find that for patent count, the influence of VCs appears
significant for the first and second year post VC investment, but remains insignificant thereafter.
However, the citation-based measures show a significant jump in the post-investment period and
continue to remain significant in the first investment year. The results suggest that VCs and angel
groups have a similar impact on patent counts, but the relative impact on patent citation measures
is significantly higher for VC-backed ventures.17
[Insert Table II about here]
3.33 Switching regression estimation. In applying the switching regression, we are interested in
analyzing how the potential innovation outcomes would shape if the venture that received VC
investment did not have such an investment. Specifically, the analysis aims to answer two
questions. First, what would the innovation outcome of a venture receiving VC investment have
been had it not received VC financing? Second, what would the innovation outcome of a venture
that did not receive VC investment (but receives angel investment) have been had it received VC
financing?
We adopt a generalized version of the traditional Heckman model (Heckman, 1979) that
accounts for the effect of unobservable heterogeneity by using the inverse Mills ratio.18 In the
two-step analysis, the first stage dynamic probit regression predicts the probability of VC
investment that reflects the VC selection equation and calculates the inverse Mills ratios for
ventures that receive VC investment and for ventures that do not receive VC investment. The
inverse Mills ratio captures unobservable factors that VCs may use to select better-quality firms.
In the second stage, we regress venture innovation on the inverse Mills ratio and control
variables separately for VC-backed and angel-group-backed ventures. Because we are interested
in the difference in innovation between VC-backed and angel-group-backed ventures, the
20
20
expected value of venture innovation is conditional on receiving VC investment. Therefore, we
should assess the estimates' properties for VC-backed and angel-group-backed ventures
separately.19
Finally, the predicted values from the second stage regression for VC-backed and angel-
group-backed ventures are used through a hypothetical (counterfactual) analysis to answer the
questions highlighted above. We compute the hypothetical innovation for VC-backed ventures
had they not received VC investment and the hypothetical innovation for angel-group-backed
ventures had they received VC investment. Multiplying the coefficient estimates obtained from
the second stage analysis of VC-backed ventures with the vector of venture attributes for the
subsample of VC-backed ventures provides the predicted venture innovation. To assess the
hypothetical venture innovation of VC-backed ventures had they not received VC investment,
we multiply the coefficient estimates obtained from the second stage analysis of angel-group-
backed ventures by the vector of venture attributes for the subsample of VC-backed ventures.
Likewise, we calculate the predicted venture innovation of angel-group-backed ventures and the
hypothetical venture innovation of angel-group-backed ventures had they received VC
investment.
In the empirical specification, we control for variables related to the venture and to the
VC investment market that could affect VC-firm matching such as venture age, cumulative
patents filed by the venture before VC investment, venture location, industry, and time dummy
capturing the internet bubble period. In addition, we include exogenous variables that influence
the supply and demand of VC investments in the economy in a given year but are independent of
the future innovation outcome of a venture: a) pension fund is the size of local and state pension
fund alternative investments assets lagged by one year and adjusted for USD 2013 dollar terms.20
21
21
State pension funds are a major source for raising VC capital and therefore it captures the
aggregate variation in the supply of VC funding available to the ventures in a given state and in a
given year (Mollica and Zingales, 2007); and b) prior VC funds raised is the average number of
VC funds raised over the five year period prior to the VC investment year in the venture.
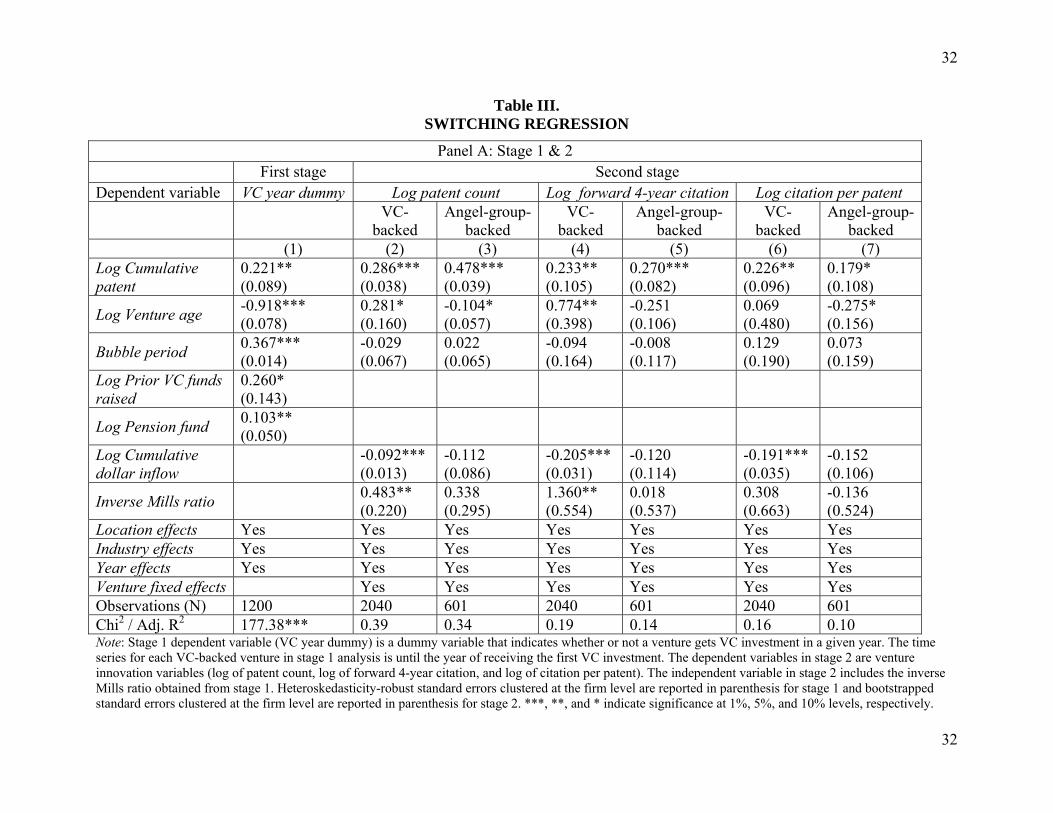
3.34 Switching regression analysis. Table III (panel A), column 1 reports the results for the first
stage probit estimation. The dependent variable is VC year dummy that is equal to ‘1’ for VC
investment year and ‘0’ otherwise.21 Cumulative patents filed prior to VC investment and the
bubble period variables are positive and significant determinants of receiving VC investment.
With regard to exogenous variables that affect the demand and supply in the VC market, we find
that the coefficients of pension fund and prior VC funds raised are both positive and significant,
suggesting that the availability of funds to VCs is an important factor for VC investment
(Gompers and Lerner, 1998). Columns 2-7 report the second-stage regressions for VC-backed
and angel-group-backed ventures with the inverse Mills ratio calculated from the first stage. The
second-stage results show that while the inverse Mills ratio is mostly positive and significant for
VC-backed ventures, it remains insignificant for angel-group-backed ventures for all three
measures of venture innovation. This suggests that relative to angel groups, VCs may also use
some unobservable factors to select ventures, and the unobservable factors also positively affect
the future innovation of ventures receiving a VC investment. Therefore, proper control for this
unobservable selection effect enables us to attribute the residual innovation of VC-backed
ventures to the treatment effect of VCs.
[Insert Table III, panel A and B about here]
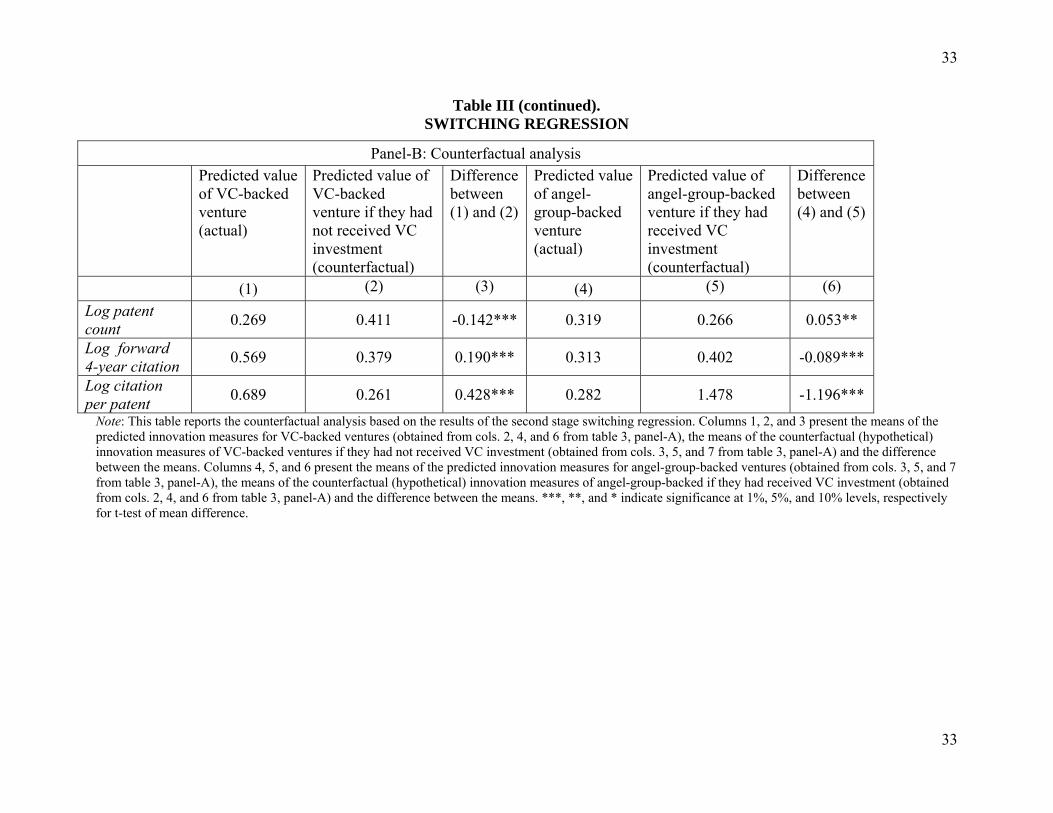
Table III (panel B) reports the results for the counterfactual analysis for VC-backed
versus angel-group-backed ventures. Interestingly, the patent count results suggest that, on
22
22
average, VC-backed ventures achieve a 14.2% lower patent count compared to what the same
venture could have achieved had they not received VC investment, suggesting that VCs in fact
have a negative effect on patent count and therefore do not nurture venture innovation by
increasing the patent rate. Similarly, angel-group-backed ventures, on average, achieve a 5.3%
higher patent count compared to what they could have achieved had they received VC
investment. However, results based on patent citation measures reveal that on average, VC-
backed ventures achieve a significantly higher citation compared to what the same venture could
have achieved had they not received VC investment, suggesting that VCs have a strong positive
effect in enhancing the quality of innovations by increasing patent citations. The counterfactual
analysis of angel-group-backed ventures also shows that the same venture could have generated
significantly higher patent citations had they received VC investment. The increase in patent
citations attributed to the VC catalyzing effect is consistent with our earlier results presented in
Table 2. In summary, the results overall emphasize that the nurturing effect of VCs compared to
angel-groups drives ventures’ innovation quality rather than the innovation rate.
3.35 Effect on innovation commercialization – Hazard rate estimation. Finally, we equate
venture performance with successful exit. The timing of exit through an IPO and the timing of
exit through an acquisition are two common performance measures for technology ventures.
While external investments from VCs and angel groups nurture innovation in different ways, as
highlighted in our results, the economic objective of private equity investment is to earn returns
by commercializing the innovation and exiting either through an IPO or acquisition. We
therefore examine differences in the time-to-exit for VC-backed and angel-group-backed
ventures by employing a parametric accelerated time-to-exit model with log-normal distribution
(a hazard model with log time as dependent variable), similar to Hochberg et al. (2007).22
23
23
Although our results are robust for alternative distributions (exponential, Weibull), the advantage
of log normal distribution is that the hazard rate is not monotonic and does not consider a
constant hazard rate. Time-to-exit of ventures yet to exit successfully by the close of 2010 is
right censored at the end of calendar year 2010 to allow for the possibility that they may exit
successfully after the end of our sample period. We relate the log time-to-exit to the type of
private equity investment received by the venture, controlling for venture attributes (patent
count, cumulative dollar inflow, venture location, and industry), funding year effects, and
conditions in the IPO and M&A exit markets. To measure exit market conditions, we use the
quarterly log number of IPOs and the quarterly log number of M&A deals prior to venture exit
(lagged by a quarter). The model allows for time-varying covariates.
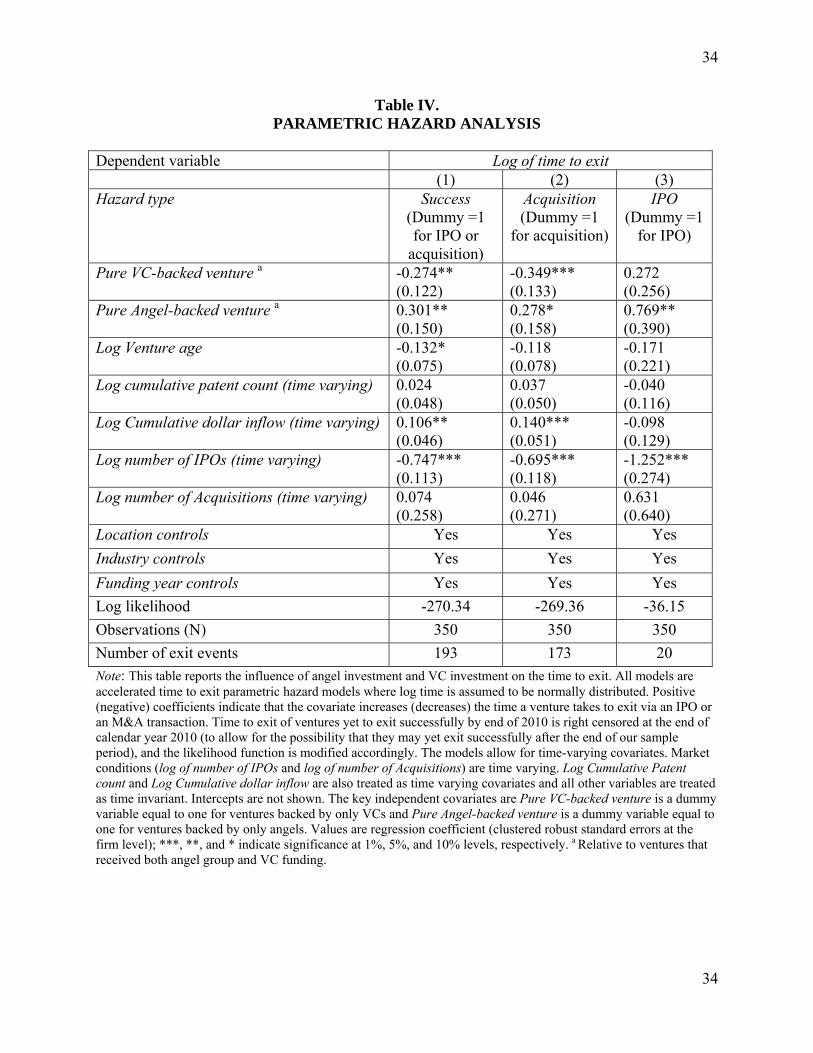
3.36 Parametric hazard rate analysis. Table IV presents the accelerated time-to-exit parametric
hazard (duration) analysis where log time is the dependent variable. Positive (negative)
coefficients indicate that the covariate increases (decreases) the time a venture takes to exit via
an IPO or an acquisition transaction. The key variables of interest are the dummy variables Pure
Angel-backed Venture and Pure VC-backed Venture, and are compared against the missing
category where a venture received funding from both types of sources. Column 1 suggests that
pure angel-group-backed ventures take longer to achieve a successful exit than ventures
receiving funding purely from VCs and both VCs and angel groups. T-tests also confirm that
angel-group-backed ventures are slower to exit than pure VC-backed ventures. When we
differentiate between types of exit in columns 2 and 3, it appears that these results seem
particularly suitable for acquisition events. Pure angel-group-backed ventures take longer to
achieve IPO compared to ventures backed by both angels and VCs. In summary, the findings
24
24
suggest that VCs strong incentives to exit ensures that VC-backed ventures take a relatively
shorter time to realize an exit event compared to angel-backed ventures.
[Insert Table IV about here]
5. DISCUSSION AND CONCLUSION
This study examines the influence of private equity investments on venture innovation and
commercialization, and is the first to distinguish between types of private equity investor. It does
so by considering the different theoretical implications of angels and venture capital firms and
empirically isolating their separate influences. We have argued that simultaneous consideration
of both is important because early-stage venture capitalists and angel groups are structurally
different, and this may have dissimilar consequences in catalyzing venture innovation.
Moreover, focusing on angel investment may be critical because a sole focus on venture capital’s
effects may be spurious, as angel investments may be endogenous to venture capital investments.
To decouple the influence of angel and venture capital investment, we assembled a novel dataset
of ventures backed by angel groups and early-stage venture capital representing five technology-
intensive SIC industries. Several results are worth highlighting.
Researchers studying venture capitalists will be interested in the reported findings
because it has significant implications for how we interpret the true effect of venture capital
investment in nurturing innovation by taking into account other potential sources of private
equity investment. It seems that in some cases, ignoring angel investments is not a fatal flaw
when studying the impact of venture capital at the firm level. When studying innovation quality
or performance through successful exit, our results demonstrate that venture capital influence is
significantly higher compared to angel influence. The same conclusion cannot be drawn when
25
25
studying innovation rates, a common strategy in our field. Venture capitalist influence almost
disappears in the presence of prior angel influence.
Researchers studying angels will be interested in our findings because it provides insight
into their contribution relative to venture capitalists. The findings suggest that venture capitalists
provide a critical complement to angels by facilitating greater innovation quality in their
portfolio firms and a faster realization of returns. Scholars may also be interested in investigating
the extent that ventures receiving angel funding have advantages over those that do not. While
there is some evidence that they survive longer (Kerr et al., 2011), future research might consider
the full spectrum of ventures both with and without private equity funding, and compare them
along the full set of performance metrics. One critical challenge in studying angel investors is the
fact that their investments are difficult to observe. We overcome this problem by focusing on
angel groups. Angel groups are considered a very structured form of angel investment, closely
resembling early stage VC investments. While our results are not necessarily generalizable to all
angel investor types, future research might also seek evidence in this regard.
The interpretation of the higher innovation quality produced under venture capital
influence has a number of possible explanations. It may be possible that innovation quality is not
improved, but that the forward citation measures capture social network effects tied to venture
capital. For example, it may be that a venture capitalist’s established ties, including its other
portfolio firms, are prone to citing the focal venture’s patents. It may also be that venture capital
investment tends to have better media coverage that sends a strong VC endorsement signal to the
market (Stuart et al., 1999; Hsu, 2006) and enhance a venture’s visibility. To gain some insight
on this aspect, we calculated the unique number of times a venture appeared in Factiva news
after VC investment. The Factiva news count shows a significant correlation (ρ=0.21) with the

26
26
citation measure, indicating that there may be some credence to the visibility explanation, though
more research is required to test this possibility. An alternative interpretation to the link between
venture capital investment and innovation quality is that venture capitalists tend to “swing for the
fence” in their portfolio ventures, seeking to build businesses of considerable importance. We
find some evidence of this by looking at standard deviations of citation measures across ventures
receiving either angel or venture capital investment. Venture capital-backed ventures have much
higher standard deviations in their citation measures, and future research should investigate why
venture capital backed ventures have higher innovation quality than angel-backed ventures.
Although patents play a central role in empirical research on innovation, there is a great
deal of heterogeneity across industries and firms in the way in which innovation is pursued.
Since firms strategically choose whether or not to pursue patents, patent acquisition is
endogenous to the firm’s decision, and causality claims linking patents to innovation should be
viewed more conservatively. We attempt to alleviate this concern by sampling technology
industries where innovation expressed through patents is prevalent.
Very little work has examined the impact of angel investors on venture innovation and
development, and it is natural to question whether they contribute in a meaningful way to a
venture’s success. Our work is the first to formally compare the relative contribution of angels
with venture capitalists. It provides initial evidence detailing where angels might substitute for
venture capitalists and where they may contribute in complementary ways to the venture. It also
speaks to researchers studying venture capital influence, and establishes future protocol for
empirical research in that context. It is worthwhile for future researchers to compare the long
term effect of venture capital and angel investment on innovation given the time sensitive nature
of venture capital investments that makes them less tolerant to early innovation failures. As a
27
27
practical implication of our research, it is important for the technology entrepreneur to
understand the relative contribution of different types of private equity investors and what value
they might bring to the venture.
REFERENCES
Baum, J., T. Calabrese, and B.S. Silverman, 2000, “Don’t go it alone: Alliance network composition and startups’ performance in Canadian biotechnology,” Strategic Management Journal, 21, 267–294.
Baum, J.A. and B.S. Silverman, 2004, “Picking winners or building them? Alliance, intellectual, and human capital as selection criteria in venture financing and performance of biotechnology startups,” Journal of Business Venturing, 19, 411-436.
Berglöf, E., 1994, “A control theory of venture capital finance”, Journal of Law, Economics, and Organization, 247-267.
Bertrand, M. and S. Mullainathan, 2003, “Enjoying the quiet life? Corporate governance and managerial preferences,” Journal of Political Economy, 111, 1043-1075.
Burt, R.S., 1992, Structural Holes: The Social Structure of Competition, Harvard University Press, Cambridge, MA.
Chemmanur, T.J., K. Krishnan, and D. Nandy, 2011, “How does Venture Capital financing improve efficiency in private firms? A look beneath the surface,” Review of Financial Studies, 24, 4037-4090.
Chemmanur, T.J., S. He, and D. Nandy, 2010, “The going-public decision and the product market,” Review of Financial Studies, 23, 1855-1908.
Elitzur, R. and A. Gavious, 2003, “Contracting, signaling, and moral hazard: a model of entrepreneurs, angels, and venture capitalists,” Journal of Business Venturing, 18, 709-725.
Engel, D. and M. Keilbach, 2007, “Firm-level implications of early-stage venture capital investment – An empirical investigation,” Journal of Empirical Finance, 14, 150-167.
Freear, J., J.E. Sohl, and W.E. Wetzel, 1994, “Angels and Non-Angels: Are There Differences?,” Journal of Business Venturing, 9, 109-123.
Gans, J.S., D.H. Hsu, and S. Stern, 2002, “When does start-up innovation spur the gale of creative destruction?,” RAND Journal of Economics, 33, 571–586.
Giot, P. and A. Schwienbacher, 2007, “IPOs, trade sales and liquidations: Modelling venture capital exits using survival analysis,” Journal of Banking and Finance, 31, 679-702.
Gompers, P., and J. Lerner, 1998, “What drives Venture Capital fund-raising?,” Brookings Papers on Economic Activity and Microeconomics, 149–204.
28
28
Griliches, Z., B.H. Hall, and A. Pakes, 1987, “The value of patents as indicators of inventive activity,” in P. Dasgupta and P. Stoneman, eds., Economic Policy and Technological Performance, Cambridge: Cambridge University Press.
Hall, B.H., A. Jaffe, and M. Trajtenberg, 2001, The NBER patent citations data file: Lessons, insights and methodological tools,” NBER Working Paper Series 8498.
Hall, B.H., A. Jaffe, and M. Trajtenberg, 2005, “Market value and patent citations,” RAND Journal of Economics, 36, 16-38.
Heckman, J. J.,1979, “Sample Selection Bias as a Specification Error,” Econometrica, 47, 153–61.
Hellmann, T. and M. Puri, 2000, “The interaction between product market and financing strategy: The role of venture capital,” Review of Financial Studies, 13, 959-984.
Hellmann, T. and M. Puri, 2002, “Venture capital and the professionalization of start-up firms: Empirical evidence,” The Journal of Finance, 57, 169–197.
Hochberg, Y., A. Ljungqvist, and Y. Lu, 2007, “Whom you know matters: Venture Capital networks and investment performance,” The Journal of Finance, 62, 251-302.
Hsu, D.H., 2006, “Venture capitalists and cooperative start-up commercialization strategy,” Management Science, 52, 204-219.
Ibrahim, D.M., 2008, “The (not so) puzzling behavior of angel investors,” Arizona Legal Studies Discussion Paper 07–16, University of Arizona, James E. Roberts College of Law, AZ.
Kerr, W., J. Lerner, and A. Schoar, 2011, “The consequences of entrepreneurial finance: Evidence from angel financings,” Review of Financial Studies, forthcoming.
Klausner, M., and K. Litvak, 2001, “What economists have taught us about venture capital contracting,” in M.J. Whincop, ed., Bridging the entrepreneurial financing gap: Linking governance with regulatory policy, Ashgate.
Kortum, S., and J. Lerner, 2000, “Assessing the contribution of venture capital to innovation,” RAND Journal of Economics, 31, 674-692.
Lai, R., A. D’Amour, A. Yu, Y. Sun, and L. Fleming, 2011, “Disambiguation and co-authorship networks of the U.S. patent inventor database (1975-2010),” Working paper, Harvard University, MA.
Lerner, J., M. Sorensen, and P. Strömberg, 2011, “Private equity and long‐run investment: The case of innovation,” The Journal of Finance, 66, 445-477.
Lindsey, L, 2002, “The Venture Capital Keiretsu effect: An empirical analysis of strategic Alliances among portfolio firms,” Unpublished working paper, Stanford University.
Maddala, G. S., 1983, Limited Dependent and Qualitative Variables in Econometrics, Econometric Society Monographs No. 3, Cambridge: Cambridge University Press.
Manso, G., 2011, “Motivating Innovation,” The Journal of Finance, 66, 1823-1860.
Mason, C.M. and R.T. Harrison, 2002, “Is it worth it? The rates of return from informal venture capital investments,” Journal of Business Venturing, 17, 211-236.
Mollica, M. and L. Zingales, 2007, “The impact of venture capital on innovation and the creation of new businesses,” Unpublished working paper, University of Chicago, IL.
29
29
OECD, 2011, Financing High-Growth Firms: The Role of Angel Investors, OECD Publishing.
Politis, D., 2008, “Business angels and value added: what do we know and where do we go?,” Venture Capital, 10, 127-147.
Popov, A. and P. Roosenboom, 2012, “Venture capital and patented innovation: evidence from Europe,” Economic Policy, 27, 447-482.
Sahlman, W. A., 1990, “The structure and governance of venture-capital organizations,” Journal of Financial Economics, 27, 473-521.
Samila, S., and O. Sorenson, 2011, “Venture capital, entrepreneurship, and economic growth,” Review of Economic Statistics, 93, 338-49.
Sapienza, H. J., 1992, “When do venture capitalists add value?,” Journal of Business Venturing, 7, 9-27.
Shan, W., G. Walker, and B. Kogut, 1994, “Interfirm cooperation and startup innovation in the biotechnology industry,” Strategic Management Journal, 15, 387–394.
Shane, S., 2008, “The importance of Angel investing in financing the growth of entrepreneurial ventures,” Working Paper 331, U.S. Small Business Administration, Office of Advocacy.
Shane, S. and T. Stuart, 2002, “Organizational endowments and the performance of university start-ups,” Management Science, 48, 154-170.
Shaver, J. M., 1998, “Accounting for endogeneity when assessing strategy performance: Does entry mode choice affect FDI survival?,” Management Science, 44, 571-585.
Sorenson, O. and T. Stuart, 2001, “Syndication networks and the spatial distribution of venture capital investments,” American Journal of Sociology, 106, 1546-1588.
Stuart, T.E., H. Hoang, and R. Hybels, 1999, “Interorganizational endorsements and the performance of entrepreneurial ventures,” Admininstrative Science Quarterly, 44, 315-349.
Tian, X. and T. Wang, 2013, “Tolerance for failure and corporate innovation,” Review of Financial Studies, forthcoming
Wiltbank, R., and W. Boeker, 2007, “Angel investor performance project: Data overview,” Social Science Research Network (SSRN) 1024714.
30
30
Table I. SAMPLE OVERVIEW AND SUMMARY STATISTICS
Panel A: Descriptive statistics Venture characteristics Investment by Angels Investment by VCs Average year venture founded 2001.0 2001.0 Average year of first investment 2002.6 2002.4 Drugs (SIC 283) 0.17 0.14 Industrial machinery and equipment (SIC 35) 0.02 0.01 Electronic and electrical equipment (SIC 36) 0.17 0.12 Scientific instruments (SIC 38) 0.15 0.13 Computer programming and software (SIC 7371, 7372, 7373)
0.46 0.60
Rounds of investment ≤ 2 3 – 4 ≥ 4
0.67 0.20 0.13
0.41 0.40 0.19
East coast location 0.35 0.32 West coast location 0.39 0.64 Success (IPO or Acquisition) 0.47 0.60 IPO 0.06 0.07 Acquisition 0.41 0.53 Observations (N) 137 271 Note: Panel-A reports the descriptive statistics for the sample of ventures backed by angel groups and VCs.
Panel-B. Univariate analysis by type of investment
Variables Angel group- backed
(2)
Angel group & VC- backed
(3)
VC- backed
(4)
Diff between
(2) and (3) (5)
Diff between
(3) and (4) (6)
Innovation measures Patent count (as of 12/31/2010) 4.54 7.25 6.10 * -- Forward 4-year citation 16.95 55.83 54.60 ** -- Citation per patent 3.88 9.62 12.25 ** --
Venture characteristics Venture age (at first investment) 1.73 1.21 1.34 ** -- Patent dummy 0.70 0.82 0.70 -- -- Prefunding patent 1.20 1.36 1.40 -- -- Observations (N) 79 58 213 Note: Panel-B reports the difference of means for angel-group-backed, both angel groups and VC backed, and VC-backed only ventures. The entire sample of 350 ventures consists of 79 angel-group-backed ventures, 58 angel-group and VC-backed ventures, and 213 matched VC-backed ventures. ***, **, and * indicate significance at 1%, 5%, and 10% levels, respectively.
31
31
Table II. DIFFERENCE-IN-DIFFERENCES APPROACH
Dependent variable Natural log of
patent count Natural log of forward
4-year citation Natural log of
citation per patent (1) (2) (3) Before (4) years -0.062
(0.110) -0.155 (0.257)
-0.197 (0.234)
Before (3) years 0.005 (0.084)
0.023 (0.192)
0.078 (0.211)
Before (2) years 0.046 (0.072)
0.168 (0.167)
0.116 (0.163)
Before (1) years 0.042 (0.059)
0.074 (0.134)
0.033 (0.133)
After (1) years 0.123*** (0.039)
0.376*** (0.079)
0.352*** (0.076)
After (2) years 0.140*** (0.046)
0.458*** (0.091)
0.398*** (0.084)
After (3) years -0.009 (0.039)
0.220*** (0.084)
0.193** (0.080)
After (4) years 0.030 (0.045)
0.230*** (0.091)
0.214** (0.087)
After (5) years -0.036 (0.042)
0.158* (0.086)
0.129* (0.073)
Log Cumulative dollar inflow
0.067*** (0.024)
-0.061 (0.051)
-0.127** (0.055)
Year fixed effects Yes Yes Yes
Firm fixed effects Yes Yes Yes
Industry fixed effects Yes Yes Yes
Location fixed effects Yes Yes Yes
Observations (N) 2641 2641 2641
R2 0.03 0.04 0.05 Note: This table reports the regression results of the difference-in-differences estimation. The dependent variables are natural logs of patent count, forward 4-year citation, and citation per patent. The main independent variables include before VC investment four year dummies (Before (k) where k= 1, 2, 3, 4) and after VC investment five year dummies (After (k) where k= 1, 2, 3, 4, 5). The base year is the VC investment year. Robust clustered errors at the firm level are reported in parenthesis. The unit of observation is firm-year. ***, **, and * indicate significance at 1%, 5%, and 10% levels, respectively.
32
32
Table III. SWITCHING REGRESSION
Panel A: Stage 1 & 2 First stage Second stage Dependent variable VC year dummy Log patent count Log forward 4-year citation Log citation per patent
VC-
backed Angel-group-
backed VC-
backed Angel-group-
backed VC-
backed Angel-group-
backed (1) (2) (3) (4) (5) (6) (7) Log Cumulative patent
0.221** (0.089)
0.286*** (0.038)
0.478*** (0.039)
0.233** (0.105)
0.270*** (0.082)
0.226** (0.096)
0.179* (0.108)
Log Venture age -0.918*** (0.078)
0.281* (0.160)
-0.104* (0.057)
0.774** (0.398)
-0.251 (0.106)
0.069 (0.480)
-0.275* (0.156)
Bubble period 0.367*** (0.014)
-0.029 (0.067)
0.022 (0.065)
-0.094 (0.164)
-0.008 (0.117)
0.129 (0.190)
0.073 (0.159)
Log Prior VC funds raised
0.260* (0.143)
Log Pension fund 0.103** (0.050)
Log Cumulative dollar inflow
-0.092*** (0.013)
-0.112 (0.086)
-0.205*** (0.031)
-0.120 (0.114)
-0.191*** (0.035)
-0.152 (0.106)
Inverse Mills ratio 0.483**
(0.220) 0.338 (0.295)
1.360** (0.554)
0.018 (0.537)
0.308 (0.663)
-0.136 (0.524)
Location effects Yes Yes Yes Yes Yes Yes Yes Industry effects Yes Yes Yes Yes Yes Yes Yes Year effects Yes Yes Yes Yes Yes Yes Yes Venture fixed effects Yes Yes Yes Yes Yes Yes Observations (N) 1200 2040 601 2040 601 2040 601 Chi2 / Adj. R2 177.38*** 0.39 0.34 0.19 0.14 0.16 0.10 Note: Stage 1 dependent variable (VC year dummy) is a dummy variable that indicates whether or not a venture gets VC investment in a given year. The time series for each VC-backed venture in stage 1 analysis is until the year of receiving the first VC investment. The dependent variables in stage 2 are venture innovation variables (log of patent count, log of forward 4-year citation, and log of citation per patent). The independent variable in stage 2 includes the inverse Mills ratio obtained from stage 1. Heteroskedasticity-robust standard errors clustered at the firm level are reported in parenthesis for stage 1 and bootstrapped standard errors clustered at the firm level are reported in parenthesis for stage 2. ***, **, and * indicate significance at 1%, 5%, and 10% levels, respectively.
33
33
Table III (continued). SWITCHING REGRESSION
Panel-B: Counterfactual analysis
Predicted value of VC-backed venture (actual)
Predicted value of VC-backed venture if they had not received VC investment (counterfactual)
Difference between (1) and (2)
Predicted value of angel-group-backed venture (actual)
Predicted value of angel-group-backed venture if they had received VC investment (counterfactual)
Difference between (4) and (5)
(1) (2) (3) (4) (5) (6)
Log patent count
0.269 0.411 -0.142*** 0.319 0.266 0.053**
Log forward 4-year citation
0.569 0.379 0.190*** 0.313 0.402 -0.089***
Log citation per patent
0.689 0.261 0.428*** 0.282 1.478 -1.196***
Note: This table reports the counterfactual analysis based on the results of the second stage switching regression. Columns 1, 2, and 3 present the means of the predicted innovation measures for VC-backed ventures (obtained from cols. 2, 4, and 6 from table 3, panel-A), the means of the counterfactual (hypothetical) innovation measures of VC-backed ventures if they had not received VC investment (obtained from cols. 3, 5, and 7 from table 3, panel-A) and the difference between the means. Columns 4, 5, and 6 present the means of the predicted innovation measures for angel-group-backed ventures (obtained from cols. 3, 5, and 7 from table 3, panel-A), the means of the counterfactual (hypothetical) innovation measures of angel-group-backed if they had received VC investment (obtained from cols. 2, 4, and 6 from table 3, panel-A) and the difference between the means. ***, **, and * indicate significance at 1%, 5%, and 10% levels, respectively for t-test of mean difference.
34
34
Table IV. PARAMETRIC HAZARD ANALYSIS
Dependent variable Log of time to exit (1) (2) (3) Hazard type Success
(Dummy =1 for IPO or
acquisition)
Acquisition (Dummy =1
for acquisition)
IPO (Dummy =1
for IPO)
Pure VC-backed venture a -0.274** (0.122)
-0.349*** (0.133)
0.272 (0.256)
Pure Angel-backed venture a 0.301** (0.150)
0.278* (0.158)
0.769** (0.390)
Log Venture age -0.132* (0.075)
-0.118 (0.078)
-0.171 (0.221)
Log cumulative patent count (time varying) 0.024 (0.048)
0.037 (0.050)
-0.040 (0.116)
Log Cumulative dollar inflow (time varying) 0.106** (0.046)
0.140*** (0.051)
-0.098 (0.129)
Log number of IPOs (time varying) -0.747*** (0.113)
-0.695*** (0.118)
-1.252*** (0.274)
Log number of Acquisitions (time varying) 0.074 (0.258)
0.046 (0.271)
0.631 (0.640)
Location controls Yes Yes Yes
Industry controls Yes Yes Yes
Funding year controls Yes Yes Yes
Log likelihood -270.34 -269.36 -36.15
Observations (N) 350 350 350
Number of exit events 193 173 20
Note: This table reports the influence of angel investment and VC investment on the time to exit. All models are accelerated time to exit parametric hazard models where log time is assumed to be normally distributed. Positive (negative) coefficients indicate that the covariate increases (decreases) the time a venture takes to exit via an IPO or an M&A transaction. Time to exit of ventures yet to exit successfully by end of 2010 is right censored at the end of calendar year 2010 (to allow for the possibility that they may yet exit successfully after the end of our sample period), and the likelihood function is modified accordingly. The models allow for time-varying covariates. Market conditions (log of number of IPOs and log of number of Acquisitions) are time varying. Log Cumulative Patent count and Log Cumulative dollar inflow are also treated as time varying covariates and all other variables are treated as time invariant. Intercepts are not shown. The key independent covariates are Pure VC-backed venture is a dummy variable equal to one for ventures backed by only VCs and Pure Angel-backed venture is a dummy variable equal to one for ventures backed by only angels. Values are regression coefficient (clustered robust standard errors at the firm level); ***, **, and * indicate significance at 1%, 5%, and 10% levels, respectively. a Relative to ventures that received both angel group and VC funding.
35
35
APPENDIX TABLE A.1
VARIABLE DEFINITIONS
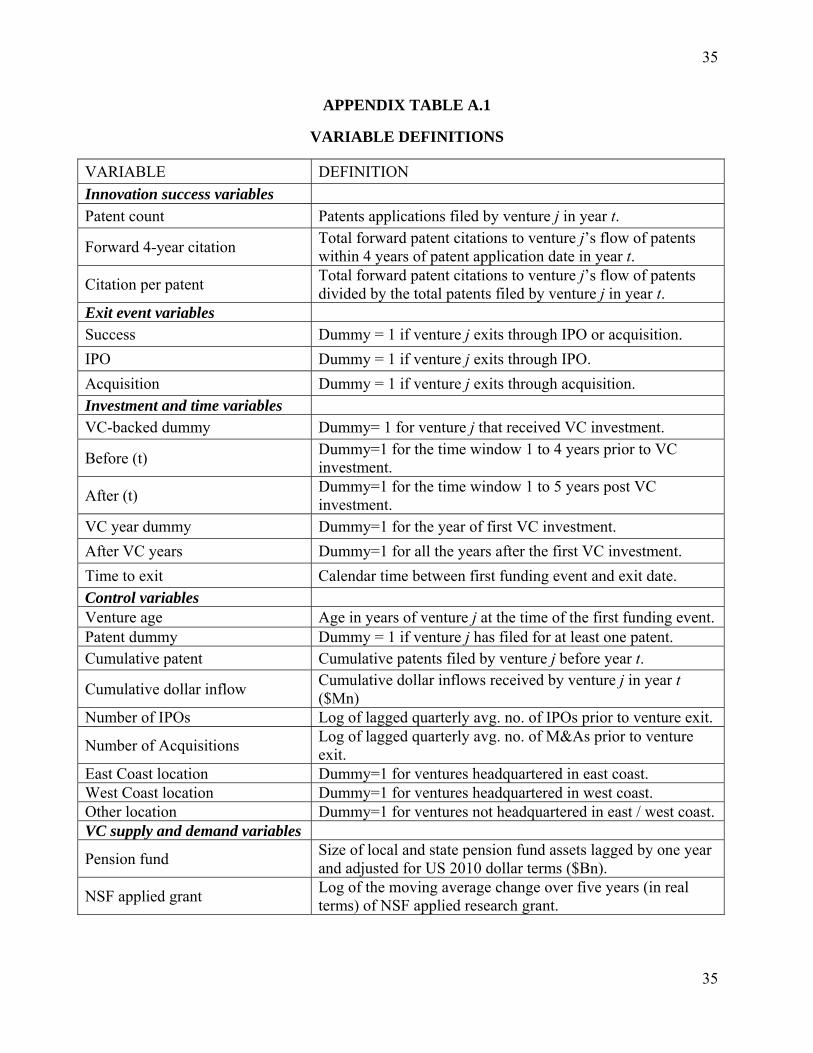
VARIABLE DEFINITION
Innovation success variables
Patent count Patents applications filed by venture j in year t.
Forward 4-year citation Total forward patent citations to venture j’s flow of patents within 4 years of patent application date in year t.
Citation per patent Total forward patent citations to venture j’s flow of patents divided by the total patents filed by venture j in year t.
Exit event variables Success Dummy = 1 if venture j exits through IPO or acquisition.
IPO Dummy = 1 if venture j exits through IPO.
Acquisition Dummy = 1 if venture j exits through acquisition. Investment and time variables VC-backed dummy Dummy= 1 for venture j that received VC investment.
Before (t) Dummy=1 for the time window 1 to 4 years prior to VC investment.
After (t) Dummy=1 for the time window 1 to 5 years post VC investment.
VC year dummy Dummy=1 for the year of first VC investment.
After VC years Dummy=1 for all the years after the first VC investment.
Time to exit Calendar time between first funding event and exit date. Control variables Venture age Age in years of venture j at the time of the first funding event. Patent dummy Dummy = 1 if venture j has filed for at least one patent. Cumulative patent Cumulative patents filed by venture j before year t.
Cumulative dollar inflow Cumulative dollar inflows received by venture j in year t ($Mn)
Number of IPOs Log of lagged quarterly avg. no. of IPOs prior to venture exit.
Number of Acquisitions Log of lagged quarterly avg. no. of M&As prior to venture exit.
East Coast location Dummy=1 for ventures headquartered in east coast. West Coast location Dummy=1 for ventures headquartered in west coast. Other location Dummy=1 for ventures not headquartered in east / west coast. VC supply and demand variables
Pension fund Size of local and state pension fund assets lagged by one year and adjusted for US 2010 dollar terms ($Bn).
NSF applied grant Log of the moving average change over five years (in real terms) of NSF applied research grant.
36
36
1 Statistics for angel investment were gathered from The Center for Venture Research at University of New
Hampshire, which, at the time the manuscript was written, reported investment by stage of investment for the first
two quarters of 2013 (https://paulcollege.unh.edu/research/center-venture-research/cvr-analysis-reports). Statistics
for venture capital was gathered from PricewaterhouseCoopers MoneyTree report. Compared to venture capital, the
proportion of angel investment in seed and early stage was considerably more stable, at 44 percent in 2002.
2 The Angel Capital Association defines an angel investor as a high net worth individual who invests directly into
promising entrepreneurial businesses in return for stock in the companies. Many are entrepreneurs themselves, as
well as corporate leaders and business professionals. While definitions of angel investors can vary, it is generally
understood that angel investment excludes investments made by family and friends.
3 These same two approaches were used by Chemmanur et al. (2010), who used difference-in-differences to measure
changes in firm employment, and capital expenditure around the IPO event, and Chemmanur et al. (2011) who used
switching regression to measure a firm’s change in total factor productivity subsequent to receiving venture capital.
4 Source: PriceWaterhouseCoopers MoneyTree Report.
5 They note that increases in patent production at the industry level and increases in venture funding at the industry
level may be due to unobserved factors that influence technological opportunities and, therefore, simply regressing
an industry’s patent production on venture funding may overstate the influence of VCs. They control for these
factors using the instrument of U.S. Department of Labor's 1979 clarification of the "prudent man" rule.
6 They use investments made by independent funds in the past five years as an instrument to address the endogeneity
of VC investment and advent of technological opportunities.
7 They employ instrument variable operationalized using the count of limited partners in each region over the past
three years to address the endogeneity that VCs might allocate resources to regions rich in promising technologies.
8 The higher survival rates of angel-group funded ventures may be due to the fact that angel groups effectively
nurture and motivate entrepreneurs, two qualities necessary for the innovation process (Manso, 2011), particularly
germane in early-stage innovation efforts rife with unpredictability and failure.
9 The authors do not account for angel effect separately and consider the combined effect of external investment.
10 The IQSS Patent Network database (see Lai et al., 2011 for a description), the USPTO database, and Google
patents databases are used to match patent information for each venture at a firm-year level from its founding year to
2010 (or earlier, if the firm exited through IPO, acquisition or went bankrupt).
37
37
11 See http://sites.kauffman.org/aipp/about.cfm for more information on the AIPP survey.
12 The distribution of returns of the final sample of 137 ventures is similar to the distribution of the AIPP dataset.
The average investor return reported in the AIPP dataset is 27 percent, approximately equivalent to other surveys
conducted on angel investments (e.g., Mason and Harrison, 2002; Center of Venture Research Report, 2007), and
the distribution of returns is also similar to other surveys, skewed to the left with close to fifty percent of the
investments having negative or zero return. Also, the average return reported in the AIPP data compares favorably
with the returns of venture capital investment, reported at 26.9 percent in 2004 for a ten-year period (NVCA report).
Further, a comparative analysis of VC investment and angel investment conducted by Kerr et al. (2011) and Mason
and Harrison (2002) show no significant difference in investment returns.
One natural concern is whether the AIPP dataset comprises accredited angel investors who have had positive
investment experiences and tend to share the information. Wiltbank and Boeker (2007) compared the returns
reported by high response rate angel groups (seven groups with more than 60 percent response) with low response
rate angel groups and found no significant difference. This suggests that the 31% of angel-groups that responded to
the AIPP survey is not a biased sample containing only high-performing angel-groups.
13 We eliminated ventures that had ‘undisclosed investor’ in any investment round. The ‘undisclosed investor’
category in VentureXpert may represent angel groups or individual investors. Next, we gathered information
(investment portfolio, principal partners, capital under management) of the VC firms involved in each investment
round to ascertain whether they fall under the traditional VC category. Finally, we conducted an exhaustive search
on Google, Factiva, Lexis-Nexis, and also employed a customized web-crawler search for each VC-backed venture
to ascertain whether the venture had any affiliation with US-based angel groups listed in the Angel Capital
Association directory. A web crawler is a software program that runs an automated iterative algorithm to search web
URLs and hyperlinks. A web crawler-based search is considered more efficient than a human agent coordinated
internet search because it interprets the words before and after the keyword to determine whether the information is
useful.
14 Information on founding year and current status (IPO, acquisition, privately held, bankrupt) was collected from
news article searches in Factiva, Lexis-Nexis, Bloomberg Businessweek, CrunchBase, CB Insights, and company
websites combined with data from VentureXpert and SEC filings. VentureXpert, the AIPP survey, and SEC filings
38
38
were consulted for VC and angel group financing amounts and investment year. Information on venture location and
SIC codes was obtained from Corptech Directory of Technology Companies (1995 – 2006) and Lexis-Nexis.
15 To ensure the sampled VC-backed ventures in our analysis is representative of early stage VC investments, we
compared the 271 (213+58) VC-backed ventures to the universe of VC-backed technology ventures (7517) founded
between 1995 and 2006 that received their first VC investment in the seed/early stage of development. No
significant differences were observed in average venture age at the time of first investment, average cumulative VC
investment, and percentage of IPOs and acquisition exits. The analysis is available upon request.
16 A similar difference-in-differences estimation strategy has been adopted by Bertrand and Mullainathan (2003) and
Chemmanur et al. (2010) to study firm performance around different events.
17 We also implemented fixed effects negative binomial regression with patent count and forward 4-year citation as
count dependent variables. The results are essentially similar to Table 2.
18 A similar approach was adopted by Shaver (1998) in analyzing the impact of acquisition versus green field entry
on firm survival, and by Chemmanur et al. (2011) in analyzing the impact of VC on total factor productivity of the
firm. For a detailed discussion on switching regression, see Heckman (1979), and Maddala (1983).
19 Venture that received both angel group and VC investment are treated as VC-backed for the years after the
venture receives VC investment.
20 Information sourced from Annual Survey of Public Pensions: State and Local Data.
21 VC year dummy is set to ‘0’ for all the years for ventures that did not receive any VC investment (but received
angel-group investment). For VC-backed ventures, VC year dummy is ‘0’ in all years prior to VC investment, and it
equals ‘1’ in the year the venture receives VC investment. It is set to missing in the following years after VC
investment. Therefore in the first stage, VC-backed ventures effectively drop out of the sample for all years
subsequent to the year of VC investment.
22 Our results are qualitatively similar to the semi-parametric Cox hazard model and are available upon request.