Embed Size (px)
Citation preview
page 1
A descriptive analysis of the effect of badger vaccination on the incidence of bovine tuberculosis in cattle within the Badger Vaccine Deployment Project area, using observational data Funded under Defra project SE3131 Authors: Heather O’Connor & Dr Lucy Brunton Data preparation: Alison Prosser & Stuart Ashfield APHA reviewers: Dr Jessica Parry, Dr Jane Gibbens, Prof. Dirk Pfeiffer & Prof. Glyn Hewinson External reviewer: Prof. Christl Donnelly, Imperial College London
page 2
Table of Contents
EXECUTIVE SUMMARY ........................................................................................................................................................... 3
INTRODUCTION...................................................................................................................................................................... 5
METHODS .............................................................................................................................................................................. 6
VACCINATION DEPLOYMENT ............................................................................................................................................................. 6 COMPARISON AREA SELECTION .......................................................................................................................................................... 6 STATISTICAL ANALYSIS ...................................................................................................................................................................... 6
RESULTS ................................................................................................................................................................................. 8
VACCINATION COVERAGE ................................................................................................................................................................. 8 SUITABILITY OF COMPARISON AREAS ................................................................................................................................................... 8 INCIDENCE RATE PER 100 HERD YEARS AT RISK .................................................................................................................................... 10
DISCUSSION ......................................................................................................................................................................... 14
REFERENCES ......................................................................................................................................................................... 16
APPENDIX 1: SECONDARY OUTCOME MEASURES ................................................................................................................ 18
HERD BTB PREVALENCE ................................................................................................................................................................. 18 HERD BTB INCIDENCE .................................................................................................................................................................... 18 NUMBER OF REACTORS .................................................................................................................................................................. 19 DURATION OF RESTRICTIONS ........................................................................................................................................................... 19 HERD INCIDENT DETECTION ............................................................................................................................................................ 20 RECURRENCE ............................................................................................................................................................................... 21
APPENDIX 2: ADDITIONAL DATA .......................................................................................................................................... 22
APPENDIX 3: ABBREVIATIONS AND DEFINITIONS ................................................................................................................. 28
page 3
Executive summary Purpose of the report
The Badger Vaccine Deployment Project (BVDP) was initiated in July 2009 to provide the first use of a vaccine for bovine tuberculosis (bTB) in badgers outside of research trials and to develop practical knowledge on the processes involved. The BVDP study area covered 100 km2 in Stroud, Gloucestershire with deployment of BadgerBCG within this area taking place annually between 6th July 2010 and 24th October 2014. The purpose to this report is to provide a descriptive analysis of the effect of badger vaccination on the incidence of bTB in cattle within the BVDP area using observational data. There were two objectives to this report. Firstly, to assess whether it is possible to identify geographical areas with a similar risk of bTB to the BVDP area that have not been subject to badger vaccination. Secondly, to test the hypothesis that vaccination deployment had an effect on the incidence of bTB in cattle in the BVDP area and its buffer through comparing trends in incidence in these areas to trends in matched comparison areas where no vaccination had occurred. Methodology
A methodology for analysing the effect of badger culling on the incidence of bTB in cattle has been developed as part of the Defra funded project SE3131. This methodology was applied to the BVDP area to select matched comparison areas and enable an analysis of the impact of badger vaccination on bTB incidence in cattle over the five years of deployment. To test the hypothesis that vaccination deployment had an effect on the incidence of bTB in cattle the primary outcome measure was herd incidence rate calculated as the annual number of new Officially Tuberculosis Free status – Withdrawn (OTF-W) incidents per 100 herd years at risk. Several secondary outcome measures related to bTB in cattle were also explored and are presented in an Appendix to this report. Results
The selected comparison areas were found to be similar based on the criteria used to select them and on testing history. When trends were assessed across the five years of vaccine deployment in the BVDP area, a significantly decreasing trend in OTF-W incidence rate was observed in the BVDP area and three of the comparison areas, and a significantly increasing trend was observed in one of the comparison areas. The incidence trends in the buffer areas reflected the trends in the central areas, except for one of the comparison areas with a decreasing trend in the central area where there was no significant trend in its buffer area. The secondary outcome measures explored showed no apparent differences between the BVDP area and comparison areas. Interpretation
Vaccination and industry-led culling of badgers are interventions that have been implemented as part of bTB control policies rather than scientific studies. This means they lack the randomisation, control and replication that would occur in a scientific study to test the impact of an intervention. Nonetheless, it is useful to examine cattle bTB incidence in areas subject to these interventions in case lessons can be learnt that can inform the policies. The attributes used for matching areas were selected based on existing knowledge of the factors which may influence bTB incidence in cattle. It is likely that there will be differences between the drivers of bTB in the different areas that have not been measured, and bias may have been introduced into the analysis by not accounting for these drivers. Vaccination was not deployed uniformly across the BVDP area. The level of vaccination coverage achieved was estimated to be at least 82% of the area. This heterogeneity in area coverage was realistic and although this was representative of a real-world vaccination programme, it is likely that the level of vaccine deployment achieved was higher than would be expected for other badger vaccination programmes in the field as the BVDP was conducted under optimal conditions. Although there are no known biological reasons and no current evidence-base to suspect badger vaccination causes social perturbation, bTB incidence in cattle in a buffer area around the BVDP, where perturbation would be expected to be observable, was assessed. The data presented in this report do not provide any evidence of an increase in cattle bTB incidence in this area surrounding the BVDP.
page 4
However, the lack of an observed effect should be interpreted carefully in light of the limitations to this study design and the lack of power associated with having only a single intervention area. Conclusions
The results of this analysis suggest that badger vaccination had no effect on cattle bTB incidence, as demonstrated by the decrease in OTF-W incidence rate in both the BVDP area and the comparison areas since the start of the BVDP. Although these results offer initial information on the situation, the effects reported need to be interpreted cautiously due to the limitations and potential bias and the lack of power associated with having only a single intervention area.
page 5
Introduction The Badger Vaccine Deployment Project (BVDP) was initiated in July 2009. The project was intended to provide the first use of a vaccine for bovine tuberculosis (bTB) in badgers outside of research trials and to offer information on the practicalities of the dissemination of badger vaccination. The BVDP study area covered 100 km2 in Stroud, Gloucestershire with deployment of BadgerBCG within this area commencing on 6th July 2010 and final vaccinations carried out on 24th October 2014.
There are two objectives to this report:
1. To assess whether it is possible to identify geographical areas which have a similar risk of bTB to the BVDP area but have not been subject to badger vaccination. This will allow us to determine whether it is possible to attempt an analysis of the effect of badger vaccination.
2. To test the hypothesis that vaccination deployment had an effect on the incidence of bTB in cattle in the BVDP area and its buffer area through comparing trends in incidence in these areas to trends in the matched unvaccinated areas.
Potential impacts of vaccination on the area surrounding the BVDP area are also of interest as culling of badgers has been shown to disrupt badger social structures leading to perturbation in surrounding areas, which could affect the rate of contact between cattle and badgers (Woodroffe et al 2006). This analysis will also lay the foundations for future analysis of areas that have been exposed to badger vaccination.
A methodology for analysing the effect of badger culling on the incidence of bTB in cattle through selection of matched comparison areas where no culling has taken place has been developed as part of the Defra funded project SE3131. This methodology has been applied to the BVDP area to select matched comparison areas and enable an analysis of the impact of badger vaccination on bTB incidence in cattle in the intervention area over the five years of deployment.
It is important to remember that this is a descriptive analysis, and that it is unlikely that any significant changes will be observed. Any analysis of the effect of vaccination is limited by the retrospective and non-randomised selection of comparison areas. In addition, the BVDP was only conducted in one intervention area so it is anticipated that there is the potential for selection bias and that there will be insufficient power to detect the effects of vaccination on cattle incidence in the area. The limitations of the analysis are discussed later in this report.
This analysis is based on the following assumptions:
1. That the local badger population is infected with bTB
2. That the presence of an infected badger population is an important explanatory factor for the level of bTB in the associated cattle population
3. That the methods used to assess industry-led badger culling in England and Wales, which were designed to detect comparable effects on cattle bTB to those observed during the Randomised Badger Culling Trial (RBCT), can also be used to assess the effect of badger vaccination on cattle bTB
4. That the case definition of Officially Tuberculosis Free status – Withdrawn (OTF-W) herds throughout the reporting period is comparable to the definition of a confirmed breakdown used during the RBCT
page 6
Methods
Vaccination deployment
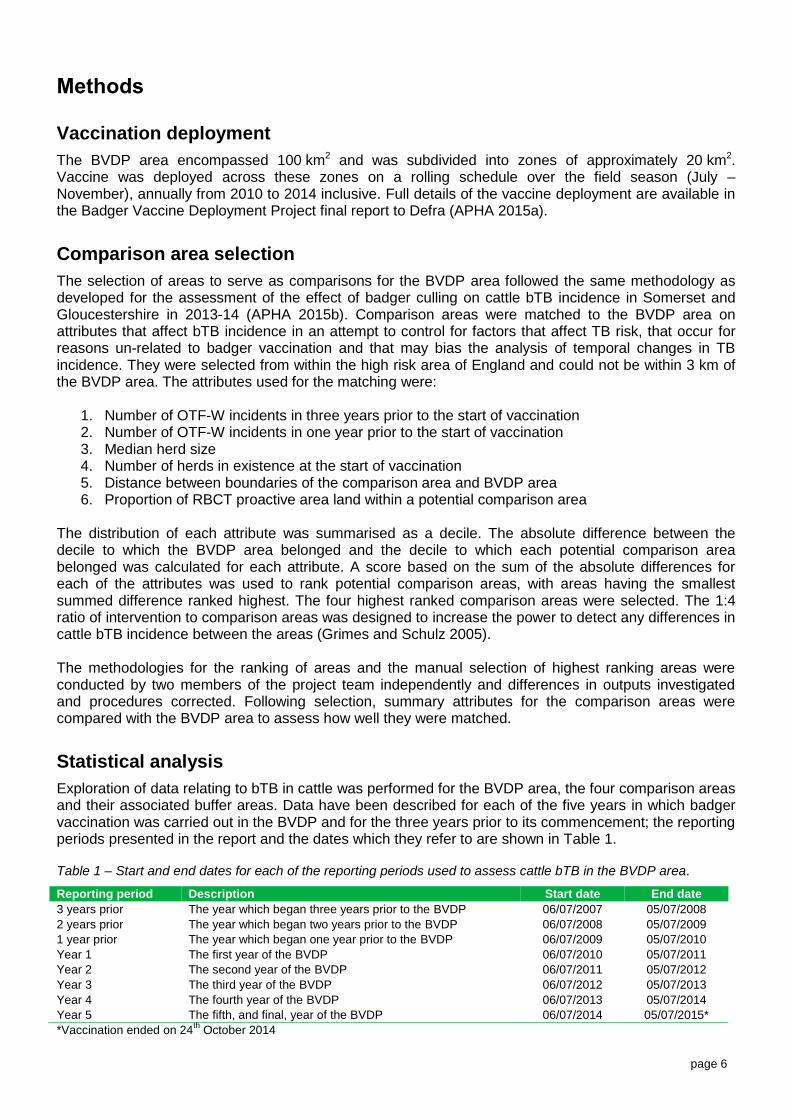
The BVDP area encompassed 100 km2 and was subdivided into zones of approximately 20 km2. Vaccine was deployed across these zones on a rolling schedule over the field season (July – November), annually from 2010 to 2014 inclusive. Full details of the vaccine deployment are available in the Badger Vaccine Deployment Project final report to Defra (APHA 2015a).
Comparison area selection
The selection of areas to serve as comparisons for the BVDP area followed the same methodology as developed for the assessment of the effect of badger culling on cattle bTB incidence in Somerset and Gloucestershire in 2013-14 (APHA 2015b). Comparison areas were matched to the BVDP area on attributes that affect bTB incidence in an attempt to control for factors that affect TB risk, that occur for reasons un-related to badger vaccination and that may bias the analysis of temporal changes in TB incidence. They were selected from within the high risk area of England and could not be within 3 km of the BVDP area. The attributes used for the matching were:
1. Number of OTF-W incidents in three years prior to the start of vaccination 2. Number of OTF-W incidents in one year prior to the start of vaccination 3. Median herd size 4. Number of herds in existence at the start of vaccination 5. Distance between boundaries of the comparison area and BVDP area 6. Proportion of RBCT proactive area land within a potential comparison area
The distribution of each attribute was summarised as a decile. The absolute difference between the decile to which the BVDP area belonged and the decile to which each potential comparison area belonged was calculated for each attribute. A score based on the sum of the absolute differences for each of the attributes was used to rank potential comparison areas, with areas having the smallest summed difference ranked highest. The four highest ranked comparison areas were selected. The 1:4 ratio of intervention to comparison areas was designed to increase the power to detect any differences in cattle bTB incidence between the areas (Grimes and Schulz 2005). The methodologies for the ranking of areas and the manual selection of highest ranking areas were conducted by two members of the project team independently and differences in outputs investigated and procedures corrected. Following selection, summary attributes for the comparison areas were compared with the BVDP area to assess how well they were matched.
Statistical analysis
Exploration of data relating to bTB in cattle was performed for the BVDP area, the four comparison areas and their associated buffer areas. Data have been described for each of the five years in which badger vaccination was carried out in the BVDP and for the three years prior to its commencement; the reporting periods presented in the report and the dates which they refer to are shown in Table 1.
Table 1 – Start and end dates for each of the reporting periods used to assess cattle bTB in the BVDP area.
Reporting period Description Start date End date
3 years prior The year which began three years prior to the BVDP 06/07/2007 05/07/2008
2 years prior The year which began two years prior to the BVDP 06/07/2008 05/07/2009
1 year prior The year which began one year prior to the BVDP 06/07/2009 05/07/2010
Year 1 The first year of the BVDP 06/07/2010 05/07/2011
Year 2 The second year of the BVDP 06/07/2011 05/07/2012
Year 3 The third year of the BVDP 06/07/2012 05/07/2013
Year 4 The fourth year of the BVDP 06/07/2013 05/07/2014
Year 5 The fifth, and final, year of the BVDP 06/07/2014 05/07/2015*
*Vaccination ended on 24th October 2014
page 7
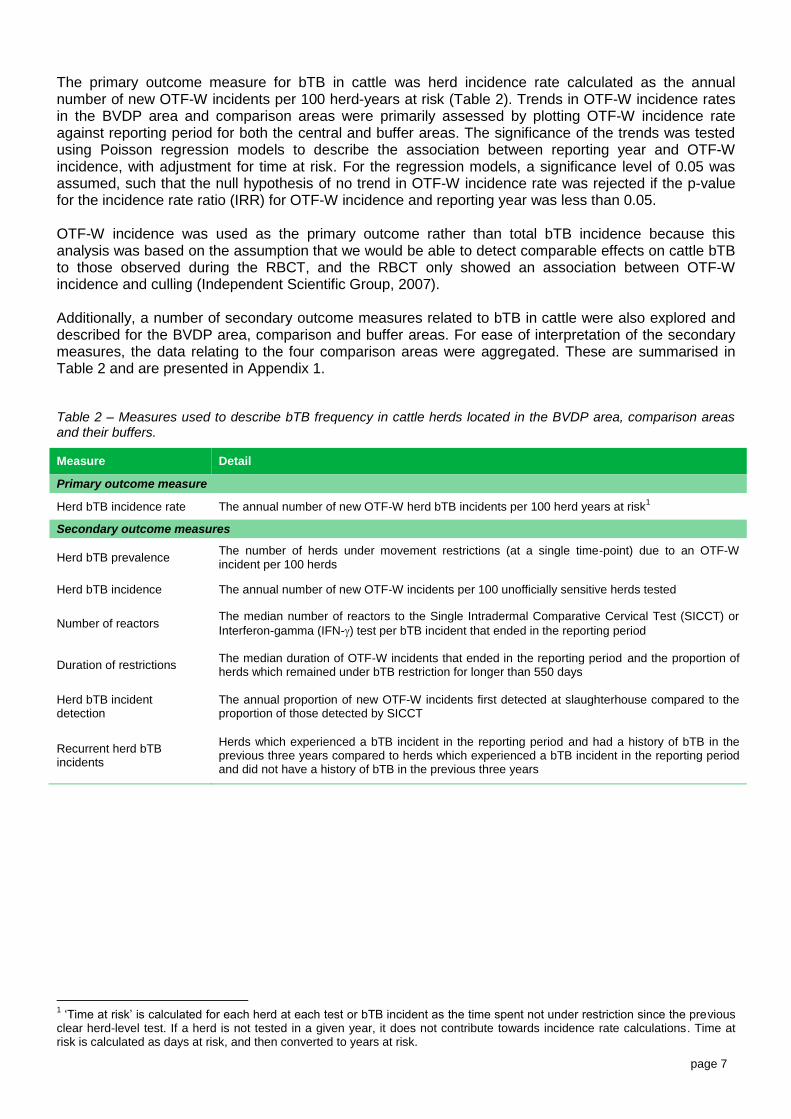
The primary outcome measure for bTB in cattle was herd incidence rate calculated as the annual number of new OTF-W incidents per 100 herd-years at risk (Table 2). Trends in OTF-W incidence rates in the BVDP area and comparison areas were primarily assessed by plotting OTF-W incidence rate against reporting period for both the central and buffer areas. The significance of the trends was tested using Poisson regression models to describe the association between reporting year and OTF-W incidence, with adjustment for time at risk. For the regression models, a significance level of 0.05 was assumed, such that the null hypothesis of no trend in OTF-W incidence rate was rejected if the p-value for the incidence rate ratio (IRR) for OTF-W incidence and reporting year was less than 0.05. OTF-W incidence was used as the primary outcome rather than total bTB incidence because this analysis was based on the assumption that we would be able to detect comparable effects on cattle bTB to those observed during the RBCT, and the RBCT only showed an association between OTF-W incidence and culling (Independent Scientific Group, 2007). Additionally, a number of secondary outcome measures related to bTB in cattle were also explored and described for the BVDP area, comparison and buffer areas. For ease of interpretation of the secondary measures, the data relating to the four comparison areas were aggregated. These are summarised in Table 2 and are presented in Appendix 1.
Table 2 – Measures used to describe bTB frequency in cattle herds located in the BVDP area, comparison areas and their buffers.
Measure Detail
Primary outcome measure
Herd bTB incidence rate The annual number of new OTF-W herd bTB incidents per 100 herd years at risk1
Secondary outcome measures
Herd bTB prevalence The number of herds under movement restrictions (at a single time-point) due to an OTF-W incident per 100 herds
Herd bTB incidence The annual number of new OTF-W incidents per 100 unofficially sensitive herds tested
Number of reactors The median number of reactors to the Single Intradermal Comparative Cervical Test (SICCT) or
Interferon-gamma (IFN-) test per bTB incident that ended in the reporting period
Duration of restrictions The median duration of OTF-W incidents that ended in the reporting period and the proportion of herds which remained under bTB restriction for longer than 550 days
Herd bTB incident detection
The annual proportion of new OTF-W incidents first detected at slaughterhouse compared to the proportion of those detected by SICCT
Recurrent herd bTB incidents
Herds which experienced a bTB incident in the reporting period and had a history of bTB in the previous three years compared to herds which experienced a bTB incident in the reporting period and did not have a history of bTB in the previous three years
1 ‘Time at risk’ is calculated for each herd at each test or bTB incident as the time spent not under restriction since the previous
clear herd-level test. If a herd is not tested in a given year, it does not contribute towards incidence rate calculations. Time at risk is calculated as days at risk, and then converted to years at risk.
page 8
Results
Vaccination coverage
Over the four years and three months of vaccine deployment a total of 3,802 doses of BadgerBCG were administered within the BVDP. The number of badgers vaccinated per year of the project ranged from 541 in Year 1 to 998 in Year 3, with 801 badgers vaccinated in the final year of deployment. BadgerBCG was not deployed uniformly across the BVDP area, mostly due to variations in badger presence and density relating to suitability of habitat. In addition to the underlying heterogeneity in badger density, some land within the project boundaries did not have land access granted. Remote trapping was carried out at the boundary of such land, in order to catch badgers moving across the boundary. Coverage of the vaccination was estimated using the area of the premises vaccinated. This ranged between 82% of the total area in Year 1 and 95% in Year 3 with a mean coverage of 88% across the five years. However, this measure of coverage is not perfect and will be influenced by a number of factors including lack of badger activity on the premises vaccinated, unsuccessful trapping efforts, and remote vaccination of badgers on land where access was not granted.
Suitability of comparison areas
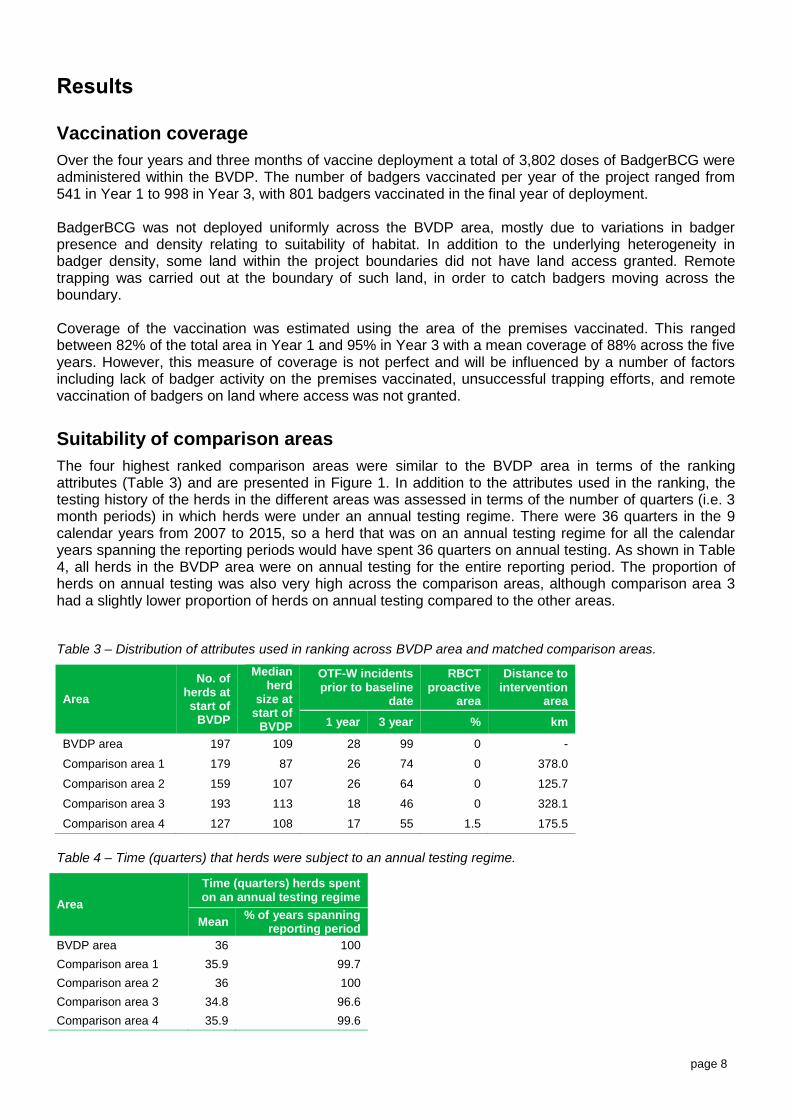
The four highest ranked comparison areas were similar to the BVDP area in terms of the ranking attributes (Table 3) and are presented in Figure 1. In addition to the attributes used in the ranking, the testing history of the herds in the different areas was assessed in terms of the number of quarters (i.e. 3 month periods) in which herds were under an annual testing regime. There were 36 quarters in the 9 calendar years from 2007 to 2015, so a herd that was on an annual testing regime for all the calendar years spanning the reporting periods would have spent 36 quarters on annual testing. As shown in Table 4, all herds in the BVDP area were on annual testing for the entire reporting period. The proportion of herds on annual testing was also very high across the comparison areas, although comparison area 3 had a slightly lower proportion of herds on annual testing compared to the other areas.
Table 3 – Distribution of attributes used in ranking across BVDP area and matched comparison areas.
Area
No. of herds at start of
BVDP
Median herd
size at start of
BVDP
OTF-W incidents prior to baseline
date
RBCT proactive
area
Distance to intervention
area
1 year 3 year % km
BVDP area 197 109 28 99 0 -
Comparison area 1 179 87 26 74 0 378.0
Comparison area 2 159 107 26 64 0 125.7
Comparison area 3 193 113 18 46 0 328.1
Comparison area 4 127 108 17 55 1.5 175.5
Table 4 – Time (quarters) that herds were subject to an annual testing regime.
Area
Time (quarters) herds spent on an annual testing regime
Mean % of years spanning
reporting period
BVDP area 36 100
Comparison area 1 35.9 99.7
Comparison area 2 36 100
Comparison area 3 34.8 96.6
Comparison area 4 35.9 99.6
page 9
Figure 1 – Location of the BVDP area and the 4 matched comparison areas across a map of smoothed bTB herd incidence in the high incidence area of England, 2014.
The population of herds at the baseline date (start of Year 1) is described in Table 5. The total number of herds across all four comparison areas is given along with the median number of herds.
Table 5 – Number of herds in the BVDP and its comparison areas, and their associated buffers, at the baseline date.
Area Number of herds at baseline date
Central area Buffer area
BVDP area 197 135
Comparison area 1 179 159
Comparison area 2 159 99
Comparison area 3 193 181
Comparison area 4 127 91
page 10
Incidence rate per 100 herd years at risk
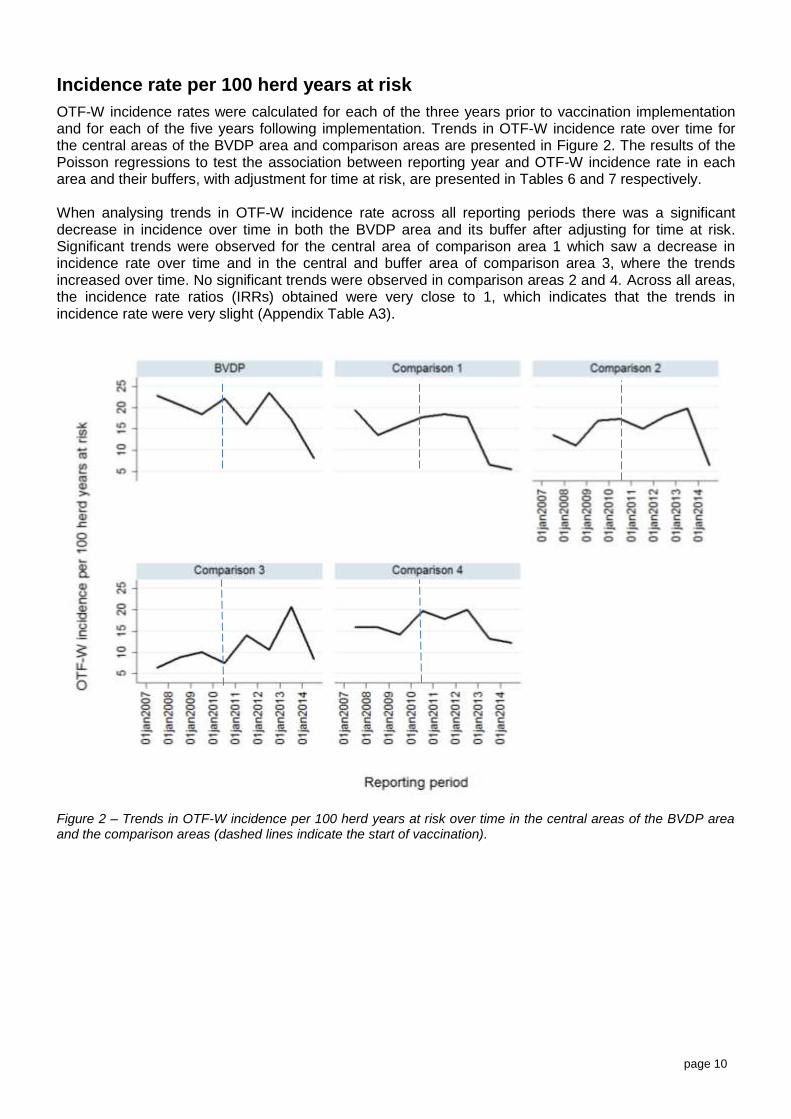
OTF-W incidence rates were calculated for each of the three years prior to vaccination implementation and for each of the five years following implementation. Trends in OTF-W incidence rate over time for the central areas of the BVDP area and comparison areas are presented in Figure 2. The results of the Poisson regressions to test the association between reporting year and OTF-W incidence rate in each area and their buffers, with adjustment for time at risk, are presented in Tables 6 and 7 respectively. When analysing trends in OTF-W incidence rate across all reporting periods there was a significant decrease in incidence over time in both the BVDP area and its buffer after adjusting for time at risk. Significant trends were observed for the central area of comparison area 1 which saw a decrease in incidence rate over time and in the central and buffer area of comparison area 3, where the trends increased over time. No significant trends were observed in comparison areas 2 and 4. Across all areas, the incidence rate ratios (IRRs) obtained were very close to 1, which indicates that the trends in incidence rate were very slight (Appendix Table A3).
Figure 2 – Trends in OTF-W incidence per 100 herd years at risk over time in the central areas of the BVDP area and the comparison areas (dashed lines indicate the start of vaccination).
page 11
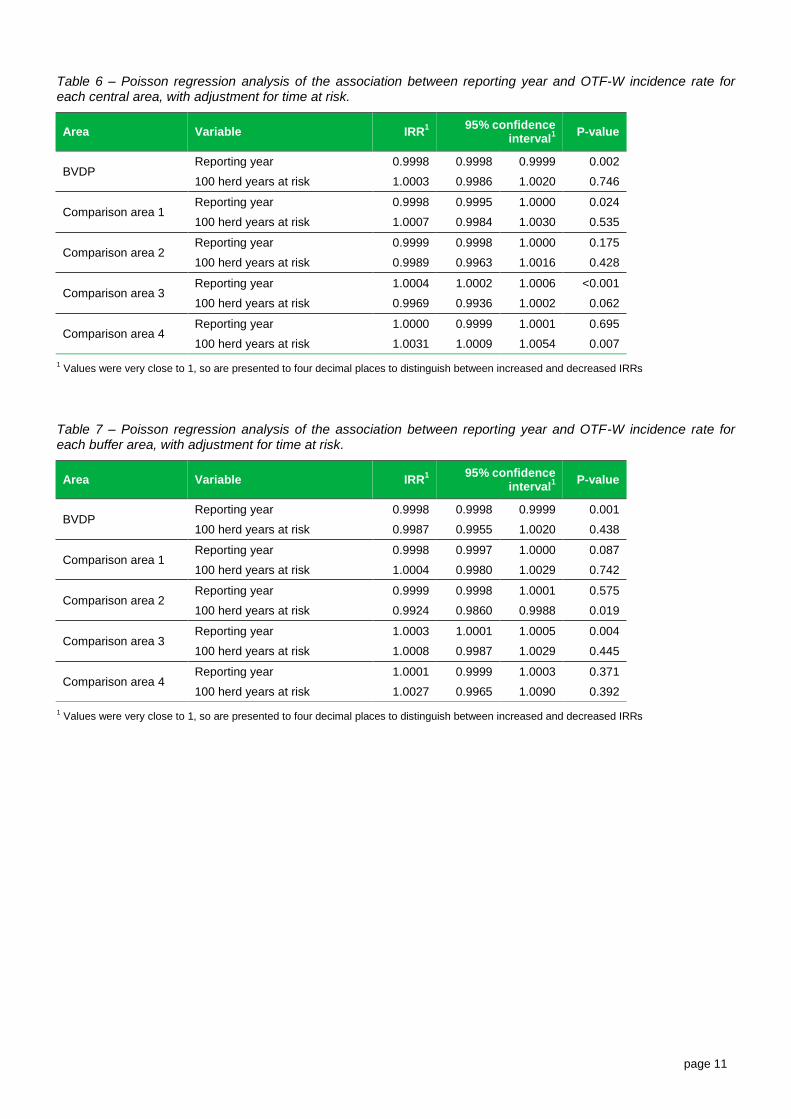
Table 6 – Poisson regression analysis of the association between reporting year and OTF-W incidence rate for each central area, with adjustment for time at risk.
Area Variable IRR1
95% confidence interval
1
P-value
BVDP Reporting year 0.9998 0.9998 0.9999 0.002
100 herd years at risk 1.0003 0.9986 1.0020 0.746
Comparison area 1 Reporting year 0.9998 0.9995 1.0000 0.024
100 herd years at risk 1.0007 0.9984 1.0030 0.535
Comparison area 2 Reporting year 0.9999 0.9998 1.0000 0.175
100 herd years at risk 0.9989 0.9963 1.0016 0.428
Comparison area 3 Reporting year 1.0004 1.0002 1.0006 <0.001
100 herd years at risk 0.9969 0.9936 1.0002 0.062
Comparison area 4 Reporting year 1.0000 0.9999 1.0001 0.695
100 herd years at risk 1.0031 1.0009 1.0054 0.007
1 Values were very close to 1, so are presented to four decimal places to distinguish between increased and decreased IRRs
Table 7 – Poisson regression analysis of the association between reporting year and OTF-W incidence rate for each buffer area, with adjustment for time at risk.
Area Variable IRR1
95% confidence interval
1
P-value
BVDP Reporting year 0.9998 0.9998 0.9999 0.001
100 herd years at risk 0.9987 0.9955 1.0020 0.438
Comparison area 1 Reporting year 0.9998 0.9997 1.0000 0.087
100 herd years at risk 1.0004 0.9980 1.0029 0.742
Comparison area 2 Reporting year 0.9999 0.9998 1.0001 0.575
100 herd years at risk 0.9924 0.9860 0.9988 0.019
Comparison area 3 Reporting year 1.0003 1.0001 1.0005 0.004
100 herd years at risk 1.0008 0.9987 1.0029 0.445
Comparison area 4 Reporting year 1.0001 0.9999 1.0003 0.371
100 herd years at risk 1.0027 0.9965 1.0090 0.392
1 Values were very close to 1, so are presented to four decimal places to distinguish between increased and decreased IRRs
page 12
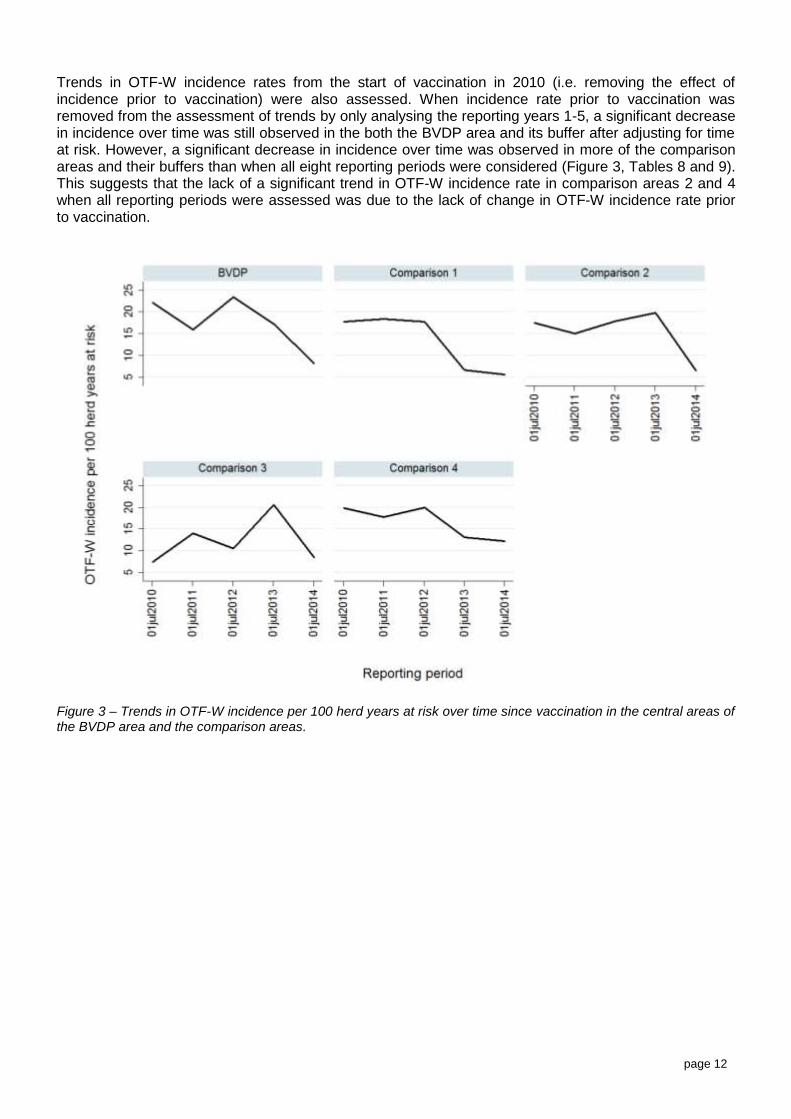
Trends in OTF-W incidence rates from the start of vaccination in 2010 (i.e. removing the effect of incidence prior to vaccination) were also assessed. When incidence rate prior to vaccination was removed from the assessment of trends by only analysing the reporting years 1-5, a significant decrease in incidence over time was still observed in the both the BVDP area and its buffer after adjusting for time at risk. However, a significant decrease in incidence over time was observed in more of the comparison areas and their buffers than when all eight reporting periods were considered (Figure 3, Tables 8 and 9). This suggests that the lack of a significant trend in OTF-W incidence rate in comparison areas 2 and 4 when all reporting periods were assessed was due to the lack of change in OTF-W incidence rate prior to vaccination.
Figure 3 – Trends in OTF-W incidence per 100 herd years at risk over time since vaccination in the central areas of the BVDP area and the comparison areas.
page 13
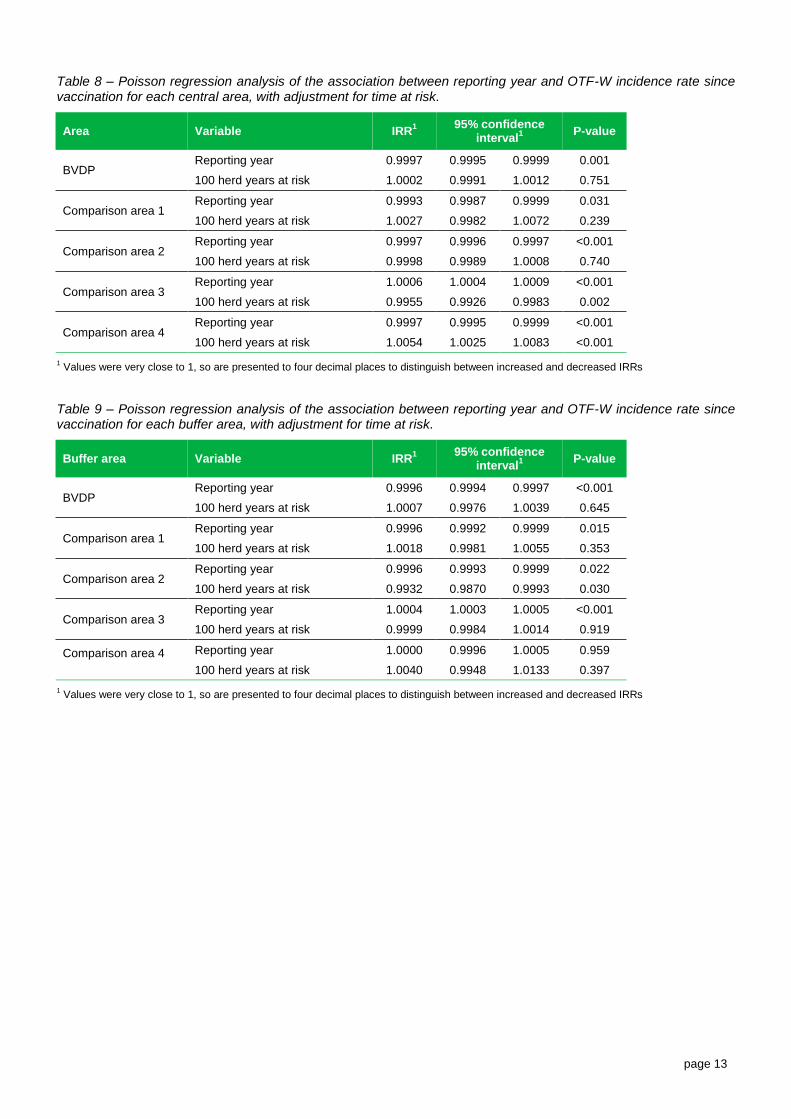
Table 8 – Poisson regression analysis of the association between reporting year and OTF-W incidence rate since vaccination for each central area, with adjustment for time at risk.
Area Variable IRR1
95% confidence interval
1
P-value
BVDP Reporting year 0.9997 0.9995 0.9999 0.001
100 herd years at risk 1.0002 0.9991 1.0012 0.751
Comparison area 1 Reporting year 0.9993 0.9987 0.9999 0.031
100 herd years at risk 1.0027 0.9982 1.0072 0.239
Comparison area 2 Reporting year 0.9997 0.9996 0.9997 <0.001
100 herd years at risk 0.9998 0.9989 1.0008 0.740
Comparison area 3 Reporting year 1.0006 1.0004 1.0009 <0.001
100 herd years at risk 0.9955 0.9926 0.9983 0.002
Comparison area 4 Reporting year 0.9997 0.9995 0.9999 <0.001
100 herd years at risk 1.0054 1.0025 1.0083 <0.001
1 Values were very close to 1, so are presented to four decimal places to distinguish between increased and decreased IRRs
Table 9 – Poisson regression analysis of the association between reporting year and OTF-W incidence rate since vaccination for each buffer area, with adjustment for time at risk.
Buffer area Variable IRR1
95% confidence interval
1
P-value
BVDP Reporting year 0.9996 0.9994 0.9997 <0.001
100 herd years at risk 1.0007 0.9976 1.0039 0.645
Comparison area 1 Reporting year 0.9996 0.9992 0.9999 0.015
100 herd years at risk 1.0018 0.9981 1.0055 0.353
Comparison area 2 Reporting year 0.9996 0.9993 0.9999 0.022
100 herd years at risk 0.9932 0.9870 0.9993 0.030
Comparison area 3 Reporting year 1.0004 1.0003 1.0005 <0.001
100 herd years at risk 0.9999 0.9984 1.0014 0.919
Comparison area 4
Reporting year 1.0000 0.9996 1.0005 0.959
100 herd years at risk 1.0040 0.9948 1.0133 0.397
1 Values were very close to 1, so are presented to four decimal places to distinguish between increased and decreased IRRs
page 14
Discussion The Badger Vaccine Deployment Project (BVDP) was established to investigate the practicalities of vaccinating badgers using the injectable vaccine BadgerBCG and was not tasked with assessing the efficacy of the vaccine in relation to onwards spread to cattle. Due to the aims of the project and initial constraints, the BVDP area was selected purposively and there was no simultaneous selection of comparison areas. The BVDP and the industry-led badger culling which began in England in 2013 are interventions that have been implemented as part of bTB control policies rather than scientific studies. This means that they lack randomisation and selection of controls and have limited or no replication, all of which would occur in a scientific study to test the impact of an intervention. Nonetheless, it is still useful to examine cattle bTB incidence in the areas subject to these interventions in case lessons can be learnt that can inform the policies. To enable an assessment of cattle bTB incidence following industry-led badger culling, a standardised method for selecting areas closely matched to the intervention areas in terms of factors that affect bTB risk was developed. This method has been applied to the BVDP area. The first aim of this report was to assess whether it would be possible to identify geographical areas that have a similar risk of bTB to the BVDP area but have not been subject to badger vaccination. The comparison areas were selected based on their similarity to the BVDP area in relation to the attributes chosen for the ranking. These attributes were selected based on existing knowledge of the factors that may influence bTB incidence in cattle, but will not account for all of the drivers of bTB incidence. It is likely that there will be differences between the drivers of bTB in the different areas that have not been measured, and bias may have been introduced into the analysis by not accounting for these drivers. In a randomised controlled trial, the variation between areas due to unknown drivers of spread would be accounted for by the randomisation and sampling of multiple areas. However, as discussed above this is not possible when reviewing the impact of a currently existing policy. The comparison areas appeared to be well matched on the ranking criteria and testing history. It was concluded that these areas were the best comparison areas available with which to analyse the impact of badger vaccination on cattle bTB incidence in the BVDP area. The second aim of the report was to use the selected comparison areas to analyse the impact of the vaccination intervention, and the remainder of this discussion focuses on the results of this analysis. Incidence in the BVDP area appeared to decrease throughout the reporting period, something that was only observed in one comparison area when all eight reporting years were considered. A decrease in incidence rate was observed in both the BVDP area and three of the comparison areas when trends were assessed from the start of vaccination only, i.e. excluding the three years prior. This suggests that the differences between the areas prior to vaccination were affecting the overall trends observed. As discussed above, there are likely to be many drivers of bTB, which differ between areas, and it is not possible to account for all of these within the methodology for matching areas. However, as part of further refinement to the methodology for selecting comparison areas, historical incidence rate could be considered as an alternative ranking criterion to the historical number of incidents. It may also be worth considering production system characteristics of herds. One concern relating to the potential impacts of badger vaccination on cattle bTB incidence is that a detrimental effect (e.g. an increase in incidence) might be observed in the area surrounding the intervention area due to the perturbation of badgers. Perturbation was observed during the RBCT where the removal of animals due to culling led to disturbances to badger social groups and prompted remaining badgers to roam over greater ranges (Woodroffe et al 2006). There are no known biological reasons to suspect vaccination causes social perturbation and this has never been observed during numerous badger studies. Nonetheless, to address any concerns, bTB incidence in cattle in the areas surrounding the BVDP area was assessed. The data presented here do not provide any evidence of an increase in cattle bTB incidence in the buffer area surrounding the BVDP area where such an effect of perturbation may have been observed. However, the lack of an observed effect should be interpreted carefully in light of the limitations to this study design and the lack of power associated with having only a single intervention area.
page 15
The level of BadgerBCG vaccination coverage achieved in the BVDP area as estimated using the area of the premises where vaccination occurred was at least 82%. It is difficult to determine what level of vaccination coverage would be expected to reduce the force of infection to the local cattle population. The main evidence we have about the efficacy of badger controls in the field is the RBCT where a 70% reduction in the badger population was achieved in areas where access was granted, which roughly matched with the percentage of the area covered. This level of population reduction was found to reduce bTB infection in cattle. Assuming that BadgerBCG vaccination would achieve a comparable reduction in the force of infection from the infected badger population as observed during the RBCT, we might conclude that an 82% area coverage was sufficient to reduce the force of infection; it is not known what proportion of the population within this area was vaccinated. However, this is comparing two different population dynamics (area coverage versus population reduction) and would need to be supported by dynamic modelling. It is important to remember that the measure used to assess the coverage of vaccination will be influenced by a number of factors including lack of badger activity on the premises vaccinated, unsuccessful trapping efforts, and remote vaccination of badgers on land where access was not granted. Contact between badgers and cattle can occur directly (e.g. through nose-to-nose contact), or indirectly (e.g. cattle grazing on a field, or consuming feed which has been contaminated by badgers). Studies looking at badger-cattle interaction suggest that indirect contacts between the species were the most frequent of these contacts (Drewe et al 2013; Woodroffe et al 2016) although direct contacts have been shown to be non-negligible (Böhm et al 2009). Though the exact bTB transmission processes associated with these contacts is not fully understood (Böhm et al 2009), programs targeted at controlling bTB in cattle need to consider such contacts, to reduce their frequency or to reduce the potential for transmission. Vaccination is a measure that has the potential to reduce the risk of transmission during both direct and indirect contacts between badgers and cattle through reducing the levels of bTB within the local badger population. However, badgers are known to interact with different social groups and it has been demonstrated that bTB-infected badgers roam over wider ranges than uninfected animals, spending longer away from their main sett (Weber et al 2013). The success of vaccination programs will increase as the area and the level of compliance increase (Robinson et al 2012), covering as much of the area as possible to account for these roaming behaviours. BadgerBCG vaccination was not deployed uniformly across the BVDP owing to the heterogeneous spread of badgers across this area due to the urban nature of some of the region. This heterogeneity in area coverage was realistic and although this was representative of a real-world vaccination programme, it is likely that the level of vaccine deployment achieved was higher than would be expected for other badger vaccination programmes in the field as the BVDP was conducted under optimal conditions. In addition to this, Chambers et al (2011) and Corner et al (2008) reported that BCG vaccination of badgers in experimental settings did not offer complete protection against Mycobacterium bovis (the bacterium which causes bTB) but did reduce the severity and progression of disease. As badger cubs do not leave the main sett until around eight to twelve months of age, a reduction in prevalence of bTB in badger populations is likely to require multiple revaccination programs to target these susceptible individuals, and may be hindered should infection of young occur within the sett (Robinson et al 2012). As a result of these factors a time lag in the impact of the intervention following deployment might be expected, although a follow-up period of five years could be considered sufficient time to observe any effects. The lack of complete protection could mean an increased delay in the observance of any effects of vaccination. In addition to the time lag there is the issue of sample size. The single BVDP area encompassed 100 km2; in comparison, there were 10 proactively culled areas in the RBCT constituting 1000 km2. It is likely that one area provides insufficient power to observe any effects of vaccination. The factors discussed here make assessing the impact of badger vaccination on cattle bTB incidence difficult and drawing firm conclusions from the data analysed here on the impacts of badger vaccination inappropriate. The results of the analysis conducted on these data demonstrate a decrease in OTF-W incidence rate since the implementation of badger vaccination in both the BVDP area and the comparison areas, suggesting that the decreasing trend was not due to badger vaccination. Although these results offer initial information on the situation, the effects reported need to be interpreted cautiously due to the limitations and potential bias as discussed and the lack of power associated with having only a single intervention area.
page 16
References APHA (2015a) Badger Vaccine Deployment Project – Final Lessons Learned Report, March 2015. Report to Defra. https://www.gov.uk/government/uploads/system/uploads/attachment_data/file/486330/bvdp-lessons-learned-report.pdf
APHA (2015b) Bovine tuberculosis: Infection status in cattle in GB. Annual surveillance report for the period January to December 2014. https://www.gov.uk/government/publications/bovine-tb-surveillance-in-great-britain-2014
Böhm, M, Hutchings, M.R, White, P.C.L (2009) Contact Networks in a Wildlife-Livestock Host Community: Identifying High-Risk Individuals in the transmission of Bovine TB among Badgers and Cattle. PLoS ONE 4(4): e5016, doi:10.1371/journal.pone.0005016
Chambers, M.A, Rogers, F., Delahay, R.J., Lesellier, S., Ashford, R., Dalley, D., Gowtage, S., Dave, D., Palmer, S., Brewer, J. et al (2011) Bacillus Calmette-Guérin vaccination reduces the severity and progression of tuberculosis in badgers. Proc. R. Soc. B. 278:1913-1920
Corner, L.A.L., Costello, E., Lesellier, S., O’Meara, D. & Gormley, E. (2008) Vaccination of European badgers (Meles meles) with BCG by the subcutaneous and mucosal routes induces protective immunity against endobronchial challenge with Mycobacterium bovis. Tuberculosis. 88:601-609
DEFRA (2013) Written evidence submitted to the Environment Food and Rural Affairs committee on vaccination: http://www.publications.parliament.uk/pa/cm201314/cmselect/cmenvfru/258/258we03.htm
Donnelly, C.A., Bento, A.I., Goodchild, A.V. & Downs, S.H. (2015) Exploration of the power or routine surveillance data to assess the impacts of industry-led badger culling on bovine tuberculosis incidence in cattle herds. Veterinary Record. 177:417
Downs, S.H., Clifton-Hadley, R.S., Upton, P.U., Milne, I., Ely, E., Gopal, R., Goodchild, A. V., Sayers, A. R. (2013) Tuberculin manufacturing source and breakdown incidence rate of bovine tuberculosis in British cattle, 2005-2009. Veterinary Record 172(4): 98
Drewe, J.E, O’Connor, H.M, Weber, N, McDonald, R.A, Delahay, R.J. (2013) Patterns of direct and indirect contact between cattle and badgers naturally infected with tuberculosis. Epidemiology and infection. 141, Special Issue 07, 1467-1475
Grimes, D.A. & Schulz, K.F. (2005) Compared to what? Finding controls for case-control studies. The Lancet 365(9468):1429-1433
Independent Scientific Group on Cattle TB (2007) Bovine TB: The Scientific Evidence – Final Report of the Independent Scientific Group on Cattle TB. Defra Publications, London HMSO. http://webarchive.nationalarchives.gov.uk/20090330154646/www.defra.gov.uk/animalh/tb/isg/pdf/final_report.pdf Accessed February 17, 2016.
Robinson, P.A, Corner, L.A.L, Courcier, E.A, McNair, J, Artois, M, Menzies, F.D, Abernethy, D.A (2012). BCG vaccination against tuberculosis in European badgers (Meles meles): A review. Comparative Immunology, Microbiology and Infectious Diseases. 35(4): 277-287

page 17
Weber, N, Bearhop, S, Dall, S.R.X, Delahay, R.J, McDonald, R.A, Carter, S.P (2013). Denning behaviour of the European badger (Meles meles) correlates with bovine tuberculosis infection status. Behavioural Ecology and Sociology. 67(3): 471-479
Woodroffe, R., Donnelly, C.A., Cox, D.R., Bourne, F.J., Cheeseman, C.L., Delahay, R.J., Gettingby, G., McInerney, J.P. and Morrison, W.I. (2006) Effects of culling on badger Meles meles spatial organization: implications for the control of bovine tuberculosis. Journal of Applied Ecology. 43: 1-10
Woodroffe, R., Donnelly, C.A., Ham, C., Jackson, S.Y.B., Moyes, K., Chapman, K., Stratton, N.G. & Cartwright, S.J. (2016) Badgers prefer cattle pasture but avoid cattle: implications for bovine tuberculosis control. Ecology Letters. DOI: 10.1111/ele.12654
page 18
Appendix 1: Secondary outcome measures
Herd bTB prevalence
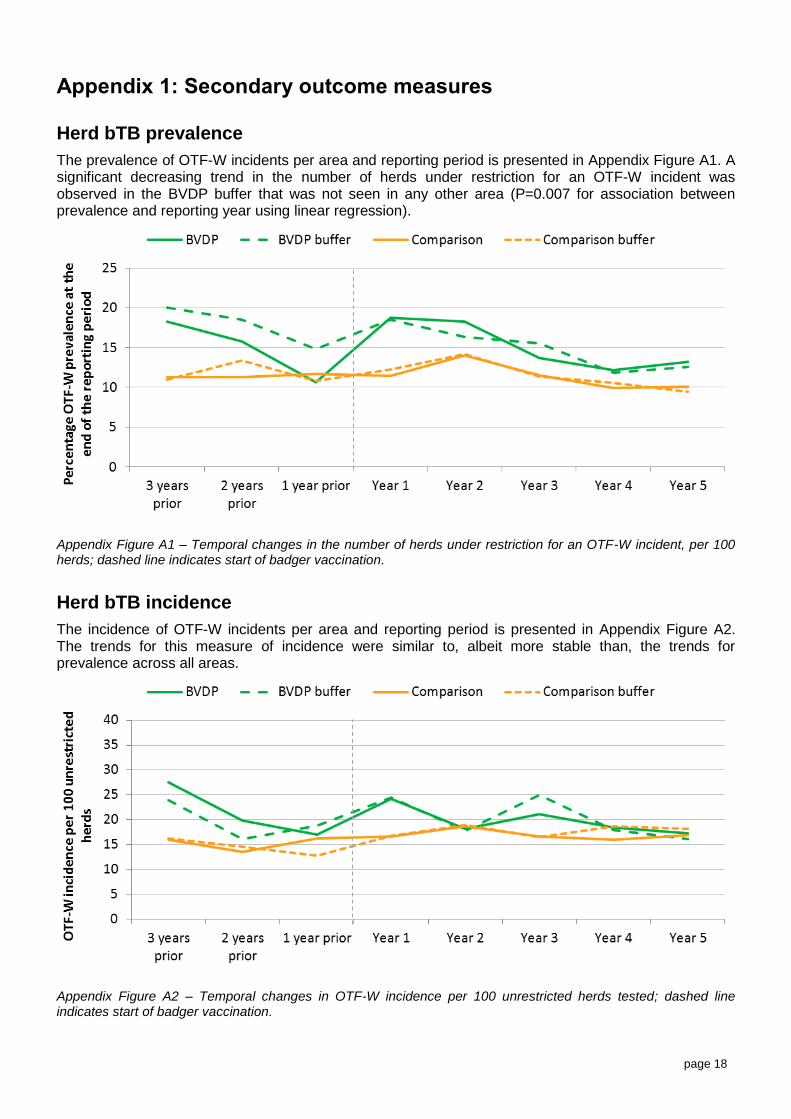
The prevalence of OTF-W incidents per area and reporting period is presented in Appendix Figure A1. A significant decreasing trend in the number of herds under restriction for an OTF-W incident was observed in the BVDP buffer that was not seen in any other area (P=0.007 for association between prevalence and reporting year using linear regression).
Appendix Figure A1 – Temporal changes in the number of herds under restriction for an OTF-W incident, per 100 herds; dashed line indicates start of badger vaccination.
Herd bTB incidence
The incidence of OTF-W incidents per area and reporting period is presented in Appendix Figure A2. The trends for this measure of incidence were similar to, albeit more stable than, the trends for prevalence across all areas.
Appendix Figure A2 – Temporal changes in OTF-W incidence per 100 unrestricted herds tested; dashed line indicates start of badger vaccination.
page 19
Number of reactors
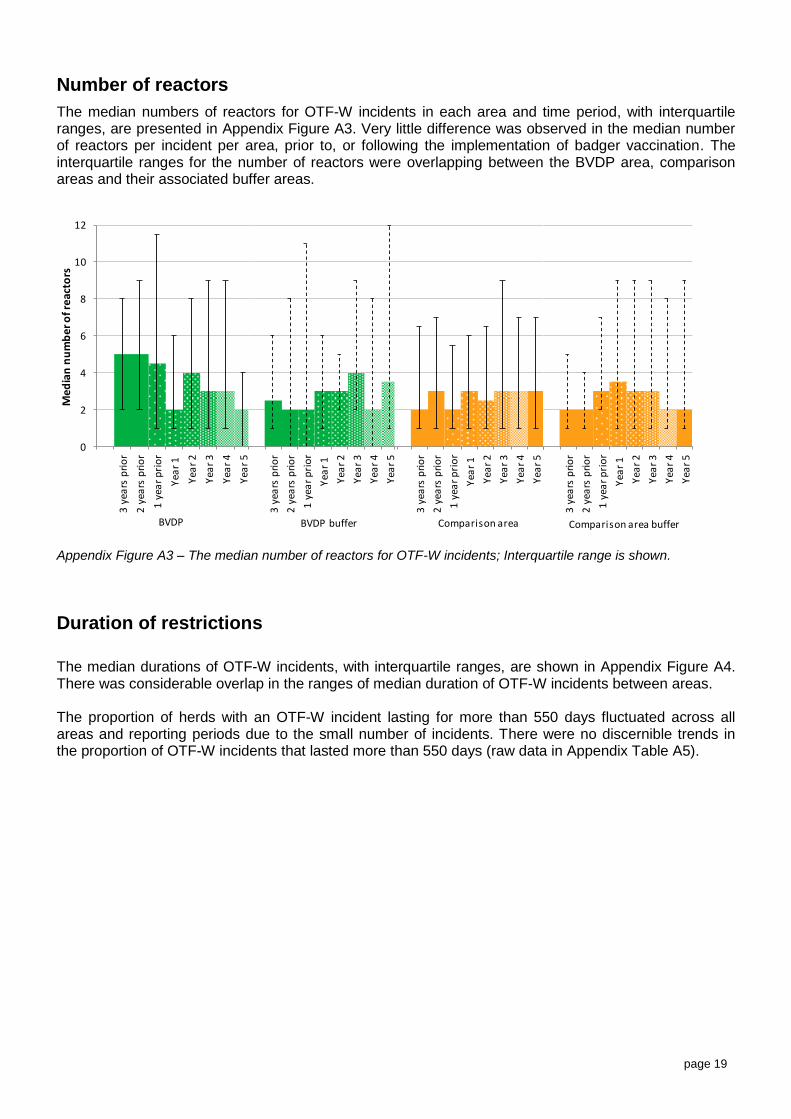
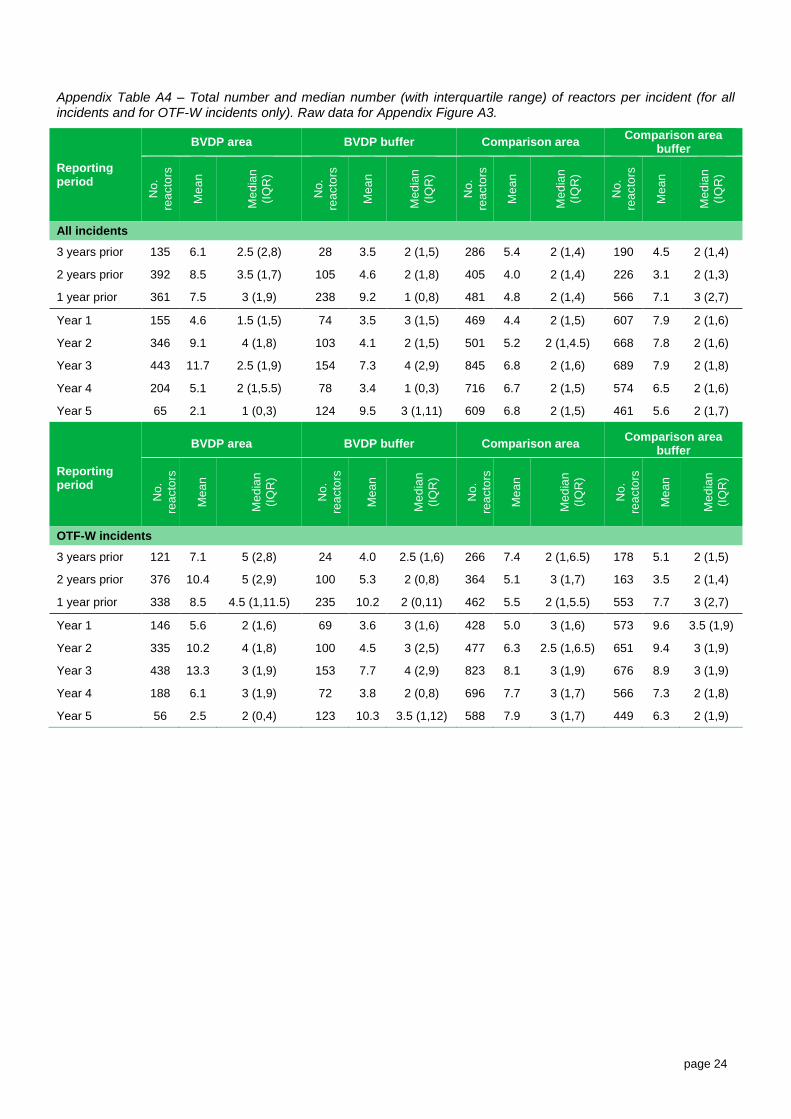
The median numbers of reactors for OTF-W incidents in each area and time period, with interquartile ranges, are presented in Appendix Figure A3. Very little difference was observed in the median number of reactors per incident per area, prior to, or following the implementation of badger vaccination. The interquartile ranges for the number of reactors were overlapping between the BVDP area, comparison areas and their associated buffer areas.
Appendix Figure A3 – The median number of reactors for OTF-W incidents; Interquartile range is shown.
Duration of restrictions
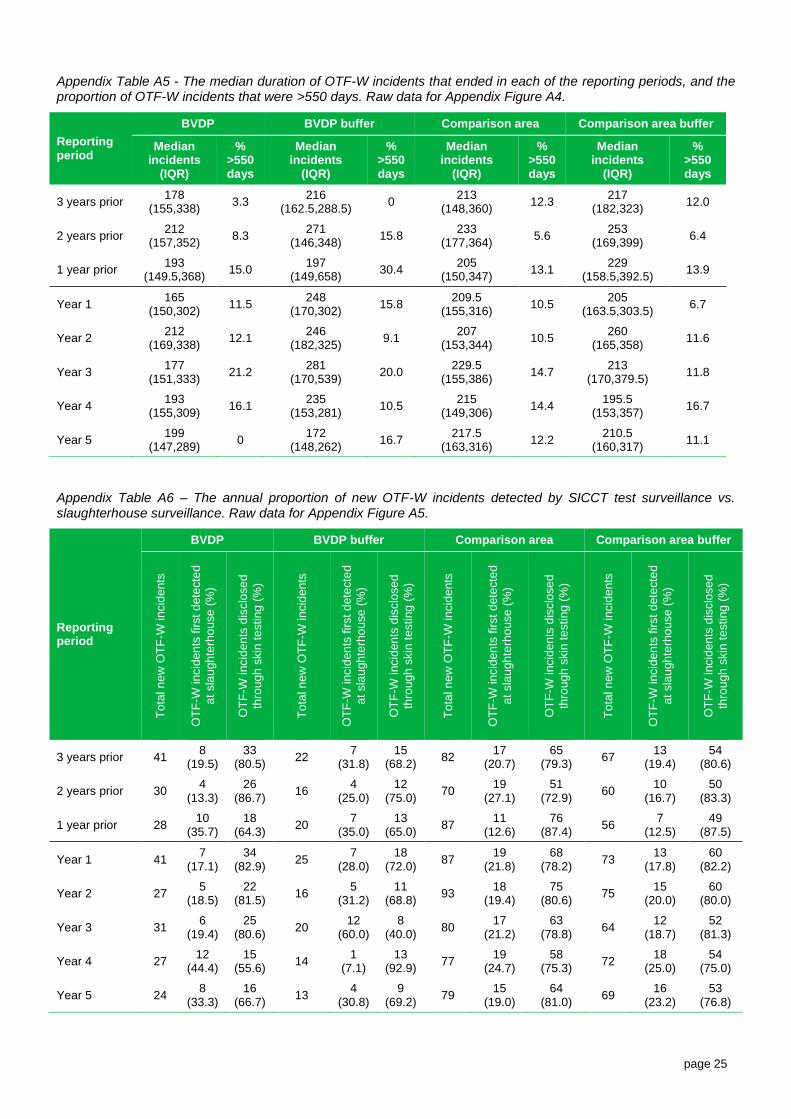
The median durations of OTF-W incidents, with interquartile ranges, are shown in Appendix Figure A4. There was considerable overlap in the ranges of median duration of OTF-W incidents between areas. The proportion of herds with an OTF-W incident lasting for more than 550 days fluctuated across all areas and reporting periods due to the small number of incidents. There were no discernible trends in the proportion of OTF-W incidents that lasted more than 550 days (raw data in Appendix Table A5).
0
2
4
6
8
10
12
3 y
ears
pri
or
2 y
ears
pri
or
1 y
ear
pri
or
Yea
r 1
Yea
r 2
Yea
r 3
Yea
r 4
Yea
r 5
Med
ian
nu
mb
er o
f re
acto
rs
BVDP
3 y
ears
pri
or
2 y
ears
pri
or
1 y
ear
pri
or
Yea
r 1
Yea
r 2
Yea
r 3
Yea
r 4
Yea
r 5
BVDP buffer
3 y
ears
pri
or
2 y
ears
pri
or
1 y
ear
pri
or
Yea
r 1
Yea
r 2
Yea
r 3
Yea
r 4
Yea
r 5
Comparison area
3 y
ears
pri
or
2 y
ears
pri
or
1 y
ear
pri
or
Yea
r 1
Yea
r 2
Yea
r 3
Yea
r 4
Yea
r 5
Comparison area buffer
page 20
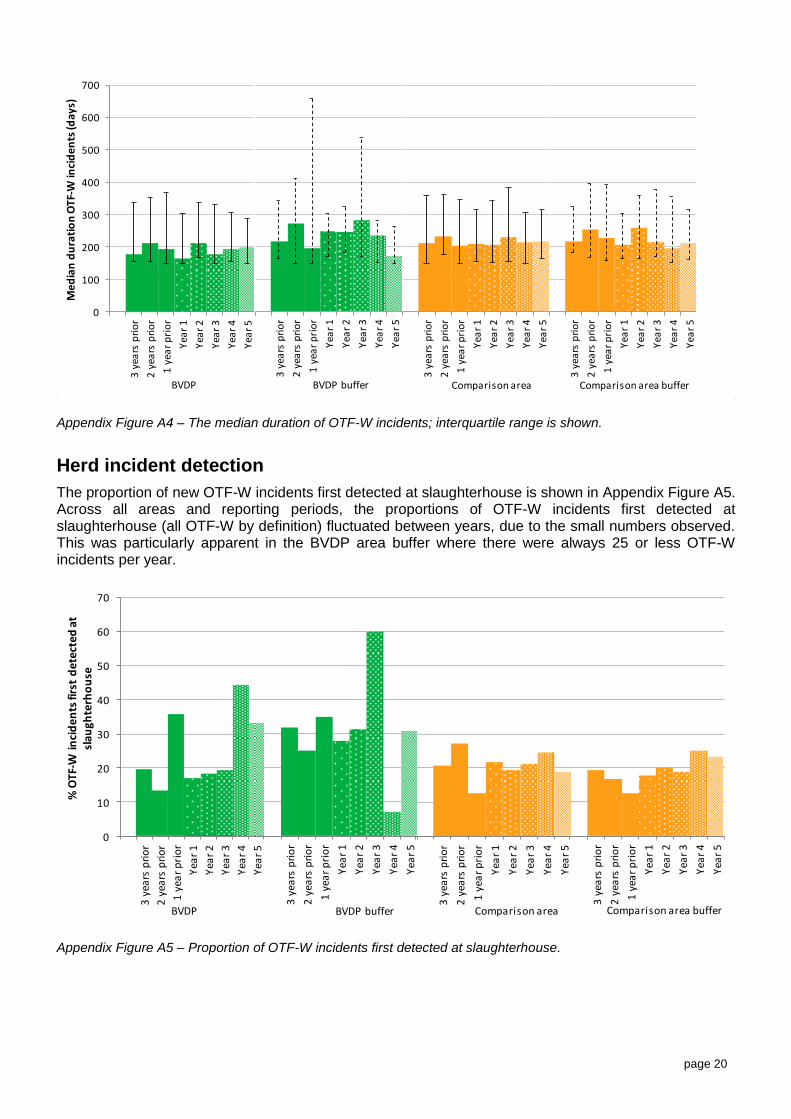
Appendix Figure A4 – The median duration of OTF-W incidents; interquartile range is shown.
Herd incident detection
The proportion of new OTF-W incidents first detected at slaughterhouse is shown in Appendix Figure A5. Across all areas and reporting periods, the proportions of OTF-W incidents first detected at slaughterhouse (all OTF-W by definition) fluctuated between years, due to the small numbers observed. This was particularly apparent in the BVDP area buffer where there were always 25 or less OTF-W incidents per year.
Appendix Figure A5 – Proportion of OTF-W incidents first detected at slaughterhouse.
0
100
200
300
400
500
600
700
3 y
ears
pri
or
2 y
ears
pri
or
1 y
ear
pri
or
Yea
r 1
Yea
r 2
Yea
r 3
Yea
r 4
Yea
r 5
Me
dia
n d
ura
tio
n O
TF-W
inci
de
nts
(day
s)
BVDP
3 y
ears
pri
or
2 y
ears
pri
or
1 y
ear
pri
or
Yea
r 1
Yea
r 2
Yea
r 3
Yea
r 4
Yea
r 5
BVDP buffer
3 y
ears
pri
or
2 y
ears
pri
or
1 y
ear
pri
or
Yea
r 1
Yea
r 2
Yea
r 3
Yea
r 4
Yea
r 5
Comparison area
3 y
ears
pri
or
2 y
ears
pri
or
1 y
ear
pri
or
Yea
r 1
Yea
r 2
Yea
r 3
Yea
r 4
Yea
r 5
Comparison area buffer
0
10
20
30
40
50
60
70
3 y
ears
pri
or
2 y
ears
pri
or
1 y
ear
pri
or
Yea
r 1
Yea
r 2
Yea
r 3
Yea
r 4
Yea
r 5
% O
TF-W
inci
den
ts fi
rst
det
ecte
d a
t sl
augh
terh
ou
se
BVDP
3 y
ears
pri
or
2 y
ears
pri
or
1 y
ear
pri
or
Yea
r 1
Yea
r 2
Yea
r 3
Yea
r 4
Yea
r 5
BVDP buffer
3 y
ears
pri
or
2 y
ears
pri
or
1 y
ear
pri
or
Yea
r 1
Yea
r 2
Yea
r 3
Yea
r 4
Yea
r 5
Comparison area
3 y
ears
pri
or
2 y
ears
pri
or
1 y
ear
pri
or
Yea
r 1
Yea
r 2
Yea
r 3
Yea
r 4
Yea
r 5
Comparison area buffer
page 21
Recurrence
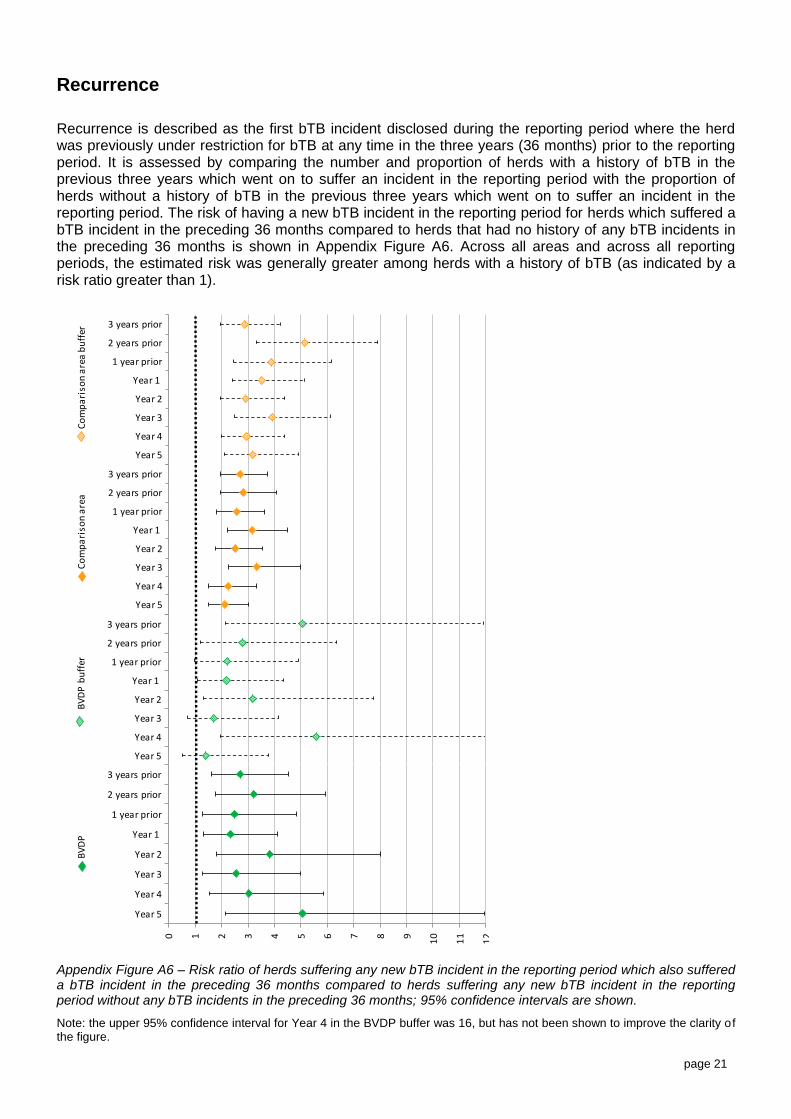
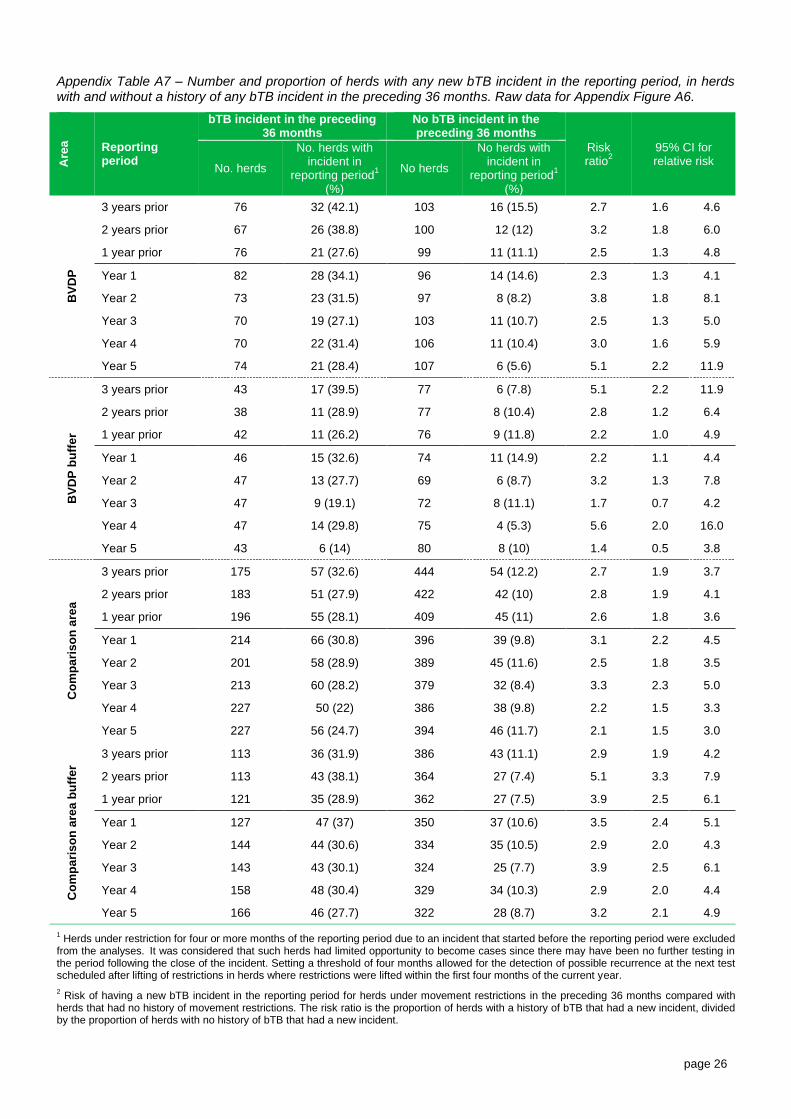
Recurrence is described as the first bTB incident disclosed during the reporting period where the herd was previously under restriction for bTB at any time in the three years (36 months) prior to the reporting period. It is assessed by comparing the number and proportion of herds with a history of bTB in the previous three years which went on to suffer an incident in the reporting period with the proportion of herds without a history of bTB in the previous three years which went on to suffer an incident in the reporting period. The risk of having a new bTB incident in the reporting period for herds which suffered a bTB incident in the preceding 36 months compared to herds that had no history of any bTB incidents in the preceding 36 months is shown in Appendix Figure A6. Across all areas and across all reporting periods, the estimated risk was generally greater among herds with a history of bTB (as indicated by a risk ratio greater than 1).
Appendix Figure A6 – Risk ratio of herds suffering any new bTB incident in the reporting period which also suffered a bTB incident in the preceding 36 months compared to herds suffering any new bTB incident in the reporting period without any bTB incidents in the preceding 36 months; 95% confidence intervals are shown.
Note: the upper 95% confidence interval for Year 4 in the BVDP buffer was 16, but has not been shown to improve the clarity of the figure.
0 1 2 3 4 5 6 7 8 9
10
11
12
Year 5
Year 4
Year 3
Year 2
Year 1
1 year prior
2 years prior
3 years prior
BV
DP
Year 5
Year 4
Year 3
Year 2
Year 1
1 year prior
2 years prior
3 years prior
BV
DP
bu
ffer
Year 5
Year 4
Year 3
Year 2
Year 1
1 year prior
2 years prior
3 years prior
Co
mp
ari
son
are
a
Year 5
Year 4
Year 3
Year 2
Year 1
1 year prior
2 years prior
3 years prior
Co
mp
ari
son
are
a b
uff
er
page 22
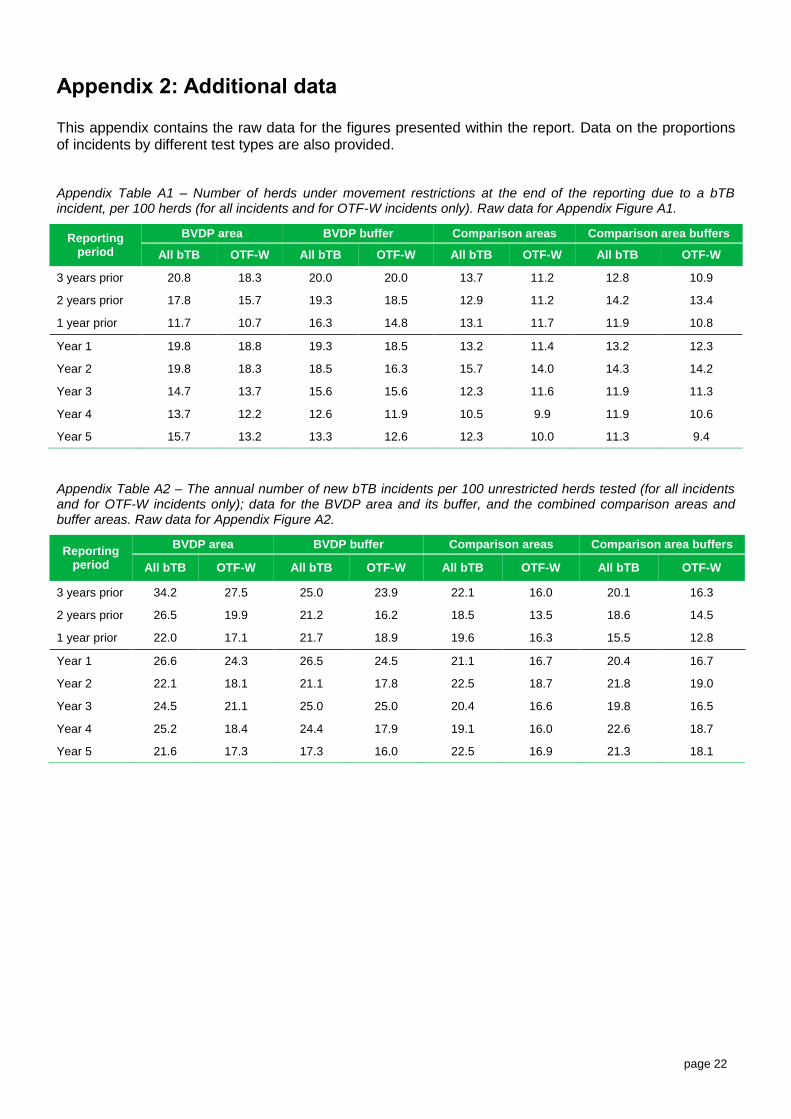
Appendix 2: Additional data This appendix contains the raw data for the figures presented within the report. Data on the proportions of incidents by different test types are also provided.
Appendix Table A1 – Number of herds under movement restrictions at the end of the reporting due to a bTB incident, per 100 herds (for all incidents and for OTF-W incidents only). Raw data for Appendix Figure A1.
Reporting period
BVDP area BVDP buffer Comparison areas Comparison area buffers
All bTB OTF-W All bTB OTF-W All bTB OTF-W All bTB OTF-W
3 years prior 20.8 18.3 20.0 20.0 13.7 11.2 12.8 10.9
2 years prior 17.8 15.7 19.3 18.5 12.9 11.2 14.2 13.4
1 year prior 11.7 10.7 16.3 14.8 13.1 11.7 11.9 10.8
Year 1 19.8 18.8 19.3 18.5 13.2 11.4 13.2 12.3
Year 2 19.8 18.3 18.5 16.3 15.7 14.0 14.3 14.2
Year 3 14.7 13.7 15.6 15.6 12.3 11.6 11.9 11.3
Year 4 13.7 12.2 12.6 11.9 10.5 9.9 11.9 10.6
Year 5 15.7 13.2 13.3 12.6 12.3 10.0 11.3 9.4
Appendix Table A2 – The annual number of new bTB incidents per 100 unrestricted herds tested (for all incidents and for OTF-W incidents only); data for the BVDP area and its buffer, and the combined comparison areas and buffer areas. Raw data for Appendix Figure A2.
Reporting period
BVDP area BVDP buffer Comparison areas Comparison area buffers
All bTB OTF-W All bTB OTF-W All bTB OTF-W All bTB OTF-W
3 years prior 34.2 27.5 25.0 23.9 22.1 16.0 20.1 16.3
2 years prior 26.5 19.9 21.2 16.2 18.5 13.5 18.6 14.5
1 year prior 22.0 17.1 21.7 18.9 19.6 16.3 15.5 12.8
Year 1 26.6 24.3 26.5 24.5 21.1 16.7 20.4 16.7
Year 2 22.1 18.1 21.1 17.8 22.5 18.7 21.8 19.0
Year 3 24.5 21.1 25.0 25.0 20.4 16.6 19.8 16.5
Year 4 25.2 18.4 24.4 17.9 19.1 16.0 22.6 18.7
Year 5 21.6 17.3 17.3 16.0 22.5 16.9 21.3 18.1
page 23
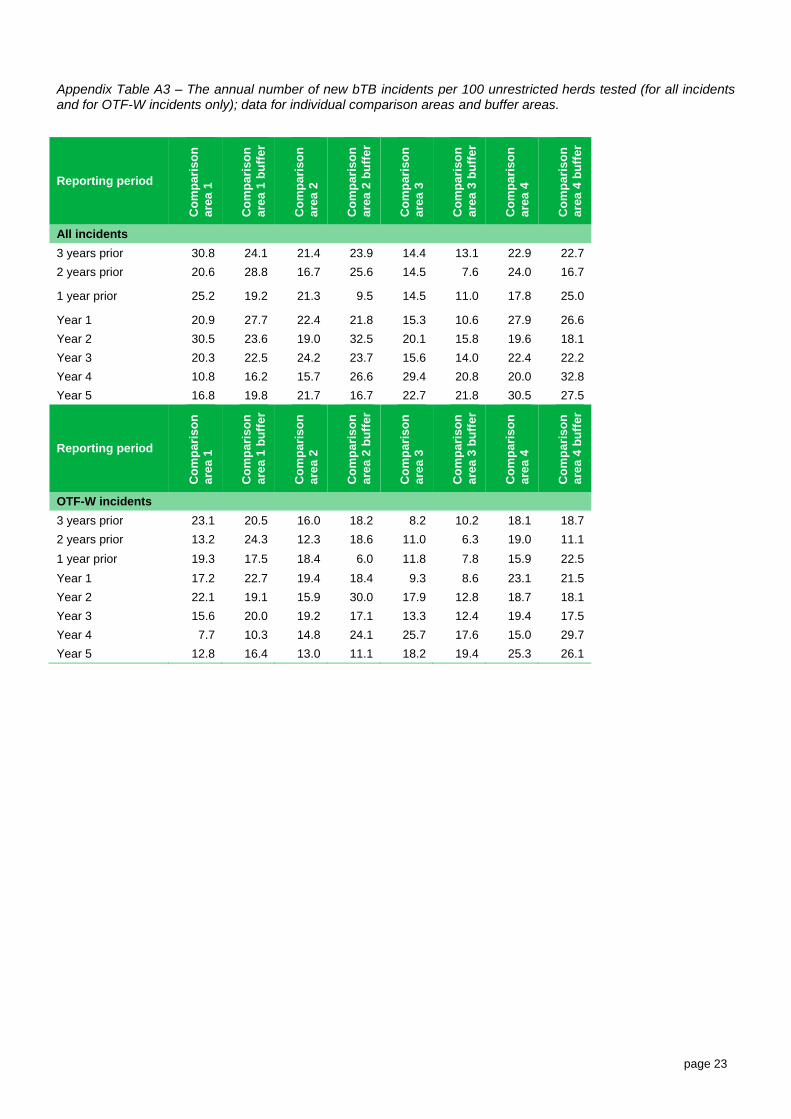
Appendix Table A3 – The annual number of new bTB incidents per 100 unrestricted herds tested (for all incidents and for OTF-W incidents only); data for individual comparison areas and buffer areas.
Reporting period C
om
pa
ris
on
are
a 1
Co
mp
ari
so
n
are
a 1
bu
ffe
r
Co
mp
ari
so
n
are
a 2
Co
mp
ari
so
n
are
a 2
bu
ffe
r
Co
mp
ari
so
n
are
a 3
Co
mp
ari
so
n
are
a 3
bu
ffe
r
Co
mp
ari
so
n
are
a 4
Co
mp
ari
so
n
are
a 4
bu
ffe
r
All incidents
3 years prior 30.8 24.1 21.4 23.9 14.4 13.1 22.9 22.7
2 years prior 20.6 28.8 16.7 25.6 14.5 7.6 24.0 16.7
1 year prior 25.2 19.2 21.3 9.5 14.5 11.0 17.8 25.0
Year 1 20.9 27.7 22.4 21.8 15.3 10.6 27.9 26.6
Year 2 30.5 23.6 19.0 32.5 20.1 15.8 19.6 18.1
Year 3 20.3 22.5 24.2 23.7 15.6 14.0 22.4 22.2
Year 4 10.8 16.2 15.7 26.6 29.4 20.8 20.0 32.8
Year 5 16.8 19.8 21.7 16.7 22.7 21.8 30.5 27.5
Reporting period
Co
mp
ari
so
n
are
a 1
Co
mp
ari
so
n
are
a 1
bu
ffe
r
Co
mp
ari
so
n
are
a 2
Co
mp
ari
so
n
are
a 2
bu
ffe
r
Co
mp
ari
so
n
are
a 3
Co
mp
ari
so
n
are
a 3
bu
ffe
r
Co
mp
ari
so
n
are
a 4
Co
mp
ari
so
n
are
a 4
bu
ffe
r
OTF-W incidents
3 years prior 23.1 20.5 16.0 18.2 8.2 10.2 18.1 18.7
2 years prior 13.2 24.3 12.3 18.6 11.0 6.3 19.0 11.1
1 year prior 19.3 17.5 18.4 6.0 11.8 7.8 15.9 22.5
Year 1 17.2 22.7 19.4 18.4 9.3 8.6 23.1 21.5
Year 2 22.1 19.1 15.9 30.0 17.9 12.8 18.7 18.1
Year 3 15.6 20.0 19.2 17.1 13.3 12.4 19.4 17.5
Year 4 7.7 10.3 14.8 24.1 25.7 17.6 15.0 29.7
Year 5 12.8 16.4 13.0 11.1 18.2 19.4 25.3 26.1
page 24
Appendix Table A4 – Total number and median number (with interquartile range) of reactors per incident (for all incidents and for OTF-W incidents only). Raw data for Appendix Figure A3.
Reporting period
BVDP area BVDP buffer Comparison area Comparison area
buffer N
o.
rea
cto
rs
Me
an
Me
dia
n
(IQ
R)
No
.
rea
cto
rs
Me
an
Me
dia
n
(IQ
R)
No
.
rea
cto
rs
Me
an
Me
dia
n
(IQ
R)
No
.
rea
cto
rs
Me
an
Me
dia
n
(IQ
R)
All incidents
3 years prior 135 6.1 2.5 (2,8) 28 3.5 2 (1,5) 286 5.4 2 (1,4) 190 4.5 2 (1,4)
2 years prior 392 8.5 3.5 (1,7) 105 4.6 2 (1,8) 405 4.0 2 (1,4) 226 3.1 2 (1,3)
1 year prior 361 7.5 3 (1,9) 238 9.2 1 (0,8) 481 4.8 2 (1,4) 566 7.1 3 (2,7)
Year 1 155 4.6 1.5 (1,5) 74 3.5 3 (1,5) 469 4.4 2 (1,5) 607 7.9 2 (1,6)
Year 2 346 9.1 4 (1,8) 103 4.1 2 (1,5) 501 5.2 2 (1,4.5) 668 7.8 2 (1,6)
Year 3 443 11.7 2.5 (1,9) 154 7.3 4 (2,9) 845 6.8 2 (1,6) 689 7.9 2 (1,8)
Year 4 204 5.1 2 (1,5.5) 78 3.4 1 (0,3) 716 6.7 2 (1,5) 574 6.5 2 (1,6)
Year 5 65 2.1 1 (0,3) 124 9.5 3 (1,11) 609 6.8 2 (1,5) 461 5.6 2 (1,7)
Reporting period
BVDP area BVDP buffer Comparison area Comparison area
buffer
No.
rea
cto
rs
Me
an
Me
dia
n
(IQ
R)
No.
rea
cto
rs
Me
an
Me
dia
n
(IQ
R)
No.
rea
cto
rs
Me
an
Me
dia
n
(IQ
R)
No.
rea
cto
rs
Me
an
Me
dia
n
(IQ
R)
OTF-W incidents
3 years prior 121 7.1 5 (2,8) 24 4.0 2.5 (1,6) 266 7.4 2 (1,6.5) 178 5.1 2 (1,5)
2 years prior 376 10.4 5 (2,9) 100 5.3 2 (0,8) 364 5.1 3 (1,7) 163 3.5 2 (1,4)
1 year prior 338 8.5 4.5 (1,11.5) 235 10.2 2 (0,11) 462 5.5 2 (1,5.5) 553 7.7 3 (2,7)
Year 1 146 5.6 2 (1,6) 69 3.6 3 (1,6) 428 5.0 3 (1,6) 573 9.6 3.5 (1,9)
Year 2 335 10.2 4 (1,8) 100 4.5 3 (2,5) 477 6.3 2.5 (1,6.5) 651 9.4 3 (1,9)
Year 3 438 13.3 3 (1,9) 153 7.7 4 (2,9) 823 8.1 3 (1,9) 676 8.9 3 (1,9)
Year 4 188 6.1 3 (1,9) 72 3.8 2 (0,8) 696 7.7 3 (1,7) 566 7.3 2 (1,8)
Year 5 56 2.5 2 (0,4) 123 10.3 3.5 (1,12) 588 7.9 3 (1,7) 449 6.3 2 (1,9)
page 25
Appendix Table A5 - The median duration of OTF-W incidents that ended in each of the reporting periods, and the proportion of OTF-W incidents that were >550 days. Raw data for Appendix Figure A4.
Reporting period
BVDP BVDP buffer Comparison area Comparison area buffer
Median incidents
(IQR)
% >550 days
Median incidents
(IQR)
% >550 days
Median incidents
(IQR)
% >550 days
Median incidents
(IQR)
% >550 days
3 years prior 178
(155,338) 3.3
216 (162.5,288.5)
0 213
(148,360) 12.3
217 (182,323)
12.0
2 years prior 212
(157,352) 8.3
271 (146,348)
15.8 233
(177,364) 5.6
253 (169,399)
6.4
1 year prior 193
(149.5,368) 15.0
197 (149,658)
30.4 205
(150,347) 13.1
229 (158.5,392.5)
13.9
Year 1 165
(150,302) 11.5
248 (170,302)
15.8 209.5
(155,316) 10.5
205 (163.5,303.5)
6.7
Year 2 212
(169,338) 12.1
246 (182,325)
9.1 207
(153,344) 10.5
260 (165,358)
11.6
Year 3 177
(151,333) 21.2
281 (170,539)
20.0 229.5
(155,386) 14.7
213 (170,379.5)
11.8
Year 4 193
(155,309) 16.1
235 (153,281)
10.5 215
(149,306) 14.4
195.5 (153,357)
16.7
Year 5 199
(147,289) 0
172 (148,262)
16.7 217.5
(163,316) 12.2
210.5 (160,317)
11.1
Appendix Table A6 – The annual proportion of new OTF-W incidents detected by SICCT test surveillance vs. slaughterhouse surveillance. Raw data for Appendix Figure A5.
Reporting period
BVDP BVDP buffer Comparison area Comparison area buffer
To
tal n
ew
OT
F-W
incid
en
ts
OT
F-W
incid
en
ts f
irst
dete
cte
d
at
sla
ugh
terh
ou
se
(%
)
OT
F-W
incid
en
ts d
isclo
se
d
thro
ugh
skin
te
sting
(%
)
To
tal n
ew
OT
F-W
incid
en
ts
OT
F-W
incid
en
ts f
irst
dete
cte
d
at
sla
ugh
terh
ou
se
(%
)
OT
F-W
incid
en
ts d
isclo
se
d
thro
ugh
skin
te
sting
(%
)
To
tal n
ew
OT
F-W
incid
en
ts
OT
F-W
incid
en
ts f
irst
dete
cte
d
at
sla
ugh
terh
ou
se
(%
)
OT
F-W
incid
en
ts d
isclo
se
d
thro
ugh
skin
te
sting
(%
)
To
tal n
ew
OT
F-W
incid
en
ts
OT
F-W
incid
en
ts f
irst
dete
cte
d
at
sla
ugh
terh
ou
se
(%
)
OT
F-W
incid
en
ts d
isclo
se
d
thro
ugh
skin
te
sting
(%
)
3 years prior 41 8
(19.5) 33
(80.5) 22
7 (31.8)
15 (68.2)
82 17
(20.7) 65
(79.3) 67
13 (19.4)
54 (80.6)
2 years prior 30 4
(13.3) 26
(86.7) 16
4 (25.0)
12 (75.0)
70 19
(27.1) 51
(72.9) 60
10 (16.7)
50 (83.3)
1 year prior 28 10
(35.7) 18
(64.3) 20
7 (35.0)
13 (65.0)
87 11
(12.6) 76
(87.4) 56
7 (12.5)
49 (87.5)
Year 1 41 7
(17.1) 34
(82.9) 25
7 (28.0)
18 (72.0)
87 19
(21.8) 68
(78.2) 73
13 (17.8)
60 (82.2)
Year 2 27 5
(18.5) 22
(81.5) 16
5 (31.2)
11 (68.8)
93 18
(19.4) 75
(80.6) 75
15 (20.0)
60 (80.0)
Year 3 31 6
(19.4) 25
(80.6) 20
12 (60.0)
8 (40.0)
80 17
(21.2) 63
(78.8) 64
12 (18.7)
52 (81.3)
Year 4 27 12
(44.4) 15
(55.6) 14
1 (7.1)
13 (92.9)
77 19
(24.7) 58
(75.3) 72
18 (25.0)
54 (75.0)
Year 5 24 8
(33.3) 16
(66.7) 13
4 (30.8)
9 (69.2)
79 15
(19.0) 64
(81.0) 69
16 (23.2)
53 (76.8)
page 26
Appendix Table A7 – Number and proportion of herds with any new bTB incident in the reporting period, in herds with and without a history of any bTB incident in the preceding 36 months. Raw data for Appendix Figure A6.
Are
a
Reporting period
bTB incident in the preceding 36 months
No bTB incident in the preceding 36 months
Risk ratio
2
95% CI for relative risk
No. herds
No. herds with incident in
reporting period1
(%)
No herds
No herds with incident in
reporting period1
(%)
BV
DP
3 years prior 76 32 (42.1) 103 16 (15.5) 2.7 1.6 4.6
2 years prior 67 26 (38.8) 100 12 (12) 3.2 1.8 6.0
1 year prior 76 21 (27.6) 99 11 (11.1) 2.5 1.3 4.8
Year 1 82 28 (34.1) 96 14 (14.6) 2.3 1.3 4.1
Year 2 73 23 (31.5) 97 8 (8.2) 3.8 1.8 8.1
Year 3 70 19 (27.1) 103 11 (10.7) 2.5 1.3 5.0
Year 4 70 22 (31.4) 106 11 (10.4) 3.0 1.6 5.9
Year 5 74 21 (28.4) 107 6 (5.6) 5.1 2.2 11.9
BV
DP
bu
ffe
r
3 years prior 43 17 (39.5) 77 6 (7.8) 5.1 2.2 11.9
2 years prior 38 11 (28.9) 77 8 (10.4) 2.8 1.2 6.4
1 year prior 42 11 (26.2) 76 9 (11.8) 2.2 1.0 4.9
Year 1 46 15 (32.6) 74 11 (14.9) 2.2 1.1 4.4
Year 2 47 13 (27.7) 69 6 (8.7) 3.2 1.3 7.8
Year 3 47 9 (19.1) 72 8 (11.1) 1.7 0.7 4.2
Year 4 47 14 (29.8) 75 4 (5.3) 5.6 2.0 16.0
Year 5 43 6 (14) 80 8 (10) 1.4 0.5 3.8
Co
mp
ari
so
n a
rea
3 years prior 175 57 (32.6) 444 54 (12.2) 2.7 1.9 3.7
2 years prior 183 51 (27.9) 422 42 (10) 2.8 1.9 4.1
1 year prior 196 55 (28.1) 409 45 (11) 2.6 1.8 3.6
Year 1 214 66 (30.8) 396 39 (9.8) 3.1 2.2 4.5
Year 2 201 58 (28.9) 389 45 (11.6) 2.5 1.8 3.5
Year 3 213 60 (28.2) 379 32 (8.4) 3.3 2.3 5.0
Year 4 227 50 (22) 386 38 (9.8) 2.2 1.5 3.3
Year 5 227 56 (24.7) 394 46 (11.7) 2.1 1.5 3.0
Co
mp
ari
so
n a
rea
bu
ffe
r
3 years prior 113 36 (31.9) 386 43 (11.1) 2.9 1.9 4.2
2 years prior 113 43 (38.1) 364 27 (7.4) 5.1 3.3 7.9
1 year prior 121 35 (28.9) 362 27 (7.5) 3.9 2.5 6.1
Year 1 127 47 (37) 350 37 (10.6) 3.5 2.4 5.1
Year 2 144 44 (30.6) 334 35 (10.5) 2.9 2.0 4.3
Year 3 143 43 (30.1) 324 25 (7.7) 3.9 2.5 6.1
Year 4 158 48 (30.4) 329 34 (10.3) 2.9 2.0 4.4
Year 5 166 46 (27.7) 322 28 (8.7) 3.2 2.1 4.9
1 Herds under restriction for four or more months of the reporting period due to an incident that started before the reporting period were excluded
from the analyses. It was considered that such herds had limited opportunity to become cases since there may have been no further testing in the period following the close of the incident. Setting a threshold of four months allowed for the detection of possible recurrence at the next test scheduled after lifting of restrictions in herds where restrictions were lifted within the first four months of the current year.
2 Risk of having a new bTB incident in the reporting period for herds under movement restrictions in the preceding 36 months compared with
herds that had no history of movement restrictions. The risk ratio is the proportion of herds with a history of bTB that had a new incident, divided by the proportion of herds with no history of bTB that had a new incident.
page 27
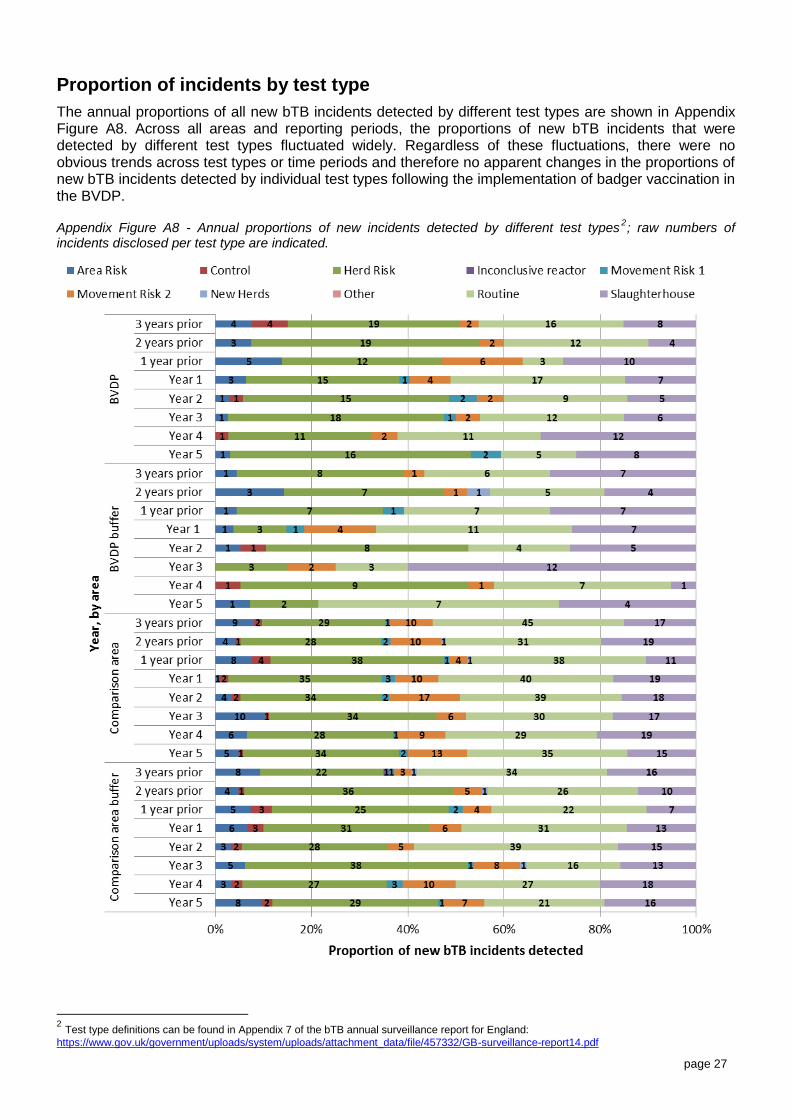
Proportion of incidents by test type
The annual proportions of all new bTB incidents detected by different test types are shown in Appendix Figure A8. Across all areas and reporting periods, the proportions of new bTB incidents that were detected by different test types fluctuated widely. Regardless of these fluctuations, there were no obvious trends across test types or time periods and therefore no apparent changes in the proportions of new bTB incidents detected by individual test types following the implementation of badger vaccination in the BVDP.
Appendix Figure A8 - Annual proportions of new incidents detected by different test types2; raw numbers of
incidents disclosed per test type are indicated.
2 Test type definitions can be found in Appendix 7 of the bTB annual surveillance report for England:
https://www.gov.uk/government/uploads/system/uploads/attachment_data/file/457332/GB-surveillance-report14.pdf
page 28
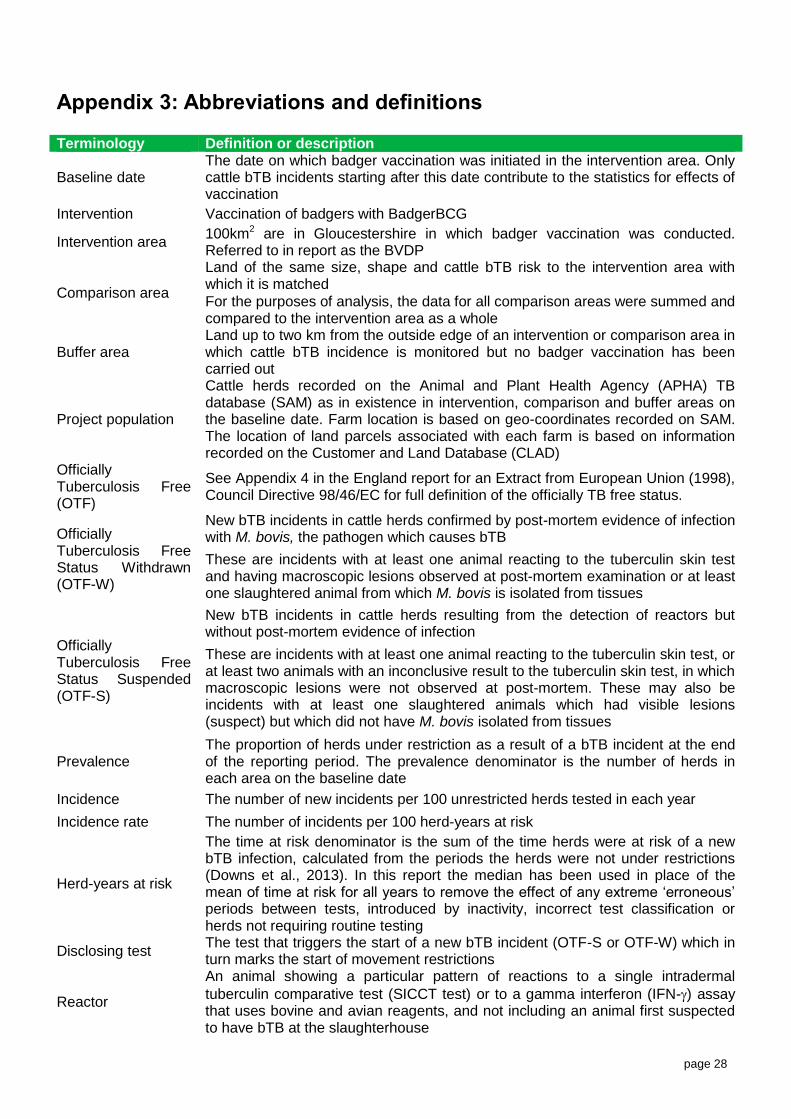
Appendix 3: Abbreviations and definitions Terminology Definition or description
Baseline date The date on which badger vaccination was initiated in the intervention area. Only cattle bTB incidents starting after this date contribute to the statistics for effects of vaccination
Intervention Vaccination of badgers with BadgerBCG
Intervention area 100km2 are in Gloucestershire in which badger vaccination was conducted. Referred to in report as the BVDP
Comparison area
Land of the same size, shape and cattle bTB risk to the intervention area with which it is matched
For the purposes of analysis, the data for all comparison areas were summed and compared to the intervention area as a whole
Buffer area Land up to two km from the outside edge of an intervention or comparison area in which cattle bTB incidence is monitored but no badger vaccination has been carried out
Project population
Cattle herds recorded on the Animal and Plant Health Agency (APHA) TB database (SAM) as in existence in intervention, comparison and buffer areas on the baseline date. Farm location is based on geo-coordinates recorded on SAM. The location of land parcels associated with each farm is based on information recorded on the Customer and Land Database (CLAD)
Officially Tuberculosis Free (OTF)
See Appendix 4 in the England report for an Extract from European Union (1998), Council Directive 98/46/EC for full definition of the officially TB free status.
Officially Tuberculosis Free Status Withdrawn (OTF-W)
New bTB incidents in cattle herds confirmed by post-mortem evidence of infection with M. bovis, the pathogen which causes bTB
These are incidents with at least one animal reacting to the tuberculin skin test and having macroscopic lesions observed at post-mortem examination or at least one slaughtered animal from which M. bovis is isolated from tissues
Officially Tuberculosis Free Status Suspended (OTF-S)
New bTB incidents in cattle herds resulting from the detection of reactors but without post-mortem evidence of infection
These are incidents with at least one animal reacting to the tuberculin skin test, or at least two animals with an inconclusive result to the tuberculin skin test, in which macroscopic lesions were not observed at post-mortem. These may also be incidents with at least one slaughtered animals which had visible lesions (suspect) but which did not have M. bovis isolated from tissues
Prevalence The proportion of herds under restriction as a result of a bTB incident at the end of the reporting period. The prevalence denominator is the number of herds in each area on the baseline date
Incidence The number of new incidents per 100 unrestricted herds tested in each year
Incidence rate The number of incidents per 100 herd-years at risk
Herd-years at risk
The time at risk denominator is the sum of the time herds were at risk of a new bTB infection, calculated from the periods the herds were not under restrictions (Downs et al., 2013). In this report the median has been used in place of the mean of time at risk for all years to remove the effect of any extreme ‘erroneous’ periods between tests, introduced by inactivity, incorrect test classification or herds not requiring routine testing
Disclosing test The test that triggers the start of a new bTB incident (OTF-S or OTF-W) which in turn marks the start of movement restrictions
Reactor
An animal showing a particular pattern of reactions to a single intradermal
tuberculin comparative test (SICCT test) or to a gamma interferon (IFN-) assay that uses bovine and avian reagents, and not including an animal first suspected to have bTB at the slaughterhouse
page 29
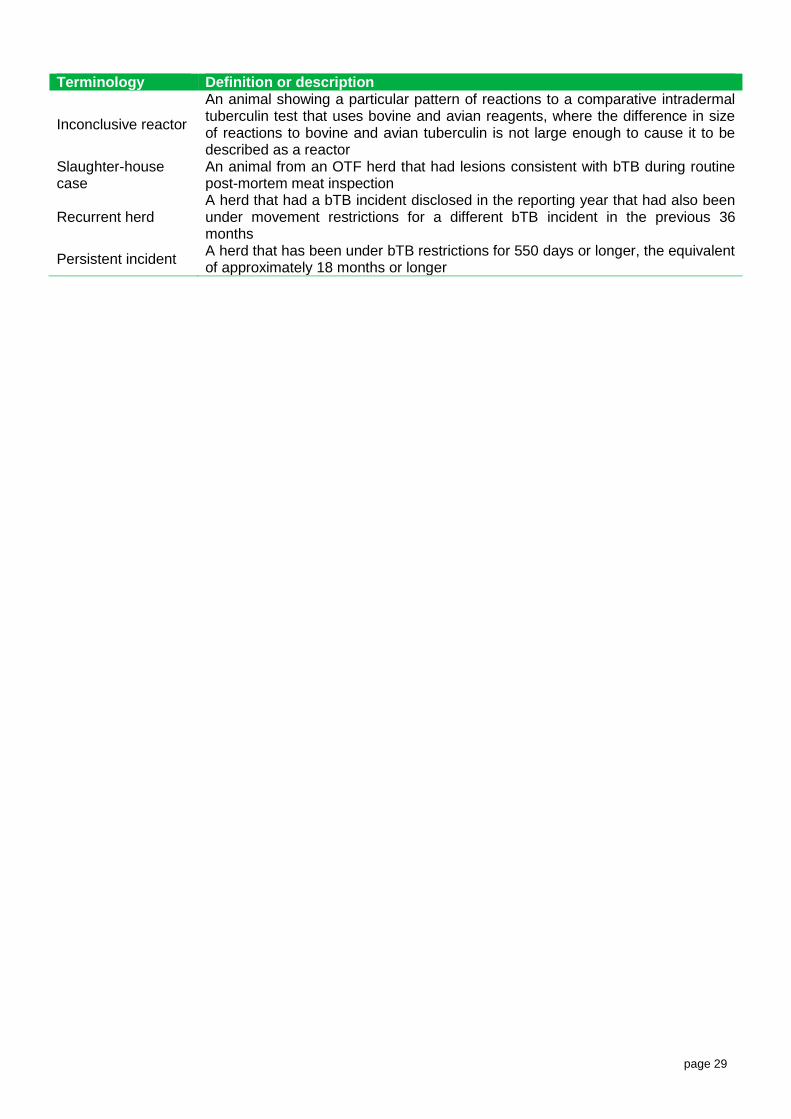
Terminology Definition or description
Inconclusive reactor
An animal showing a particular pattern of reactions to a comparative intradermal tuberculin test that uses bovine and avian reagents, where the difference in size of reactions to bovine and avian tuberculin is not large enough to cause it to be described as a reactor
Slaughter-house case
An animal from an OTF herd that had lesions consistent with bTB during routine post-mortem meat inspection
Recurrent herd A herd that had a bTB incident disclosed in the reporting year that had also been under movement restrictions for a different bTB incident in the previous 36 months
Persistent incident A herd that has been under bTB restrictions for 550 days or longer, the equivalent of approximately 18 months or longer