Embed Size (px)
Citation preview
A Dyadic Approach to Leadership Emergence
Maureen E. McCusker
Thesis submitted to the faculty of the Virginia Polytechnic Institute and State University in partial fulfillment of the requirements for the degree of
Master of Science
In
Psychology
Roseanne J. Foti, Chair
Neil M. A. Hauenstein
Michael T. Braun
May 26, 2015
Blacksburg, Virginia
Keywords: Leader, follower, fit, process, social networks, ERGM, personality.
A Dyadic Approach to Leadership Emergence
Maureen E. McCusker
ABSTRACT
Leadership emergence is best conceptualized as a complex, multi-level process arising from the
dynamic interplay of all elements in the process: group members, relations, and context (Day,
2014). This study seeks to simultaneously examine to the role of each in the leadership
emergence process by assessing leader and follower traits, their trait similarity, task, behaviors,
and the network itself. Using a rotation design, 99 cadets in groups of three completed four tasks
with alternating partners and subsequently provided sociometric ratings of each of their group
members. Data was analyzed using Exponential Random Graph Modeling, which controls for
endogenous group effects. In general, there was a tendency toward nominating others as leaders.
High scores on dominance and intelligence predicted leadership emergence, and low scores on
dominance predicted follower emergence. The type of task did not affect leadership emergence.
Perceived leader behavior unexpectedly reduced the likelihood of nominating another as a
leader. Results from this study highlight the importance of studying all components of leadership
process and are once step closer toward doing so completely and accurately.
iii
Table of Contents
1.0 Introduction................................................................................................................................1
2.0 Literature Review.......................................................................................................................5
2.1 Leadership Emergence...................................................................................................5
2.2 Exponential Random Graph Modeling..........................................................................9
2.3 Individual Differences in Leaders and Followers........................................................12
2.4 Leader Attributes........................................................................................................ 12
2.5 Follower Attributes .....................................................................................................16
2.6 Leader-Follower Similarity and Dissimilarity ............................................................18
2.7 Leader Behavior ..........................................................................................................24
3.0 Method ....................................................................................................................................27
3.1 Data source .................................................................................................................27
3.2 Participant Sample and Design ...................................................................................28
3.3 Tasks ...........................................................................................................................28
3.4 Measures .....................................................................................................................29
3.5 Procedure.....................................................................................................................31
3.6 Data Analysis ..............................................................................................................32
4.0 Results ....................................................................................................................................35
4.1 Data Structure .............................................................................................................35
4.2 Descriptive Statistics ..................................................................................................37
4.3 Effects of Structural Characteristics ...........................................................................37
4.4. Hypothesis Testing ....................................................................................................38
4.5 Model Goodness of Fit Tests ......................................................................................40
5.0 Discussion ...............................................................................................................................41
5.1 Discussion of Findings ................................................................................................41
5.2 Limitations ..................................................................................................................50
5.3 Conclusions .................................................................................................................51
6.0 References ...............................................................................................................................53
Appendix A- Leadership Behavior Scale .....................................................................................78
Appendix B- GLI Scale................................................................................................................ 79
iv
List of Figures
Figure 1: Histogram plot for normality of GLI data .....................................................................66
Figure 2: Sample of GLI mega-matrix file ...................................................................................67
Figure 3: Sample of task matrix file .............................................................................................68
Figure 4: Sample of behavioral matrix file ...................................................................................69
Figure 5: Sample of structural zero matrix file..............................................................................70
v
List of Tables
Table 1- Visual representation and description of endogenous structural configurations.............71
Table 2- Proposed model analysis and expected results................................................................72
Table 3- Normality data for GLI....................................................................................................73
Table 4- Individual and dyadic covariates and correlation matrix................................................74
Table 5-Correlations between General Leader Impression Scale and perceived leader behavior 75
Table 6- Results of ERG model of leadership and followership emergence.................................76
Table 7- Goodness of fit statistics for model parameters..............................................................77
1
1.0- Introduction
Since its inception, leadership research has been predominantly leader-centric (Uhl-Bien,
Riggio, Lowe & Carsten, 2013). That is, the main focus has been how qualities and behaviors of
leaders relate to particular outcomes or effectiveness (e.g. Burk, Stagl, Klein, Goodwin, Salas &
Halpin, 2006). Due to the exclusive emphasis on the leader, the leader-centric approach
generally neglects the other contributing forces involved in the leadership system. Recently,
however, there has been increased attention to leadership as a process (Bono & Judge, 2003;
Day, 2014; Lord & Brown, 2001; Uhl-Bien, Marion & McKelvey, 2007). The process view
conceptualizes leadership as a socially-constructed, complex phenomenon, emerging as a result
of the dynamic interplay of all group members and relations within a given social context (Day,
2014). In this way, the study of leadership is not solely focused on the “leader” and his/her
influence; followers, peers, the group and the situation are all considered active, interacting
components from which leadership emerges (Avolio, Walumba, & Weber, 2009).
Much of the research within the leadership realm has typically focused on only one of
these domains: the leader (e.g. Bono & Judge, 2004), the follower (e.g. Felfe & Schyns, 2010;
Meindl, 1995; Sy, 2010) the leader-follower relationship (e. g. Graen & Uhl-Bien, 1995), the
network of relationships within the group (e. g. Bono & Anderson, 2005) or the situational
context (e.g. Yukl, 1981); however, no known study to date has simultaneously examined how
all of these parts combine to produce the emergence of leadership while also controlling for
endogenous dyadic dependence. Thus, in order to truly to understand how the process of
leadership unfolds, researchers need to examine together the relationships between each of these
contributing, intertwined factors.
2
Leadership Emergence
Emergent leaders, in contrast to formal leaders, are those individuals who are identified
as being “leaderlike” in a group of individuals where there is no designated leader (Hogan,
Curphy, & Hogan, 1994). More specifically, this identification process involves one or more
individuals perceiving leaderlike qualities in one or more others (Lord et al., 1986). So, at its
most decomposed level, leadership emergence is inherently dyadic because it involves a relation
between two individuals. In addition, the process of leadership emergence includes many
interacting parts at multiple levels: individuals’ cognitions are nested within dyads and dyads are
nested within larger groups. As such, leadership emergence may be best conceptualized as a
network of interdependent dyadic relationships embedded within a larger social sphere (Emery,
2012). However, most research involving informal leadership has not been conducted and
analyzed at the dyadic level, nor has it simultaneously included the many components of the
leadership process in one statistical model. Misalignment in the level of construct, measurement,
and/or analysis may result in biased estimates of results (Kozlowski & Klein, 2000), and the
exclusion of important elements of the process can lead to an underspecified or misspecified
model of leadership emergence (Antonakis, Bendahan, Jacquart, Lalive, 2010). This study aligns
the dyadic theory, measurement, and analysis of leadership emergence within a multilevel
framework by using a social network technique not traditionally used in I/O Psychology:
Exponential Random Graph Modeling (ERGM).
Exponential Random Graph Modeling
ERGM tests how particular factors impact the formation of relational phenomena, or
“ties,” between individuals in groups. It is unique in its ability to simultaneously examine the
effect of 1) individual differences (e.g. personality attributes), 2) other dyadic relationships in the
3
group (e.g. friendship), and 3) the natural patterning of network relationships (e.g. the clustering
of leadership nominations) on the development of dyadic phenomena (e.g. leadership
emergence) over and above each other. In addition, ERGM can be used to test if similarity or
dissimilarity in characteristics of the dyad members predicts the formation of such dyadic
phenomena. Thus, in studying leadership emergence, ERGM is capable of simultaneously
measuring the unique role of each dyad member, the other group members, their preexisting and
current relationships, and the social context in the formation of dyadic relationships, while
accounting for the natural, endogenous formation of relationships. Since numerous components
of the leadership process, not solely the leader, are tested together, ERGM grants one the
capability to better model and make statistical inferences of the process by which leaders and
followers emerge in a group (Kalish, 2013).
Current Study
The current study tests if particular individual attributes and peer-rated behaviors increase
or decrease the chances of one emerging as a leader or a follower, as well as if individuals tend
to perceive similar or dissimilar others as leaders, all while controlling for the interdependence of
nested relationships. Specifically, I examine the role of 1) intelligence, 2) self-monitoring, 3)
self-efficacy, 4) dominance, 5) individual perceptions of leader behavior, and 6) dyadic trait
similarity and dissimilarity in predicting leadership emergence while controlling for the natural
structural patterns of group ties. Although previous studies have independently found
relationships between the aforementioned variables and leadership emergence (e.g. Foti &
Hauenstein, 2007; Judge, Piccolo & Kosalka, 2009; Judge, Colbert & Ilies, 2004; Smith & Foti,
1998; Zaccaro, Foti, Kenny, 1991) no study to date has simultaneously tested how each of them
contributes to the leadership emergence process over and above all the others, mainly because
4
there has been no statistical method before ERGM capable of such modeling. Thus, the present
study contributes to the extant literature in two main ways: 1) it is the first to determine the
probability that each of the above-listed characteristics lead to the emergence of leadership in a
particular leadership network given all of the included factors in the process, and 2) it is one of
the very first studies to apply ERGM to the study of leadership emergence, allowing for
statistical inferences to be made about the underlying forces driving the formation of leadership
relationships within a network. Together, these two contributions represent a move in the right
direction toward more accurately and completely studying leadership as a process.
5
2.0- Literature review
2.1- Leadership Emergence
Kaiser, Hogan and Craig (2008) define leadership emergence as “standing out in the
crowd” (p. 98), which captures one of the key elements of the construct: the group in its entirety.
In order for one to stand out in a group, the others in the group must first recognize that an
individual exerts influence, or has the capacity to do so (Kaiser et al., 2008; Tagar, Hacket &
Saha, 1999). This recognition is, in essence, a perception of one individual by another within a
larger social context (i.e. group, team, organization, etc.). Thus, the perception of one as a leader
is, in and of itself, a dyadic construct, yet the process of leadership emergence may span multiple
levels, such as individual personality traits, dyadic relationships, situational context or
endogenous social patterning (Wang, Zhou & Lui, 2014).
Historically, leadership emergence has been assessed through peer evaluations of
leadership in groups with no formal leader. In such cases, participants are placed in groups,
required to complete an activity (e.g., task or a group discussion) and subsequently assessed on
leadership (e.g. Albright, Kenny, and Malloy, 1988; Lord et al., 1986; Taggar et al., 1999).
Examples of such assessment of leadership potential include peer nominations of one or more
leaders, peer or observer ratings of leadership behaviors, or individual participation rate in
activity (Kaiser et al., 2008). Typically, personal characteristics or behaviors are measured to
determine which individual constructs predict who emerges as a leader (Day, 2014). Analysis of
these studies is typically approached from one of three different viewpoints: leader-centered,
approach, the follower-centered approach or the dyadic-level approach (Day, 2014), the first of
which dominates leadership emergence literature. From the perspective of the leader-centered
approach, leadership exists in the individual who exerts influence (i.e., the leader). Although this
6
approach acknowledges the existence of followers in leadership (Uhl-Bien et al, 2014), it is the
individual differences and behaviors of the leader that are predictive of emergence. The
follower-centered perspective, however, focuses the perceiver’s contribution to the construction
of leadership (Uhl-Bien et al, 2014). For example, within the realm of leadership emergence, the
followership approach might examine how individual differences in perceivers’ perceptions
impact the process of leadership. The third approach to leadership, the dyadic, or relational
approach, emphasizes the relationship between the leader and follower in the process. It is most
commonly used to study Leader-Member Exchange (LMX) and the outcomes that result from
particular leader-follower relationships (Day, 2014). The LMX literature is relatively unique in
that research often examines the dyadic similarity and dissimilarity between a leader and
follower. This is an important contributor to the process of leadership emergence but can only
be analyzed using a dyadic approach. Although leadership emergence is inherently a relational
phenomenon (Uhl-Bien, 2006), it is rarely studied from a dyadic point of view; it is most
commonly assessed using individual level analyses, or non-dyadic multilevel analyses (a term
borrowed from Krasikova & Lebreton, 2012).
There have, however, been attempts to conduct leadership emergence research at the
dyadic level using the Social Relations Model (SRM; e.g., Foti & Hauenstein, 2007; Kenny,
1988; Kenny, Mohr, & Levesque, 2001, Zaccaro et al., 1991). For example, the round robin
rotation design, in which individuals rotate groups so that each person works with every other
person once, allows for the partitioning of variance at each level: rater/ratee, dyad, and higher
group levels (Kenny & Hallmark, 1992). SRM is particularly useful because it not only
operationalizes leadership emergence as a relational construct, but it also considers the
embedded nature of relationships: individuals are nested within dyads and dyads are nested
7
within groups. Thus, the SRM accounts for contextual, multilevel components of the leadership
emergence process while aligning the dyadic level of the measurement with that of the construct.
Social network analysis is another, relatively new way to study leadership that looks at
larger, more global patterns of social groups. In this way, individuals are conceptualized as
“nodes” within the network, and the dyadic relationships between individuals (i.e. leadership) are
conceptualized as “ties.” Social network analysis is able to examine phenomena that other types
of analyses, including the SRM, do not. This is the well-known tendency for the ties within
networks to cluster into a pattern of local structures (Robins, Pattison, Kalish, & Lusher, 2007).
Lusher & Robins describe these patterns as “endogenous effects” because they “arise solely from
the internal processes of the system of network ties” (2013, p. 23). That is, the force driving tie
formation is merely their embeddedness in each other. The relationships are interdependent in
that the formation of every tie is conditionally reliant on the existence of other ties within the
network. Thus, the combination of these local patterns can capture how lower-level relational
patterns give rise to higher-level patterns. There exists several different names for the
endogenous structural effects, but for the purpose of this study, they will be referred to as
“structural characteristics.”
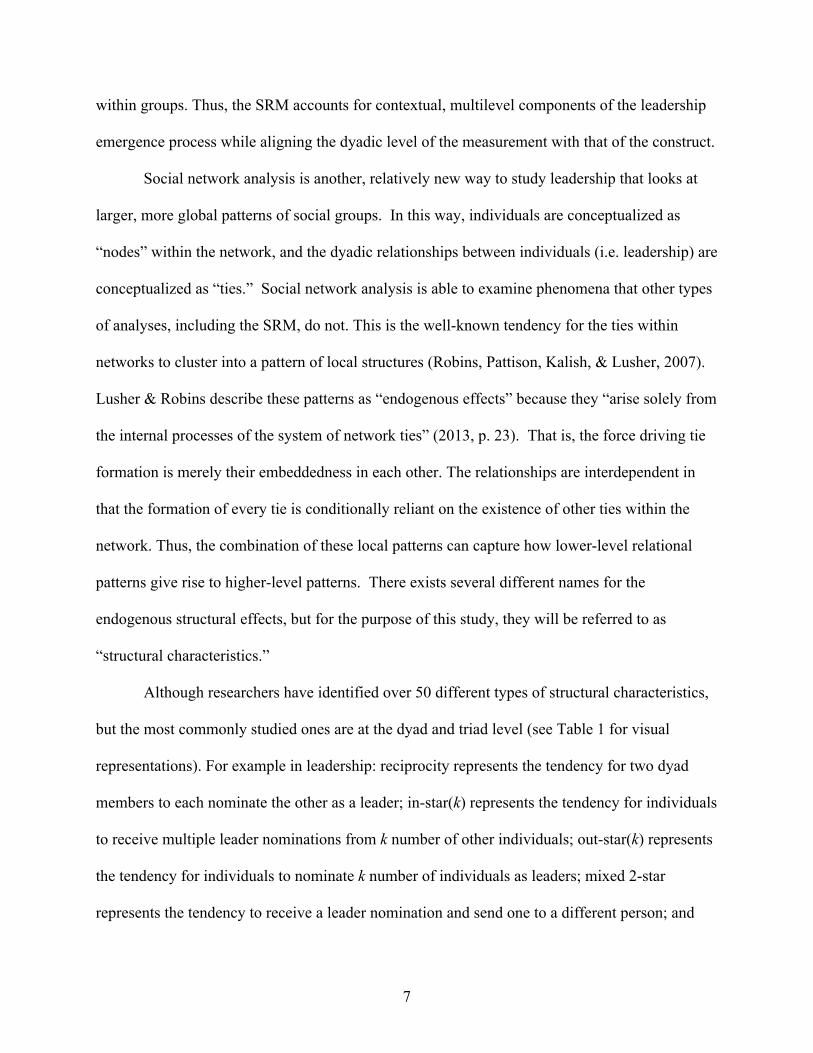
Although researchers have identified over 50 different types of structural characteristics,
but the most commonly studied ones are at the dyad and triad level (see Table 1 for visual
representations). For example in leadership: reciprocity represents the tendency for two dyad
members to each nominate the other as a leader; in-star(k) represents the tendency for individuals
to receive multiple leader nominations from k number of other individuals; out-star(k) represents
the tendency for individuals to nominate k number of individuals as leaders; mixed 2-star
represents the tendency to receive a leader nomination and send one to a different person; and
8
finally, transitivity represents the tendency for an individual to nominate as a leader a person
who was nominated by his/her selections (i.e. “leaders of my leaders are also my leaders”), or
hierarchical leadership (Slaughter, 2008).
It is important to note that these configurations are mere descriptions of topological
patterns in social structure and do not capture the underlying causes of the patterning. More
specifically, network reciprocity should be distinguished from the “Norm of Reciprocity”
prevalent in social psychology (Gouldner, 1960). The latter refers to “the act of giving benefits to
another in return for benefits received” (Molm, Schaefer & Collett, 2007, p. 200) and is
fundamentally based on positive (or negative) exchanges between dyads. Network reciprocity is
a more general concept that can be applied to many different relationship-based contexts. For
example, although reciprocity in helping behaviors might reflect the “Norm of Reciprocity,”
reciprocal relationships can be applied to relationship ties outside of this domain, such as in
communication, friendship, advice, information sharing, and in this case, leadership.
Social network analysis has shown that these structural characteristics, alone, are related
to leader emergence (Balkundi & Kilduff, 2006). That is, without considering individual
characteristics of the people, or nodes, in the network, there exists a correlation between
structural patterning of relationships in a group and leadership emergence. Although very useful
in its ability to model structural effects, social network analysis does not typically examine
causation. It is most commonly used to describe the structure and patterns of networks, not what
causes such formations. For example, researchers typically equate an individual’s centrality
(how many ties he/she has) in a network with leadership emergence and subsequently measure
the individual difference of those most central within the networks (Balkundi & Kilduff, 2006;
Bono & Anderson, 2005; Bartol & Zhang, 2007; Klien, Lim, Satz, Mayer, 2004; Mehra, Dixon,
9
Brass, & Robertson, 2006). Despite the descriptive nature of social network analysis, it is useful
in that it demonstrates that the structural dependencies of relationships in networks are a crucial
- and too often unaccounted for- factor in the leadership process.
In sum, all the above approaches have advanced the study of leadership emergence by
examining its relationship with particular characteristics of the individual (micro) and social
context (macro). However, each approach has its shortcomings in terms of modeling the process
of leadership emergence. Specifically, the leader-centric and follower-centric approaches are
lacking in that they attempt to study a dyadic level construct from an individual level
perspective. The typical dyadic approach, although it solves the misalignment issue, is lacking
in its inability to examine the influence of dyadic similarity/dissimilarity and other dyadic
relationships (e.g. friendship or communication tendencies) while also accounting for
endogenous structural characteristics/dependencies in leader or leadership emergence. Finally,
social network analysis is almost always descriptive, which prevents the ability to make
statistical inferences about the antecedents of leadership emergence. Thus, in order to properly
model the process of leadership emergence, there is a need for a method that can simultaneously
incorporate all of the approaches together to overcome each of their pitfalls. One relatively new
technique that holds promise for doing so is called Exponential Random Graph Modeling
(ERGM).
2.2 Exponential Random Graph Modeling
ERGM is a network modeling technique that (with regard to leadership) calculates the
probability that a leadership relationship, or tie, forms between two individuals, conditional on
the other leadership relationships and parameters included in the model. It offers several
advantages relative to other analysis techniques. First, since the unit of analysis is the leadership
10
relationship, ERGM is fundamentally dyadic, aligning analysis with theory. Second, by
operationalizing leaders as those who receive leadership nominations and followers as those who
send leadership nominations, this technique simultaneously examines the factors predictive of
the emergence of leaders and of followers. Furthermore, ERGM measures the effect of similarity
and/or dissimilarity of dyadic partners on the probability of tie formation. Other dyadic data
analysis techniques can examine both leader and follower effects (e.g. SRM; Kenny et al, 2001),
but they cannot measure the predictive power of similarity/dissimilarity on tie formation. Third,
preexisting dyadic relationships, as well as contextual variables are able to be included as
covariate predictors or controls in the model. Although each of the aforementioned predictors
can and have been previously studied, no other form of analysis has the ability to include them
parsimoniously in one model, thus more accurately capturing the components in the process.
Fourth, ERGM uses a statistical approach, as opposed to the more typical descriptive approach,
to networks. That is, instead of simply collecting summary measures of network patterns, ERGM
allows researchers to make statistical inferences as to how micro level processes (i.e. individual
attributes and dyadic relationships) result in macro level processes (i.e. leadership emergence).
Finally, ERGM accounts for dependence in leadership relationships, which reduces endogeneity
bias in relationship estimations and produces more accurate standard errors for the estimations.
Research has shown that the formation of dyadic relationships, such as leadership nominations,
is dependent on the presence or absence of other relationships in the network and, as a result,
form into patterns of local structures (Robins, Pattison, Kalish, & Lusher, 2007). When
examining the effect of individual differences, for example, on leadership emergence, such
dyadic dependences must be accounted for so as to not produce biased results. Analyses using
ERGM allow for this, which helps to produce more accurate parameter estimates and standard
11
errors of the effect of predictors on the formation of leadership ties because the effect an
endogenous variable (i.e. network characteristic) is removed (Antonakis et al. 2010). Antonakis
et al. (2010) believe endogeneity bias is one of the most pervasive yet ignored problems
currently plaguing I/O and management research because its presence may produce biased
results where the true estimation could “be higher, lower, or of a different sign than the actual
causal relation” (Antonakis, Bastardoz, Liu, Shriesheim, 2014). Since ERGM accounts for
omitted variables with the inclusion of controls for endogenous network effects, the endogeneity
bias for each of the included covariates is lowered, thus enabling better inferences to be made
from the estimates.
ERGM uses Markov Chain Monte Carlo sampling with Maximum Likelihood Estimation
to produce parameter estimates and standard errors for each of the predictors and controls in the
study. Parameter estimates reflect if a particular characteristic significantly increases or
decreases the chances that a leadership relationship is formed, while holding all other predictors
in the model constant. An estimate approximately two times the size of its standard error is
considered significant. Inferences can then be made as to whether that particular characteristic
underlies the leadership emergence process.
Since no dyadic method to date has been able to jointly study the unique predictive
ability of 1) individual differences between dyad members, 2) similarities and differences
between the dyad members, 3) other relationships between dyads members, and 4) structural
self-organization of dyadic relationships each contribute over and above each other, it is likely
that previous conclusions of their relationship to leadership emergence are overestimated. Thus,
the purpose of the present study is to reanalyze the each of these variables previously found to be
12
predictive of leadership emergence using ERGM, a method which presumably produces more
accurate and unbiased estimates.
2.3 Individual Differences in Leaders and Followers
Research has shown that individuals are naturally inclined to classify people as leaders
and/or followers (Epitropki, Sy, Martin, Tram, & Topekas, 2013), and they classify others based
on the degree to which the characteristics he/she perceives of the other person resemble those
included in his/her pre-existing cognitive schema of a leader or a follower. This schema is called
an implicit theory (Lord, Foti, & Philips, 1982; Sy, 2010) and is part of humans’ environmental
“sensemaking processes” that guide how we perceive and categorize others (Lord, 2005).
Implicit Leadership Theory (ILT; Phillips & Lord, 1981) and Implicit Followership Theory (IFT;
Sy, 2010) state that individuals have their own schematic representation of a leader and follower,
which they hold in memory. People then naturally categorize others as leaders or followers
based on the degree to which individual attributes others possess match those in their own leader
or follower prototype. ILT states that if the characteristics people perceive in others match those
in their implicit theory of a leader, then the perceiver will perceive the person(s) possessing such
characteristics as leaders, or leaderlike. IFT claims the same for perceptions of followers
(Shondrick & Lord, 2010). Identifying the perceived and perceivers’ attributes is important for
the emergence of leaders, as past research has consistently found relationships between the
personality traits and intelligence and leadership emergence (Lord et al., 2002; Lord et al., 2004).
2.4 Leader Attributes
Intelligence. High levels of intelligence and cognitive ability have consistently been
shown to be related to leadership and particularly leadership emergence, as demonstrated by two
meta-analyses examining the relationship between intelligence and leadership emergence. An
13
early meta-analysis by Lord, DeVader and Alliger (1986) found the correlation between
intelligence and leadership perceptions to be .52, after correcting for attenuation. More recently,
a Judge et al. (2004) meta-analysis also found significant correlations between leader emergence
and both perceived intelligence (r=.60, corrected) and paper and pencil intelligence (r= .19,
corrected). In addition, in a 13-week longitudinal study of 94 leaderless autonomous work
teams, Taggar, Hackett and Saha (1999), examined the relationship between individual
differences (i.e. g, or general intelligence, and the Big Five personality traits) in predicting peer
ratings of leadership. Results indicated not only that g was significantly correlated (r = .44,
corrected) with peer ratings of leadership, but also that when all six predictors were included in a
simultaneous regression with leadership perceptions, g “contributed most to explaining team
member leadership,” relative to all others in the model (B= .32). This finding is not surprising,
considering leadership emergence is fundamentally an individual’s perception, and intelligence
has shown to be a salient dimension of people’s implicit theory of leadership (Lord et al, 1986;
Epitropaki et al, 2013). Accordingly, I hypothesize:
Hypothesis 1: There is a positive relationship between intelligence and the emergence of
leaders.
Self-monitoring. Self-monitoring refers to the extent to which individuals ‘‘strategically
cultivate public appearances’’ (Gangestad & Snyder, 2000). High self-monitors tend to adjust
their behavior in accordance with what they believe is most socially appropriate in a given
situation, whereas low self-monitors tend to be more driven to reflect their true affective selves
in a given social situation (Day & Schleicher, 2006). Studies have shown there exists a positive
relationship between leadership emergence and self-monitoring (Day, Schleicher, Unkless &
Hiller, 2002; Dobins, Long, Dedrick, & Clemons, 1990). For example, Zaccaro et al. (1991)
14
found a significant correlation (r = .22) between high self-monitors and peer rankings of
leadership in a rotation design. Similarly, using a network perspective, Mehra, Kilduff & Brass
(2001) found that high self-monitors tend to occupy more central positions in social networks.
Thus, there is an evident relationship between self-monitoring and leadership emergence. This is
most likely because high self-monitors manage their impressions so that they match followers’
prototypes of leaders (Day & Schleicher, 2006). Therefore, I hypothesize:
Hypothesis 2: There is a positive relationship between self-monitoring and the emergence
of leaders.
Self-efficacy. Albert Bandura (1997) described self-efficacy as one’s own self-
conceptions as to his/her abilities to succeed in a task. As such, self-efficacy can be viewed as an
overall stable individual difference in cognition, akin to a trait, or as a domain-specific belief in
oneself (Chen, Gully & Eden, 2001). The former, or generalized/general self-efficacy, is defined
as “individuals’ perceptions of their ability to perform across a variety of situations” (Judge,
Erez, & Bono, 1998, p. 170). This construct captures one’s belief in his/her capabilities across
all situations and contexts. As such, it is highly related to other self-evaluative concepts, such as
self-esteem, locus of control, emotional stability (Judge et al, 1998), and self-confidence (Bass,
1990). Studies have shown there is a significant relationship between general self-efficacy and
work-related performance, as demonstrated in a meta-analysis by Stajkovic & Luthens (1998).
More specifically, within the leadership emergence domain, high levels of individual self-
confidence have been found to be related to peer ratings of leader emergence (Kolb, 1999).
Given self-efficacy’s resemblance to self-confidence, it is likely there is also a similar
relationship between leadership emergence and generalized self-efficacy.
15
The second conceptualization of self-efficacy is as situation or task-specific. In this way,
it is one’s judgment of his/her abilities pertaining to ability to succeed within specific domain.
(Chen et al, 2001). Leadership self-efficacy is a self-perception of leadership abilities (Chemers,
Watson, & May, 2000). Research has found an association between leadership self-efficacy and
leadership effectiveness (e.g. Ng, Ang, & Chan, 2008). With regard to leadership emergence, a
study by Chemers, Watson, and May (2000) examined the relationship between leader
emergence and performance in a group of military cadets and individual leadership self-efficacy.
Results showed leadership self-efficacy predicted ratings of cadet leadership potential by the
cadets’ instructors (B=.40) and peers (B=.54).
Thus, it seems that both general self-efficacy and leadership self-efficacy affect
leadership perceptions in groups. However, it has been theorized that general self-efficacy and
task-specific self-efficacy are correlated due to the “spill-over” effect of the former on the latter
(Chen et al, 2001). In this way, high general self-efficacy predicts task-specific self-efficacy
across situational domains. Accordingly, in an attempt to avoid redundancy, I make predictions
on general self-efficacy only:
Hypothesis 3 There is a positive relationship between self-efficacy and the emergence of
leaders.
Dominance. Another characteristic first found to be related to leadership over 50 years
ago is dominance (Mann, 1959). As measured by the California Psychological Inventory (CPI),
dominance reflects an individual’s “prosocial interpersonal dominance, strength of will and
perseverance in pursuit of goals” (Gough & Bradley, 2005, p. 6). It is also considered to be one
of the two main facets of the Big Five’s Extraversion dimension, which is argued to be the most
important predictor of leader emergence (Judge et al. 2002). Several meta-studies have found a
16
direct correlation between dominance and the emergence of leaders in groups (Judge et al. 2002;
Lord et al., 1986). For example, using SRM, Anderson and Kilduff (2009) showed that more
dominant individuals in a group scored higher on “influence in the group,” as rated by their peer
group members and by outside observers. Furthermore, they found this effect was partially
mediated by ratings of the individuals’ competence (i.e. ability to perform well on the task),
which remained after controlling for their actual competence. These findings suggest that over
and above people’s skills and abilities, it is their dominance that allows them to be perceived as
influential by others, which leads to my fourth hypothesis.
Hypothesis 4: There is a positive relationship between dominance and the emergence of
leaders.
2.5 Follower Attributes
Although examining individual differences in leaders is undoubtedly crucial for
understanding who emerges as a leader, arguably equally as important in leadership is
understanding the individual differences of followers. According to Shamir (2007), the
leadership process is as much influenced by the follower as the leader; thus, in order to best
understand leadership, just as much emphasis should be placed on understanding the follower as
the leader. Even though there has been increased attention to the study of followership in recent
years (Felfe & Shyns, 2010; Schyns & Felfe, 2006, Sy, 2010), much of the focus has been on
leader-follower outcomes (e.g. Howell & Shamir, 2005), behaviors (e.g. DeRue & Ashford,
2010), or role orientations (e.g. Carsten & Uhl-Bien, 2012). Few studies have examined which
individual attributes predict general tendencies to select one or more others as leaders. Studies
have shown that extraversion (Felfe and Schyns, 2010) and agreeableness (Schyns & Felfe,
2006) impact followers’ perception of transformational leadership. If there are specific attributes
17
predisposing one to perceive transformational leadership, it is likely there are also specific
attributes predisposing one to generally perceive others as leaders (i.e. to be followers).
Self-efficacy. Individuals scoring low on generalized self-efficacy, by definition, are
overall less confident in their abilities to complete tasks successfully. This notion was supported
in a study examining how Navy petty officers dealt with subordinate supervisory problems.
Results showed officers were significantly more likely to refer the subordinate to a superior and
not hold “diagnostic talks” with the subordinate if the officers possessed low levels of leadership
self-confidence than if they possessed high levels (Kipnis & Lane, 1962). These results suggest
individuals low on leadership self-confidence (or leadership self-efficacy) are likely to defer to
others within the group to take the leadership initiative, thereby selecting others as leaders.
Although this study examined leadership self-confidence, not generalized self-confidence,
leadership self-efficacy is related to generalized self-efficacy (Ng, et al., 2008), as discussed
above. Given this relationship and given the similarity between self-efficacy and self-confidence,
I predict the following:
Hypothesis 5: There is a negative relationship between generalized self-efficacy and the
emergence of followers.
Dominance. According to McAllister (1996), individuals with low levels of dominance
are “likely to be passive and nonassertive.” The follower role, as stated by Hoption, Christie, &
Barling (2012) “reflects passivity obedience, and submission,” which, fitting with McAllister’s
belief, reflects low levels of dominance (p. 222). This notion was further echoed by followers,
themselves, in a recent qualitative study examining how followers view the followership role
(Carsten, Uhl-Bien, West, Patera, & McGregor, 2010). Thus, based on general
conceptualizations of followers, it appears they are associated with low levels of dominance.
18
This association is possibly made more apparent when one defines followers as those
who are non-leaders (Hollander, 1974). Hoption et al. (2012) state, “an alternative to directly
labeling followers as passive and obedient is to make a distinction between followers and
leaders, thus implying that followers are what leaders are not” (p. 222). Given the extensive
findings discussed above that individuals who score high on dominance typically emerge as
leaders, and given followers can be conceptualized as those who are not leaders, it is logical that
those who are not dominant are also likely to be those who are not leaders (i.e. followers). This
was exemplified in an early study conducted by Edwin Megargee (1969), who showed that when
high-dominant males were paired with low-dominant males to complete a gender-neutral task,
the low-dominant males more frequently assumed the follower role than did the high-dominant
males. Hence:
Hypothesis 6: There is a negative relationship between dominance and the emergence of
followers.
2.6 Leader-Follower Similarity and Dissimilarity
The literature reviewed thus far has focused on how individual attributes influence the
propensity for one to emerge as a leader or a follower. However, since leadership perceptions
are fundamentally dyadic, it is also necessary to examine how dyadic similarity and dissimilarity
on individual attributes are potentially related to relational emergence. Although it is rare for
dyadic similarity and dissimilarity to appear in leadership emergence research, it is not
uncommon to see it present in the person-environment (P-E) fit literature. In studying
leadership, this field encompasses person-supervisor (P-S) fit, similar to leader-follower fit.
Within this domain, there exists a dichotomy in beliefs as to what leads to better relationships:
supplementary fit vs. complementary fit (Muchinsky & Monahan, 1987). The former is rooted
19
in the similarity-attraction hypothesis (Bryne, 1971), stating that a person fits with a particular
other because he/she possesses characteristics similar to the other person (Muchinsky &
Monahan, 1987). Research supporting this theory shows that pairing of similar leaders and
followers results in positive work-related outcomes (e.g. Deluga, 1998). On the other hand is the
complementary fit hypothesis, which states that dyadic P-S fit occurs because an individual
possesses the characteristics required for, or missing from, the other dyadic partner. The
complementary fit theory is based on the dominance-complementary theory, which claims
groups and dyads get along better when levels of dominance are balanced as opposed to
equivalent (Kiesler, 1983), which, in turn results in positive work-related outcomes. In a direct
test of these competing theories, Saltz (2004) examined whether leader follower similarity or
dissimilarity in extraversion, consciousness, and emotional stability of 778 dyads influenced
follower satisfaction with the leader and/or follower commitment to the organization. Results
indicated that neither leader-follower similarity nor dissimilarity affected either of the two
outcomes. Thus, it appears the verdict is still out as to whether supplementary or complementary
fit lead to better work-related outcomes.
There appears to be a similar lack of consensus in the roles of similarity and dissimilarity
in the process of leadership emergence. To the author’s knowledge, only two studies have
analyzed similarity and dissimilarity of leaders’ and followers’ personal attributes as predictive
leadership emergence, both of which use EGRM for analysis. The first is a study by Kalish
(2013), examining informal leadership in a group of military recruits using a network approach.
In addition to analyzing the social structure of the groups, the author tested whether recruits
tended to nominate as leaders others with intelligence levels, or g, that were similar or dissimilar
to their own (also known in the social network domain as homophily and heterophily,
20
respectively). Results revealed that neither dyadic similarity nor dissimilarity on g significantly
increased or decreased the probably of a leadership nomination. However, Emery, Calvard, and
Pierce (2013) did, in fact, find support for similarity and dissimilarity as predictive of leadership
emergence using a different set of personal attributes. In their longitudinal study of leaderless
groups, the authors assessed 1) whether individuals’ levels on the Big Five affected task-oriented
and relationship-oriented leader and follower emergence, and 2) whether participants tended to
follow others with similar or dissimilar levels of the Big Five. The researchers found support
that individual standing on specific components of the Big Five are predictive of task and
relationship leader and follower emergence in the group. In addition, they found dyadic
similarity on openness to experience and dyadic dissimilarity on agreeableness were predictive
of leadership nominations. That is, for both task and relationship nominations, individuals
tended to follow others similar to them in terms of openness to experience and dissimilar to them
in terms of agreeableness.
The variable pattern of findings in the Kalish (2013) and Emery et al (2013) studies
signifies that, similar to the P-S literature, there still remains no general consensus on whether
dyadic similarity or dissimilarity in personal attributes predicts informal leadership or
followership. It is possible, given the discrepancy in findings for different individual
characteristics, the similarity and dissimilarity effect vary by attribute and/or by context. The
present study attempts to shed more light on the similarity/dissimilarity debate by analyzing two
attributes not examined in either of the studies just reviewed: dominance and self-monitoring.
Dominance. As previously discussed, there is significant evidence to suggest people high
on dominance emerge as leaders. Yet most of this research has not also considered whether the
dominance levels of the followers had any effect on the nomination of leaders. It is possible that
21
not all people favor dominant others (as leaders). Dominance Complementary Theory (Kiesler,
1983) certainly suggests they do not. A study of 42 female students by Dryer and Harowitz
(1997) also supports the Dominance Complementary Theory. In this study, individuals were
first measured on dominance and then instructed to complete a task with a confederate partner,
whose dominance level was manipulated by the experimenter. Upon completion of the task,
participants were asked to rate their satisfaction with the interaction. Results showed dominant
individuals interacting with non-dominant confederates and non-dominant participants
interacting with dominant confederates reported significantly higher satisfaction with the
interaction than did homogenous dyads. A similar pattern is found at the group level with
extraversion, of which dominance is a core facet. In a study of 64 teams, individuals reported
higher attraction to their team when the average level of team extraversion was dissimilar to their
own (Kristof-Brown, Barrick & Steven, 2005). This is aligned with Barrick, Stewart, Neubert,
and Mount’s (1998) finding that within group variance in extraversion was positively correlated
with group cohesion.
A similar phenomenon is also seen with regard to employee leadership. For example,
Grant, Gino and Hofman (2011) showed that pizza store teams perform better if the team leader
was high on extraversion and the team was passive and when the team leader was low on
extraversion and the team was proactive than in high-proactive and low-passive groups.
Similarly, in a study including 96 supervisor-subordinate dyads within an assisted-living
healthcare organization, Glomb and Welsh (2005) examined the relationship between supervisor
and subordinate control, as measured by the CPI dominance scale, and work-related outcomes.
Results revealed subordinates were more satisfied with their supervisor when the supervisors and
subordinates were heterogeneous in their levels of dominance. Specifically, subordinates were
22
most content when their supervisor’s level of control was significantly higher than their own.
Research stemming from the followership research suggests the opposite pattern also holds.
Kelley (1988) proposed four different types of followers, one of which is referred to as the
“exemplary” or “star” follower. These types of followers tend to “exercise control and
independence and to work without close supervision” (Kelley, 1988, p. 144). They are they not
afraid to challenge their leaders and provide suggestions, criticism or advice (Kelley, 1992).
These qualities, along with their commitment and focused determination, resemble those of
highly dominant people (Gough & Bradley, 2005). Research by Foti & Coyle (2015) revealed
that exemplary followers most frequently held an ILT pattern of a “prototypical” leader, or a
leader who was sensitive and dedicated and non-tyrannical (i.e. “not domineering,” “pushy” or
“manipulative”). Since ILT states individuals will select as leaders those who match their own
implicit leadership schema, Foti & Coyle’s work would suggest individuals high on dominance
would nominate others low on dominance as leaders. This is consistent with theory by Bjugstad,
Thach, Thompson, and Morris (2006), maintaining that exemplary followers fit best with
“delegating” leaders (Hersey & Blancard, 1982), characterized by the tendency to grant decision-
making and implementation responsibilities to the follower.
Parker and Wu (2013) propose this dissimilarity effect occurs because
“complementarity of dominance avoids confusion and chaos” (p. 396). Considering individuals
are attracted to, hold schemas of, are satisfied with, and perform better with others, including
leaders, that are dissimilar from them on levels of dominance, it is likely they will also nominate
as leaders those dissimilar to them in dominance. Thus I predict:
Hypothesis 7: Dissimilar levels of dominance will be related to the emergence of leaders.

23
Self-monitoring. In contrast to dominance, there is reason to believe the similarity
hypothesis holds when it comes to self-monitoring. Although there is very little empirical
research examining the match in self-monitoring between people, it makes logical sense that
people prefer others with similar levels of self-monitoring. In a theoretical article, Day and
Kilduff (2003) examine the potential effects of high and low self-monitors building relationships
with other high or low self-monitors. The authors argue that since high self-monitors tend to
occupy advantageous positions in social networks (Mehra et al, 2001) and tend to be driven
toward elevating their own social rank, they will likely seek other high self-monitors in order to
climb the social ladder. Low self-monitors, on the other hand, tend to show their true selves and
are motivated to build relationships based on trust and honestly, as opposed to social rank. As
such, according to Day and Kilduff, low self-monitors are likely to seek others who also appear
to be genuine and sincere.
In circumstances where a high self-monitor is paired with a low self-monitor, there are
advantages in that both parties can gain and learn from the other, but there is also a high risk of
the formation of negative affective judgments toward the other. “A risk of high self-monitors is
that they will come across as disingenuous because of potential inconsistencies in their opinions
and behavior,” whereas “low-self monitors may appear dogmatic and inflexible to high-self
monitors” (Day & Kilduff, 2003, p. 220). Accordingly, it is probable that low self-monitors find
high self-monitors untrustworthy and high self-monitors will find low self-monitors unlikeable
(Day & Schleicher, 2006). Given likeability and trustworthiness are found to be important
factors in making work-related leadership decisions (Hogan et al. 1994), it is unlikely high self-
monitors will select low-self monitors as leaders and visa-versa. As a result:
24
Hypothesis 8: Similar levels of self-monitoring will be related to the emergence of
leaders.
2.7 Leader Behavior
The research discussed up to this point has focused on the particular attributes that
leaders and followers possess as predictive of emergence of the dyadic leader-follower
relationship. The behavioral approach to leadership, however, focuses less on what leaders have
and more on what leaders do that sets them apart from followers (Day, 2012). In addition to
attributes, there has been extensive research focusing on the role of behavior in leadership
(Burke et al, 2006), yet there has been less research incorporating the two approaches. In their
meta-analysis, Judge, Piccolo, and Ilies (2004) advocated for the need for leadership researchers
to better integrate the myriad leadership theories both within and across the trait and behavioral
leadership theories. Similarly, DeRue, Nahrgang, Wellman & Humphery (2011) state there is a
need to better understand, “how leader traits and behaviors complement or supplement each
other, and how they can be incorporated into a more integrative model of leadership
effectiveness” (p.11). Accordingly, in this study, we attempt to examine not only the effects of
individual attributes on leadership emergence, but also perceptions of leadership behaviors on
leadership emergence, each while controlling for the other. This allows for the measurement of
how attributes and behaviors uniquely contribute to the leadership process, thus enabling a better
understanding of the attribute-behavior interplay.
Beginning with the early Ohio State University (Stogdill, 1950) and the University of
Michigan leadership behavior studies (Bowers & Seashore, 1966), researchers have attempted to
develop taxonomies of leadership behaviors. The result of this research has led to the
uncovering of two general factors of leadership behaviors: those that focus on the task (i.e.
25
“initiating structure” and “task-oriented”) and those that focus on people (i.e. “consideration”
and “relationship-oriented”) (Halpin & Winer, 1957; Stogdill, 1950), which have attracted much
research attention (Judge et al., 2004). Examples of task behaviors are organizing, planning
short-range activities, clarifying roles and expectations, and developing means to reach goals.
People behaviors are actions related to supporting, encouraging, uniting and inspiring other
group members though personal relationship-building (Yukl, 2002).
Using meta-analysis Judge et al. (2004) demonstrated the importance of these two
behavioral factors in leadership outcomes. Specifically, task-related and person-related
behaviors were significantly correlated with follower job satisfaction (r = .19; r = .40,
respectively), follower satisfaction with the leader (r = .27; r= .68, respectively), leader job
performance (r = .24; r = .25, respectively), leader effectiveness (r = .28; r =.39, respectively)
and team performance (r = .23, r = .23, respectively). Thus, leadership behaviors are an
important component of the leadership process, yet most behavioral leadership research has
tended to examine the effect of leader behaviors on work-related outcomes and “to focus
primarily on formal team leadership structures (i.e., hierarchical, formally appointed leaders),”
(Morgeson, Derue, Karam, 2010, p. 6), as opposed to informal, emergent leadership.
Consequently, there is a lack of research examining which leadership behaviors are important for
the emergence of leadership and in which circumstances.
Research has shown that the appropriateness of different types of leadership behaviors
are contingent on the type of situation, and that leaders display behaviors that are most functional
in a particular situation (Zaccaro et al., 1991). Accordingly, the same pattern should also hold
for the emergence of leadership, such that some leadership behaviors will result in the perception
of leadership in particular situations, while not in others. A study by Marta, Leritz, and
26
Mumford (2005) showed support for this by examining the role of behaviors in leader emergence
across 55 teams instructed to solve business problems of varying complexity. Results indicated
that for the more complex problems requiring planning and structure, individuals who exercised
task-oriented behaviors over consideration-oriented behaviors emerged as leaders. These
findings suggest individuals who display task-oriented behaviors in situations in need of
planning and structure are likely to be perceived as leaders over those exhibiting relationship or
people-oriented behaviors.
Morgeson et al. (2010) also reflected this idea in their analysis of team leadership
functions, or behaviors. They first identified four potential sources of leadership in teams:
internal (leadership originating from within the team) and external (leadership originating from
outside of the team), and formal (leadership from one with a designated leader role) and informal
(leadership from one without a designated leadership role). In this way, emergent leadership is
conceptualized as informal, internal leadership. Using a set of 15 different leadership functional
behaviors, the authors then analyze the degree to which each of the four sources of leadership
(informal-internal, informal-external, formal-internal, and formal-external) were best suited to
perform each function. Their findings indicated that emergent leaders, or informal-internal
leaders, are “best” positioned to “structure and plan,” “perform team task,” “solve problems,”
“provide feedback,” and “support social climate.” They are “better” positioned to “define
mission,” “establish expectations/goals,” and “monitor team.” In contrast, emergent leaders are
not as well positioned to “encourage team self-management,” participate in “sensemaking,”
“train and develop team,” “manage team boundaries,” “provide resources,” and “challenge
team.” Taken together, the “best” and “better” behaviors are generally task-related behaviors,
whereas the remaining behaviors include more personal-related behaviors (p. 10).
27
Since in the current proposed study, teams’ objectives are to complete the tasks assigned
to the best of their ability in the little amount of time specified, requiring both planning and
structure, and since the source of leadership is informal-internal, I make the following prediction:
Hypothesis 9: There is a positive relationship between perceived task-oriented leadership
behavior and the emergence of leaders.
3.0 Method
3.1 Data Source
Data for this study was acquired from an archival data set from a previous study
conducted on behalf of the Army Research Institute (Foti & Hauenstein, 2007). By comparing
variable-oriented and pattern-oriented approaches, Foti and Hauentsein (2007) examined the
relationships between (patterns of) intelligence, self-efficacy, self-monitoring, and dominance
and the outcomes of leadership emergence and effectiveness. The authors implemented a rotation
design, in which participants alternate groups so that each member works with every other
person only once, thus allowing for the assumption of independence of observations to be met.
Analysis was conducted using Kenny’s (1988) social relations model, partitioning variance
between the actor, the partner, and the relationship. The present study adds to Foti and
Hauenstein’s work in the following ways: the current study 1) examines attributes characteristic
of those who tend to nominate others, or followers in addition to leaders; 2) test the role of
similarity/dissimilarity of dyadic partners’ attributes as predictors; 3) includes peers’ perceptions
of leader behavior as predictors; 4) implements a procedure that accounts for the
interdependence of embedded relationships; and 5) applies inherently multi-level network
analysis to study the combination of micro-level components of a macro-level process.
28
3.2 Participant Sample and Design
The participants in the study were 99 male first-year undergraduate students, who were
members of the Virginia Tech Corps of Cadets (the Corps). The Corps is a structured university
military organization, open to all students on campus. The use of freshman cadets was necessary
so as to avoid biases resulting from established perceptions of leadership in peers. In exchange
for their participation in the study cadets were each compensated $20. Design of the this study
was a rotation design: nine subjects rotated through four leadership tasks in groups of three, with
the other two in the group being those with whom he had not previously worked. Thus, each
person in the group worked with every other person once, yielding eleven groups of nine
individuals. Since ERGM is a dyadic analysis that examines the relationships, or ties, between
individuals, sample size is best represented as number of ties within the network of participants.
Within each group of nine, there are 72 (9 X 8) ties, which yield a total of 792 possible ties
across all eleven groups.
3.3 Tasks
It is generally believed that the situation is an important component in the leadership
process (Day, 2014). Accordingly, participants rotated though four different tasks, two initiating
structure exercises and two consensus/team building exercises. The intention of this strategy was
to prevent cadets from participating in the same task twice. The initiating structure exercises
consisted of a tower-building task and a manufacturing game, and the consensus/team building
exercises consisted of a student college admissions task and the “Lost on the Moon” task.
Initiating structure tasks: The initiating structure exercise was a manufacture game,
which resembled one used by Zaccaro, Foti, and Kenny (1991). Teams purchased resources to
assemble a toy and subsequently sold it back to a research assistant, or “buyer,” for the largest

29
profit possible. The entire task took approximately 45 minutes and consisted of two planning
phases and two assembly phases.
The second type of initiating structure task was the tower building exercise (adapted from
Hughes, Ginnett, & Curphy, 1993). The goal of this exercise was for teams to build the highest
possible tower of tinker toys with only one piece touching the table. Similar to the manufacture
game, the exercise consisted of planning and assembly stages. Twenty minutes were awarded
for planning the assembly, and 40 seconds were allotted for the building phase.
Consensus/Team-building tasks: Consensus/team-building tasks focused on facilitating
teamwork and group agreement. In the first task, cadets acted as a business school admission
committee. They were provided with 8 student application profiles, consisting of demographic
information, high school GPA, test scores, work experience, and other personal information.
Initially participants were allotted 10 minutes to individually examine the applications and rank
order the applicants. Afterwards, groups were given 25 minutes to collectively discuss the
applicants and to reach an agreement on the rank ordering of all the applicants.
In the second consensus-building task was the “Lost on the Moon” task. Cadets were told
to pretend their spacecraft crashed on the moon and they had to travel to the other side of the
moon in order to reach their mother ship. Only 15 items survived the accident, and each cadet
was to rank order all items in terms of importance of taking with them on the trek. Similar to the
other two team-building tasks, they each had 10 minutes to rank-order the items individually and
25 minutes to collectively decide upon a rank-ordered list.
3.4 Measures
Intelligence. Cadets’ scores on the verbal and quantitative portions of the Scholastic
Achievement Test (SAT), acquired from college applications, were used to measure intelligence.
30
This operationalization is consistent with measures of cognitive ability used in other
psychological research studies (e.g. Bell & Kozlowski, 2008; DeShon, Kozlowski, Schmidt,
Milder, Wiechmann, 2004). In addition, Frey & Detterman (2004) demonstrated there was a
significantly high correlation between SAT and general intelligence, as measured by the Armed
Services Vocational Aptitude Battery (ASVAB, r=.82, corrected).
Self-monitoring. The Lennox and Wolfe (1984) self-monitoring scale measured
participants’ self-monitoring. This is a 13-item scale widely used in psychological research and
found to be a reliable measure of self-monitoring (α= .83; Foti & Hauenstein, 2007). The scale
contains seven items measuring “ability to modify self-expression,” such as “I have the ability to
control the way I come across to people, depending on the impression I wish to give them,” and
six items measuring “sensitivity to expressive behavior of others,” such as, “I am often able to
read people's true emotions correctly through their eyes.” The response scale for this measure
ranges from 1 (certainly, always false) to 6 (certainly, always true).
Generalized Self-efficacy. General self-efficacy was measured using the 17-item
Generalized Self-Efficacy Scale (Sherer, Maddux, Mercadante, Prentice-Dunn, Jacobs. &
Rogers, 1982), which is found to be reliable (α= .85; Foti & Hauenstein, 2007). The measure
includes questions related to one’s general self-perceptions of ability, such as “I feel insecure
about my ability to do things,” with possible responses on a 5 point scale, ranging from strongly
disagree to strongly agree.
Dominance. The dominance subscale of the California Psychological Inventory (CPI,
Gough, 1990), which measures “pro-social interpersonal dominance, strength of will, and
perseverance in pursuit of goals” (Gough & Bradley, 2005, p.6) assessed participants’ levels of
dominance. It is a reliable measure (α= .88; Foti & Hauenstein, 2007) that includes 46 true/false
31
items such as, “I like to give orders and get things moving” or “Taking charge comes easy to
me.”
Perceptions of Leadership Behaviors. Following each task, cadets evaluated every
other peer in the group on 12 behavioral items, similar to those used by Gatewood, Thorton, and
Hennesy (1990), which included three dimensions: 1. two items clarifying the situation; 2. five
items developing ideas and 3. five items influencing action. Participants were asked to rate on a
five-point scale, ranging from always to never the frequently that each other group member
exhibited each behavior. Examples of items were, “Attempted to influence other group
members,” and, “Described alternative courses of action.” The scale is included in Appendix A.
Leadership Emergence. Also upon completing all the tasks, each group member
assessed every other group member on leadership using the five-item General Leadership
Impression scale (GLI, Lord, Foti & DeVader, 1984), which has been found to be highly reliable
(α=.93; Foti & Hauenstein, 2007). This assessment measures the degree to which others
manifest leadership with a 5-point response scale ranging from nothing to extreme amount. An
example question is, “How much leadership did this member exhibit?” Since ERGM requires
that the dependent variable be dichotomous, the responses from this scale was dichotomized
based on the distribution of response scores. The GLI scale used in this study is included in
Appendix B.
3.5 Procedure
In the fall semester of their first year, cadets were recruited for participation in the study
from the Corps’ rosters and assigned to groups of nine. Individuals from different divisions of
the Corps, or “companies,” were grouped together in order to reduce the likelihood of previous
relational perceptions of leadership. Upon arriving at the laboratory, cadets filled out informed
32
consent forms and completed the self-monitoring, self-efficacy, and dominance assessments. In
groups of three, participants completed each task, rated behaviors of leadership and perceptions
of each other group member before rotating on to the next task. Groups were designed so that no
individual worked with any other group member more than once throughout the process. Once
the entire rotation procedure was finished, participants were debriefed and dismissed. Although
in the initial study, this entire procedure was repeated several weeks later, relevant data for this
analysis came only from the initial rotation set. After completion of the study, cadets were paid
for their participation.
3.6 Data Analysis
In this study, data analysis was conducted using Exponential Random Graph Modeling.
This approach regards the entire set of collected data as a network of dyadic leadership
perceptions (“observed network”), each represented by a “tie” between “actors,” or individuals in
the network. Since ERGM assumes that the pattern of leadership ties existing in the observed
network results from a set of underlying stochastic, social forces (Robins et al, 2007), the goal
using this technique was to uncover those forces driving the pattern of leadership perceptions in
the observed network. As such, ERGM tests and models the factors leading to the emergence of
leadership as a relational phenomenon. In addition, further justification of using ERGM lies in its
unique comprehensive ability to simultaneously examine and account for the role of endogenous
network characteristics, other dyadic relationships, and individual actor attributes in the
formation of patterns of leadership ties, thus producing more precise standard error estimates
than traditional regression analyses (Lusher & Robins, 2013).
ERGM works by simulating network data and using Markov Chain Monte Carlo
simulation with Maximum Likelihood Estimation to examine the probability that the observed

33
network came from a distribution of networks with a specified set of parameters. Once the model
converges, the result is as set of parameter estimates and standard errors for each of the
predictors in the study. Significant parameter estimates indicate the particular characteristic
underlies the leadership emergence process, and positive parameter estimates indicate that the
existence of the effect increases the likelihood that a leadership tie is formed, holding all other
predictors in the model constant, while negative parameter estimates indicate that the existence
of the effect decreases the likelihood that a leadership tie is formed, holding all other predictors
in the model constant (Robins et al., 2007).
Data analysis consisted of examining two different models. Model 1 consisted of only the
structural characteristics, or controls, included in Table 2: reciprocity, out-star, in-star, and two-
path, which were discussed above, and arc. Arc, represents the estimate for the total number of
leadership nominations in the network, or the density. It is a normalizing parameter, similar to
the intercept in a logistic regression. Initial proposed analyses also included transitivity;
however, inclusion of this parameter prevented model convergence, so it was ultimately
excluded from both models.
Included in Model 2 were the substantive tests of predictions, comprised of the individual
and dyadic covariates (see Table 2) as well as structural controls from Model 1 and an additional
control for task type. As discussed above, participants performed two different types of
exercises (initiating structure and team-building). Given the research indicating leadership
emergence varies by the situation (Day, 2014), it is important to control for differences due to
such situational variables. Individual covariate effects reflect whether or not the individual
attributes measured increased the likelihood that a leadership tie was formed. This study
examined three different types of individual covariate effects: receiver (of the leadership
34
nomination), sender (of the leadership nomination), and sender-receiver similarity/dissimilarity
(or homophily/heterophily) effects. Receiver effects reflected whether scoring high a particular
attribute significantly increased or decreased the chance of receiving a leadership nomination.
High scores on intelligence, self-monitoring, generalized self-efficacy, and dominance were all
predicted to increase the likelihood that one would be nominated as a leader, and by default, low
scores on them were predicted to reduce the likelihood that one would be nominated as a leader.
This positive relationship is represented by a positive and significant parameter estimate for
receiver effects. Sender effects, on the other hand reflected whether scoring high a particular
attribute significantly increased or decreased the chance of sending a leadership nomination.
High scores on generalized self-efficacy and dominance were predicted to decrease the
likelihood that one would nominate others as leaders, and by defaults, low scores on them were
predicted to increase the likelihood that one would nominate others as leaders. This negative
relationship is represented by a negative and significant parameter estimate for sender effect.
Similarity effects measure whether similar attribute levels between dyad members increase the
chances of a leadership tie formation. Self-monitoring was expected to result in a positive
similarity effect (or a homophily effect), and dominance was expected to result in a negative
similarity effect (or a heterophily /positive dissimilarity effect). Finally, dyadic covariates test if
the presence of a separate dyadic relationship explain the formation if a leadership tie (Lusher &
Robins, 2013). In this study, this dyadic relationship was the perception of task-oriented
leadership behavior. It was proposed that the presence of a perception of task-oriented
leadership behaviors between two individuals would result in a positive effect, or an increase in
leadership tie formation.

35
4.0 Results
4.1 Data Structure
In order to conduct analyses using EGRM, data was coded and organized into five
different data files. The first file was the attribute file, where rows represented the 99 participants
and the columns reflected each of the participants’ scores on the four individual attributes:
overall SAT (sum of verbal and quantitative scores), dominance, self-efficacy, and self-
monitoring. The original data file included 10 missing data cases for SAT; seven missing data
cases for self-monitoring; and seven missing data cases for dominance. Since the analyses failed
to run when the attribute file with the missing data was included, all missing data cases were
replaced with the average value for each attribute.
The second file was leadership emergence criterion data, measured using the GLI scale,
which produces scores ranging from 5 to 25. Since the output data using ERGM must be binary
(Cranmer & Desmarais, 2010), this data was dichotomized such that “0” represented a “non-
leader” and “1” represented a “leader.” In order to determine how to dichotomize the data,
analysis of normality were conducted (Table 3 and Figure 1). Results indicated that GLI data
was normally distributed (mean = 17.96; median = 18.0; range = 5-25), justifying a mean split at
17.5. Thus, GLI leadership ratings of 17 or below were coded as “0”, and those of 18 or above
were coded as “1”. The resulting data file was a 99 X 99 adjacency “mega-matrix,” where the 99
rows and column represent the 99 participants. Along the diagonal of this matrix were 11 9X9
“mini-matrices” representing leadership nominations for all nine teams. Each cell represented
whether (“1”) or not (“0”) person A perceived person B as a leader. All remaining cells were
filled with a “0.” Figure 2 represents an abridged version of the mega-matrix leadership file,
representing the first two teams and 18 participants.
36
The third file was the task file, which exactly resembled the criterion mega-matrix,
except that each cell in the diagonal blocks represented the type of task performed by each pair
of partners. A “1” was placed in the cell if the pair of individual performed one of the two
initiating structure tasks and a “0” was placed in the cell if the pair performed one of the
consensus/team-building tasks. Figure 3 represents an abridged version of the task matrix file,
representing the first two teams and 18 participants.
The fourth file, the behavior file, was also in a matrix format similar to the task and
leadership files. However, since ERGM can handle continuous data for the predictors, each cell
on the diagonal blocks represented the sociometric perceptions of leadership behavior scores for
each directed dyad. That is, the numbers represented the amount of leadership behaviors person
A perceived from person B. The archived behavioral data in the current study was aggregated,
so that perceived task-oriented behaviors could not be separated from perceived relationship-
oriented behaviors. Thus, though hypothesis 9 proposed task-oriented behaviors would be
predictive of leadership emergence, the specific type of behavior was not able to be tested in this
study. Thus, I studied only the role of all overall perceived behaviors in the leadership
emergence process. Figure 4 represents an abridged version of the behavior matrix file,
representing the first two teams and 18 participants.
Finally, the fifth file was the structural zero matrix. This matrix was also a 99 X 99
matrix, but each of the 9 X 9 diagonal blocks consisted complexly of “0”s, and all other cells
consisted of “1”s. Including this file in the model affixed “0” to the 11 diagonal blocks in the
criterion mega-matrix, essentially instructing the model to only consider the relationships affixed
with 0’s and ignore all the others in the non-diagonal (Kalish & Luria, 2013). Figure 5
37
represents an abridged version of the structural zero matrix file, representing the first two teams
and 18 participants.
In accordance with the proposed analysis, ERGM was used to examine the probability of
leadership and followership emergence. Using the ERGM package in the statistical program, R,
two final models were run. The first attempted model included the structural characteristics of
arc, in-star, out-star, two-path and transitivity, in addition to the structural zero matrix. This
model, however, failed to converge due to the inclusion of transitivity. Thus, the final first model
included all structural controls aside from transitivity. The second model also included the same
structural controls, as well as remaining controls, covariates, and similarity effects listed in Table
2.
4.2 Descriptive Statistics
Included in Table 4 are the means, standard deviations, and correlation statistics of the
four individual covariates. As indicated by these results, self-monitoring, self-efficacy, and
dominance are all correlated at a level greater than 0.40. Table 5 includes the correlation
statistics for GLI, both raw and dichotomized, and leader behaviors. All intercorrelations were
relatively high, with the correlation between the raw and dichotomized GLI being the highest (r
= .82).
4.3 Effects of Structural Characteristics
Model 1 included only the effects of the structural characteristics. The model converged
after five iterations using a MCMC sample size of 70,000, a burn-in of 2,000, and interval size of
50. As Table 6 shows, there was a significant effect for “arc” (parameter = -0.978, SE = 0.423, p
< 0.05) and a significant effect for “out-star” (parameter = 0.220, SE = 0.055, p < 0.01). The
negative arc parameter indicates that when considering the other structural characteristics,
38
leadership nominations are less than would be expected in a randomly selected network with the
same number of people. The positive out-star parameter signifies that in this network, there is a
general tendency for individuals to send leadership nominations to multiple others. Arc and out-
star parameters describe the patterning in the network, and the predictors included in the models
were hypothesized to underlie the patterns observed.
4.4 Hypothesis testing
Included in Model 2 were all the structural characteristics included in Model 1 with an
additional control for tasks, the individual attributes, and the dyadic covariates of peers’
perceptions of leadership behavior. Including all elements in this model at once allows for test of
the relative effect of each of the hypothesized predictors over and above each other while
simultaneously controlling for endogenous network effects through the inclusion of Model 1’s
structural characteristics. Table 6 includes Model 1 and Model 2 estimates for all the parameters,
along with corresponding standard errors and significance. Similar to the results from Model 1,
Model 2 included a significant effect for arc (parameter = -2.713, SE = 0.002, p < 0.01) and out-
star (parameter = 0.205, SE = 0.054, p < 0.01). Results for task revealed no significant effect
(parameter = 0.087, SE = 0.172, p > 0.05), suggesting leadership nominations are not dependent
on the type of task (initiating structure or consideration).
The first four hypotheses focused on receiver effects, or attributes associated with the
likelihood to receive leadership nominations. Hypothesis 1 predicted that individuals scoring
high on intelligence, as measured by SAT scores, would emerge as leaders. Results revealed a
significant main receiver effect for intelligence, such that individuals scoring high on intelligence
were more likely to be nominated, and thus emerge, as leaders ((parameter = 0.001, SE = 0.001,
p < 0.01). This finding supports Hypothesis 1. Hypotheses 2 and 3 proposed that one’s level of
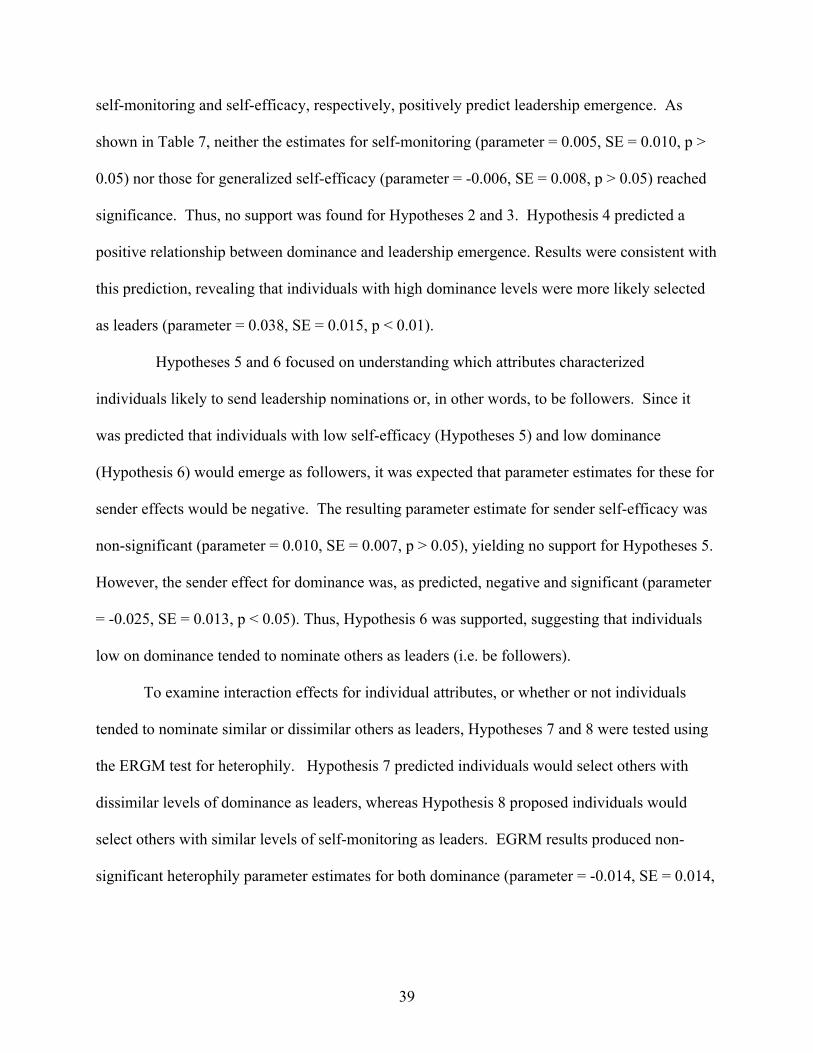
39
self-monitoring and self-efficacy, respectively, positively predict leadership emergence. As
shown in Table 7, neither the estimates for self-monitoring (parameter = 0.005, SE = 0.010, p >
0.05) nor those for generalized self-efficacy (parameter = -0.006, SE = 0.008, p > 0.05) reached
significance. Thus, no support was found for Hypotheses 2 and 3. Hypothesis 4 predicted a
positive relationship between dominance and leadership emergence. Results were consistent with
this prediction, revealing that individuals with high dominance levels were more likely selected
as leaders (parameter = 0.038, SE = 0.015, p < 0.01).
Hypotheses 5 and 6 focused on understanding which attributes characterized
individuals likely to send leadership nominations or, in other words, to be followers. Since it
was predicted that individuals with low self-efficacy (Hypotheses 5) and low dominance
(Hypothesis 6) would emerge as followers, it was expected that parameter estimates for these for
sender effects would be negative. The resulting parameter estimate for sender self-efficacy was
non-significant (parameter = 0.010, SE = 0.007, p > 0.05), yielding no support for Hypotheses 5.
However, the sender effect for dominance was, as predicted, negative and significant (parameter
= -0.025, SE = 0.013, p < 0.05). Thus, Hypothesis 6 was supported, suggesting that individuals
low on dominance tended to nominate others as leaders (i.e. be followers).
To examine interaction effects for individual attributes, or whether or not individuals
tended to nominate similar or dissimilar others as leaders, Hypotheses 7 and 8 were tested using
the ERGM test for heterophily. Hypothesis 7 predicted individuals would select others with
dissimilar levels of dominance as leaders, whereas Hypothesis 8 proposed individuals would
select others with similar levels of self-monitoring as leaders. EGRM results produced non-
significant heterophily parameter estimates for both dominance (parameter = -0.014, SE = 0.014,
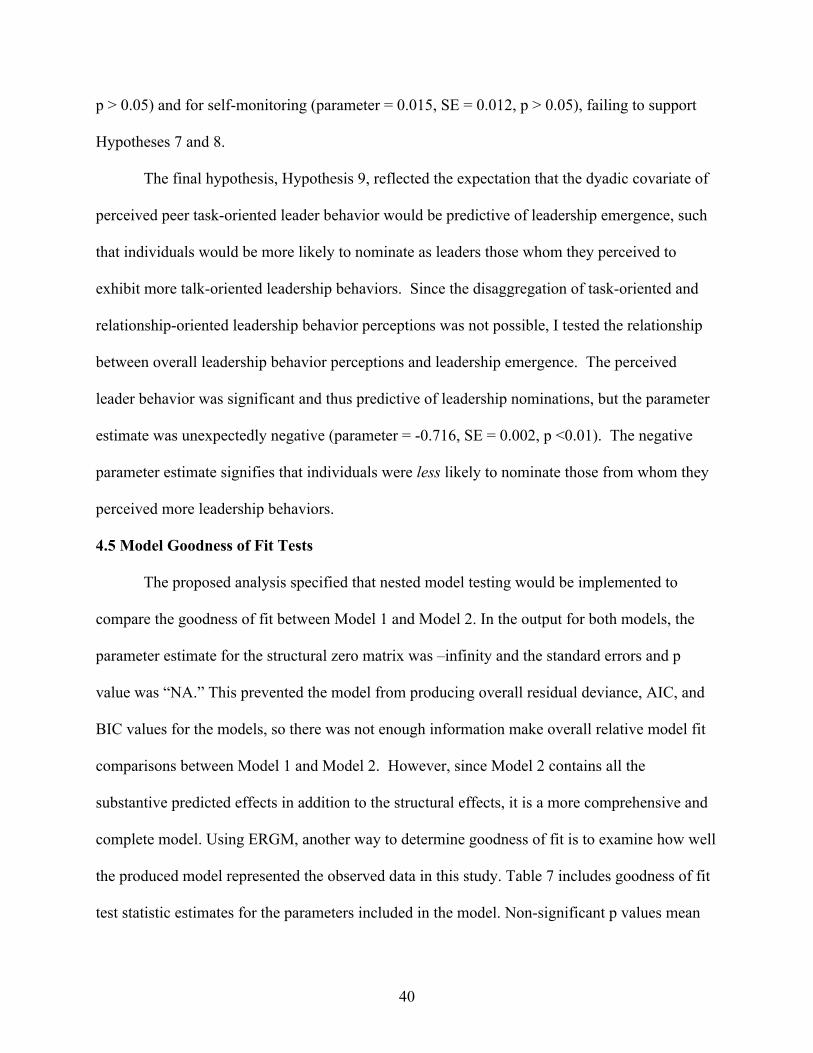
40
p > 0.05) and for self-monitoring (parameter = 0.015, SE = 0.012, p > 0.05), failing to support
Hypotheses 7 and 8.
The final hypothesis, Hypothesis 9, reflected the expectation that the dyadic covariate of
perceived peer task-oriented leader behavior would be predictive of leadership emergence, such
that individuals would be more likely to nominate as leaders those whom they perceived to
exhibit more talk-oriented leadership behaviors. Since the disaggregation of task-oriented and
relationship-oriented leadership behavior perceptions was not possible, I tested the relationship
between overall leadership behavior perceptions and leadership emergence. The perceived
leader behavior was significant and thus predictive of leadership nominations, but the parameter
estimate was unexpectedly negative (parameter = -0.716, SE = 0.002, p <0.01). The negative
parameter estimate signifies that individuals were less likely to nominate those from whom they
perceived more leadership behaviors.
4.5 Model Goodness of Fit Tests
The proposed analysis specified that nested model testing would be implemented to
compare the goodness of fit between Model 1 and Model 2. In the output for both models, the
parameter estimate for the structural zero matrix was –infinity and the standard errors and p
value was “NA.” This prevented the model from producing overall residual deviance, AIC, and
BIC values for the models, so there was not enough information make overall relative model fit
comparisons between Model 1 and Model 2. However, since Model 2 contains all the
substantive predicted effects in addition to the structural effects, it is a more comprehensive and
complete model. Using ERGM, another way to determine goodness of fit is to examine how well
the produced model represented the observed data in this study. Table 7 includes goodness of fit
test statistic estimates for the parameters included in the model. Non-significant p values mean

41
that the there is no significant difference between the estimated model and the observed model.
Since Table 7 shows no estimated parameter statistics were significantly different from the
observed, it was concluded that the produced model fit the observed data well.
5.0 Discussion
5.1 Discussion of Findings
The overarching goal of this study was to better understand leadership emergence as a
process. The benefit of using a social network modeling technique to do so is leader and
follower characteristics, their similarity, and leader behavior can all simultaneously be modeled
into one parsimonious model, all while controlling for context (task) and network patterning of
interdependencies in the data. In addition, though the level of analysis was at the dyad level, this
study operated in a multi-level framework, showing how macro-level leadership emerges from
individual and dyadic patterns. Accordingly, the present study is a step in the right direction of
obtaining a more complete picture of the entire leadership process. The findings contribute to
research in many subdomains of leadership emergence, including those related to group
leadership structure, leaders traits, follower traits, relational trait fit, behaviors, and the situation.
A major advantage of using ERGM to study leadership emergence was that patterns of
leadership nominations could first be identified in Model 1 and subsequently controlled for in
Model 2. One goal in doing so was to attempt to identify the variables responsible for the
observed relational patterns. For example, in this study, there was a general tendency for people
to nominate as leaders, or follow, multiple others as opposed to simply one person (out-star). If
the effect for the out-star parameter evident in Model 1 had disappeared when the hypothesized
predictors were added in Model 2, it could be inferred that one or more of the predictors included
in Model 2 was responsible for the observed out-star tendency. Such was not the case in this
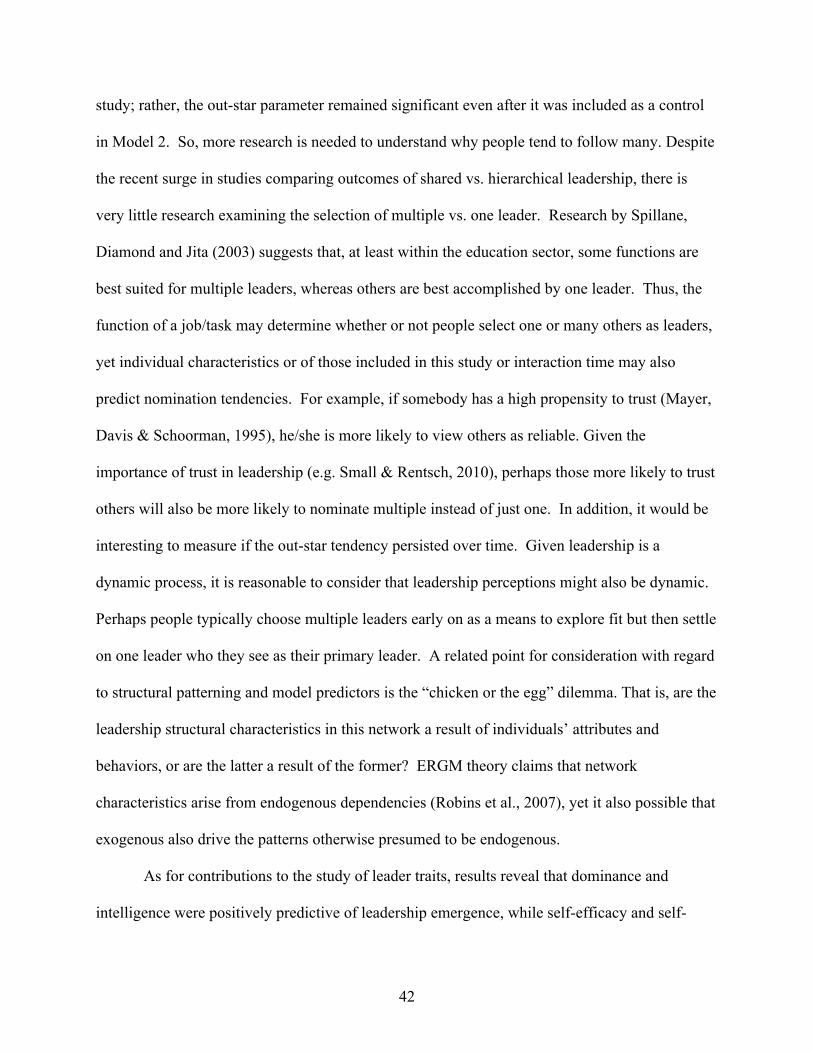
42
study; rather, the out-star parameter remained significant even after it was included as a control
in Model 2. So, more research is needed to understand why people tend to follow many. Despite
the recent surge in studies comparing outcomes of shared vs. hierarchical leadership, there is
very little research examining the selection of multiple vs. one leader. Research by Spillane,
Diamond and Jita (2003) suggests that, at least within the education sector, some functions are
best suited for multiple leaders, whereas others are best accomplished by one leader. Thus, the
function of a job/task may determine whether or not people select one or many others as leaders,
yet individual characteristics or of those included in this study or interaction time may also
predict nomination tendencies. For example, if somebody has a high propensity to trust (Mayer,
Davis & Schoorman, 1995), he/she is more likely to view others as reliable. Given the
importance of trust in leadership (e.g. Small & Rentsch, 2010), perhaps those more likely to trust
others will also be more likely to nominate multiple instead of just one. In addition, it would be
interesting to measure if the out-star tendency persisted over time. Given leadership is a
dynamic process, it is reasonable to consider that leadership perceptions might also be dynamic.
Perhaps people typically choose multiple leaders early on as a means to explore fit but then settle
on one leader who they see as their primary leader. A related point for consideration with regard
to structural patterning and model predictors is the “chicken or the egg” dilemma. That is, are the
leadership structural characteristics in this network a result of individuals’ attributes and
behaviors, or are the latter a result of the former? ERGM theory claims that network
characteristics arise from endogenous dependencies (Robins et al., 2007), yet it also possible that
exogenous also drive the patterns otherwise presumed to be endogenous.
As for contributions to the study of leader traits, results reveal that dominance and
intelligence were positively predictive of leadership emergence, while self-efficacy and self-
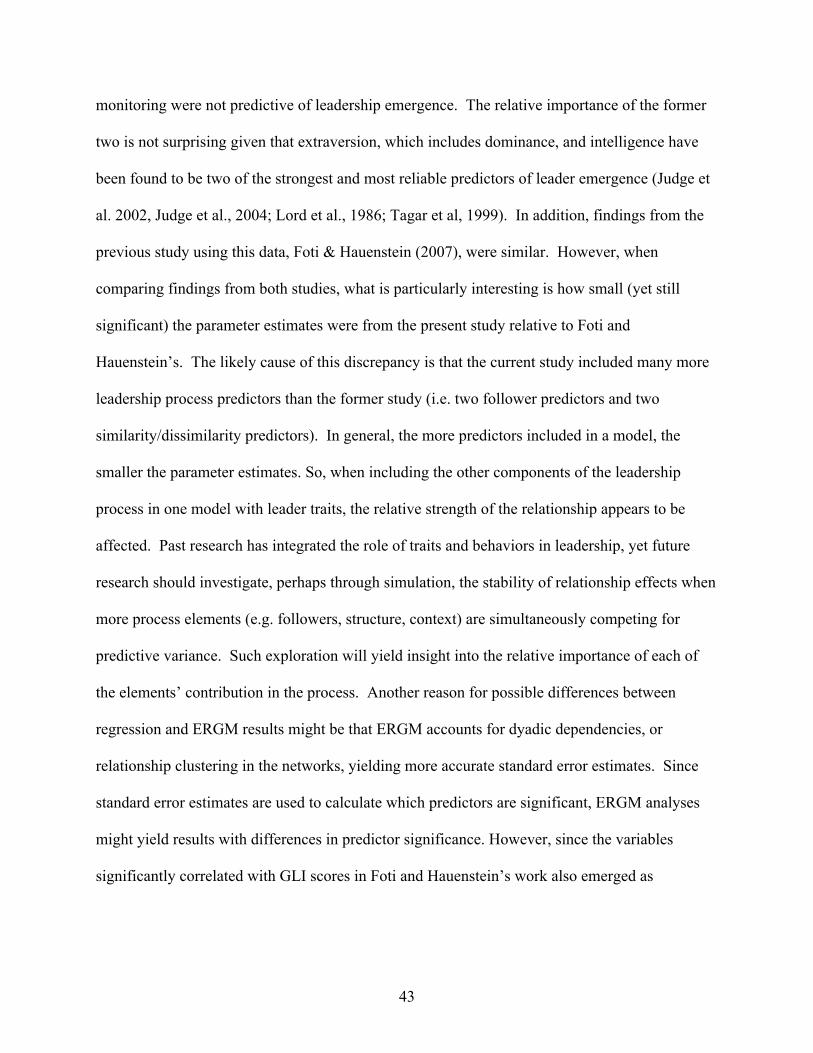
43
monitoring were not predictive of leadership emergence. The relative importance of the former
two is not surprising given that extraversion, which includes dominance, and intelligence have
been found to be two of the strongest and most reliable predictors of leader emergence (Judge et
al. 2002, Judge et al., 2004; Lord et al., 1986; Tagar et al, 1999). In addition, findings from the
previous study using this data, Foti & Hauenstein (2007), were similar. However, when
comparing findings from both studies, what is particularly interesting is how small (yet still
significant) the parameter estimates were from the present study relative to Foti and
Hauenstein’s. The likely cause of this discrepancy is that the current study included many more
leadership process predictors than the former study (i.e. two follower predictors and two
similarity/dissimilarity predictors). In general, the more predictors included in a model, the
smaller the parameter estimates. So, when including the other components of the leadership
process in one model with leader traits, the relative strength of the relationship appears to be
affected. Past research has integrated the role of traits and behaviors in leadership, yet future
research should investigate, perhaps through simulation, the stability of relationship effects when
more process elements (e.g. followers, structure, context) are simultaneously competing for
predictive variance. Such exploration will yield insight into the relative importance of each of
the elements’ contribution in the process. Another reason for possible differences between
regression and ERGM results might be that ERGM accounts for dyadic dependencies, or
relationship clustering in the networks, yielding more accurate standard error estimates. Since
standard error estimates are used to calculate which predictors are significant, ERGM analyses
might yield results with differences in predictor significance. However, since the variables
significantly correlated with GLI scores in Foti and Hauenstein’s work also emerged as
44
significant in this study, differences in estimates was more likely due to the addition of
predictors.
The lack of support for the role of self-monitoring in leadership emergence is aligned
with the finding by Zaccaro and colleagues (1991), who also found no relationship between self-
monitoring and peer ratings of GLI leadership behaviors. One idea underlying these two
findings might be self-monitoring is an important attribute for a specific type of leadership. In a
longitudinal study of predictors of leadership emergence, Emery (2010) found self-monitoring to
be a significant predictor of the emergence of people-oriented leaders over time but not a
significant predictor of the emergence of task-oriented leaders. Since the present study was a
task-driven one, perhaps self-monitoring is not as important in this case as it might be for other
leader types. For example, Pearce and Sims (2002) identified five different types of leadership,
one of which being “empowering leadership” (p. 173). Empowering leadership includes
behaviors such as encouraging others, setting group goals, working in teams, and facilitating
self-development, all of which are person-oriented behaviors. Thus, further research might
investigate if self-monitoring is a significant predictor of empowering leadership emergence.
Generalized self-efficacy was not related to leadership emergence. One possible
explanation might relate to the distinction between generalized self-efficacy and leadership self-
efficacy. Research has found an empirical difference between generalized self-efficacy and
leadership self-efficacy (Chen et al. 2001; Eden & Kinnar, 2001), but the two constructs are
confounded. In order to avoid this, Eden (1988) advocated for including both measures for task-
specific and general self-efficacy in research design. In doing so, Chemers et al. (2000) found a
significant relationship between leadership self-efficacy and perceptions of leadership, but not
general self-esteem and leadership perceptions, which is consistent with Bandura’s (1997) theory
45
that task-specific self-efficacy should be more predictive of task performance than generalized
self-efficacy. Thus, it is possible that leadership self-efficacy is more predictive of leadership
and followership emergence than generalized self-efficacy, and in this sample, the latter
relationship did not materialize. Replication of this study using both measures of generalized
and leadership self-efficacy may help to isolate the unique role of each of the constructs in the
leadership emergence process.
The present study not only uncovers emergent leaders’ attributes, but it also seeks to
uncover attributes of those who nominate one or more others as leaders. Assuming individuals
follow those they nominate, nominators in the present study were defined as followers. As
evidenced from the results, a defining characteristic of followers in the sample studied was low
levels of dominance. It is important to consider this result along with the prevailing stereotype
that followers are “passive, deferent, and subordinate” (Uhl-Bien et al, 2014, p.94) and with the
results from Carsten et al.’s (2010) qualitative research showing that followers often see
themselves as so. According to Heckscher (1994), followers may follow simply because past
roles and experiences have conditioned them as so. If followership roles carry stereotypes of
non-dominance and people conform to their roles, it is very possible that societal role stereotypes
have driven followers to be low on dominance. Trait theorists, on the other hand, argue
attributes are stable across life and would likely claim followers are so because they are innately
low on dominance (e.g. Eysenck, 1991). Researchers ought to conduct developmental studies
tracking dominance levels over time while also considering past roles and experience to
determine whether followers are in a sense born or made.
Given the paucity of research on followers, few, if any, have yet been identified.
Although the current study found low levels of dominance as characteristic of followers,
46
researchers should turn attention to uncovering other predictors of the follower tendency. One
interesting area to be explored is follower identity. DeRue and Ashford (2010) theorized that
dyadic leadership relationships result from a process “whereby individuals co-create reciprocal
and mutually reinforcing identities as leaders and followers” (p. 628). This theory states that
individuals socially construct the leader and follower identities that they attribute to themselves
and others, such that “claims” are the actions an individual takes to affirm his/her own identity as
a leader or a follower and “grants” are the actions an individual takes to bestow his/her identity
as a leader or follower on somebody else. In this study, a leadership nomination might be
considered a reflection of one granting a leader identity to another. So examining how the
follower identifies, or claims, himself/herself (i.e. leader or follower) may predict whether or not
(s) he sends or receives leadership nominations. It would be expected that those who claim a
follower identity tend to send leadership nominations and those who claim a leader identity tend
to receive leadership nominations. It should be noted that DeRue and Ashford (2010)
operationalize identity claims and grants through verbal and nonverbal behavioral interactions,
yet a direct self-report measure could be an alternative way to capture leader/follower identity.
Further research might seek to examine the role of both behavioral and self-report measures of
leader/follower identities in predicting leadership relationships.
Generalized self-efficacy was the second follower attribute predicted to have a negative
relationship with the tendency to send leadership nominations. This relationship was
unsupported in this sample but opens doors for additional exploration. Research has found a
significant relationship between transformational leadership and follower self-efficacy but that
this relationship was moderated by the situation (Den Hartog & Beschak, 2012). Accordingly,
perhaps in this case there was no effect because leaders of the group only exhibited

47
transformational leadership and were thus not nominated by those low on self-efficacy. A study
manipulating leadership style and situational factors, such as tasks, can help to illustrate when a
relationship between self-efficacy and followership might emerge
This study advances research on predictors of leadership emergence beyond the
individual level to that of the dyad by examining the personality match between dyad members
as it relates to leader and follower emergence. This study failed to find support for any either of
the proposed relationships (dominance and self-monitoring); however this does not necessarily
imply these relationships do not exist. ERGM is limited in that it is only able to model bi-
directional similarity/dissimilarity relationships. That is, in this study, the dominance
dissimilarity parameter estimated both if those with low dominance scores tend to nominate
those with high scores and if those with high dominance scores tend to nominate those with low
scores. Still, it is very plausible that complementary fit, or the Dominance Complementary
Theory (Kiesler, 1983), holds for those low on dominance in that they tend to nominate those
high on dominance but supplementary fit, or the Similarity-Attraction Theory (Bryne, 1971)
holds for those high on dominance in that they tend to nominate those high on dominance. The
main sender and receiver effects for dominance found in this study allow for the inference of this
pattern, based on the finding that those with low dominance tended to nominate others and those
with high dominance tended to receive nominations. Regarding self-monitoring, just as the
importance of self-monitoring might depend on the type of leadership and context of interest, the
effect of self-monitoring similarity may depend on the context. For example, Day & Kilduff,
(2003) theorized that self-monitoring dissimilarity between dyad members may result in beliefs
that the other is disingenuous or inflexible. However, if there exist high levels of trust and/or
liking between the two individuals, perhaps such negative effects would occur, resulting in the
48
formation of leadership relationships. The influence of other dyadic relationships or perceptions
on the effect of dyadic similarity on leadership emergence is an interesting area for future
exploration. Since ERGM cannot statistically test for interactions in similarity or dissimilarity
effects, no firm conclusions can yet be drawn using ERGM analyses; however, as statistical
modeling techniques become more advanced, perhaps researchers can make more fine-grained
discoveries as to individual components of the leadership process fit together to produce its
emergence.
Demonstration of leadership behaviors is believed to be the primary means through
which one emerges as a leader or a follower (DeRue and Ashford, 2010) and thus is a very
important component of the leadership process. This study sought to measure the unique effect
of perceptions of leadership behaviors on leadership nominations while accounting for all other
components in the process. As expected, perceived leader behavior was a significant predictor in
the model, and was in fact the strongest of all the exogenous predictors. However, the
relationship was negative, implying the more leader behaviors one perceived, the less likely the
perceiver was to nominate him as a leader. What is particularly curious is the relatively high
positive correlation found between perceived leader behavior and both the raw (r =0.63) and
dichotomized (r=0.53) GLI ratings. This seemingly counterintuitive negative relationship could
have been driven by multicollinearity in the predictors, which is likely given the positive
bivariate correlation. However, it is also possible, but less plausible, that there is truly a negative
relationship between leadership behaviors and emergence. Further research is needed to
investigate this potential relationship. Given the research demonstrating that individuals within a
military context prefer leaders who are directive and autocratic (Solano, 2006; as cited in
Shondrick, Dinh & Lord, 2010) and given that the behavioral scale used in this study consisted

49
of mainly team-oriented, as opposed to directive, behaviors (see Appendix A), it is possible that
the current study’s behavioral scale did not adequately reflect leadership for the cadets studied.
Thus, further research should also ensure alignment between the behavioral scales and the
sample studied and should be replicated on both cadet and non-cadet samples using the measure
from the current study and one reflecting more directive leader behaviors. Doing so will not
only reflect the generalizability of the findings to other military cadet samples, but might point to
the important role of measurement in measured outcomes.
Consistent with findings by Zaccaro et al. (1991) that leadership emergence is stable
across tasks, this study revealed that leadership nominations did not differ between initiating
structure and consideration tasks. This result is, however, inconsistent with claims that the
situation does matter for leadership emergence (Osborn, Uhl-Bien, Milosevic, 2014). One
possible reason for this discrepancy is the ambiguity of what is meant by “situations.” For
example, are differing work-related tasks truly differing “situations”? Without clear taxonomical
definitions of situations, researchers will not be able to draw firm conclusions as to the role of
context in leadership emergence. Though efforts have been made to develop situational
taxonomies (e.g. Sherman, Nave & Funder, 2010) and leadership researchers have highlighted
the board variability in what is meant by “context” (Liden & Antonakis, 2009), this area is highly
underdeveloped. There exists great potential in further defining how different types of situations
influence the leadership emergence process. Another fascinating and uncharted area is how
bottom-up leadership processes impact context, or the effect of the components of the leadership
emergence processes the context in which they occur.
50
5.2 Limitations
The present study is certainly not free from limitations. First, in order to use ERGM for
analysis, the measure of leadership emergence (GLI) was artificially dichotomized, which
truncates the criterion information. However, given the high correlation between the raw and
dichotomized GLI scores, it is expected that the current results do not deviate far from those
expected if it were possible to use GLI scores. Still, dichotomization forces individuals to fit into
either the “leader” or “non-leader” category and does so at an arbitrary cut-point. Thus, despite
the reliability of the GLI as a continuous measure of leadership, dichotomization of the scale
may misclassify individuals as leaders/non-leaders because of the absolute threshold used.
Second, as alluded to above, ERGM is not able to model interactions between predictors and
similarity/dissimilarity, so moderated similarity/dissimilarity relationships were absent from the
results. Given theory proposing the moderating role of context in leadership emergence,
modeling researchers should work to refine current techniques to include the ability to model
such interactions.
In addition, like most leadership research, this study is cross-sectional in design. Since a
process fundamentally includes development and emergence over a longitudinal period of time
(Day, 2014), leadership as a process cannot be fully understood using a thin slice, or cross-
section of time. However, because ERGM captures the manner in which micro-level processes
combine to form macro-level phenomena, this study sheds some light on how, from a multi-level
perspective, leadership emerges in leaderless groups. Nonetheless, further research is greatly
needed to develop a theory of time as it relates to leadership (Day, 2014), and to develop
longitudinal measures to adequately model how leadership processes develop over prolonged
time frames. In doing so, consideration of behavioral interactions between dyadic members as
51
they unfold over time cannot be ignored. DeRue (2011) claimed that leading-following
interactions leads to the identifying both oneself and others as either leaders or followers.
In addition, though this study did include many more components of the leadership
processes than most studies, it not examine behaviors of followers nor other important
relationships outside of perceived behavior, such as friendship and liking. Measuring follower
behaviors is very difficult, if not impossible, since there is currently no taxonomy or scale of
follower behavior. It is hoped that as leadership researchers move away from the leader-centric
view, there will be a push to pursue and define behaviors characteristic of (different types of)
followers. As for the other dyadic relationships, research has shown friendship (Slaughter,
20008) and liking are strongly associated with leadership (Hansborough, Lord, Schyns, 2015)
and should be controlled. This study attempted to do so through design by conducting the study
early in the semester before participants had spent much time to get to know each other and by
strategically placing them in groups with members outside of their corps respective groups. Yet,
without measuring the relationships, it is impossible to be fully certain they did not previously
exist. Finally, the generalizability of this study is limited to the sample used: military cadets.
Replication of this study on different samples should be conducted to generalize to populations
beyond the current one.
5.3 Conclusion
The current study advances the study of leadership emergence in several ways. First, it is
one of the only studies- if not, the only one- that simultaneously considers the role of leader
traits, follower traits, leader-follower trait similarity, behaviors, task, and natural social network
patterning in leadership emergence. Doing so is once step closer to understanding the dynamic
and emergent leadership process. Second, conceptualizing leadership as social network
52
comprised of individuals embedded in dyads, embedded in the group, this study enables studying
leadership as the multi-level process by which it is conceptualized. Finally, ERGM methodology
controls for embedded relationships arising from characteristics of the network, allowing for
more less biased estimates to be made about the relationship between predictors of leadership
emergence. Thus, it joins the leader-centric, the follower-centric, the trait, the behavioral, and
the contingency theories of leadership into one multi-level meta-theory of the process of
leadership emergence. I hope that future researchers follow suit in uniting previous leadership
research to clarify leadership processes.
53
6.0 References
Albright, L., Kenny, D. A., & Malloy, T. E. (1988). Consensus in personality judgments at zero
acquaintance. Journal of Personality and Social Psychology, 55, 387−395.
Anderson, C., & Kilduff, G. J. (2009). Why do dominant personalities attain influence in face-
to-face groups? The competence-signaling effects of trait dominance. Journal of
Personality and Social Psychology, 96(2), 491-503.
Antonakis, J., Bendahan, S., Jacquart, P., & Lalive, R. (2010). On making causal claims: A
review and recommendations. The Leadership Quarterly, 21(6), 1086-1120.
Avolio, B.J., Walumba, F.O., & Weber, T.J. (2009). Leadership: Current theories, research and
future directions. Annual Review of Psychology, 60, 421-449.
Balkundi, P., & Kilduff, M. (2006). The ties that lead: A social network approach to leadership.
Leadership Quarterly, 16, 941-961.
Barrick, M. R., Stewart, G. L., Neubert, M. J., Mount, M. K. (1998). Relating member ability
and personality to work-team processes and team effectiveness. Journal of Applied
Psychology 83(3), 377-391.
Bartol, K. M., & Zhang, X. (2007). Networks and leadership development: Building linkages for
capacity acquisition and capital accrual. Human Resource Management Review, 17, 388-
401.
Bass, B. M. (1990). Bass & Stogdill’s Handbook of Leadership. New York:
The Free Press.
Bell, B. S., & Kozlowski, S. W. J. (2008). Active learning: Effects of core training design
elements on self-regulatory processes, learning, and adaptability. Journal of Applied
Psychology, 93, 296-316.
54
Bjugstad, K., Thach, E. C., Thompson, K. J., & Morris, A. (2006). A fresh look at followership:
A model for matching followership and leadership styles. Journal of Behavioral and
Applied Management, 7, 304−319.
Bono, J. E., & Anderson, M. H. (2005). The advice and influence networks of transformational
leaders. Journal of Applied Psychology, 90(6), 1306-1314.
Bono, J. E., & Judge, T. A. (2003). Self-concordance at work: toward understanding the
motivational effects of transformational leaders. Academy of Management Journal, 46,
554–71.
Bowers, D. G. & Seashore, S. E. (1966). Predicting organizational effectiveness with a four-
factor theory of leadership. Administrative Science Quarterly, 11, 238-263.
Burke, C. S., Stagl, K. C., Klein, C., Goodwin, G. F., Salas, E., & Halpin, S. M. (2006). What
type of leadership behaviors are functional in teams? A meta-analysis. Leadership
Quarterly, 17, 288-307.
Byrne, D. (1971). The Attraction Paradigm. New York: Academic Press.
Carsten, M., & Uhl-Bien, M. (2012). Follower beliefs in the co-production of leadership:
Examining upward communication and the moderating role of context. Journal of
Psychology, 220(4), 210–220.
Carsten, M. K., Uhl-Bien, M., West, B. J., Patera, J. L., & McGregor, R. (2010). Exploring social
constructions of followership: A qualitative study. The Leadership Quarterly, 21, 543-
562.
Chemers, M. M., Watson, C. B., & May, S. T., (2000). Disposition affect and leadership
effectiveness: A comparison of self-esteem, optimism, and efficacy. Personality and
Social Psychology Bulletin, 26(3), 267-277.
55
Chen, G., Gully, S. M. & Eden, D. (2001). Validcation of new general self-efficacy scale.
Research Methods, 4, 62-83.
Cranmar, S. J. & Desmarais, B. A. (2011). Inferential Network Analysis with Exponential
Random Graph Models. Political Analysis, 19, 66-86.
Day, D. V. (2014). Introduction: Leadership and Organizations. In D. V. Day (Ed.), The Oxford
Handbook of Leadership and Organizations (pp. 3-12). New York: Oxford University
Press.
Day, D. V. (2012). Leadership. In S. W. J. Kozlowski (Ed.), The Oxford Handbook of
Organizational Psychology (Vol. 1, pp. 696-729). New York: Oxford University Press.
Day, D.V., & Kilduff, M. (2003). Self-monitoring personality and work relationships: Individual
differences in social networks. In M.R. Barrick & A.M. Ryan (Eds.), Personality and
work: Reconsidering the role of personality in organizations (pp. 205–228). San
Francisco: Jossey-Bass.
Day, D. V., & Schleicher, D. J. (2006). Self-monitoring at work: A motive-based perspective.
Journal of Personality, 74(3), 685-713.
Day, D. V., Schleicher, D. J., Unckless, A. L., & Hiller, N. J. (2002). Self-monitoring personality
at work: A meta-analytic investigation of construct validity. Journal of Applied
Psychology, 87, 390–401.
Deluga, D. J. (1998). Leader-member exchange quality and effectiveness ratings: The role of
subordinate-superior conscientiousness similarity. Group and Organization
Management, 23(2), 189-216.
Den Hartog, D. N., & Belschak, F. D. (2012). When does transformational leadership enhance
56
employee proactive behavior? The role of autonomy and role breadth self-
efficacy. Journal of Applied Psychology, 97(1), 194-202.
DeRue, D. S., & Ashford, S. J. (2010). Who will lead and who will follow: A social process of
leadership identity construction in organizations. Academy of Management Review, 35,
627-647.
DeShon, R. P., Kozlowski, S. W. J., Schmidt, A. M., Milner, K. R., & Wiechmann, D. (2004). A
multilevel, multiple goal model of feedback effects on the regulation of individual and
team performance in training. Journal of Applied Psychology, 89, 1035–1056.
Dobbins, G. H., Long, W. S., Dedrick, E. J., Clemons, T. C. (1990). The Role of self-monitoring
and gender on leader emergence: A laboratory and field study. Journal of Management,
16 (3), 609-618.
Dryer, D. C., & Harowitz, L. M. (1997). When do opposites attract? Interpersonal
complementarity versus similarity. Journal of Applied Psychology, 72(3), 592-603.
Eden, D., & Kinnar, J. (1991). Modeling Galatea: Boosting self-efficacy to increase
volunteering. Journal of Applied Psychology, 76, 770–780.
Eden, D. (1988). Pygmalion, goal setting, and expectancy: compatible ways to boost
productivity. Academy of Management Review, 13, 639−652.
Emery, C. (2012). Uncovering the role of emotional abilities in leadership emergence. A
longitudinal analysis of leadership networks. Social Networks, 34, 429-337.
Emery, C., Calvard, T. S., Meghan, P. E. (2013). Leadership as an emergence group process: A
social network study of personality and leadership. Group Processes and Intergroup
Relations, 16(1), 28-45.
Epitropaki, O., Sy, T., Martin, R., Tram, S., & Topakas, A. (2013). Implicit leadership and
57
followership theories ‘In the Wild:’ Taking stock of leadership processing approaches in
organizational settings. The Leadership Quarterly, 24(6) 858–851.
Eysenck (1991). 16, 5, or 3: criteria for a taxonomic paradigm. Personality and Individual
Differences, 12, 773-790.
Felfe, J., & Schyns, B. (2010). Followers’ personality and the perception of transformational
leadership: Further evidence for the similarity hypothesis. British Journal of
Management, 21, 393–410
Foti, R. J & Coyle, P. T. (2015). Patterns of leader and follower perceptions: How are they
related? In B. Schyns & T. Dennerlein (Chairs), Implicit Followership Theories and
People’s Dispositions as Drivers of Leadership Effectiveness. Symposium to be
presented at the 75th annual meeting of the Academy of Management, Vancouver, British
Columbia, Canada.
Frey, M. C., & Detterman, D. K. (2004). Scholastic assessment or g? The relationship between
the Scholastic Assessment Test and general cognitive ability. Psychological Science, 15,
373-378.
Gangestad, S., & Snyder, M. (2000). Self-monitoring: Appraisal and reappraisal. Psychological
Bulletin, 126, 530–555.
Gatewood, R., Thorton, G. C., & Hennesy, H. W. (1990). Reliability of exercise ratings in the
leaderless group discussion. Journal of Occupational Psychology, 63, 331-342.
Glomb, T. M., & Welsh, E. T. (2005). Can opposites attract? Personality heterogeneity in
supervisor-subordinate dyads as a predictor of subordinate outcomes. Journal of Applied
Psychology 90(4), 749-757.
Gouldner, A. (1960). The norm or reciprocity: A preliminary statement. American Sociological
58
Review, 25(2), 161-178.
Gough, H. G. (1990). Testing for leadership with the California Psychological Inventory. In K.
E. Clark & M. B. Clark (Eds.), Measures of leadership (pp. 355-379). Orange, NJ:
Leadership Library of America.
Gough, H. G., & Bradley, P. (2005). CPI 260TM manual. Palo Alto, CA: CPP.
Graen, G. B., & Uhl-Bien, M. (1995). Relationship-based approach to leadership: Development
of leader-member exchange (LMX) theory of leadership over 25 years: Applying a multi-
level multi-domain perspective. The Leadership Quarterly, 6(2), 219-247.
Grant, A. M., Gino, F. & Hofman, D. A. (2011). Reversing the extraverted leadership advantage:
The role of employee proactivity. Academy of Management Journal, 54(3), 528-550.
Halpin, A. W. (1957). Manual for the Leader Behavior Description Questionnaire. Columbus,
OH: Bureau of Business Research, Ohio State
University.
Hansbrough, T. H., Lord, R. G., Schyns, B. (2015). Reconsidering the accuracy of follower
leadership ratings. The Leadership Quarterly, 26, 220-237.
Heckscher, C. (1994). Defining the post-bureaucratic type. In C. Heckscher, & A. Donnellon
(Eds.), The post-bureaucratic organization: New perspectives on organizational change.
Thousand Oaks: Sage.
Hogan, R., Curphy, G. J., & Hogan, J. (1994). What we know about leadership: Effectiveness
and personality. American Psychologist, 49, 493–504.
Hollander, E. P. (1974). Processes of leadership emergence. Journal of Contemporary Business,
3, 19–33.
Hoption, C., Christie, A., & Barling, J. (2012). Submitting to the follower label: Followership,
59
positive affect and extra-role behaviors. Journal of Psychology (Special Issue:
Followercentric Approaches to Leadership), 220, 221 - 230.
Howell, J.M., & Shamir, B. (2005). The role of followers in the charismatic leadership process:
relationships and their consequences. Academy of Management Review, (30), 96–112.
Hughes, R. L., Ginnett, R. A., & Curphy, G. L. (1993). Leadership: Enhancing the lessons of
experience. Homewood, IL: Irwin.Judge, T. A., Bono, J. E., Ilies, R., & Gerhardt, M. W.
(2002). Personality and leadership: A qualitative and quantitative review. Journal of
Applied Psychology, 87(4), 765–780.
Judge, T. A., Colbert, A. E., & Ilies, R. (2004). Intelligence and Leadership: A quantitative
review and test of theoretical propositions. Journal of Applied Psychology, 89, 542-552.
Judge, T. A., Erez, A., & Bono, J.E. (2011). The power of being positive: The relation between
positive self-concept and job performance. Human Performance, 11, 187-187.
Judge, T. A., Piccolo, R. F., & Kosalka, T. (2009). The bright and dark sides of leader
Traits, A review and theoretical extension of the leader trait paradigm. The Leadership
Quarterly, 20(6), 855-875.
Kaiser, R. B., Hogan, R., & Craig, S. B. (2008). Leadership and the fate of organizations.
American Psychologist, 63, 96–110.
Kalish, Y. (2013). Harnessing the power of social network analysis to explain organizational
phenomena. In J. M. Cortina & R. S. Landis (Eds.), Modern research methods for the
study of behavior in organizations (pp. 99-135). New York: Routledge.
Kenny, D. A. (1988). Interpersonal perception: A social relations analysis. Journal of Social
and Personal Relationships, 5. 247-261.
Kenny, D. A., & Hallmark, B. W. (1992). Rotation designs in leadership research. Leadership
60
Quarterly, 3, 25–42.
Kenny, D. A., Mohr, C. D., & Levesque, M. J. (2001). A social relations variance partitioning of
dyadic behavior. Psychological Bulletin, 127,128 –141.
Kickul, J., & Neuman, G. (2000). Emergent leadership behaviors: The function of personality
and cognitive ability in determining work performance and KSAS. Journal of Business
and Psychology, 15(1), 27-51.
Kieser, D. J. (1983). The 1982 Interpersonal Circle: A taxonomy for complementarity in human
transactions. Psychological Review, 90, 185– 214.
Kipnis, D., & Layne, W. P. (1962). Self-confidence and leadership. Journal of Applied
Psychology , 46(4), 291-295.
Klein, K. J., Lim, B., Saltz, J. L., & Mayer, D. M. (2004). How do they get there? An
examination of the antecedents of centrality in team networks. Academy of Management
Journal, 47, 952–963.
Klob, J.A. (1999). The effect of gender role, attitude toward leadership, and self-confidence on
leader emergence: Implications for leadership development. Human Resource
Development Quarterly, 10(4), 305-320.
Kozlowski, S. W. J., & Klein, K. J. (2000). A multilevel approach to theory and research in
organizations: Contextual, temporal, and emergent processes. In K. J. Klein & S. W. J.
Kozlowski (Eds.), Multilevel theory, research and methods in organizations:
Foundations, extensions, and new directions. (pp. 3–90). San Francisco, CA: Jossey-
Bass.
Krasikova, D. V., & LeBreton, J. M. (2012). Just the two of us: Misalignment of theory and

61
methods in examining dyadic phenomena. Journal of Applied Psychology, 97(4), 739-
757.
Kristof-Brown, A., Barrick, M. R., & Stevens, C. K. (2005). When opposites attract: A multi-
sample demonstration of complementary person-team fit on extraversion. Journal of
Personality, 73(4), 935-958.
Liden, R. C., & Antonakis, J. (2009). Considering context in psychological leadership research,
Human Relations, 62(11), 1587–1605.
Lord, R. G. (2005). Preface: Implicit leadership theory. In B. Shyns & J. R. Miendl (Eds.),
Implicit Leadership Theories: Essays and Explorations. (p. ix-xiv). Greenwish:
Information Age Publishing.
Lord, R. G., Devader, C. L., & Alliger, G. M. (1986). A meta-analysis of the relation between
personality traits and leadership perceptions: An application of validity generalization
procedures. Journal of Applied Psychology, 71(3), 402-410.
Lord, R. G, Foti, R. J, & De Vader, C. L. (1984). A test of leadership categorization theory:
Internal structure, information processing, and leadership perceptions. Organizational
Behavior and Human Performance, 34, 343-378.
Lord, R. G., Foti, R. J., & Phillips, J.S. (1982). A theory of leadership categorization. In
J. G. Hunt, U. Sekaran, & C. A. Schriesheim (Eds.), Leadership: Beyond establishment
views (pp. 104–121). Carbondale: Southern Illinois University Press.
Lusher, D., & Robins, G. (2013). Formation of social network structure. In D. Lusher, J.
Koskinen, & G. Robins (Eds), Exponential Random Graph Modes for Social Networks:
Theory, Methods, and Applications (p. 16-28). New York: Cambridge University Press.
Mann, R. D. (1959). A review of the relationship between personality and performance in small
62
groups. Psychological Bulletin, 56(4), 241-270.
Marta, S., Leritz, L. E., Mumford, M. D. (2005). Leadership skills and the group performance:
Situational demands, behavioral requirements and planning. The Leadership Quarterly,
16, 91-120.
Mayer, R. C., Davis, J. H., & Shoorman, F.D. (1995). An integrative model of organizational
trust. Academy of Management Review, 20, 709-734.
McAllister, L. W. (1996). A practical guide to CPI interpretation (3rd ed.). Palo Alto, CA:
Consulting Psychologists Press.
Megargee, E. (1969). Influence of sex roles on the manifestation of leadership. Journal of
Applied Psychology, 53(5), 377-382.
Mehra, A., Dixon, A.L., Brass, D.J., & Robertson, B. (2006). The social network ties of group
leaders: Implications for group performance and leader reputation. Organization Science,
17(1), 64-79.
Mehra, A., Kilduff, M., & Brass, D.J. (2001). The social networks of high and low self-monitors:
Implications for workplace performance. Administrative Science Quarterly, 46, 121–146.
Meindl, J. R. (1995). The romance of leadership as a follower-centric theory: A social
constructionist approach. The Leadership Quarterly, 6(3), 329-341.
Molm, L. D., Schaefer, D. R., Collett, J. L. (2007). The value of reciprocity. Social Psychology
Quarterly, 70(2), 199-217.
Morgeson, F. P., DeRue, D. S., Karam, E. P. (2010). Leadership in teams: A functional approach
to understanding leadership structures and processes. Journal of Management, 36 (1), 5-
39.
Muchinsky, P. M., & Monahan, C. J. (1987). What is person-environment congruence?
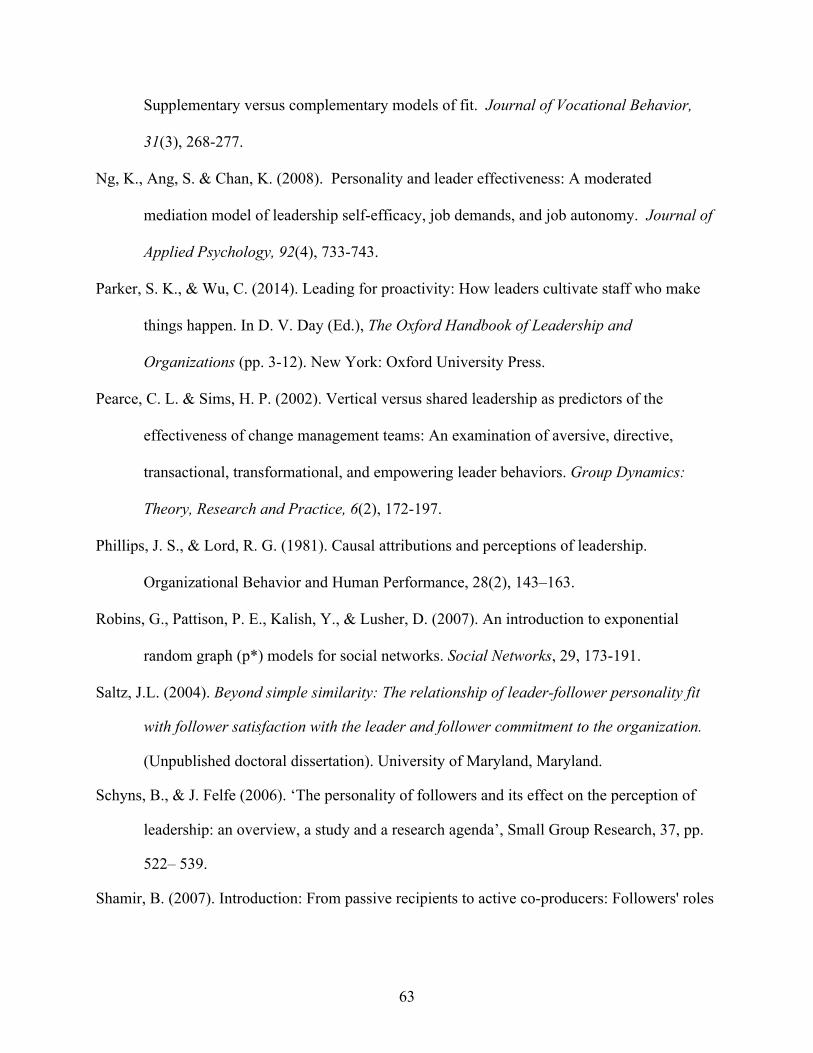
63
Supplementary versus complementary models of fit. Journal of Vocational Behavior,
31(3), 268-277.
Ng, K., Ang, S. & Chan, K. (2008). Personality and leader effectiveness: A moderated
mediation model of leadership self-efficacy, job demands, and job autonomy. Journal of
Applied Psychology, 92(4), 733-743.
Parker, S. K., & Wu, C. (2014). Leading for proactivity: How leaders cultivate staff who make
things happen. In D. V. Day (Ed.), The Oxford Handbook of Leadership and
Organizations (pp. 3-12). New York: Oxford University Press.
Pearce, C. L. & Sims, H. P. (2002). Vertical versus shared leadership as predictors of the
effectiveness of change management teams: An examination of aversive, directive,
transactional, transformational, and empowering leader behaviors. Group Dynamics:
Theory, Research and Practice, 6(2), 172-197.
Phillips, J. S., & Lord, R. G. (1981). Causal attributions and perceptions of leadership.
Organizational Behavior and Human Performance, 28(2), 143–163.
Robins, G., Pattison, P. E., Kalish, Y., & Lusher, D. (2007). An introduction to exponential
random graph (p*) models for social networks. Social Networks, 29, 173-191.
Saltz, J.L. (2004). Beyond simple similarity: The relationship of leader-follower personality fit
with follower satisfaction with the leader and follower commitment to the organization.
(Unpublished doctoral dissertation). University of Maryland, Maryland.
Schyns, B., & J. Felfe (2006). ‘The personality of followers and its effect on the perception of
leadership: an overview, a study and a research agenda’, Small Group Research, 37, pp.
522– 539.
Shamir, B. (2007). Introduction: From passive recipients to active co-producers: Followers' roles

64
in the leadership process. In B. Shamir, R. Pillai, M. Bligh, & M. Uhl-Bien (Eds.),
Follower-centered perspectives on leadership: A tribute to the memory of James R.
Meindl (pp. ix–xxxix). Greenwich, CT: Information Age Publishing.
Sherer, M., Maddux, J. E., Mercadante, B., Prentice-Dunn, S., Jacobs, B. & Rogers, R.W.
(1982). The self-efficacy scale: Construction and validation. Psychological Reports, 51,
663-671.
Shontrick, S. J., Dinh, J., Lord, R. G. (2010). Developments in implicit leadership theory and
cognitive science: Applications to improving measurement and understanding
alternatives to hierarchical leadership. The Leadership Quarterly (21), 959-978.
Shrondrick, S.J. & Lord, R.G. (2010). Implicit leadership and follower theories: Dynamic
structures for leadership perceptions, memory, and leader-follower processes.
International Review of Industrial and Organizational Psychology, 25, 1-34.
Slaughter, A. J. (2008). Emergent leadership structures in organizations. (Unpublished doctoral
dissertation). Texas A & M University, College Station, TX.
Smith, J. A., & Foti, R. J. (1998). A pattern approach to the study of leader emergence. The
Leadership Quarterly, 9, 147–160.
Stajkovic, A.D., & Luthans, F. (1998). Self-efficacy and work-related performance: A meta-
analysis. Psychological Bulletin, 124, 240-261.
Stogdill, R. M. (1950). Leadership, membership and organization. Psychological Bulletin, 47, 1–
14.
Sy, T. (2010). What do you think of followers? Examining the content, structure, and
consequences of implicit followership theories. Organizational Behavior and
Human Decision Processes, 113(2), 73–84.
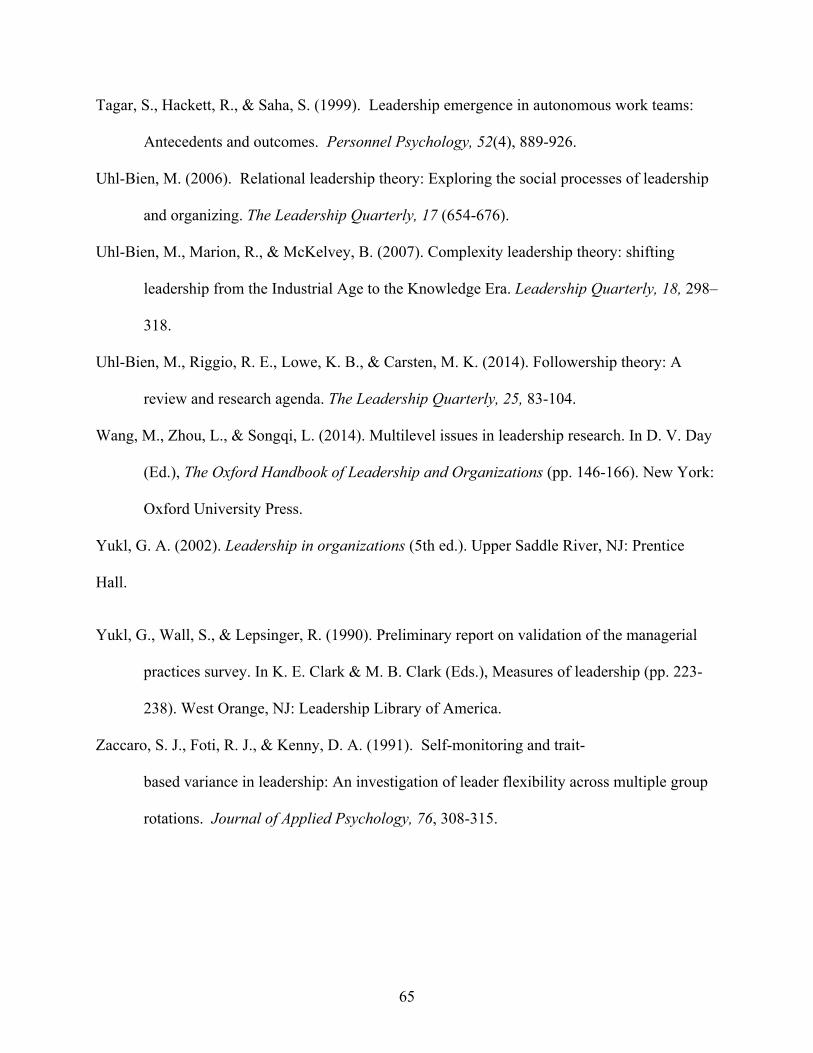
65
Tagar, S., Hackett, R., & Saha, S. (1999). Leadership emergence in autonomous work teams:
Antecedents and outcomes. Personnel Psychology, 52(4), 889-926.
Uhl-Bien, M. (2006). Relational leadership theory: Exploring the social processes of leadership
and organizing. The Leadership Quarterly, 17 (654-676).
Uhl-Bien, M., Marion, R., & McKelvey, B. (2007). Complexity leadership theory: shifting
leadership from the Industrial Age to the Knowledge Era. Leadership Quarterly, 18, 298–
318.
Uhl-Bien, M., Riggio, R. E., Lowe, K. B., & Carsten, M. K. (2014). Followership theory: A
review and research agenda. The Leadership Quarterly, 25, 83-104.
Wang, M., Zhou, L., & Songqi, L. (2014). Multilevel issues in leadership research. In D. V. Day
(Ed.), The Oxford Handbook of Leadership and Organizations (pp. 146-166). New York:
Oxford University Press.
Yukl, G. A. (2002). Leadership in organizations (5th ed.). Upper Saddle River, NJ: Prentice
Hall.
Yukl, G., Wall, S., & Lepsinger, R. (1990). Preliminary report on validation of the managerial
practices survey. In K. E. Clark & M. B. Clark (Eds.), Measures of leadership (pp. 223-
238). West Orange, NJ: Leadership Library of America.
Zaccaro, S. J., Foti, R. J., & Kenny, D. A. (1991). Self-monitoring and trait-
based variance in leadership: An investigation of leader flexibility across multiple group
rotations. Journal of Applied Psychology, 76, 308-315.
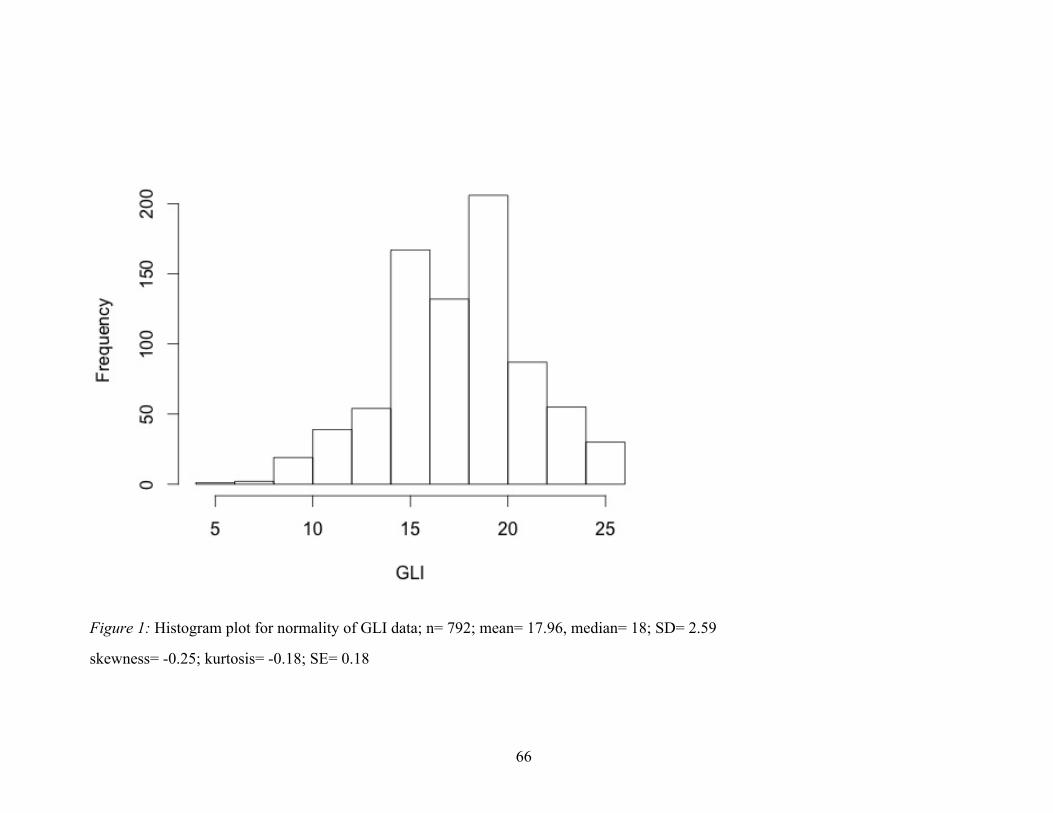
66
Figure 1: Histogram plot for normality of GLI data; n= 792; mean= 17.96, median= 18; SD= 2.59
skewness= -0.25; kurtosis= -0.18; SE= 0.18
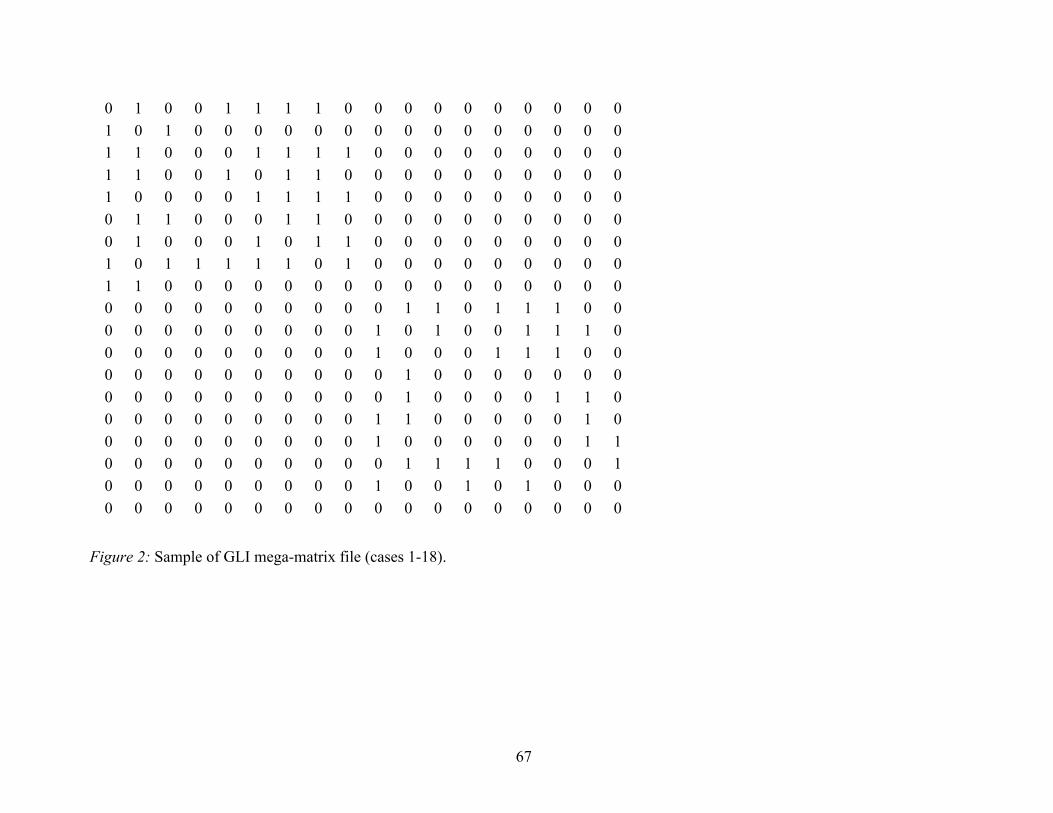
67
0 1 0 0 1 1 1 1 0 0 0 0 0 0 0 0 0 0 1 0 1 0 0 0 0 0 0 0 0 0 0 0 0 0 0 0 1 1 0 0 0 1 1 1 1 0 0 0 0 0 0 0 0 0 1 1 0 0 1 0 1 1 0 0 0 0 0 0 0 0 0 0 1 0 0 0 0 1 1 1 1 0 0 0 0 0 0 0 0 0 0 1 1 0 0 0 1 1 0 0 0 0 0 0 0 0 0 0 0 1 0 0 0 1 0 1 1 0 0 0 0 0 0 0 0 0 1 0 1 1 1 1 1 0 1 0 0 0 0 0 0 0 0 0 1 1 0 0 0 0 0 0 0 0 0 0 0 0 0 0 0 0 0 0 0 0 0 0 0 0 0 0 1 1 0 1 1 1 0 0 0 0 0 0 0 0 0 0 0 1 0 1 0 0 1 1 1 0 0 0 0 0 0 0 0 0 0 1 0 0 0 1 1 1 0 0 0 0 0 0 0 0 0 0 0 0 1 0 0 0 0 0 0 0 0 0 0 0 0 0 0 0 0 0 1 0 0 0 0 1 1 0 0 0 0 0 0 0 0 0 0 1 1 0 0 0 0 0 1 0 0 0 0 0 0 0 0 0 0 1 0 0 0 0 0 0 1 1 0 0 0 0 0 0 0 0 0 0 1 1 1 1 0 0 0 1 0 0 0 0 0 0 0 0 0 1 0 0 1 0 1 0 0 0 0 0 0 0 0 0 0 0 0 0 0 0 0 0 0 0 0 0
Figure 2: Sample of GLI mega-matrix file (cases 1-18).
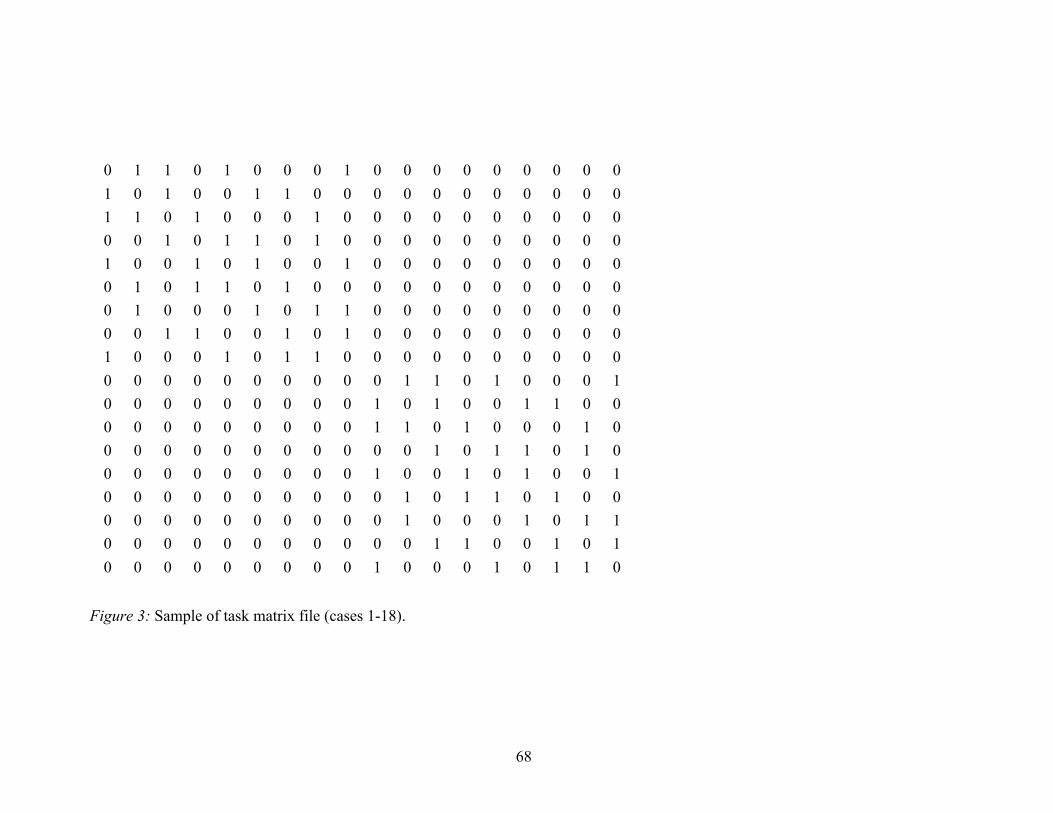
68
0 1 1 0 1 0 0 0 1 0 0 0 0 0 0 0 0 0 1 0 1 0 0 1 1 0 0 0 0 0 0 0 0 0 0 0 1 1 0 1 0 0 0 1 0 0 0 0 0 0 0 0 0 0 0 0 1 0 1 1 0 1 0 0 0 0 0 0 0 0 0 0 1 0 0 1 0 1 0 0 1 0 0 0 0 0 0 0 0 0 0 1 0 1 1 0 1 0 0 0 0 0 0 0 0 0 0 0 0 1 0 0 0 1 0 1 1 0 0 0 0 0 0 0 0 0 0 0 1 1 0 0 1 0 1 0 0 0 0 0 0 0 0 0 1 0 0 0 1 0 1 1 0 0 0 0 0 0 0 0 0 0 0 0 0 0 0 0 0 0 0 0 1 1 0 1 0 0 0 1 0 0 0 0 0 0 0 0 0 1 0 1 0 0 1 1 0 0 0 0 0 0 0 0 0 0 0 1 1 0 1 0 0 0 1 0 0 0 0 0 0 0 0 0 0 0 0 1 0 1 1 0 1 0 0 0 0 0 0 0 0 0 0 1 0 0 1 0 1 0 0 1 0 0 0 0 0 0 0 0 0 0 1 0 1 1 0 1 0 0 0 0 0 0 0 0 0 0 0 0 1 0 0 0 1 0 1 1 0 0 0 0 0 0 0 0 0 0 0 1 1 0 0 1 0 1 0 0 0 0 0 0 0 0 0 1 0 0 0 1 0 1 1 0
Figure 3: Sample of task matrix file (cases 1-18).
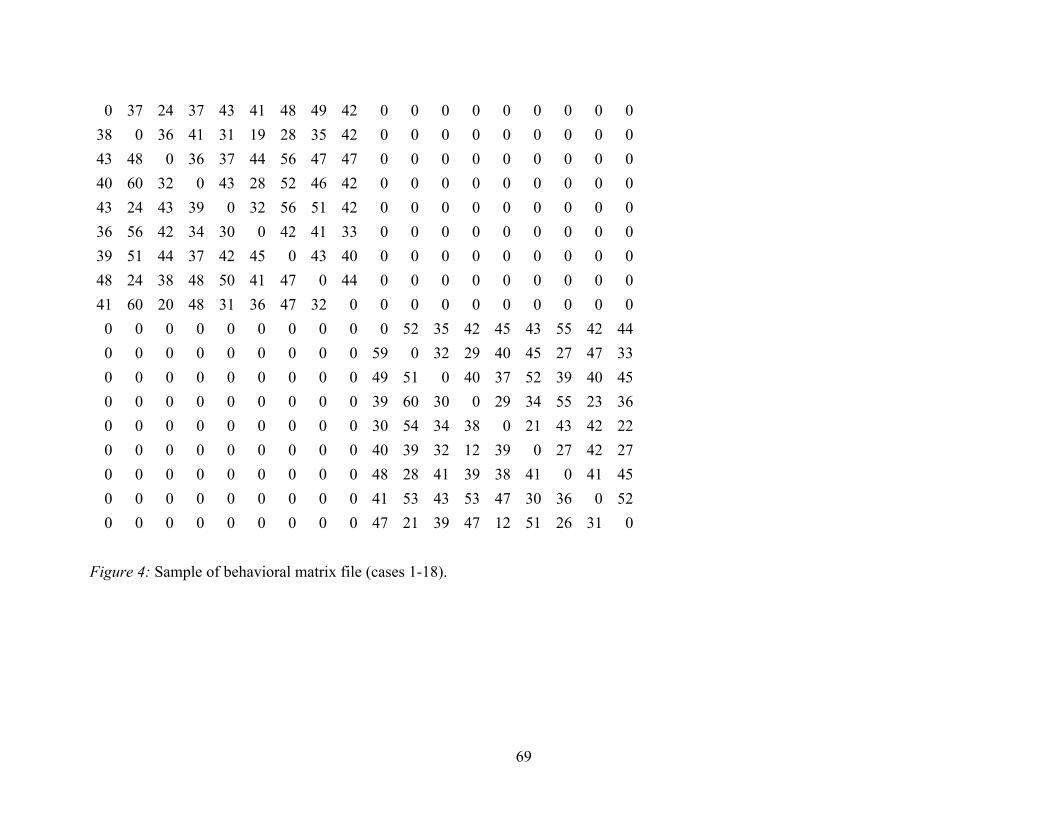
69
0 37 24 37 43 41 48 49 42 0 0 0 0 0 0 0 0 0 38 0 36 41 31 19 28 35 42 0 0 0 0 0 0 0 0 0 43 48 0 36 37 44 56 47 47 0 0 0 0 0 0 0 0 0 40 60 32 0 43 28 52 46 42 0 0 0 0 0 0 0 0 0 43 24 43 39 0 32 56 51 42 0 0 0 0 0 0 0 0 0 36 56 42 34 30 0 42 41 33 0 0 0 0 0 0 0 0 0 39 51 44 37 42 45 0 43 40 0 0 0 0 0 0 0 0 0 48 24 38 48 50 41 47 0 44 0 0 0 0 0 0 0 0 0 41 60 20 48 31 36 47 32 0 0 0 0 0 0 0 0 0 0 0 0 0 0 0 0 0 0 0 0 52 35 42 45 43 55 42 44 0 0 0 0 0 0 0 0 0 59 0 32 29 40 45 27 47 33 0 0 0 0 0 0 0 0 0 49 51 0 40 37 52 39 40 45 0 0 0 0 0 0 0 0 0 39 60 30 0 29 34 55 23 36 0 0 0 0 0 0 0 0 0 30 54 34 38 0 21 43 42 22 0 0 0 0 0 0 0 0 0 40 39 32 12 39 0 27 42 27 0 0 0 0 0 0 0 0 0 48 28 41 39 38 41 0 41 45 0 0 0 0 0 0 0 0 0 41 53 43 53 47 30 36 0 52 0 0 0 0 0 0 0 0 0 47 21 39 47 12 51 26 31 0
Figure 4: Sample of behavioral matrix file (cases 1-18).
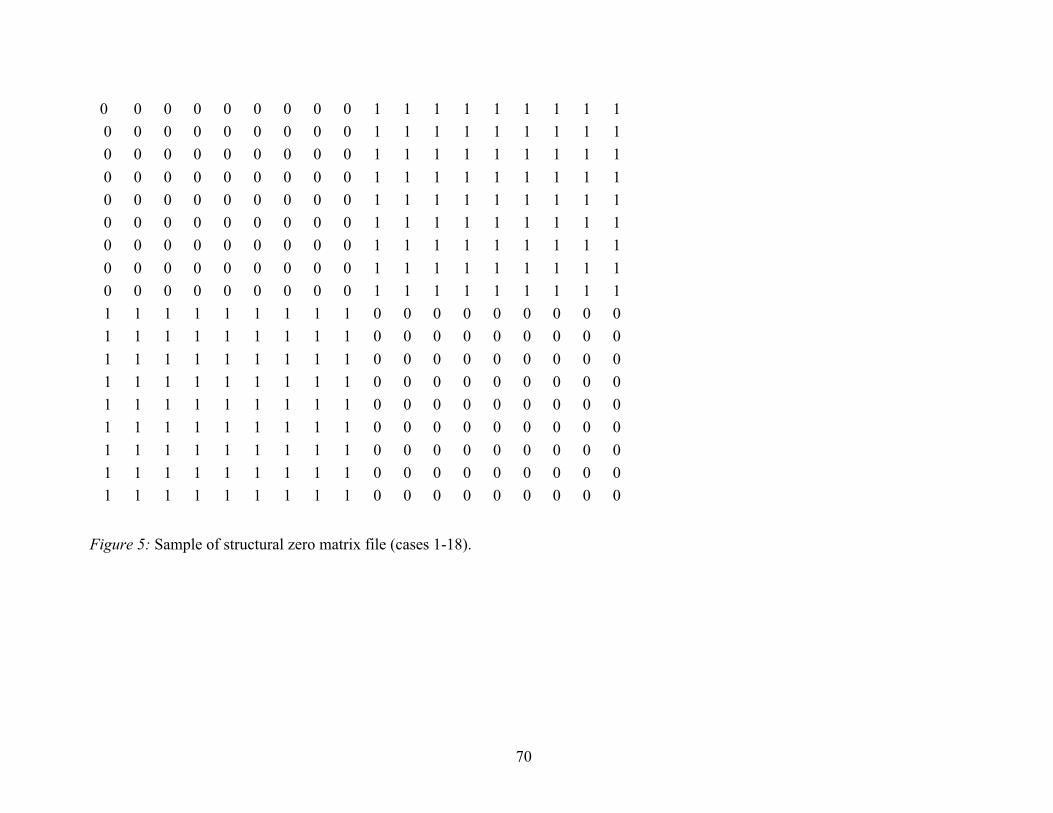
70
0 0 0 0 0 0 0 0 0 1 1 1 1 1 1 1 1 1 0 0 0 0 0 0 0 0 0 1 1 1 1 1 1 1 1 1 0 0 0 0 0 0 0 0 0 1 1 1 1 1 1 1 1 1 0 0 0 0 0 0 0 0 0 1 1 1 1 1 1 1 1 1 0 0 0 0 0 0 0 0 0 1 1 1 1 1 1 1 1 1 0 0 0 0 0 0 0 0 0 1 1 1 1 1 1 1 1 1 0 0 0 0 0 0 0 0 0 1 1 1 1 1 1 1 1 1 0 0 0 0 0 0 0 0 0 1 1 1 1 1 1 1 1 1 0 0 0 0 0 0 0 0 0 1 1 1 1 1 1 1 1 1 1 1 1 1 1 1 1 1 1 0 0 0 0 0 0 0 0 0 1 1 1 1 1 1 1 1 1 0 0 0 0 0 0 0 0 0 1 1 1 1 1 1 1 1 1 0 0 0 0 0 0 0 0 0 1 1 1 1 1 1 1 1 1 0 0 0 0 0 0 0 0 0 1 1 1 1 1 1 1 1 1 0 0 0 0 0 0 0 0 0 1 1 1 1 1 1 1 1 1 0 0 0 0 0 0 0 0 0 1 1 1 1 1 1 1 1 1 0 0 0 0 0 0 0 0 0 1 1 1 1 1 1 1 1 1 0 0 0 0 0 0 0 0 0 1 1 1 1 1 1 1 1 1 0 0 0 0 0 0 0 0 0
Figure 5: Sample of structural zero matrix file (cases 1-18).
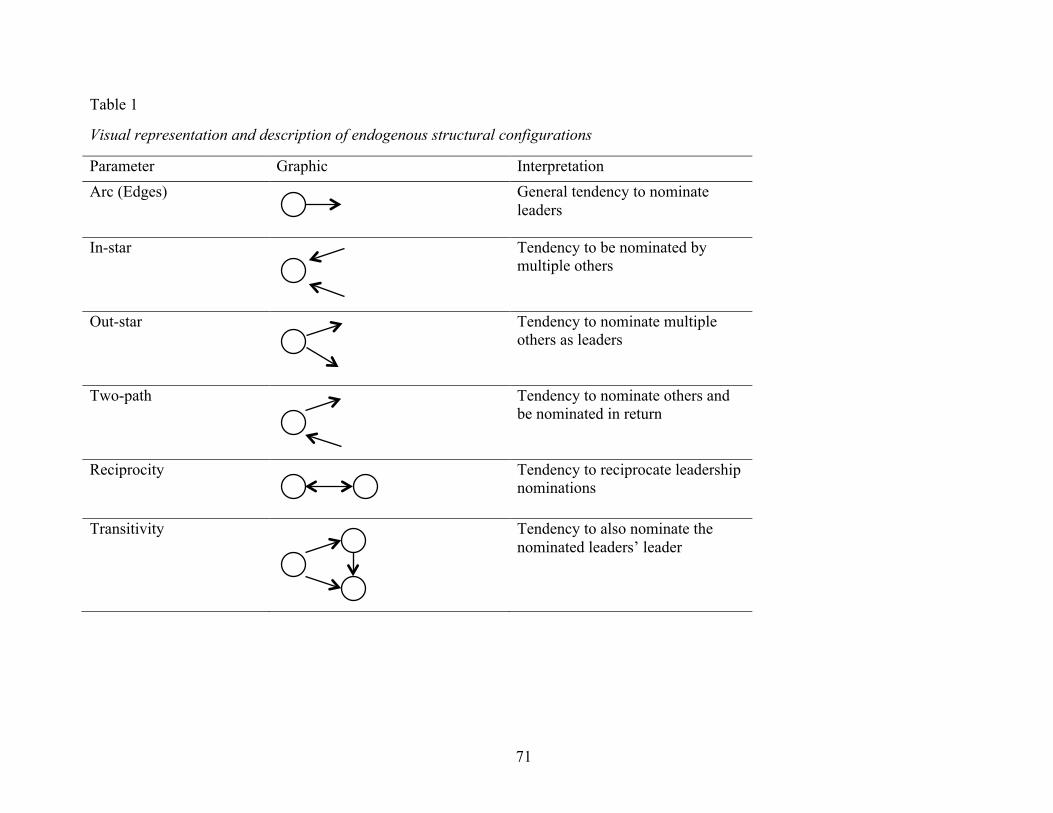
71
Table 1
Visual representation and description of endogenous structural configurations
Parameter Graphic Interpretation Arc (Edges) General tendency to nominate
leaders
In-star
Tendency to be nominated by multiple others
Out-star
Tendency to nominate multiple others as leaders
Two-path
Tendency to nominate others and be nominated in return
Reciprocity Tendency to reciprocate leadership nominations
Transitivity Tendency to also nominate the nominated leaders’ leader
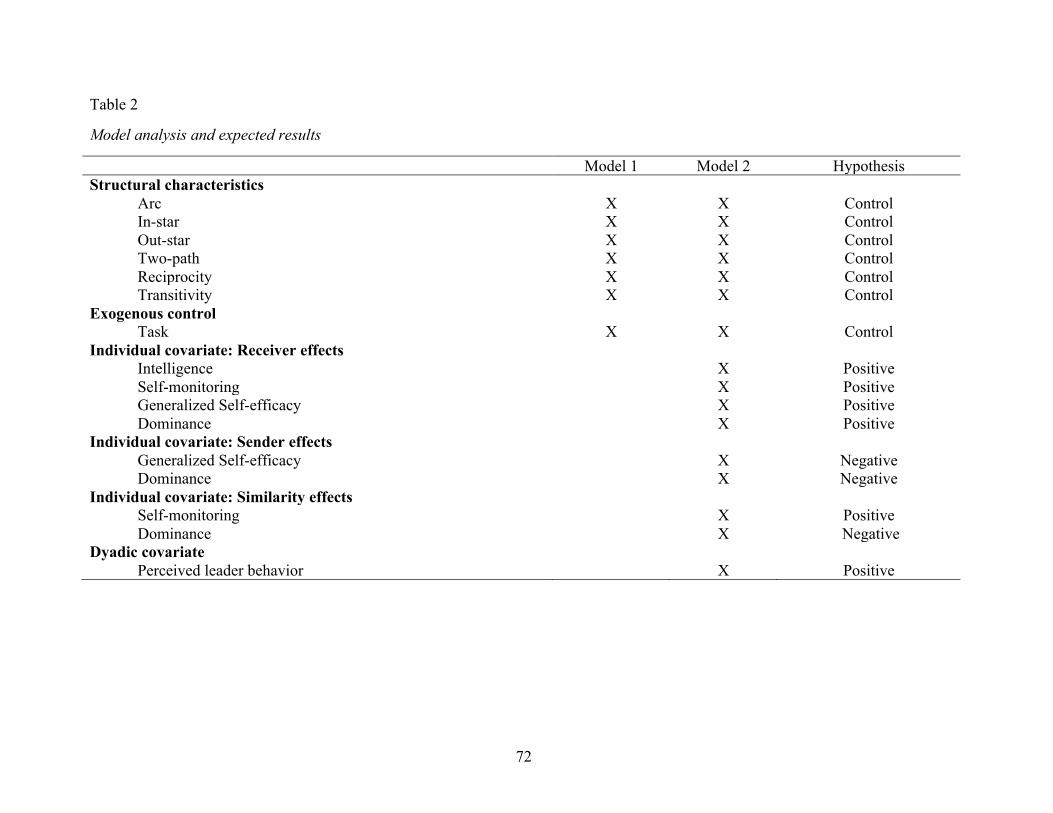
72
Table 2
Model analysis and expected results
Model 1 Model 2 Hypothesis Structural characteristics Arc X X Control In-star X X Control Out-star X X Control Two-path X X Control Reciprocity X X Control Transitivity X X Control Exogenous control Task X X Control Individual covariate: Receiver effects Intelligence X Positive Self-monitoring X Positive Generalized Self-efficacy X Positive Dominance X Positive Individual covariate: Sender effects Generalized Self-efficacy X Negative Dominance X Negative Individual covariate: Similarity effects Self-monitoring X Positive Dominance X Negative Dyadic covariate Perceived leader behavior X Positive
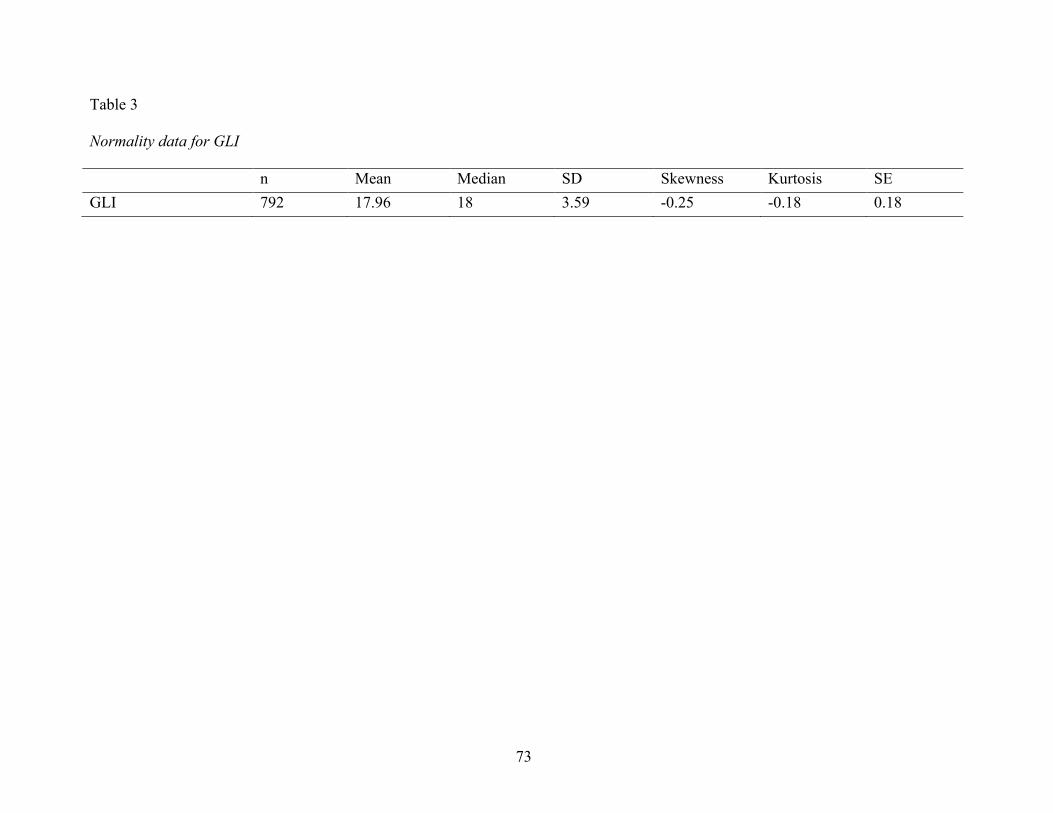
73
Table 3
Normality data for GLI
n Mean Median SD Skewness Kurtosis SE GLI 792 17.96 18 3.59 -0.25 -0.18 0.18
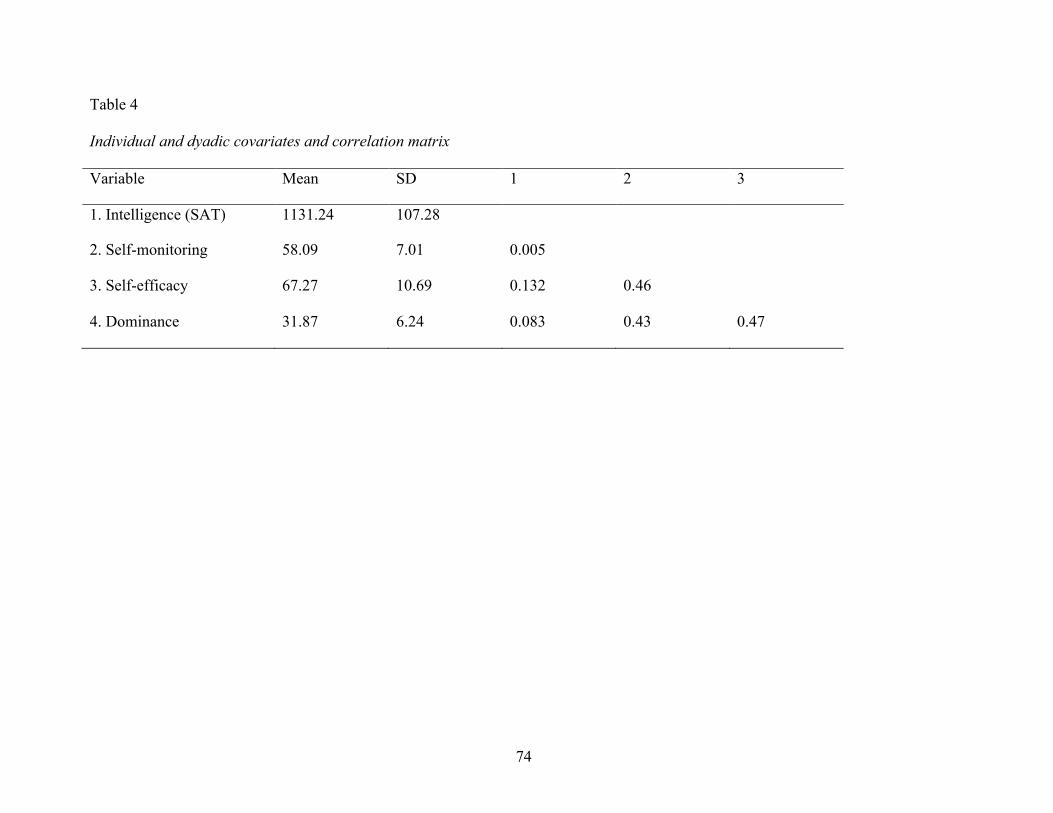
74
Table 4
Individual and dyadic covariates and correlation matrix
Variable Mean SD 1 2 3
1. Intelligence (SAT) 1131.24 107.28
2. Self-monitoring 58.09 7.01 0.005
3. Self-efficacy 67.27 10.69 0.132 0.46
4. Dominance 31.87 6.24 0.083 0.43 0.47
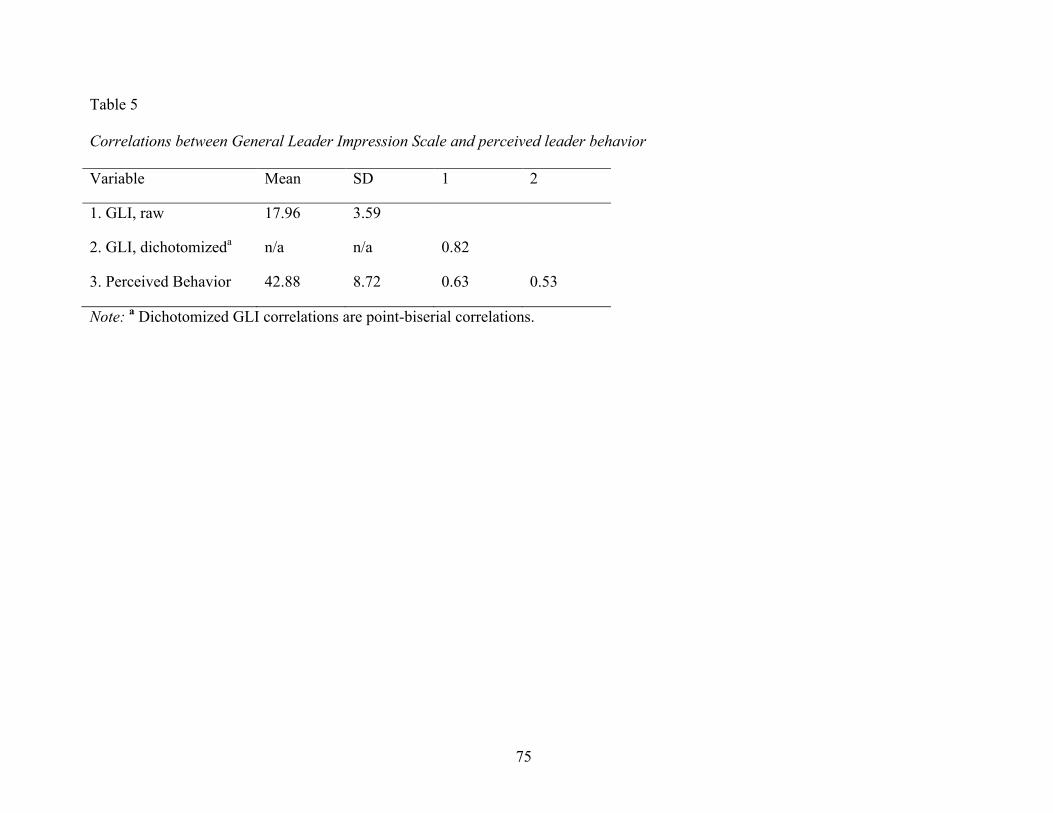
75
Table 5
Correlations between General Leader Impression Scale and perceived leader behavior
Variable Mean SD 1 2
1. GLI, raw 17.96 3.59
2. GLI, dichotomizeda n/a n/a 0.82
3. Perceived Behavior 42.88 8.72 0.63 0.53
Note: a Dichotomized GLI correlations are point-biserial correlations.
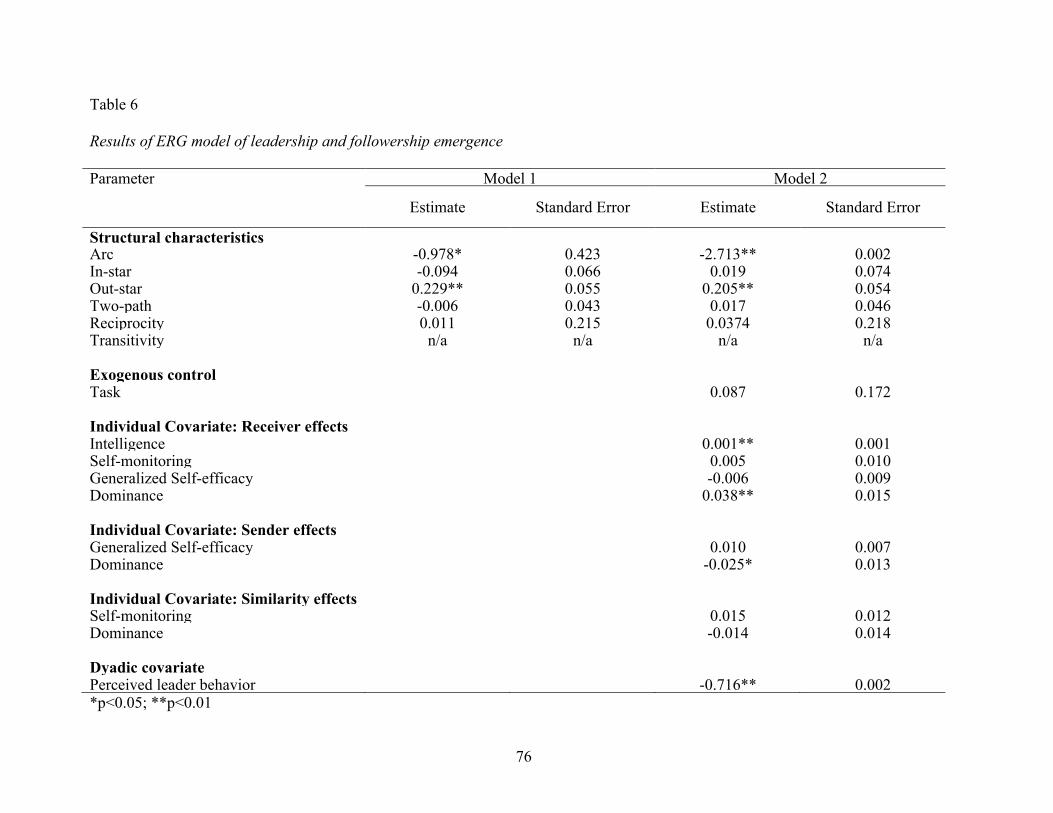
76
Table 6
Results of ERG model of leadership and followership emergence
Parameter Model 1 Model 2
Estimate Standard Error Estimate Standard Error
Structural characteristics Arc -0.978* 0.423 -2.713** 0.002 In-star -0.094 0.066 0.019 0.074 Out-star 0.229** 0.055 0.205** 0.054 Two-path -0.006 0.043 0.017 0.046 Reciprocity 0.011 0.215 0.0374 0.218 Transitivity n/a n/a n/a n/a Exogenous control Task 0.087 0.172 Individual Covariate: Receiver effects Intelligence 0.001** 0.001 Self-monitoring 0.005 0.010 Generalized Self-efficacy -0.006 0.009 Dominance 0.038** 0.015 Individual Covariate: Sender effects Generalized Self-efficacy 0.010 0.007 Dominance -0.025* 0.013 Individual Covariate: Similarity effects Self-monitoring 0.015 0.012 Dominance -0.014 0.014 Dyadic covariate Perceived leader behavior -0.716** 0.002 *p<0.05; **p<0.01
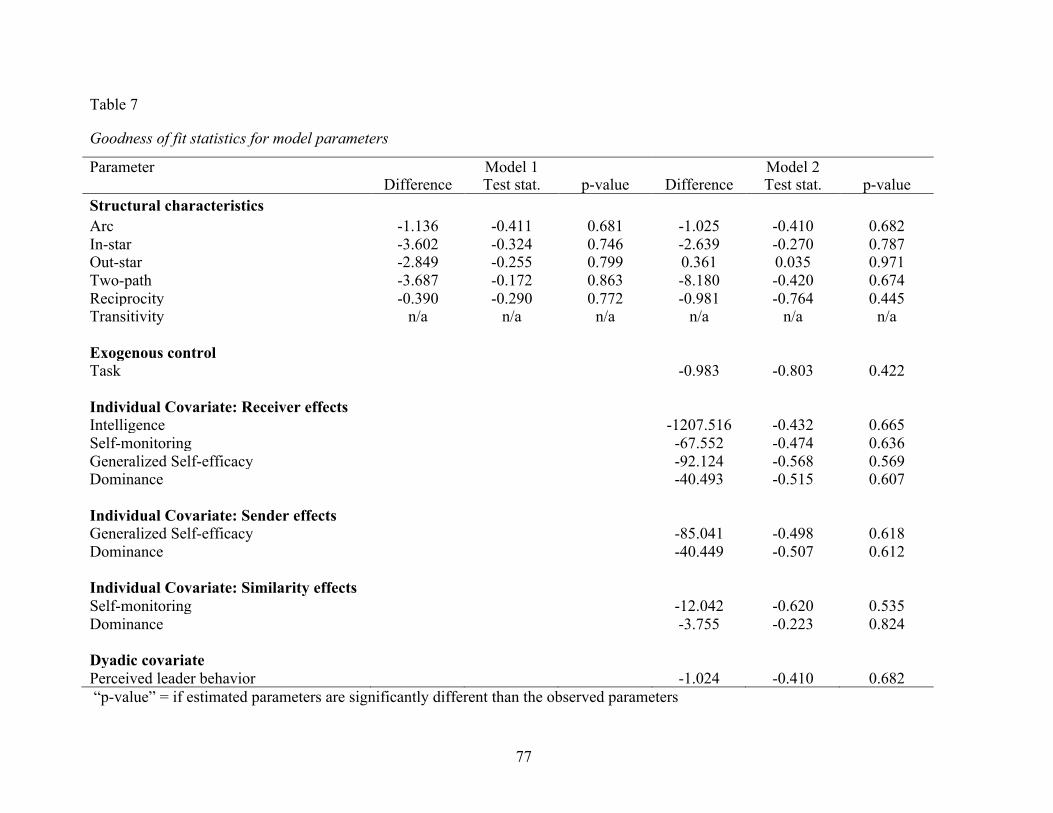
77
Table 7
Goodness of fit statistics for model parameters
Parameter Model 1 Model 2 Difference Test stat. p-value Difference Test stat. p-value Structural characteristics Arc -1.136 -0.411 0.681 -1.025 -0.410 0.682 In-star -3.602 -0.324 0.746 -2.639 -0.270 0.787 Out-star -2.849 -0.255 0.799 0.361 0.035 0.971 Two-path -3.687 -0.172 0.863 -8.180 -0.420 0.674 Reciprocity -0.390 -0.290 0.772 -0.981 -0.764 0.445 Transitivity n/a n/a n/a n/a n/a n/a Exogenous control Task -0.983 -0.803 0.422 Individual Covariate: Receiver effects Intelligence -1207.516 -0.432 0.665 Self-monitoring -67.552 -0.474 0.636 Generalized Self-efficacy -92.124 -0.568 0.569 Dominance -40.493 -0.515 0.607 Individual Covariate: Sender effects Generalized Self-efficacy -85.041 -0.498 0.618 Dominance -40.449 -0.507 0.612 Individual Covariate: Similarity effects Self-monitoring -12.042 -0.620 0.535 Dominance -3.755 -0.223 0.824 Dyadic covariate Perceived leader behavior -1.024 -0.410 0.682 “p-value” = if estimated parameters are significantly different than the observed parameters
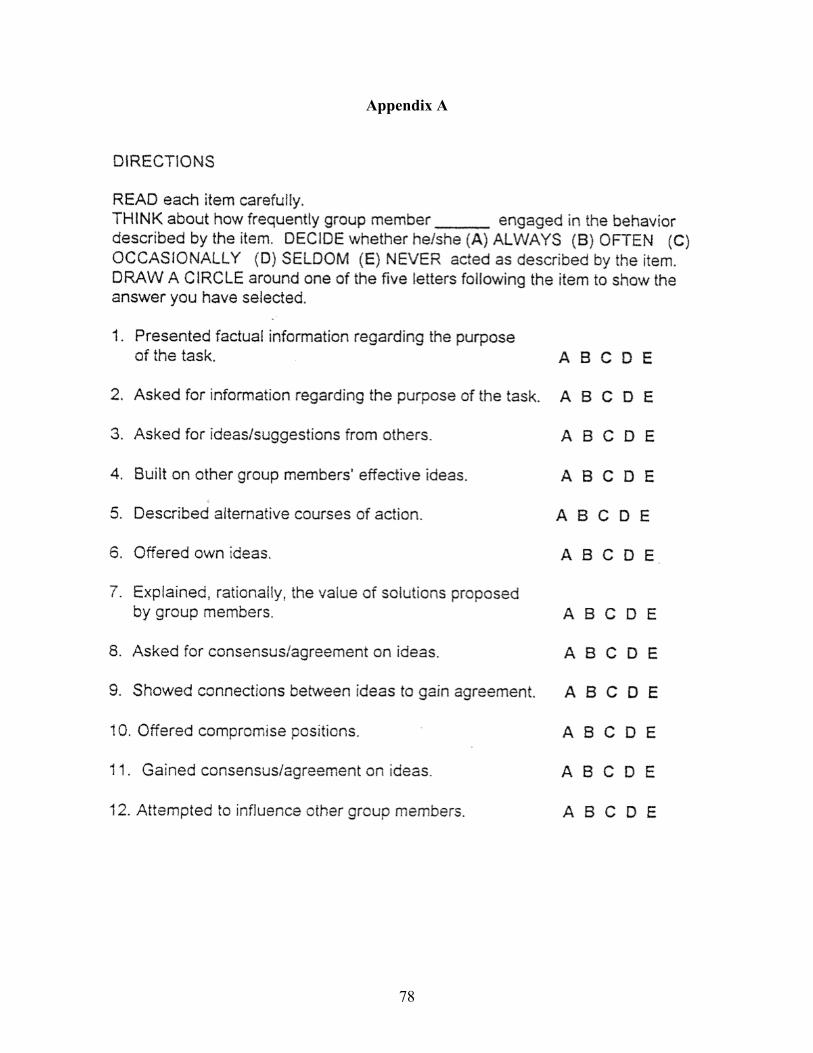
78
Appendix A

79
Appendix B