Embed Size (px)
Citation preview
European Journal of Pharmaceutical Sciences 14 (2001) 115–122www.elsevier.nl / locate /ejps
A dynamic in vitro lipolysis modelI. Controlling the rate of lipolysis by continuous addition of calcium
a a , a a ,1*¨Niels Hønberg Zangenberg , Anette Mullertz , Henning Gjelstrup Kristensen , Lars HovgaardaDepartment of Pharmaceutics, The Royal Danish School of Pharmacy, Universitetsparken 2, DK-2100 Copenhagen, Denmark
Received 4 December 2000; received in revised form 20 April 2001; accepted 15 May 2001
Abstract
Lipolysis by pancreatic lipase was investigated with the aim to establish an in vitro lipolysis model, which can be used to investigatethe dissolution of poorly soluble lipophilic drug substances at controlled hydrolysis rates. The effects of three experimental parameters —
21the concentrations of bile salts and Ca and the lipase activity — were investigated. The effect on the rate of hydrolysis of emulsifiedsoybean oil was investigated in experiments in a pH-stat at pH 6.5 and 378C. The free fatty acids produced by the hydrolysis were titratedat pH 6.5. It was shown that all three investigated parameters influence the initial rate of hydrolysis, whereas only the lipase activity and
21the concentration of Ca affect the subsequent stages. It was also shown that the rate of lipolysis can be controlled by the rate of adding21Ca . Thus, it is possible to design an in vitro model using readily available and inexpensive materials in which the hydrolysis rate can be
21controlled by the continuous addition of Ca . 2001 Elsevier Science B.V. All rights reserved.
Keywords: Dissolution; Pancreatic lipase; Rate of lipolysis; Bile salts; Poorly water-soluble drug substances
1. Introduction media, it has been shown that the dissolution rate inaspirated gastric fluids does not correlate fully with the in
The bioavailability of poorly water-soluble, lipophilic vitro dissolution rates in the simulated media (Pedersen etdrug substances belonging to Class II of the Bio- al., 2000b).pharmaceutics Classification System (Amidon et al., 1995), Another important aspect is that the complex mediais affected by the simultaneous administration of food simulating the fed state are static compared to in vivo(Ogunbona et al., 1985; Charman et al., 1993; Humber- conditions where the composition of fluids of the smallstone et al., 1996). In order to simulate the in vivo intestine is changing with the progress of lipolysis. Byconditions in the fasted and fed state, complex dissolution lipolysis, triglycerides (TG) are hydrolysed into FA,media have been proposed to provide an in vitro test that diglycerides (DG) and monoglycerides (MG). Togethermay be correlated with in vivo data (Naylor et al., 1995; with BS, phospholipids and cholesterol, the lipolysisDressman et al., 1998; Galia et al., 1998; Dressman and products form micellar structures and vesicles with aReppas, 2000; Pedersen et al., 2000a). The proposed lipophilic core and a hydrophilic surface (Patton anddissolution media are composed of naturally occurring Carey, 1979; Patton et al., 1985; Hernell et al., 1990). Thesurfactants and buffering agents. The solutions are pre- dissolution and the increased postprandial absorption ofpared with bile salts (BS) (glycocholate or taurocholate), lipophilic drug substances are usually attributed to thefatty acids (FA) and a phospholipid [phosphatidyl choline solubilisation capacity of these micellar structures and(PC)]. In order to ensure that solutions are standardised vesicles.with regard to their solubilisation capacity, the components There are two essential requirements to a dynamicmust be of high purity and are thus very expensive to dissolution model, which incorporates the lipolysis ofpurchase. Though the dissolution of Class II drug sub- lipids. First, the FA produced by the lipolysis must bestances can be monitored and reproduced using such removed continuously, mainly because FA, as an end
product, inhibits the lipolysis of TG. Second, the rate ofthe lipolysis must be controllable in order to obtain*Corresponding author. Tel.: 145-35-306-440; fax: 145-35-306-031.reproducible results.¨E-mail address: [email protected] (A. Mullertz).
1Present address: Galenica ApS, Hørsholm, Denmark. It is important to simulate the dynamics of the luminal
0928-0987/01/$ – see front matter 2001 Elsevier Science B.V. All rights reserved.PI I : S0928-0987( 01 )00169-5
116 N.H. Zangenberg et al. / European Journal of Pharmaceutical Sciences 14 (2001) 115 –122
fluids when developing an in vitro lipolysis dissolution Nycomed Pharma (Roskilde, Denmark). The content of PCmodel. Such a model will provide information about the was determined as choline by using an enzymatic kit, MPRtransport of poorly soluble drug substances into the 2 manufactured by Boehringer Mannheim (Mannheim,
21aqueous phase by solubilisation in the micellar structures Germany). The content of Ca was determined by atomicresulting from lipolysis. Similar lipolysis models have absorption spectroscopy. Medilab A/S (Copenhagen, Den-been used previously to study the enzymatic hydrolysis of mark) performed the latter two analyses. The content ofemulsified lipids by pancreatic lipase (triacylglycerol lip- free FA in the soybean oil was determined by TLC–FID asase – EC3.1.1.3.) (Patton and Carey, 1979; Reymond and described in Zangenberg et al. (submitted).Sucker, 1988; MacGregor et al., 1997).
The aim of the present investigation has been to find 2.2. Preparation of the emulsion for the second seriespractical solutions both to the above-mentioned require-ments, i.e., controlling the lipolysis rate and removing FA. The emulsion contained 200 mg soybean oil /ml. TweenThe study is divided into two series: in the first series, 80 and Span 80 were used as emulsifiers, 1% (w/v) each.effects of three parameters likely to control the lipolysis Methyl-parahydroxybenzoate, propyl-parahydroxyben-rate are investigated. The three parameters are the con- zoate and a-tocopherol were used as preservatives. The
21centration of BS, the concentration of Ca and the lipase emulsion was prepared using an Ultra Turrax T25 with aactivity (MacGregor et al., 1997). Based on the results D25N-25Gm shaft for 5 min at 24 000 rpm at 808C. Thefrom the first series, the effect of continuous addition of particle size was measured in a Malvern Mastersizer
21Ca on the lipolysis rate was investigated more spe- (Malvern Instruments Ltd., Malvern, UK) with an RF-300cifically in the second series. lens.
2.3. Preparation of pancreatin suspension2. Materials and methods
In order to obtain the required activity, an accurately2.1. Chemicals weighed amount of pancreatin was suspended in 125.0 ml
of 378C purified water and mixed thoroughly. The suspen-Pancreatin (porcine) (P 1625), and bile extract (porcine) sion was then centrifuged for 7 min at 4000 rpm at 378C in
(B 8631) were purchased from Sigma (St. Louis, USA). a Labofuge 400R, and the pH in the supernatant wasSoybean oil was purchased from Unikem (Copenhagen, adjusted to 6.5 using 1.00 M NaOH. A 100.0-ml aliquotDenmark) and a-tocopherol from BASF AS (Asker, Nor- was withdrawn and used in the model. The suspension
way) and both were of pharmaceutical grade. Intralipid must be freshly prepared (within 15 min) in order to avoid(200 mg/ml) was manufactured by Fresenius Kabi denaturation of the lipase.(Copenhagen, Denmark). CaCl ?2H O of analytical-grade,2 2
manufactured by Merck (Darmstadt, Germany), was used. 2.4. Preparation of the lipolysis modelAll other chemicals were of analytical-grade.
The lipase activity of pancreatin was determined as 2.4.1. First seriesdescribed in The US Pharmacopoeial 24 (2000). Pan- The compositions of the models are listed in Table 1.creatin is assumed to contain equivalent moles of colipase The models were prepared by mixing purified water, bufferand lipase (Patton et al., 1978). (Trizma maleate and NaCl, pH 6.5), bile extract dissolved
21 The BS content in the bile extract was determined by in purified water, Ca -solution and Intralipid in ausing an enzymatic kit, i.e., Enzabile purchased from thermostated beaker (378C) and allowing the mixture to
Table 1aExperimental values for the first series of lipolysis experiments
1Na mM 150Trizma–maleate mM 2
bTG mM 15.3
Lower limit Upper limit Centre pointLipase activity units /ml 270 1340 800
cBS mM 1.5 6.6 4.121Ca mM 4 20 12
Volume (t50 min) ml 300a 1 21 3Standard-conditions for Na , Trizma maleate and TG. Investigated intervals for lipase activity, BS and Ca in the randomised, orthogonal 2 -central
composite design with five repetitions of the centre point.b Hernell et al. (1990); Janowitz et al. (1990).c ¨Sjovall (1959); Hernell et al. (1990); Lindahl et al. (1997).
N.H. Zangenberg et al. / European Journal of Pharmaceutical Sciences 14 (2001) 115 –122 117
21equilibrate. The pH was adjusted to 6.5 with 1.00 M centration after a 40-min experiment in which Ca isNaOH. The pancreatin suspension was prepared simul- added at a rate of 0.135 mmol /min.taneously and added to the freshly prepared substrate. At In addition, a lower (4 mM) concentration and a higherthis point, the pH-stat was started. (16 mM) concentration of BS were investigated under
21standard conditions and with a Ca -rate at 0.135 mmol /min.
2.4.2. Second seriesThe lipolysis models were prepared similarly to those in
the first series, with the exception of the emulsion (pre-21pared as described in Section 2.2) and the 0.5 M Ca -
3. Results21solution. The Ca -solution was dispensed with a pump,which was started upon addition of the pancreatin suspen-
3.1. Establishing the modelsion.
In both series, a pH-stat (Titrino 718 with burette fromThe concentrations of the various model components
Metrohm, Herisau, Switzerland) was used to maintain pHused are listed in Tables 1 and 2. The concentrations and
at 6.5. Data were collected using the software Tinet,investigated intervals were chosen as a compromise be-
version 2.3, also from Metrohm. The volume of the addedtween in vivo values as reported in the literature and ease
1.00 M NaOH reflected the amount of FA generated by theof experimentation in the laboratory.
lipolysis. The amount of titrated FA, as a function of time,A low Trizma maleate concentration (2 mM) was
was depicted and interpreted as a measure of the hy-chosen in order to ensure that ionised FA were able to
drolysis of TG by the lipase.change the pH and is similar to that used by other authors(Patton and Carey, 1981; Larsson and Erlanson-Al-
¨2.5. Experimental design bertsson, 1986; Lindstrom et al., 1988; Reymond andSucker, 1988).
The pH was set at 6.5 as a compromise between the2.5.1. First series
optimum for the pancreas lipase, which is between 6 andThe purpose of the first series was to investigate the
10 (Gargouri et al., 1989), and the measured duodenal pH,21effects of the concentration of BS, Ca and lipase activitywhich is around 5.0–5.5 during a test meal (Zentler-Munro
on the lipolysis rate. The experiments were designed as aet al., 1984; Dressman et al., 1990; Carriere et al., 1993).3randomised, orthogonal 2 -central composite design with 21The concentration of Ca in the fasted state is 0.5–3
five repetitions of the centre point, in a total of 19mM in the duodenum (Hofmann and Mysels, 1992;
experiments. This design allows the investigation of aLindahl et al., 1997), and the concentration in the fed state
large interval for each parameter with relatively few 21is highly dependent on the concentration in the food. Caexperiments. Statgraphics 7.0 (Manugistics, Inc., Rock-
is necessary for the activity of pancreatic lipase and theville, MD, USA) was used to design and statistically
rate is highly dependent on the concentration. A largeevaluate the results. The investigated concentrations are
concentration interval (4–20 mM) was investigated inlisted in Table 1.
order to provide experimental variation.Several groups have reported the concentration of BS in
2.5.2. Second series the duodenum in the postprandial state. Mean values are21Three different rates for adding Ca were investigated typically between 5 and 15 mM, depending on the time
(see Table 2). Two other experiments were conducted with after ingestion of the meal, with peak values up to 40 mM21 21static concentrations of Ca . The first with [Ca ]50.0 ¨(Sjovall, 1959; Fausa, 1974; Westergaard, 1977; Rautureau
21mM and the second with [Ca ]517.4 mM. The con- et al., 1981; Hernell et al., 1990). BS concentrations in the21centration of 17.4 mM Ca corresponds to the con- duodenum of 3–7 mM during the fasted state have been
¨reported (Sjovall, 1959; Hernell et al., 1990; Lindahl et al.,1997). An interval of 1.5–6.6 mM was investigated in thefirst series, while concentrations ranged from 4 to 16 mM
Table 2 BS in the second series.Experimental values for the second series of lipolysis experiments
Pancreatic lipase is present in the duodenum in excess.1Na mM 150 ¨Arnesjo et al. (1969) measured an activity of 163 units /ml
Trizma maleate mM 2 in aspirates from the duodenum and upper jejunum in theTG mM 30.5
fed state. According to Patton (1981), the activity ofLipase activity units /ml 810. 271–2 10 M pancreatic lipase and colipase in intestinalBS mM 8
21 21Ca mmol Ca /min 0.072/0.135/0.181 fluids is between 150 and 300 units /ml. In order to ensurelipase activity in excess, an interval of 270–1340 units /ml
Volume (t50 min) ml 300 was investigated.
118 N.H. Zangenberg et al. / European Journal of Pharmaceutical Sciences 14 (2001) 115 –122
Bile extract and pancreatin of porcine origin were¨chosen. According to Patton (1981), Borgstrom and Erlan-
son-Albertsson (1984) and Verger (1984), the replacementof human pancreatic lipase and colipase with porcinepancreatic lipase and colipase is generally accepted.
3.2. Characterisation of pancreatin, bile extract, soybeanoil, and emulsions
The lipase activity in pancreatin was 12 units /mgpancreatin. One unit is equivalent to one microequivalentFA hydrolysed per min. The BS content in the bile extractwas determined to 0.5060.05 g BS/g bile extract. ThePC-concentration was 6% (w/w). In human and porcinebile, more than 95% of the phospholipids are PC (Alvaroet al., 1986). These concentrations approximate 13 molesof BS to 1 mole of PC. Ratios found in human bile arebetween 3 and 4 moles of BS and 1 mole of PC (Carey and
21Small, 1978; Lee and Nicholls, 1986). The content of Cawas determined to be less than 0.06% (w/w). No free FAwere detected in the soybean oil.
The particle size of Intralipid was measured with theMastersizer S. The distribution of the particle size wasunimodal and the mean size was 0.41 mm with a spanvalue of 0.80 hspan5[d(x,0.9)2d(x,0.1)] /d(x,0.5)j. As faras the emulsion for the second series is concerned, theparticle size distribution was unimodal with a meanparticle size of 1.59 mm and a span value of 1.6.
3.3. First series (titration of FA)
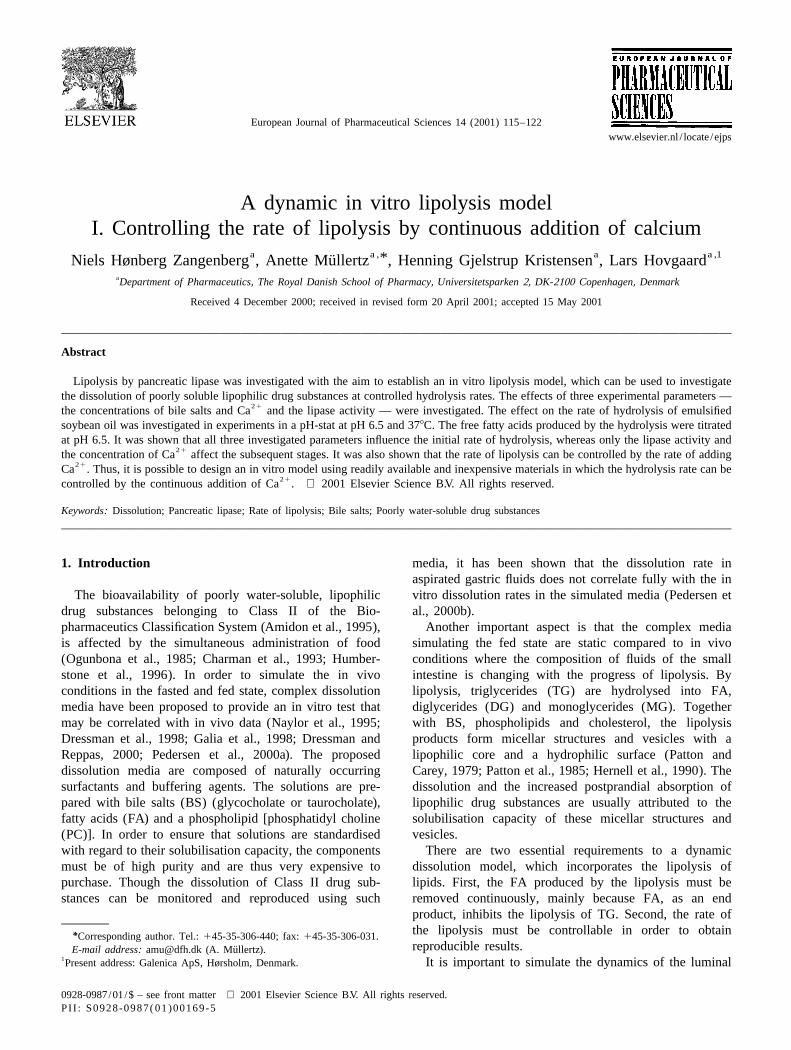
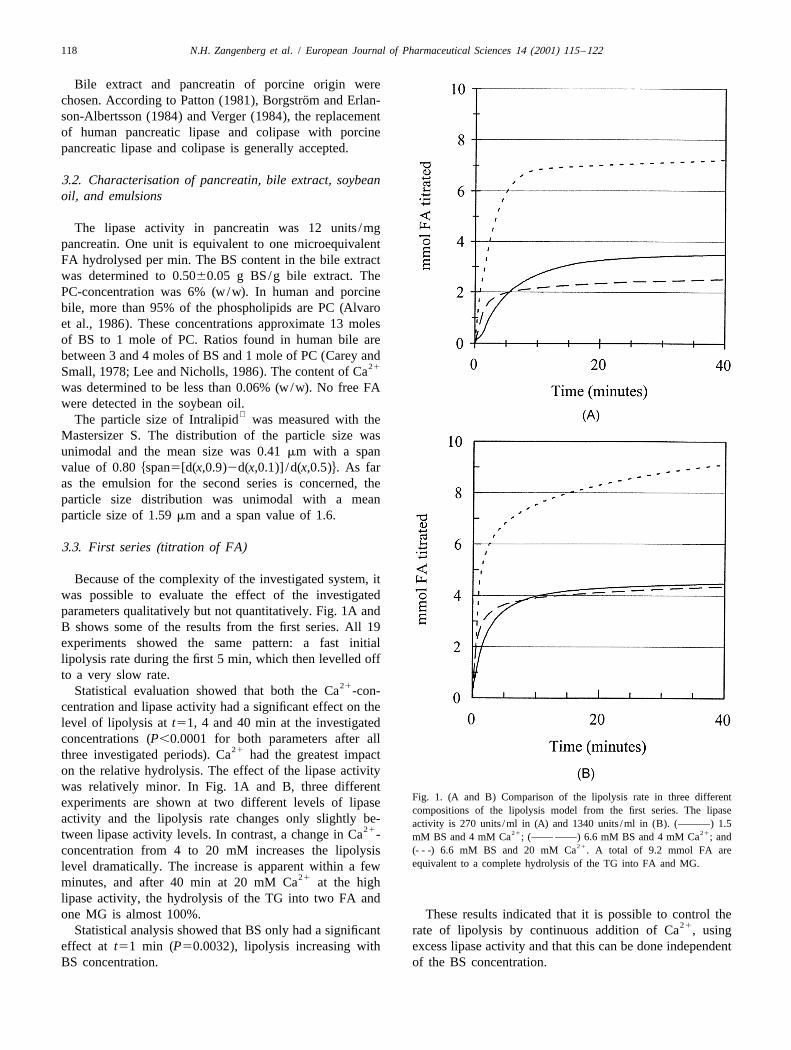
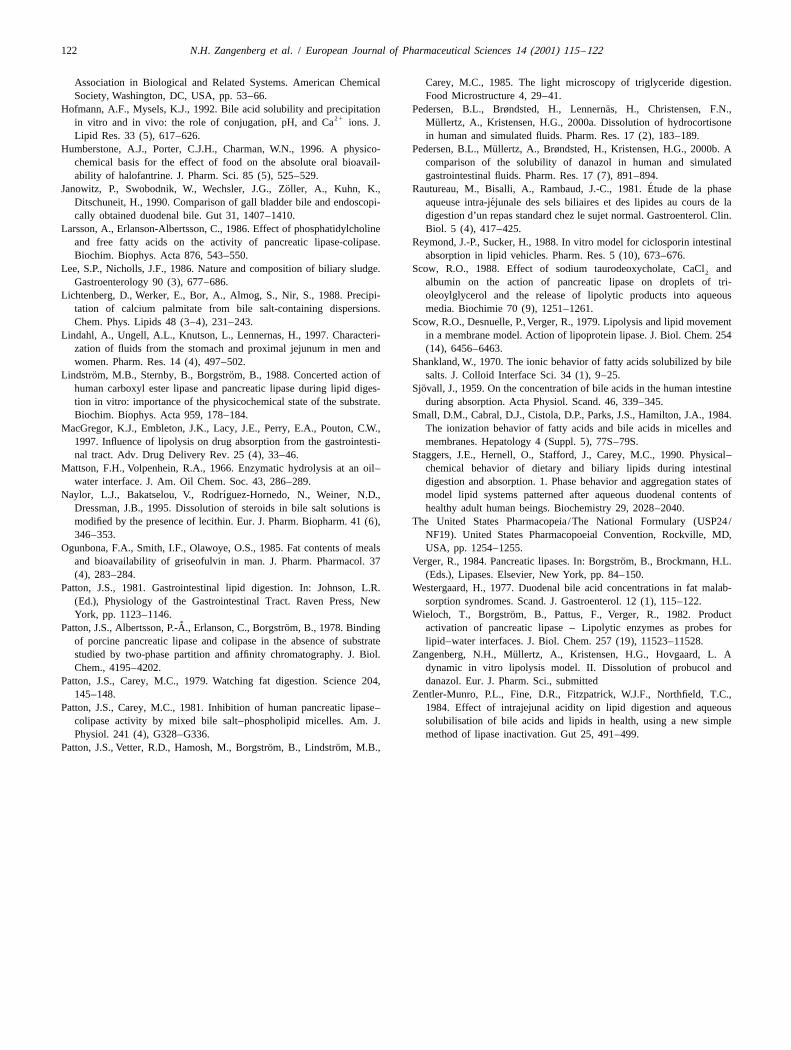
Because of the complexity of the investigated system, itwas possible to evaluate the effect of the investigatedparameters qualitatively but not quantitatively. Fig. 1A andB shows some of the results from the first series. All 19experiments showed the same pattern: a fast initiallipolysis rate during the first 5 min, which then levelled offto a very slow rate.
21Statistical evaluation showed that both the Ca -con-centration and lipase activity had a significant effect on thelevel of lipolysis at t51, 4 and 40 min at the investigatedconcentrations (P,0.0001 for both parameters after all
21three investigated periods). Ca had the greatest impacton the relative hydrolysis. The effect of the lipase activitywas relatively minor. In Fig. 1A and B, three different
Fig. 1. (A and B) Comparison of the lipolysis rate in three differentexperiments are shown at two different levels of lipasecompositions of the lipolysis model from the first series. The lipase
activity and the lipolysis rate changes only slightly be- activity is 270 units /ml in (A) and 1340 units /ml in (B). (———) 1.521 21 21tween lipase activity levels. In contrast, a change in Ca - mM BS and 4 mM Ca ; (—— ——) 6.6 mM BS and 4 mM Ca ; and
21(- - -) 6.6 mM BS and 20 mM Ca . A total of 9.2 mmol FA areconcentration from 4 to 20 mM increases the lipolysisequivalent to a complete hydrolysis of the TG into FA and MG.level dramatically. The increase is apparent within a few
21minutes, and after 40 min at 20 mM Ca at the highlipase activity, the hydrolysis of the TG into two FA andone MG is almost 100%. These results indicated that it is possible to control the
21Statistical analysis showed that BS only had a significant rate of lipolysis by continuous addition of Ca , usingeffect at t51 min (P50.0032), lipolysis increasing with excess lipase activity and that this can be done independentBS concentration. of the BS concentration.
N.H. Zangenberg et al. / European Journal of Pharmaceutical Sciences 14 (2001) 115 –122 119
213.4. Second series (continuous addition of Ca )
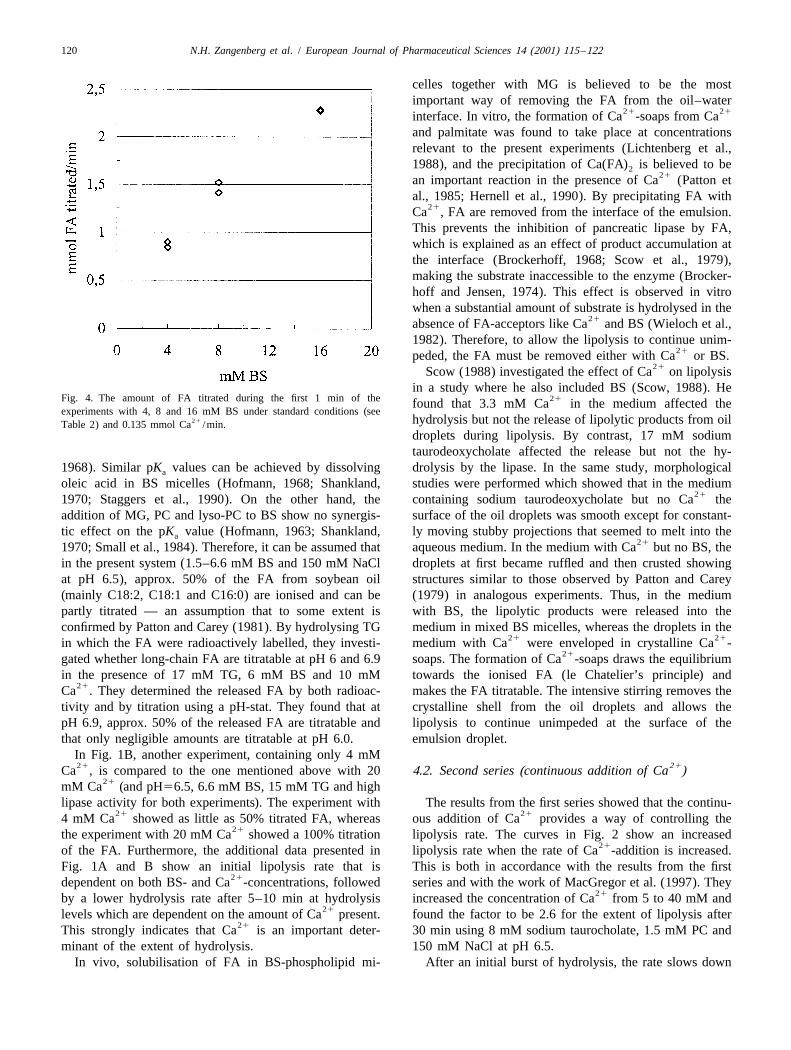
Fig. 2 shows the lipolysis in five experiments. Experi-ments A, B and C compare the lipolysis at three different
21Ca -addition rates, and show that if the addition rate isincreased, the rate of lipolysis increases as well. After aninitial high rate, the lipolysis rate slows down and becomesalmost linear after approximately 5 min for all three rates
21of Ca -addition. In experiment E, the initial concentration21of Ca was 17.4 mM, corresponding to the concentration
after 40 min in experiment B. The final extent of lipolysiswas the same in these two experiments. Experiment D is
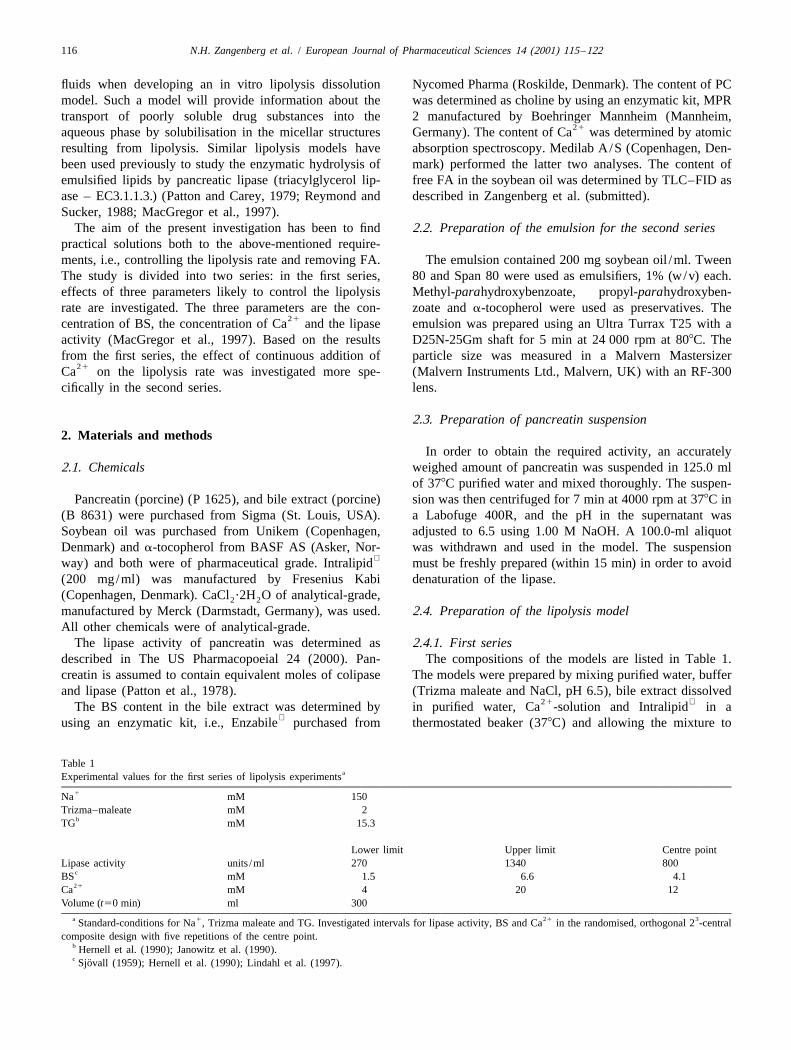
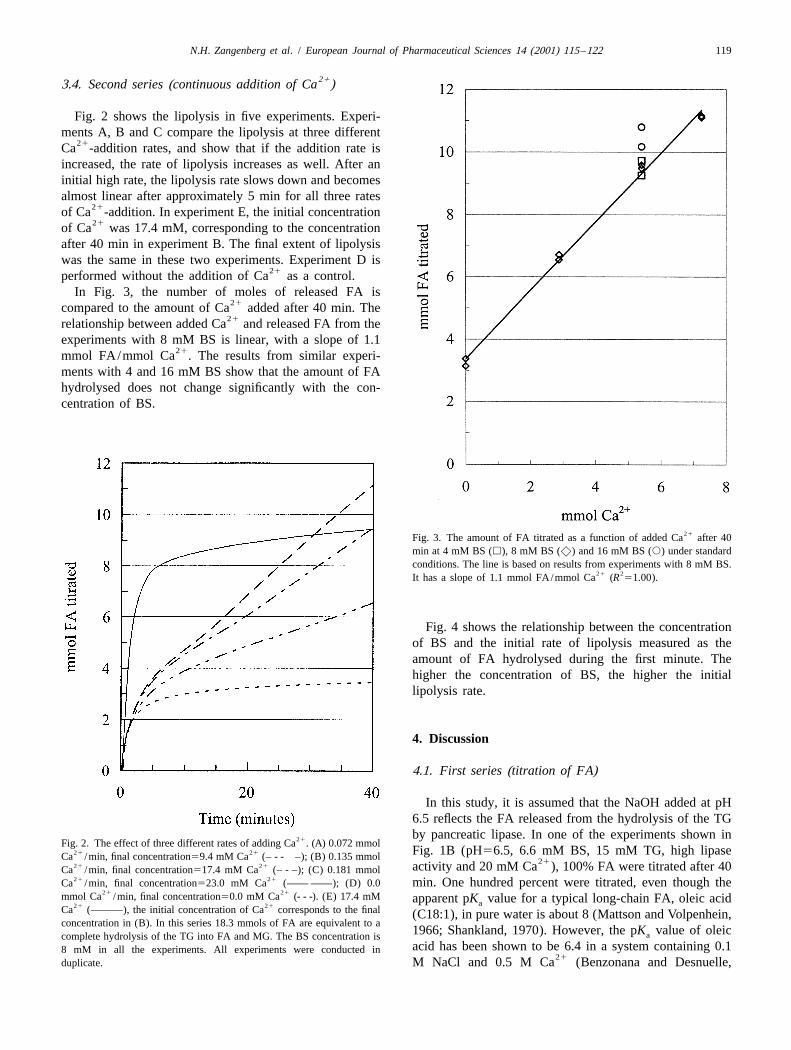
21performed without the addition of Ca as a control.In Fig. 3, the number of moles of released FA is
21compared to the amount of Ca added after 40 min. The21relationship between added Ca and released FA from the
experiments with 8 mM BS is linear, with a slope of 1.121mmol FA/mmol Ca . The results from similar experi-
ments with 4 and 16 mM BS show that the amount of FAhydrolysed does not change significantly with the con-centration of BS.
21Fig. 3. The amount of FA titrated as a function of added Ca after 40min at 4 mM BS (h), 8 mM BS (x) and 16 mM BS (s) under standardconditions. The line is based on results from experiments with 8 mM BS.
21 2It has a slope of 1.1 mmol FA/mmol Ca (R 51.00).
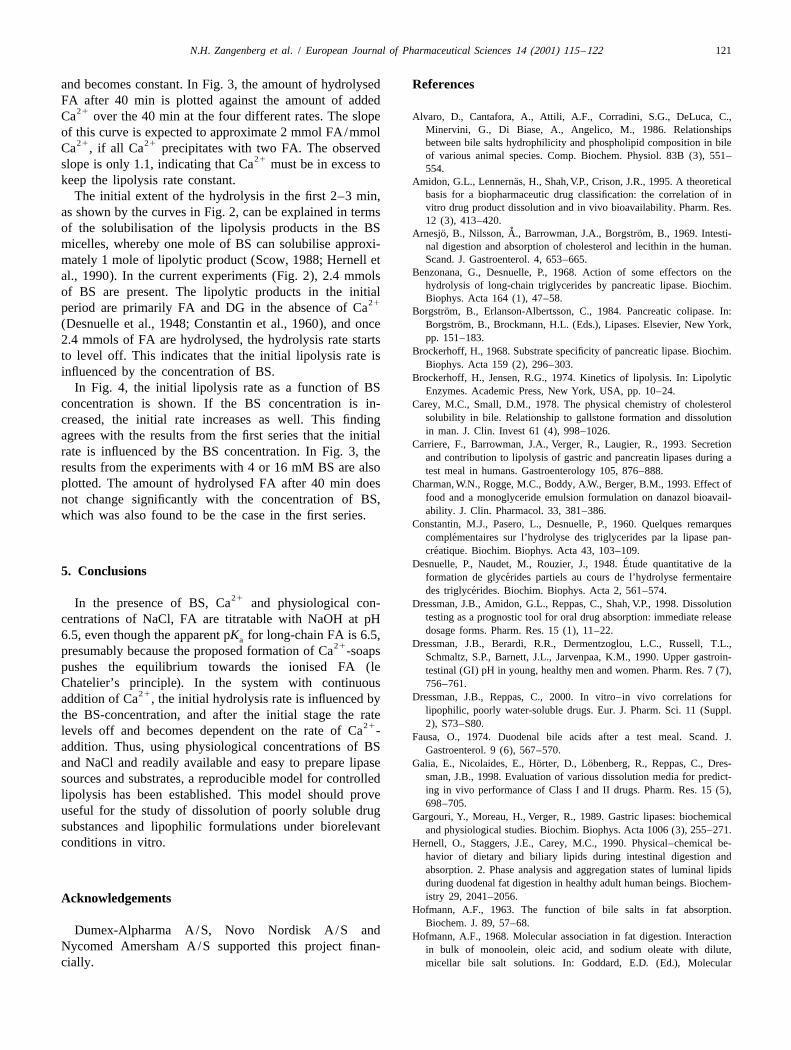
Fig. 4 shows the relationship between the concentrationof BS and the initial rate of lipolysis measured as theamount of FA hydrolysed during the first minute. Thehigher the concentration of BS, the higher the initiallipolysis rate.
4. Discussion
4.1. First series (titration of FA)
In this study, it is assumed that the NaOH added at pH6.5 reflects the FA released from the hydrolysis of the TGby pancreatic lipase. In one of the experiments shown in21Fig. 2. The effect of three different rates of adding Ca . (A) 0.072 mmol
21 21 Fig. 1B (pH56.5, 6.6 mM BS, 15 mM TG, high lipaseCa /min, final concentration59.4 mM Ca (– - - –); (B) 0.135 mmol 2121 21 activity and 20 mM Ca ), 100% FA were titrated after 40Ca /min, final concentration517.4 mM Ca (– - –); (C) 0.181 mmol21 21Ca /min, final concentration523.0 mM Ca (—— ——); (D) 0.0 min. One hundred percent were titrated, even though the
21 21mmol Ca /min, final concentration50.0 mM Ca (- - -). (E) 17.4 mM apparent pK value for a typical long-chain FA, oleic acida21 21Ca (———), the initial concentration of Ca corresponds to the final (C18:1), in pure water is about 8 (Mattson and Volpenhein,concentration in (B). In this series 18.3 mmols of FA are equivalent to a
1966; Shankland, 1970). However, the pK value of oleicacomplete hydrolysis of the TG into FA and MG. The BS concentration isacid has been shown to be 6.4 in a system containing 0.18 mM in all the experiments. All experiments were conducted in
21duplicate. M NaCl and 0.5 M Ca (Benzonana and Desnuelle,
120 N.H. Zangenberg et al. / European Journal of Pharmaceutical Sciences 14 (2001) 115 –122
celles together with MG is believed to be the mostimportant way of removing the FA from the oil–water
21 21interface. In vitro, the formation of Ca -soaps from Caand palmitate was found to take place at concentrationsrelevant to the present experiments (Lichtenberg et al.,1988), and the precipitation of Ca(FA) is believed to be2
21an important reaction in the presence of Ca (Patton etal., 1985; Hernell et al., 1990). By precipitating FA with
21Ca , FA are removed from the interface of the emulsion.This prevents the inhibition of pancreatic lipase by FA,which is explained as an effect of product accumulation atthe interface (Brockerhoff, 1968; Scow et al., 1979),making the substrate inaccessible to the enzyme (Brocker-hoff and Jensen, 1974). This effect is observed in vitrowhen a substantial amount of substrate is hydrolysed in the
21absence of FA-acceptors like Ca and BS (Wieloch et al.,1982). Therefore, to allow the lipolysis to continue unim-
21peded, the FA must be removed either with Ca or BS.21Scow (1988) investigated the effect of Ca on lipolysis
in a study where he also included BS (Scow, 1988). He21Fig. 4. The amount of FA titrated during the first 1 min of the found that 3.3 mM Ca in the medium affected the
experiments with 4, 8 and 16 mM BS under standard conditions (see21 hydrolysis but not the release of lipolytic products from oilTable 2) and 0.135 mmol Ca /min.
droplets during lipolysis. By contrast, 17 mM sodiumtaurodeoxycholate affected the release but not the hy-
1968). Similar pK values can be achieved by dissolving drolysis by the lipase. In the same study, morphologicala
oleic acid in BS micelles (Hofmann, 1968; Shankland, studies were performed which showed that in the medium211970; Staggers et al., 1990). On the other hand, the containing sodium taurodeoxycholate but no Ca the
addition of MG, PC and lyso-PC to BS show no synergis- surface of the oil droplets was smooth except for constant-tic effect on the pK value (Hofmann, 1963; Shankland, ly moving stubby projections that seemed to melt into thea
211970; Small et al., 1984). Therefore, it can be assumed that aqueous medium. In the medium with Ca but no BS, thein the present system (1.5–6.6 mM BS and 150 mM NaCl droplets at first became ruffled and then crusted showingat pH 6.5), approx. 50% of the FA from soybean oil structures similar to those observed by Patton and Carey(mainly C18:2, C18:1 and C16:0) are ionised and can be (1979) in analogous experiments. Thus, in the mediumpartly titrated — an assumption that to some extent is with BS, the lipolytic products were released into theconfirmed by Patton and Carey (1981). By hydrolysing TG medium in mixed BS micelles, whereas the droplets in the
21 21in which the FA were radioactively labelled, they investi- medium with Ca were enveloped in crystalline Ca -21gated whether long-chain FA are titratable at pH 6 and 6.9 soaps. The formation of Ca -soaps draws the equilibrium
in the presence of 17 mM TG, 6 mM BS and 10 mM towards the ionised FA (le Chatelier’s principle) and21Ca . They determined the released FA by both radioac- makes the FA titratable. The intensive stirring removes the
tivity and by titration using a pH-stat. They found that at crystalline shell from the oil droplets and allows thepH 6.9, approx. 50% of the released FA are titratable and lipolysis to continue unimpeded at the surface of thethat only negligible amounts are titratable at pH 6.0. emulsion droplet.
In Fig. 1B, another experiment, containing only 4 mM21 21Ca , is compared to the one mentioned above with 20 4.2. Second series (continuous addition of Ca )
21mM Ca (and pH56.5, 6.6 mM BS, 15 mM TG and highlipase activity for both experiments). The experiment with The results from the first series showed that the continu-
21 214 mM Ca showed as little as 50% titrated FA, whereas ous addition of Ca provides a way of controlling the21the experiment with 20 mM Ca showed a 100% titration lipolysis rate. The curves in Fig. 2 show an increased
21of the FA. Furthermore, the additional data presented in lipolysis rate when the rate of Ca -addition is increased.Fig. 1A and B show an initial lipolysis rate that is This is both in accordance with the results from the first
21dependent on both BS- and Ca -concentrations, followed series and with the work of MacGregor et al. (1997). They21by a lower hydrolysis rate after 5–10 min at hydrolysis increased the concentration of Ca from 5 to 40 mM and
21levels which are dependent on the amount of Ca present. found the factor to be 2.6 for the extent of lipolysis after21This strongly indicates that Ca is an important deter- 30 min using 8 mM sodium taurocholate, 1.5 mM PC and
minant of the extent of hydrolysis. 150 mM NaCl at pH 6.5.In vivo, solubilisation of FA in BS-phospholipid mi- After an initial burst of hydrolysis, the rate slows down
N.H. Zangenberg et al. / European Journal of Pharmaceutical Sciences 14 (2001) 115 –122 121
and becomes constant. In Fig. 3, the amount of hydrolysed ReferencesFA after 40 min is plotted against the amount of added
21Alvaro, D., Cantafora, A., Attili, A.F., Corradini, S.G., DeLuca, C.,Ca over the 40 min at the four different rates. The slope
Minervini, G., Di Biase, A., Angelico, M., 1986. Relationshipsof this curve is expected to approximate 2 mmol FA/mmol21 21 between bile salts hydrophilicity and phospholipid composition in bileCa , if all Ca precipitates with two FA. The observed
of various animal species. Comp. Biochem. Physiol. 83B (3), 551–21slope is only 1.1, indicating that Ca must be in excess to 554.keep the lipolysis rate constant. ¨Amidon, G.L., Lennernas, H., Shah, V.P., Crison, J.R., 1995. A theoretical
basis for a biopharmaceutic drug classification: the correlation of inThe initial extent of the hydrolysis in the first 2–3 min,vitro drug product dissolution and in vivo bioavailability. Pharm. Res.as shown by the curves in Fig. 2, can be explained in terms12 (3), 413–420.
of the solubilisation of the lipolysis products in the BS ˚¨ ¨Arnesjo, B., Nilsson, A., Barrowman, J.A., Borgstrom, B., 1969. Intesti-micelles, whereby one mole of BS can solubilise approxi- nal digestion and absorption of cholesterol and lecithin in the human.
Scand. J. Gastroenterol. 4, 653–665.mately 1 mole of lipolytic product (Scow, 1988; Hernell etBenzonana, G., Desnuelle, P., 1968. Action of some effectors on theal., 1990). In the current experiments (Fig. 2), 2.4 mmols
hydrolysis of long-chain triglycerides by pancreatic lipase. Biochim.of BS are present. The lipolytic products in the initial Biophys. Acta 164 (1), 47–58.21period are primarily FA and DG in the absence of Ca ¨Borgstrom, B., Erlanson-Albertsson, C., 1984. Pancreatic colipase. In:¨(Desnuelle et al., 1948; Constantin et al., 1960), and once Borgstrom, B., Brockmann, H.L. (Eds.), Lipases. Elsevier, New York,
pp. 151–183.2.4 mmols of FA are hydrolysed, the hydrolysis rate startsBrockerhoff, H., 1968. Substrate specificity of pancreatic lipase. Biochim.to level off. This indicates that the initial lipolysis rate is
Biophys. Acta 159 (2), 296–303.influenced by the concentration of BS. Brockerhoff, H., Jensen, R.G., 1974. Kinetics of lipolysis. In: Lipolytic
In Fig. 4, the initial lipolysis rate as a function of BS Enzymes. Academic Press, New York, USA, pp. 10–24.concentration is shown. If the BS concentration is in- Carey, M.C., Small, D.M., 1978. The physical chemistry of cholesterol
solubility in bile. Relationship to gallstone formation and dissolutioncreased, the initial rate increases as well. This findingin man. J. Clin. Invest 61 (4), 998–1026.agrees with the results from the first series that the initial
Carriere, F., Barrowman, J.A., Verger, R., Laugier, R., 1993. Secretionrate is influenced by the BS concentration. In Fig. 3, the and contribution to lipolysis of gastric and pancreatin lipases during aresults from the experiments with 4 or 16 mM BS are also test meal in humans. Gastroenterology 105, 876–888.plotted. The amount of hydrolysed FA after 40 min does Charman, W.N., Rogge, M.C., Boddy, A.W., Berger, B.M., 1993. Effect of
food and a monoglyceride emulsion formulation on danazol bioavail-not change significantly with the concentration of BS,ability. J. Clin. Pharmacol. 33, 381–386.which was also found to be the case in the first series.
Constantin, M.J., Pasero, L., Desnuelle, P., 1960. Quelques remarques´complementaires sur l’hydrolyse des triglycerides par la lipase pan-
´creatique. Biochim. Biophys. Acta 43, 103–109.´Desnuelle, P., Naudet, M., Rouzier, J., 1948. Etude quantitative de la
5. Conclusions ´formation de glycerides partiels au cours de l’hydrolyse fermentaire´des triglycerides. Biochim. Biophys. Acta 2, 561–574.
21In the presence of BS, Ca and physiological con- Dressman, J.B., Amidon, G.L., Reppas, C., Shah, V.P., 1998. Dissolutiontesting as a prognostic tool for oral drug absorption: immediate releasecentrations of NaCl, FA are titratable with NaOH at pHdosage forms. Pharm. Res. 15 (1), 11–22.6.5, even though the apparent pK for long-chain FA is 6.5,a Dressman, J.B., Berardi, R.R., Dermentzoglou, L.C., Russell, T.L.,21presumably because the proposed formation of Ca -soaps Schmaltz, S.P., Barnett, J.L., Jarvenpaa, K.M., 1990. Upper gastroin-
pushes the equilibrium towards the ionised FA (le testinal (GI) pH in young, healthy men and women. Pharm. Res. 7 (7),Chatelier’s principle). In the system with continuous 756–761.
21 Dressman, J.B., Reppas, C., 2000. In vitro–in vivo correlations foraddition of Ca , the initial hydrolysis rate is influenced bylipophilic, poorly water-soluble drugs. Eur. J. Pharm. Sci. 11 (Suppl.the BS-concentration, and after the initial stage the rate2), S73–S80.21levels off and becomes dependent on the rate of Ca - Fausa, O., 1974. Duodenal bile acids after a test meal. Scand. J.
addition. Thus, using physiological concentrations of BS Gastroenterol. 9 (6), 567–570.¨ ¨and NaCl and readily available and easy to prepare lipase Galia, E., Nicolaides, E., Horter, D., Lobenberg, R., Reppas, C., Dres-
sman, J.B., 1998. Evaluation of various dissolution media for predict-sources and substrates, a reproducible model for controlleding in vivo performance of Class I and II drugs. Pharm. Res. 15 (5),lipolysis has been established. This model should prove698–705.
useful for the study of dissolution of poorly soluble drug Gargouri, Y., Moreau, H., Verger, R., 1989. Gastric lipases: biochemicalsubstances and lipophilic formulations under biorelevant and physiological studies. Biochim. Biophys. Acta 1006 (3), 255–271.conditions in vitro. Hernell, O., Staggers, J.E., Carey, M.C., 1990. Physical–chemical be-
havior of dietary and biliary lipids during intestinal digestion andabsorption. 2. Phase analysis and aggregation states of luminal lipidsduring duodenal fat digestion in healthy adult human beings. Biochem-istry 29, 2041–2056.Acknowledgements
Hofmann, A.F., 1963. The function of bile salts in fat absorption.Biochem. J. 89, 57–68.
Dumex-Alpharma A/S, Novo Nordisk A/S and Hofmann, A.F., 1968. Molecular association in fat digestion. InteractionNycomed Amersham A/S supported this project finan- in bulk of monoolein, oleic acid, and sodium oleate with dilute,cially. micellar bile salt solutions. In: Goddard, E.D. (Ed.), Molecular
122 N.H. Zangenberg et al. / European Journal of Pharmaceutical Sciences 14 (2001) 115 –122
Association in Biological and Related Systems. American Chemical Carey, M.C., 1985. The light microscopy of triglyceride digestion.Society, Washington, DC, USA, pp. 53–66. Food Microstructure 4, 29–41.
¨Hofmann, A.F., Mysels, K.J., 1992. Bile acid solubility and precipitation Pedersen, B.L., Brøndsted, H., Lennernas, H., Christensen, F.N.,21 ¨in vitro and in vivo: the role of conjugation, pH, and Ca ions. J. Mullertz, A., Kristensen, H.G., 2000a. Dissolution of hydrocortisone
Lipid Res. 33 (5), 617–626. in human and simulated fluids. Pharm. Res. 17 (2), 183–189.¨Humberstone, A.J., Porter, C.J.H., Charman, W.N., 1996. A physico- Pedersen, B.L., Mullertz, A., Brøndsted, H., Kristensen, H.G., 2000b. A
chemical basis for the effect of food on the absolute oral bioavail- comparison of the solubility of danazol in human and simulatedability of halofantrine. J. Pharm. Sci. 85 (5), 525–529. gastrointestinal fluids. Pharm. Res. 17 (7), 891–894.
´¨Janowitz, P., Swobodnik, W., Wechsler, J.G., Zoller, A., Kuhn, K., Rautureau, M., Bisalli, A., Rambaud, J.-C., 1981. Etude de la phase´Ditschuneit, H., 1990. Comparison of gall bladder bile and endoscopi- aqueuse intra-jejunale des sels biliaires et des lipides au cours de la
cally obtained duodenal bile. Gut 31, 1407–1410. digestion d’un repas standard chez le sujet normal. Gastroenterol. Clin.Larsson, A., Erlanson-Albertsson, C., 1986. Effect of phosphatidylcholine Biol. 5 (4), 417–425.
and free fatty acids on the activity of pancreatic lipase-colipase. Reymond, J.-P., Sucker, H., 1988. In vitro model for ciclosporin intestinalBiochim. Biophys. Acta 876, 543–550. absorption in lipid vehicles. Pharm. Res. 5 (10), 673–676.
Lee, S.P., Nicholls, J.F., 1986. Nature and composition of biliary sludge. Scow, R.O., 1988. Effect of sodium taurodeoxycholate, CaCl and2
Gastroenterology 90 (3), 677–686. albumin on the action of pancreatic lipase on droplets of tri-Lichtenberg, D., Werker, E., Bor, A., Almog, S., Nir, S., 1988. Precipi- oleoylglycerol and the release of lipolytic products into aqueous
tation of calcium palmitate from bile salt-containing dispersions. media. Biochimie 70 (9), 1251–1261.Chem. Phys. Lipids 48 (3–4), 231–243. Scow, R.O., Desnuelle, P.,Verger, R., 1979. Lipolysis and lipid movement
Lindahl, A., Ungell, A.L., Knutson, L., Lennernas, H., 1997. Characteri- in a membrane model. Action of lipoprotein lipase. J. Biol. Chem. 254zation of fluids from the stomach and proximal jejunum in men and (14), 6456–6463.women. Pharm. Res. 14 (4), 497–502. Shankland, W., 1970. The ionic behavior of fatty acids solubilized by bile
¨ ¨Lindstrom, M.B., Sternby, B., Borgstrom, B., 1988. Concerted action of salts. J. Colloid Interface Sci. 34 (1), 9–25.¨human carboxyl ester lipase and pancreatic lipase during lipid diges- Sjovall, J., 1959. On the concentration of bile acids in the human intestine
tion in vitro: importance of the physicochemical state of the substrate. during absorption. Acta Physiol. Scand. 46, 339–345.Biochim. Biophys. Acta 959, 178–184. Small, D.M., Cabral, D.J., Cistola, D.P., Parks, J.S., Hamilton, J.A., 1984.
MacGregor, K.J., Embleton, J.K., Lacy, J.E., Perry, E.A., Pouton, C.W., The ionization behavior of fatty acids and bile acids in micelles and1997. Influence of lipolysis on drug absorption from the gastrointesti- membranes. Hepatology 4 (Suppl. 5), 77S–79S.nal tract. Adv. Drug Delivery Rev. 25 (4), 33–46. Staggers, J.E., Hernell, O., Stafford, J., Carey, M.C., 1990. Physical–
Mattson, F.H., Volpenhein, R.A., 1966. Enzymatic hydrolysis at an oil– chemical behavior of dietary and biliary lipids during intestinalwater interface. J. Am. Oil Chem. Soc. 43, 286–289. digestion and absorption. 1. Phase behavior and aggregation states of
´Naylor, L.J., Bakatselou, V., Rodrıguez-Hornedo, N., Weiner, N.D., model lipid systems patterned after aqueous duodenal contents ofDressman, J.B., 1995. Dissolution of steroids in bile salt solutions is healthy adult human beings. Biochemistry 29, 2028–2040.modified by the presence of lecithin. Eur. J. Pharm. Biopharm. 41 (6), The United States Pharmacopeia /The National Formulary (USP24/346–353. NF19). United States Pharmacopoeial Convention, Rockville, MD,
Ogunbona, F.A., Smith, I.F., Olawoye, O.S., 1985. Fat contents of meals USA, pp. 1254–1255.¨and bioavailability of griseofulvin in man. J. Pharm. Pharmacol. 37 Verger, R., 1984. Pancreatic lipases. In: Borgstrom, B., Brockmann, H.L.
(4), 283–284. (Eds.), Lipases. Elsevier, New York, pp. 84–150.Patton, J.S., 1981. Gastrointestinal lipid digestion. In: Johnson, L.R. Westergaard, H., 1977. Duodenal bile acid concentrations in fat malab-
(Ed.), Physiology of the Gastrointestinal Tract. Raven Press, New sorption syndromes. Scand. J. Gastroenterol. 12 (1), 115–122.¨York, pp. 1123–1146. Wieloch, T., Borgstrom, B., Pattus, F., Verger, R., 1982. Product
˚ ¨Patton, J.S., Albertsson, P.-A., Erlanson, C., Borgstrom, B., 1978. Binding activation of pancreatic lipase – Lipolytic enzymes as probes forof porcine pancreatic lipase and colipase in the absence of substrate lipid–water interfaces. J. Biol. Chem. 257 (19), 11523–11528.
¨studied by two-phase partition and affinity chromatography. J. Biol. Zangenberg, N.H., Mullertz, A., Kristensen, H.G., Hovgaard, L. AChem., 4195–4202. dynamic in vitro lipolysis model. II. Dissolution of probucol and
Patton, J.S., Carey, M.C., 1979. Watching fat digestion. Science 204, danazol. Eur. J. Pharm. Sci., submitted145–148. Zentler-Munro, P.L., Fine, D.R., Fitzpatrick, W.J.F., Northfield, T.C.,
Patton, J.S., Carey, M.C., 1981. Inhibition of human pancreatic lipase– 1984. Effect of intrajejunal acidity on lipid digestion and aqueouscolipase activity by mixed bile salt–phospholipid micelles. Am. J. solubilisation of bile acids and lipids in health, using a new simplePhysiol. 241 (4), G328–G336. method of lipase inactivation. Gut 25, 491–499.
¨ ¨Patton, J.S., Vetter, R.D., Hamosh, M., Borgstrom, B., Lindstrom, M.B.,


![Possible Correlation between INR and Serum Calcium · T. A. Helin et al. 1183 prothrombin time, and vitro in duodenal preparations reduced calcium absorption. Our recent workin [25]](https://img.pdfslide.net/doc/110x75/5cab498688c99319398cf413/possible-correlation-between-inr-and-serum-calcium-t-a-helin-et-al-1183-prothrombin.jpg)