Embed Size (px)
Citation preview
A Guide toProductivity Measurement
Published by SPRING SingaporeSolaris, 1 Fusionopolis Walk, #01-02 South Tower, Singapore 138628Tel : +65 6278 6666Fax : +65 6278 6667 www.spring.gov.sg
© SPRING Singapore 2011
All rights reserved. No part of this publication should be reproduced, stored in a retrieval system, or transmitted, in any form or by any means, electronic, mechanical, photocopying or otherwise, without prior permission of the copyright holders.
Whilst every effort has been made to ensure that the information contained herein is comprehensive and accurate, SPRING Singapore will not accept any liability for omissions or errors.
ISBN 978-981-4150-27-9
CONTENTS1. INTRODUCTION
2. WHY MEASURE?
3. HOW TO MEASURE
4. WHAT IS VALUE ADDED?
5. AN INTEGRATED APPROACH
TO PRODUCTIVITY MEASUREMENT
6. WHAT DO YOU DO WITH
PRODUCTIVITY MEASURES?
7. CONCLUSION
ANNEX: Common Productivity Indicators
3
4
5
7
13
19
22
23

2 SPRING Singapore
3A Guide to Productivity Measurement
INTRODUCTION
Integrated Management of Productivity Activities
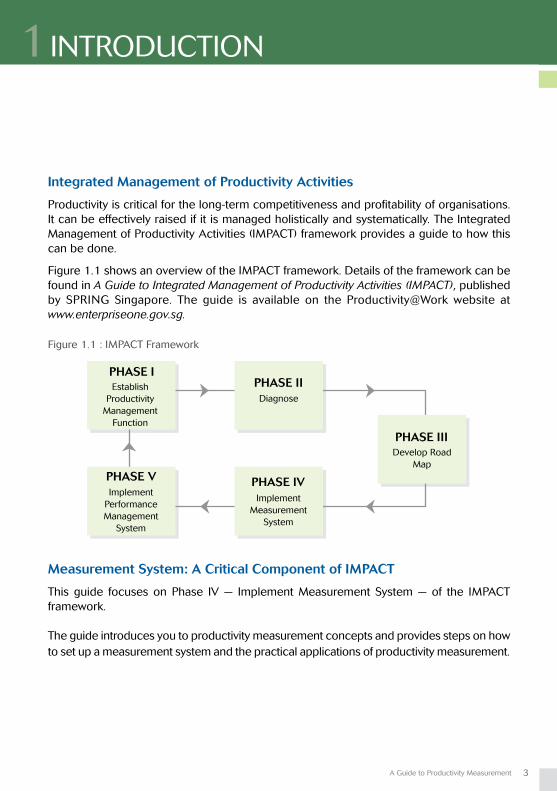
Productivity is critical for the long-term competitiveness and profitability of organisations. It can be effectively raised if it is managed holistically and systematically. The Integrated Management of Productivity Activities (IMPACT) framework provides a guide to how this can be done.
Figure 1.1 shows an overview of the IMPACT framework. Details of the framework can be found in A Guide to Integrated Management of Productivity Activities (IMPACT), published by SPRING Singapore. The guide is available on the Productivity@Work website at www.enterpriseone.gov.sg.
1
Implement Measurement
System
Implement Performance Management
System
EstablishProductivity
ManagementFunction
PHASE IPHASE II
PHASE III
PHASE V PHASE IV
Diagnose
Develop Road Map
Figure 1.1 : IMPACT Framework
Measurement System: A Critical Component of IMPACT
This guide focuses on Phase IV — Implement Measurement System — of the IMPACT framework.
The guide introduces you to productivity measurement concepts and provides steps on how to set up a measurement system and the practical applications of productivity measurement.
4 SPRING Singapore
Productivity measurement is a prerequisite for improving productivity. As Peter Drucker, who is widely regarded as the pioneer of modern management theory, said:
“Without productivity objectives, a business does not have direction. Without productivity measurement, a business does not have control.”
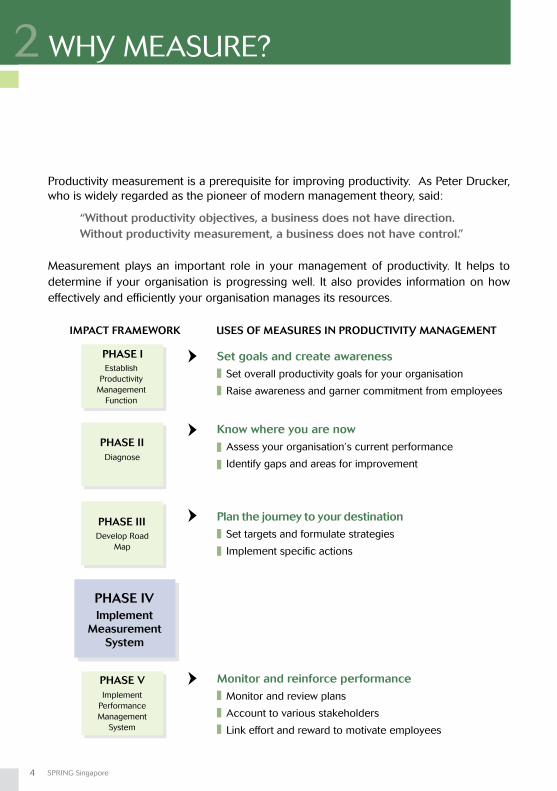
Measurement plays an important role in your management of productivity. It helps to determine if your organisation is progressing well. It also provides information on how effectively and efficiently your organisation manages its resources.
Set goals and create awareness Set overall productivity goals for your organisation
Raise awareness and garner commitment from employees
Plan the journey to your destination Set targets and formulate strategies
Implement specific actions
Know where you are now Assess your organisation’s current performance
Identify gaps and areas for improvement
Monitor and reinforce performance Monitor and review plans
Account to various stakeholders
Link effort and reward to motivate employees
WHY MEASURE?2
EstablishProductivity
ManagementFunction
PHASE I
Implement Performance Management
System
PHASE V
Implement Measurement
System
PHASE IV
IMPACT FRAMEWORK USES OF MEASURES IN PRODUCTIVITY MANAGEMENT
PHASE IIDiagnose
PHASE IIIDevelop Road
Map
5A Guide to Productivity Measurement
WHY MEASURE? HOW TO MEASURE3
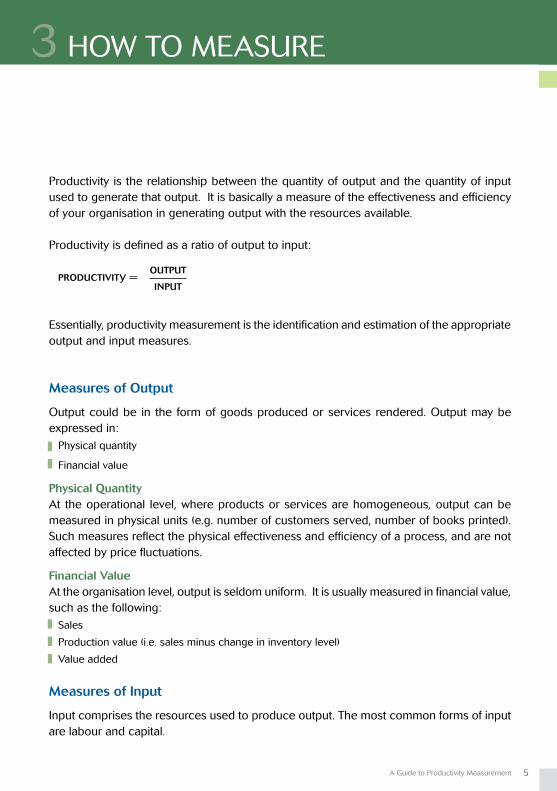
Productivity is the relationship between the quantity of output and the quantity of input used to generate that output. It is basically a measure of the effectiveness and efficiency of your organisation in generating output with the resources available.
Productivity is defined as a ratio of output to input:
PRODUCTIVITY =
Essentially, productivity measurement is the identification and estimation of the appropriate output and input measures.
Measures of Output
Output could be in the form of goods produced or services rendered. Output may be expressed in: Physical quantity
Financial value
Physical QuantityAt the operational level, where products or services are homogeneous, output can be measured in physical units (e.g. number of customers served, number of books printed). Such measures reflect the physical effectiveness and efficiency of a process, and are not affected by price fluctuations.
Financial ValueAt the organisation level, output is seldom uniform. It is usually measured in financial value, such as the following: Sales
Production value (i.e. sales minus change in inventory level)
Value added
Measures of Input
Input comprises the resources used to produce output. The most common forms of input are labour and capital.
OUTPUT
INPUT
6 SPRING Singapore
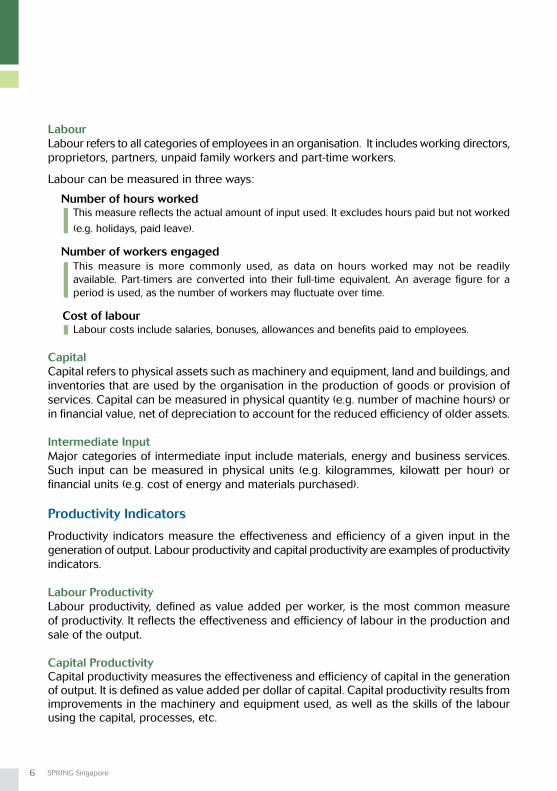
LabourLabour refers to all categories of employees in an organisation. It includes working directors, proprietors, partners, unpaid family workers and part-time workers.
Labour can be measured in three ways:
Number of hours worked This measure reflects the actual amount of input used. It excludes hours paid but not worked
(e.g. holidays, paid leave).
Number of workers engaged This measure is more commonly used, as data on hours worked may not be readily available. Part-timers are converted into their full-time equivalent. An average figure for a period is used, as the number of workers may fluctuate over time.
Cost of labour Labour costs include salaries, bonuses, allowances and benefits paid to employees.
CapitalCapital refers to physical assets such as machinery and equipment, land and buildings, and inventories that are used by the organisation in the production of goods or provision of services. Capital can be measured in physical quantity (e.g. number of machine hours) or in financial value, net of depreciation to account for the reduced efficiency of older assets.
Intermediate InputMajor categories of intermediate input include materials, energy and business services. Such input can be measured in physical units (e.g. kilogrammes, kilowatt per hour) or financial units (e.g. cost of energy and materials purchased).
Productivity Indicators
Productivity indicators measure the effectiveness and efficiency of a given input in the generation of output. Labour productivity and capital productivity are examples of productivity indicators.
Labour ProductivityLabour productivity, defined as value added per worker, is the most common measure of productivity. It reflects the effectiveness and efficiency of labour in the production and sale of the output.
Capital ProductivityCapital productivity measures the effectiveness and efficiency of capital in the generation of output. It is defined as value added per dollar of capital. Capital productivity results from improvements in the machinery and equipment used, as well as the skills of the labour using the capital, processes, etc.

7A Guide to Productivity Measurement
Value added is commonly used as a measure of output. It represents the wealth created through the organisation’s production process or provision of services. Value added measures the difference between sales and the cost of materials and services incurred to generate the sales.
The resulting wealth is generated by the combined efforts of those who work in the organisation (employees) and those who provide the capital (employers and investors). Value added is thus distributed as wages to employees, depreciation for reinvestment in machinery and equipment, interest to lenders of money, dividends to investors and profits to the organisation.
WHAT IS VALUE ADDED?4
Goods and services from external suppliers
Sales to customerValue added creation
process
Wages to employees
Interest to lenders of money
Depreciation for reinvestment in machinery and
equipment
Dividends to investors
Profits retained by organisation
8 SPRING Singapore
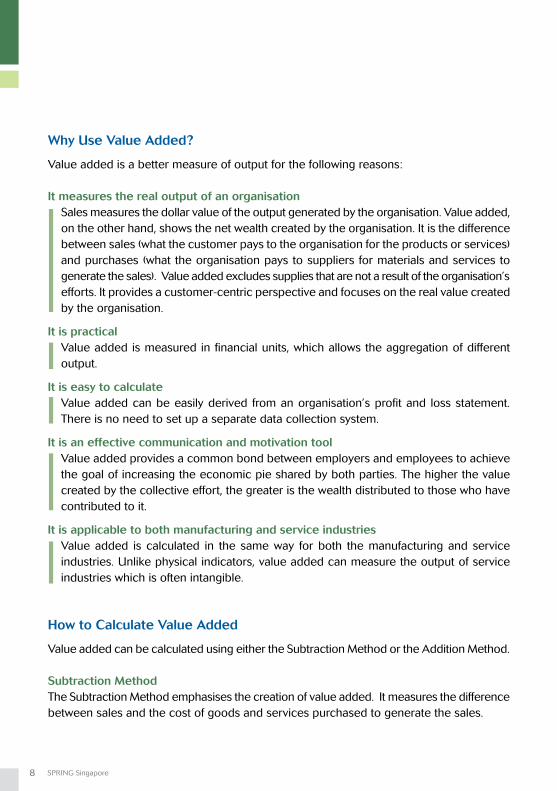
Why Use Value Added?
Value added is a better measure of output for the following reasons: It measures the real output of an organisation Sales measures the dollar value of the output generated by the organisation. Value added, on the other hand, shows the net wealth created by the organisation. It is the difference between sales (what the customer pays to the organisation for the products or services) and purchases (what the organisation pays to suppliers for materials and services to generate the sales). Value added excludes supplies that are not a result of the organisation’s efforts. It provides a customer-centric perspective and focuses on the real value created by the organisation.
It is practical Value added is measured in financial units, which allows the aggregation of different output.
It is easy to calculate Value added can be easily derived from an organisation’s profit and loss statement. There is no need to set up a separate data collection system.
It is an effective communication and motivation tool Value added provides a common bond between employers and employees to achieve the goal of increasing the economic pie shared by both parties. The higher the value created by the collective effort, the greater is the wealth distributed to those who have contributed to it.
It is applicable to both manufacturing and service industries Value added is calculated in the same way for both the manufacturing and service industries. Unlike physical indicators, value added can measure the output of service industries which is often intangible.
How to Calculate Value Added
Value added can be calculated using either the Subtraction Method or the Addition Method.
Subtraction MethodThe Subtraction Method emphasises the creation of value added. It measures the difference between sales and the cost of goods and services purchased to generate the sales.
9A Guide to Productivity Measurement
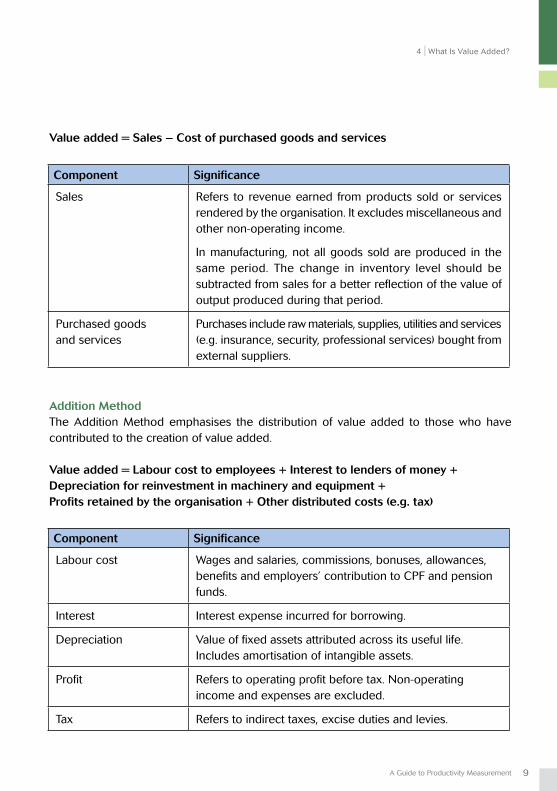
Addition MethodThe Addition Method emphasises the distribution of value added to those who have contributed to the creation of value added.
Value added = Labour cost to employees + Interest to lenders of money + Depreciation for reinvestment in machinery and equipment + Profits retained by the organisation + Other distributed costs (e.g. tax)
Value added = Sales – Cost of purchased goods and services
Component Significance
Sales Refers to revenue earned from products sold or services rendered by the organisation. It excludes miscellaneous and other non-operating income.
In manufacturing, not all goods sold are produced in the same period. The change in inventory level should be subtracted from sales for a better reflection of the value of output produced during that period.
Purchased goods and services
Purchases include raw materials, supplies, utilities and services (e.g. insurance, security, professional services) bought from external suppliers.
Component Significance
Labour cost Wages and salaries, commissions, bonuses, allowances, benefits and employers’ contribution to CPF and pension funds.
Interest Interest expense incurred for borrowing.
Depreciation Value of fixed assets attributed across its useful life. Includes amortisation of intangible assets.
Profit Refers to operating profit before tax. Non-operating income and expenses are excluded.
Tax Refers to indirect taxes, excise duties and levies.
4 What Is Value Added?
10 SPRING Singapore
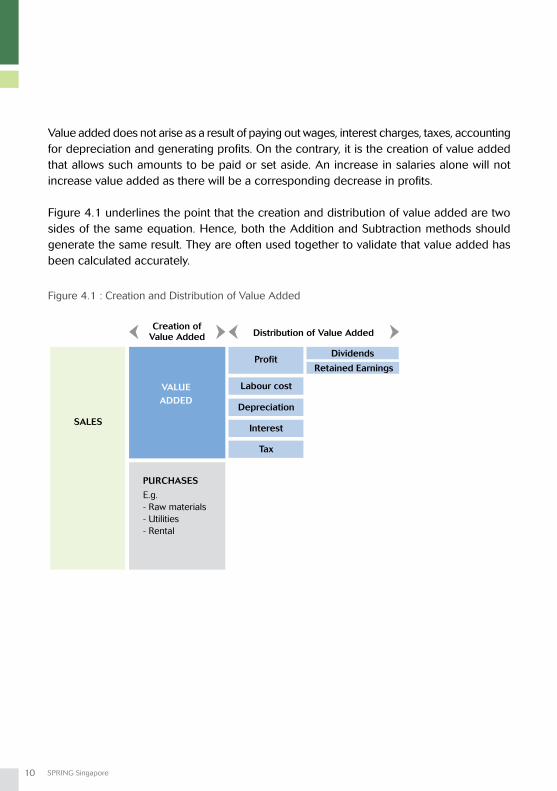
Value added does not arise as a result of paying out wages, interest charges, taxes, accounting for depreciation and generating profits. On the contrary, it is the creation of value added that allows such amounts to be paid or set aside. An increase in salaries alone will not increase value added as there will be a corresponding decrease in profits.
Figure 4.1 underlines the point that the creation and distribution of value added are two sides of the same equation. Hence, both the Addition and Subtraction methods should generate the same result. They are often used together to validate that value added has been calculated accurately.
Figure 4.1 : Creation and Distribution of Value Added
SALES
VALUE ADDED
Profit
Creation of Value Added Distribution of Value Added
Labour cost
Depreciation
Interest
Tax
PURCHASES
E.g.- Raw materials- Utilities- Rental
Dividends
Retained Earnings
11A Guide to Productivity Measurement
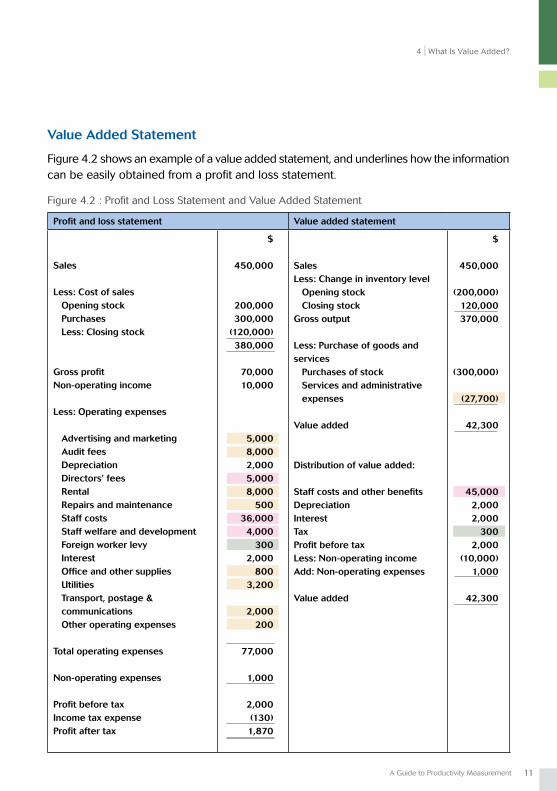
Value Added Statement
Figure 4.2 shows an example of a value added statement, and underlines how the information can be easily obtained from a profit and loss statement.
Figure 4.2 : Profit and Loss Statement and Value Added Statement
Profit and loss statement Value added statement
Sales
Less: Cost of sales Opening stock Purchases Less: Closing stock
Gross profitNon-operating income
Less: Operating expenses
Advertising and marketing Audit fees Depreciation Directors’ fees Rental Repairs and maintenance Staff costs Staff welfare and development Foreign worker levy Interest Office and other supplies Utilities Transport, postage & communications Other operating expenses
Total operating expenses
Non-operating expenses
Profit before taxIncome tax expenseProfit after tax
$
450,000
200,000300,000
(120,000) 380,000
70,00010,000
5,0008,0002,0005,0008,000
50036,000
4,000300
2,000800
3,200
2,000 200
77,000
1,000
2,000 (130) 1,870
SalesLess: Change in inventory level Opening stock Closing stockGross output
Less: Purchase of goods and services Purchases of stock Services and administrative expenses
Value added
Distribution of value added:
Staff costs and other benefitsDepreciationInterestTaxProfit before taxLess: Non-operating incomeAdd: Non-operating expenses
Value added
$
450,000
(200,000) 120,000370,000
(300,000)
(27,700)
42,300
45,0002,0002,000
3002,000
(10,000) 1,000
42,300
4 What Is Value Added?
12 SPRING Singapore
Profitability and Productivity
Organisations commonly regard profits as a key measure of their success. Using profits as a measure may seem to imply that the organisation will benefit more if costs such as salaries and depreciation for capital reinvestment are reduced. However, lowering salaries to increase profits tends to lead to conflicts in the relationship between employees and management. Minimising capital investment often has a negative impact on the efficiency of operations, and eventually affects profits. Therefore, increasing profits by reducing such expenses is only a short-term measure. The only viable way to increasing profits in a sustainable manner is to increase the economic pie or value added through higher productivity. This can be done with better cooperation from employees, higher investment in capital, and optimal use of capital.
In return for your employees’ efforts, your organisation should share the additional wealth generated in the form of higher wages and improved benefits. This will reinforce and encourage them to further improve their performance.
To sum up, productivity is key to sustaining profits in the long run.
13A Guide to Productivity Measurement
3 The IMPACT Framework
As manpower is the key resource in many organisations, labour productivity (or value added per worker) is often used as the overall measurement for productivity. However, a single indicator does not provide a complete picture of your organisation’s productivity performance. Rather, an integrated approach to productivity measurement should be adopted.
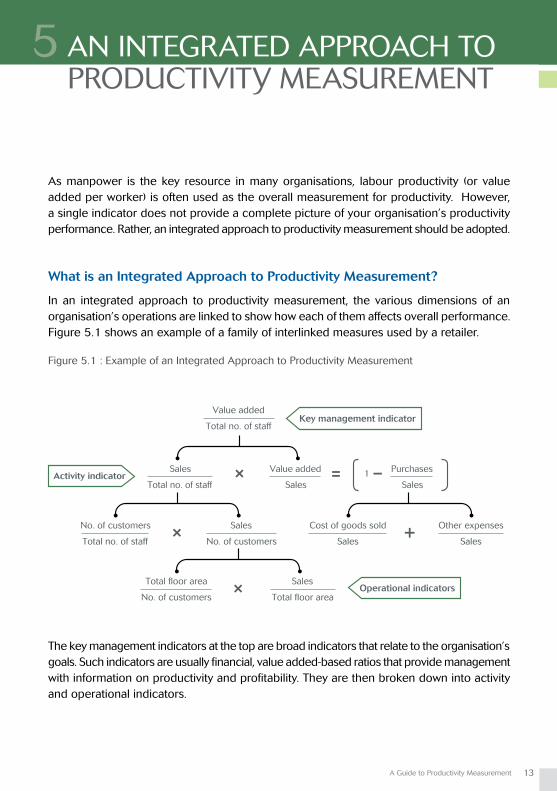
What is an Integrated Approach to Productivity Measurement?
In an integrated approach to productivity measurement, the various dimensions of an organisation’s operations are linked to show how each of them affects overall performance. Figure 5.1 shows an example of a family of interlinked measures used by a retailer.
Figure 5.1 : Example of an Integrated Approach to Productivity Measurement
The key management indicators at the top are broad indicators that relate to the organisation’s goals. Such indicators are usually financial, value added-based ratios that provide management with information on productivity and profitability. They are then broken down into activity and operational indicators.
AN INTEGRATED APPROACH TO PRODUCTIVITY MEASUREMENT
5
14 SPRING Singapore
Activity indicators provide a snapshot of costs, activity levels and resource utilisation rates, which are particularly useful for middle and higher management.
Operational indicators are usually physical ratios that address the operational aspects that need to be monitored and controlled.
Why Adopt an Integrated Approach?
An integrated approach to productivity measurement:
• Providesacomprehensivepictureoftheorganisation’sperformance• Highlightstherelationshipsamongdifferentratiosandunits,andallowstheorganisation to analyse the factors contributing to its productivity performance• Helpsdiagnoseproblemareasandsuggestsappropriatecorrectiveactions• Enablestheorganisationtomonitoritsperformanceovertimeandagainsttheperformance of other organisations
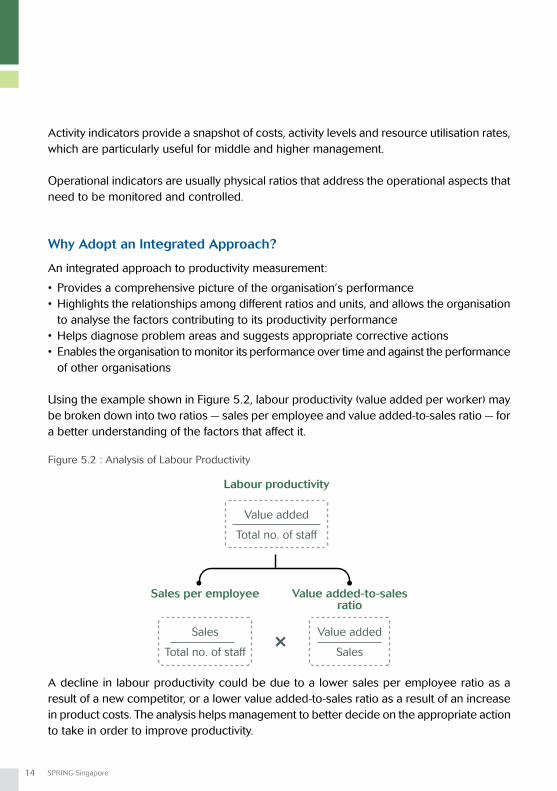
Using the example shown in Figure 5.2, labour productivity (value added per worker) may be broken down into two ratios — sales per employee and value added-to-sales ratio — for a better understanding of the factors that affect it.
Figure 5.2 : Analysis of Labour Productivity
A decline in labour productivity could be due to a lower sales per employee ratio as a result of a new competitor, or a lower value added-to-sales ratio as a result of an increase in product costs. The analysis helps management to better decide on the appropriate action to take in order to improve productivity.
15A Guide to Productivity Measurement
5 An Integrated Approach To Productivity Measurement
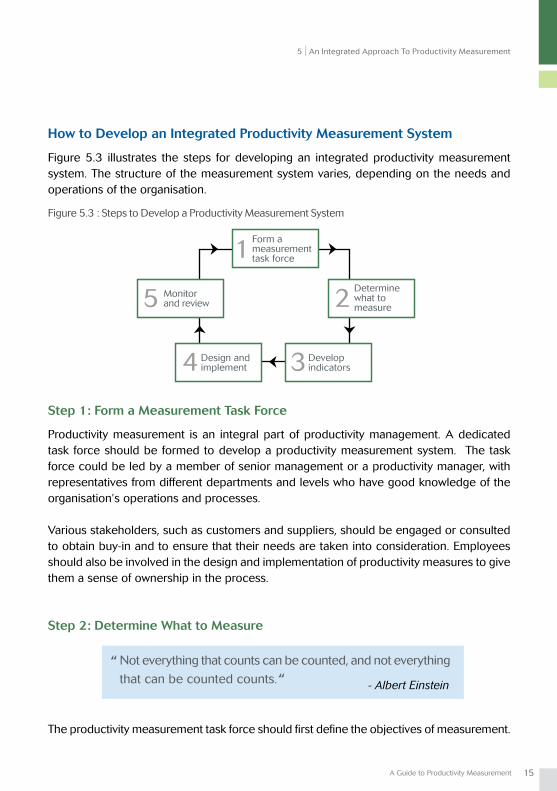
How to Develop an Integrated Productivity Measurement System
Figure 5.3 illustrates the steps for developing an integrated productivity measurement system. The structure of the measurement system varies, depending on the needs and operations of the organisation.
Step 1: Form a Measurement Task Force
Productivity measurement is an integral part of productivity management. A dedicated task force should be formed to develop a productivity measurement system. The task force could be led by a member of senior management or a productivity manager, with representatives from different departments and levels who have good knowledge of the organisation’s operations and processes.
Various stakeholders, such as customers and suppliers, should be engaged or consulted to obtain buy-in and to ensure that their needs are taken into consideration. Employees should also be involved in the design and implementation of productivity measures to give them a sense of ownership in the process.
Step 2: Determine What to Measure
The productivity measurement task force should first define the objectives of measurement.
““ - Albert Einstein
Not everything that counts can be counted, and not everything
that can be counted counts.
Figure 5.3 : Steps to Develop a Productivity Measurement System
16 SPRING Singapore
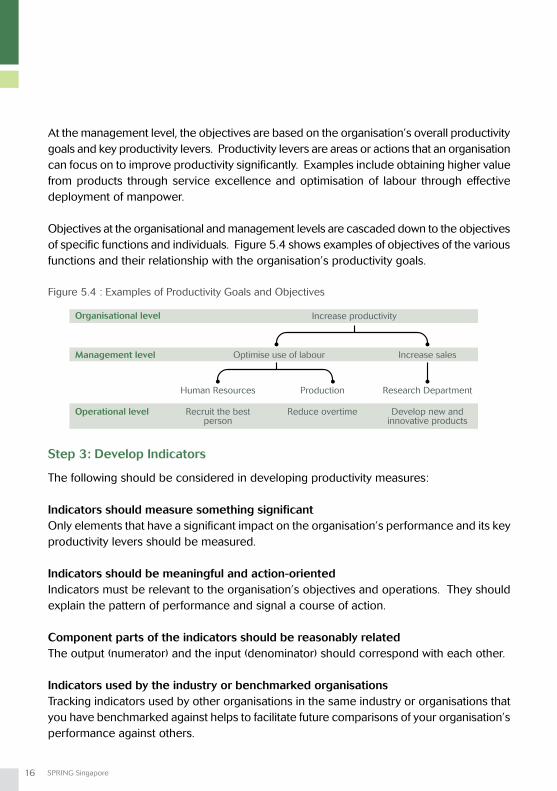
At the management level, the objectives are based on the organisation’s overall productivity goals and key productivity levers. Productivity levers are areas or actions that an organisationcan focus on to improve productivity significantly. Examples include obtaining higher value from products through service excellence and optimisation of labour through effective deployment of manpower.
Objectives at the organisational and management levels are cascaded down to the objectives of specific functions and individuals. Figure 5.4 shows examples of objectives of the various functions and their relationship with the organisation’s productivity goals.
Step 3: Develop Indicators
The following should be considered in developing productivity measures:
Indicators should measure something significantOnly elements that have a significant impact on the organisation’s performance and its key productivity levers should be measured.
Indicators should be meaningful and action-orientedIndicators must be relevant to the organisation’s objectives and operations. They should explain the pattern of performance and signal a course of action.
Component parts of the indicators should be reasonably relatedThe output (numerator) and the input (denominator) should correspond with each other.
Indicators used by the industry or benchmarked organisationsTracking indicators used by other organisations in the same industry or organisations that you have benchmarked against helps to facilitate future comparisons of your organisation’s performance against others.
Figure 5.4 : Examples of Productivity Goals and Objectives
17A Guide to Productivity Measurement
Reliability of dataData should be reliable and consistent. The indicators should provide an accurate reflection of what they are supposed to measure.
PracticalityIndicators should be easily understood by employees and practical to obtain.
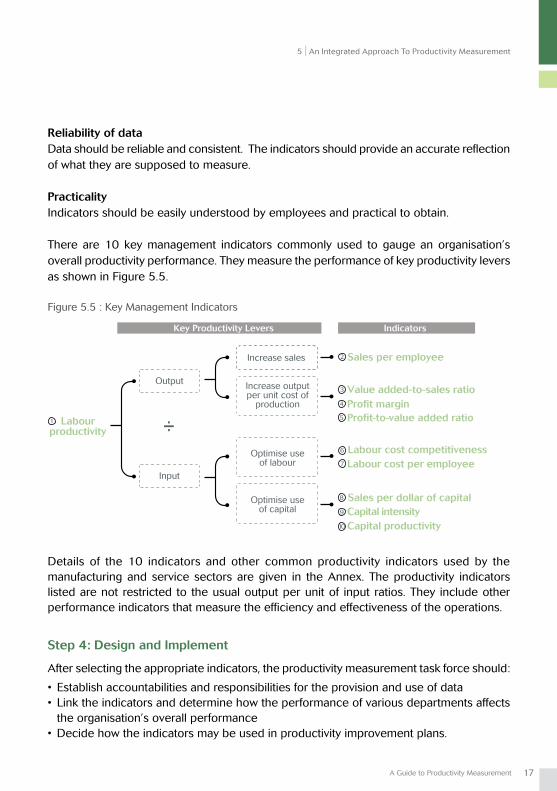
There are 10 key management indicators commonly used to gauge an organisation’s overall productivity performance. They measure the performance of key productivity levers as shown in Figure 5.5.
Details of the 10 indicators and other common productivity indicators used by the manufacturing and service sectors are given in the Annex. The productivity indicators listed are not restricted to the usual output per unit of input ratios. They include other performance indicators that measure the efficiency and effectiveness of the operations.
Step 4: Design and Implement
After selecting the appropriate indicators, the productivity measurement task force should:
• Establishaccountabilitiesandresponsibilitiesfortheprovisionanduseofdata• Linktheindicatorsanddeterminehowtheperformanceofvariousdepartmentsaffects the organisation’s overall performance • Decidehowtheindicatorsmaybeusedinproductivityimprovementplans.
Figure 5.5 : Key Management Indicators
5 An Integrated Approach To Productivity Measurement
18 SPRING Singapore
The next step is to establish a system, using appropriate technology, to collect, analyse and report the performance of the indicators, taking into account the needs of the employees providing and using the data.
An effective productivity measurement system should be an integral part of your organisation’s daily operations and management information system. It should be flexible and adaptable to changing requirements.
Adequate training should be provided to staff to ensure a common understanding of the objectives and measures used, how the system works and how the measures relate to their work.
Step 5: Monitor and Review
Productivity measurement is not a one-off project. The productivity measurement task force should review the effectiveness of the measurement system periodically and solicit feedback from users to further enhance the system and ensure its relevance.
“ The only man I know who behaves sensibly is my tailor:
he takes my measurements anew each time he sees me.
The rest go on with their old measurements and expect me
to fit them.- George Bernard Shaw“
19A Guide to Productivity Measurement
6ConclusionWHAT DO YOU DO WITH PRODUCTIVITY MEASURES?
Productivity measures allow you to monitor the performance of your organisation and compare it against some standard to identify areas for improvement and actions to be taken. They also serve as a useful communication tool to motivate employees and reinforce performance.
Productivity Level and Growth
Organisations should monitor and analyse their productivity performance in terms of the productivity level measured by the various productivity indicators. Productivity levels reflect how efficiently and effectively an organisation’s resources are used. Comparisons of productivity levels must be made between similar entities, such as two companies within the same industry.
In addition, organisations must track their productivity growth, which is an indicator of the change in productivity level over time. Productivity growth indicates dynamism and the potential for achieving higher productivity levels in the future. It is expressed as a percentage.
Comparison of Performance
To know how well your organisation is faring, you may compare and evaluate its productivity performance against targets or past performance.
A comparison can also be made against your competitors using the Inter-Firm Comparison (IFC) tool, as well as against benchmarks and best-in-class performers for further improvement.
Inter-Firm Comparison
Inter-Firm Comparison (IFC) studies involve comparisons of a common set of key productivity indicators identified for organisations in the same line of business. The identities of the
“ Without a standard there is no logical basis for making a
decision or taking action.“- Joseph M. Juran
20 SPRING Singapore
organisations are not revealed to maintain confidentiality. Data provided by the organisations are aggregated and presented in terms of percentage changes, indices and ratios.
Organisations may also compare their productivity performance against the industry average. Industry data for the manufacturing sector are available from statistics published by the Economic Development Board in its annual Report on the Census of Manufacturing Activities. Services sector data are available from the Economic Surveys Series published by the Singapore Department of Statistics. Industries are classified by the Singapore Standard Industrial Classification (SSIC), which is based on the basic principles used in international statistical standards to facilitate comparison with other countries.
Benchmarking
Benchmarking is a systematic process of comparing processes and performance against others, to improve business practices.
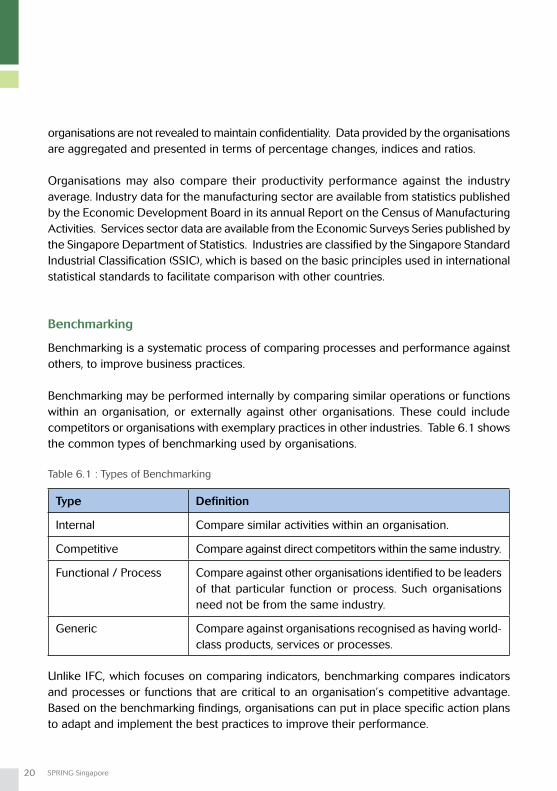
Benchmarking may be performed internally by comparing similar operations or functions within an organisation, or externally against other organisations. These could include competitors or organisations with exemplary practices in other industries. Table 6.1 shows the common types of benchmarking used by organisations.
Unlike IFC, which focuses on comparing indicators, benchmarking compares indicators and processes or functions that are critical to an organisation’s competitive advantage. Based on the benchmarking findings, organisations can put in place specific action plans to adapt and implement the best practices to improve their performance.
Table 6.1 : Types of Benchmarking
Type Definition
Internal Compare similar activities within an organisation.
Competitive Compare against direct competitors within the same industry.
Functional / Process Compare against other organisations identified to be leaders of that particular function or process. Such organisations need not be from the same industry.
Generic Compare against organisations recognised as having world-class products, services or processes.
21A Guide to Productivity Measurement
Use of Productivity Measures to Guide and Change Behaviour
Productivity Measures as a Communication Tool
Productivity measures may be used by management as a communication tool to direct employees’ efforts towards the common goal of improving productivity. The measures provide information on current performance, goals, and what it takes for the employees to reach them.
Productivity Measures to Motivate and Reinforce Performance
Productivity measures quantify and facilitate an objective assessment of employees’ performance. They provide information on performance gaps and help to identify the training needs of employees.
To motivate and reinforce productivity performance, productivity measures may be used to recognise and reward performance. This can be done by giving out awards to individuals or teams based on their contributions to productivity efforts.
In addition, productivity measures play a key role in productivity gainsharing schemes. Based on a formula agreed upon by both management and the employees, a proportion of the value added or wealth created by the organisation is distributed to employees in the form of a bonus or incentive payout. Productivity gainsharing promotes teamwork and fosters a culture of continuous productivity improvement.
Employees should have a clear understanding of how they are being appraised and the type of behaviour and performance that is recognised by the organisation.
6 What Do You Do With Productivity Measures?
22 SPRING Singapore
CONCLUSION7
Productivity measurement is an important means to an end. It provides valuable information on how an organisation is performing, where it would like to be, and how it can achieve its goals.
Productivity measures are only useful if they reflect the goals and objectives of the organisation, and used to bring about action and productivity improvements. This requires commitment from senior management, teamwork and participation from all employees.
Data becomes information only when it is viewed in an idea
or context. “
“ - Edward de Bono
23A Guide to Productivity Measurement
CONCLUSION
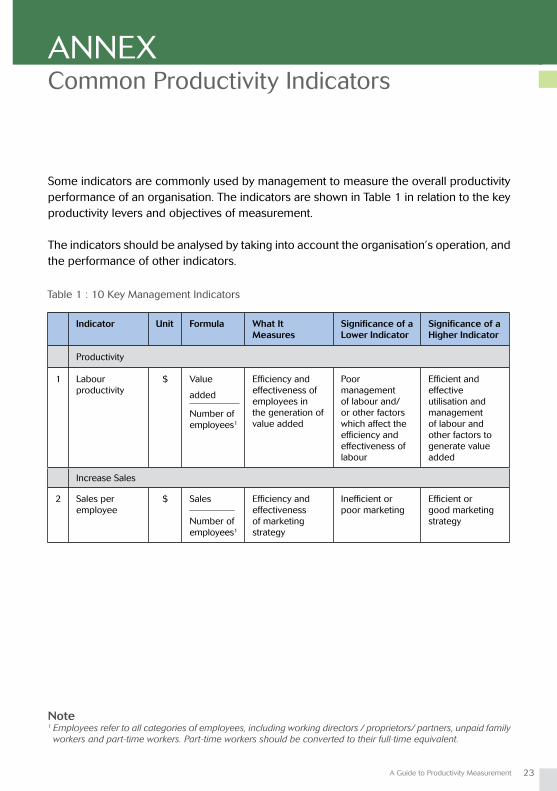
Some indicators are commonly used by management to measure the overall productivity performance of an organisation. The indicators are shown in Table 1 in relation to the key productivity levers and objectives of measurement.
The indicators should be analysed by taking into account the organisation’s operation, and the performance of other indicators.
Common Productivity IndicatorsANNEX
Indicator Unit Formula What It Measures
Significance of a Lower Indicator
Significance of a Higher Indicator
Productivity
1 Labour productivity
$ Value
added
Number of employees1
Efficiency and effectiveness of employees in the generation of value added
Poor management of labour and/or other factors which affect the efficiency and effectiveness of labour
Efficient and effective utilisation and management of labour and other factors to generate value added
Increase Sales
2 Sales per employee
$ Sales
Number of employees1
Efficiency and effectiveness of marketing strategy
Inefficient or poor marketing
Efficient or good marketing strategy
Table 1 : 10 Key Management Indicators
Note1 Employees refer to all categories of employees, including working directors / proprietors/ partners, unpaid family workers and part-time workers. Part-time workers should be converted to their full-time equivalent.
24 SPRING Singapore
Indicator Unit Formula What It Measures
Significance of a Lower Indicator
Significance of a Higher Indicator
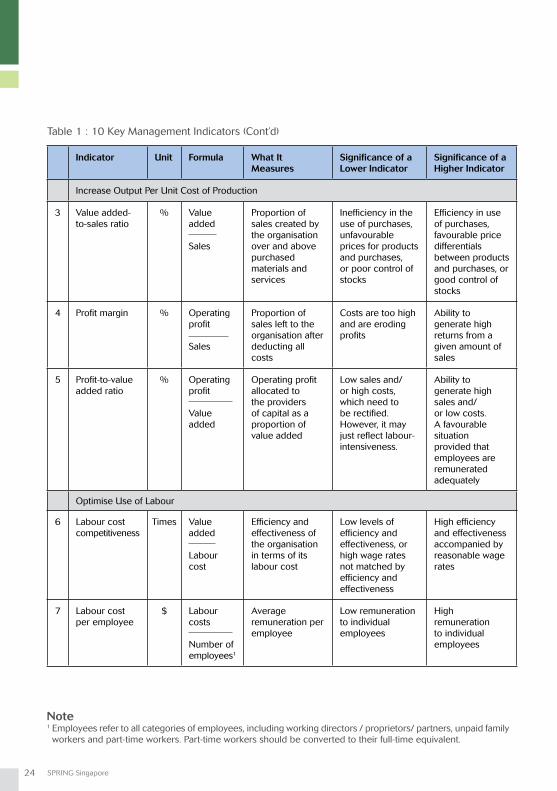
Increase Output Per Unit Cost of Production
3 Value added-to-sales ratio
% Value added
Sales
Proportion of sales created by the organisation over and above purchased materials and services
Inefficiency in the use of purchases, unfavourable prices for products and purchases, or poor control of stocks
Efficiency in use of purchases, favourable price differentials between products and purchases, or good control of stocks
4 Profit margin % Operating profit
Sales
Proportion of sales left to the organisation after deducting all costs
Costs are too high and are eroding profits
Ability to generate high returns from a given amount of sales
5 Profit-to-value added ratio
% Operating profit
Value added
Operating profit allocated to the providers of capital as a proportion of value added
Low sales and/or high costs, which need to be rectified. However, it may just reflect labour-intensiveness.
Ability to generate high sales and/or low costs. A favourable situation provided that employees are remunerated adequately
Optimise Use of Labour
6 Labour cost competitiveness
Times Value added
Labour cost
Efficiency and effectiveness of the organisation in terms of its labour cost
Low levels of efficiency and effectiveness, or high wage rates not matched by efficiency and effectiveness
High efficiency and effectiveness accompanied by reasonable wage rates
7 Labour cost per employee
$ Labour costs
Number of employees1
Average remuneration per employee
Low remuneration to individual employees
High remuneration to individual employees
Table 1 : 10 Key Management Indicators (Cont’d)
Note1 Employees refer to all categories of employees, including working directors / proprietors/ partners, unpaid family workers and part-time workers. Part-time workers should be converted to their full-time equivalent.
25A Guide to Productivity Measurement
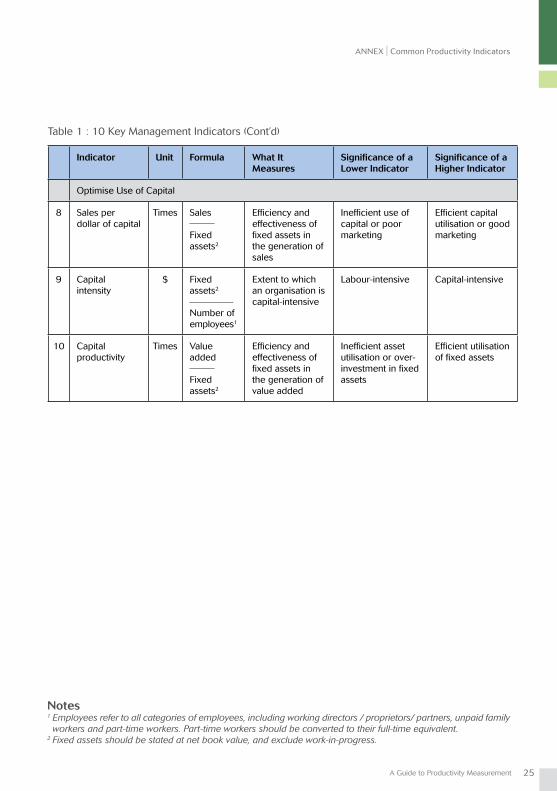
Notes1 Employees refer to all categories of employees, including working directors / proprietors/ partners, unpaid family workers and part-time workers. Part-time workers should be converted to their full-time equivalent.2 Fixed assets should be stated at net book value, and exclude work-in-progress.
ANNEX Common Productivity Indicators
Indicator Unit Formula What It Measures
Significance of a Lower Indicator
Significance of a Higher Indicator
Optimise Use of Capital
8 Sales per dollar of capital
Times Sales
Fixed assets2
Efficiency and effectiveness of fixed assets in the generation of sales
Inefficient use of capital or poor marketing
Efficient capital utilisation or good marketing
9 Capital intensity
$ Fixed assets2
Number of employees1
Extent to which an organisation is capital-intensive
Labour-intensive Capital-intensive
10 Capital productivity
Times Value added
Fixed assets2
Efficiency and effectiveness of fixed assets in the generation of value added
Inefficient asset utilisation or over-investment in fixed assets
Efficient utilisation of fixed assets
Table 1 : 10 Key Management Indicators (Cont’d)
26 SPRING Singapore
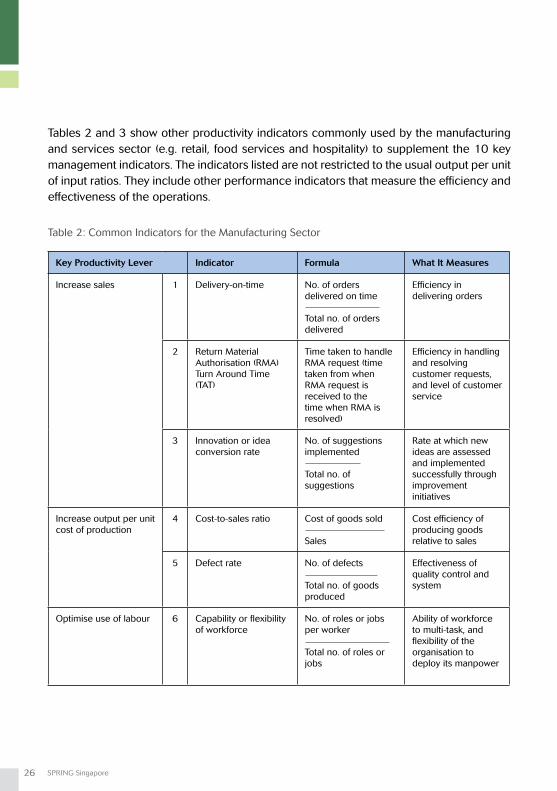
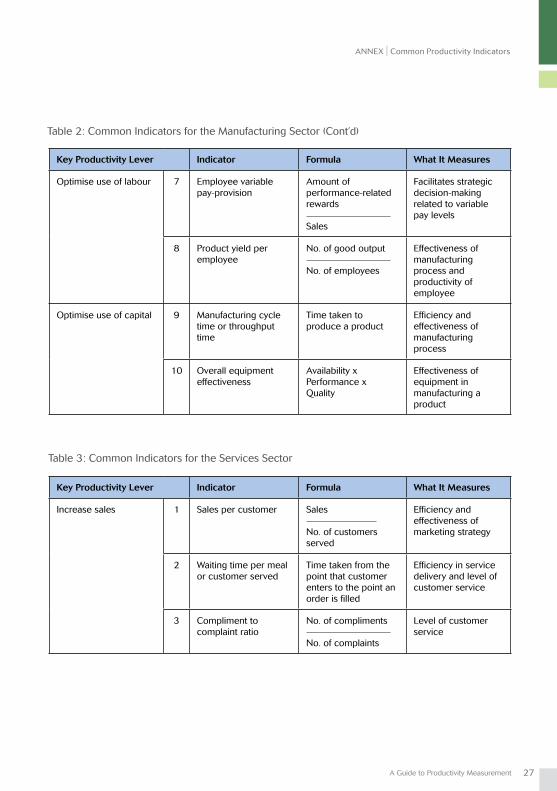
Tables 2 and 3 show other productivity indicators commonly used by the manufacturing and services sector (e.g. retail, food services and hospitality) to supplement the 10 key management indicators. The indicators listed are not restricted to the usual output per unit of input ratios. They include other performance indicators that measure the efficiency and effectiveness of the operations.
Table 2: Common Indicators for the Manufacturing Sector
Key Productivity Lever Indicator Formula What It Measures
Increase sales 1 Delivery-on-time No. of orders delivered on time
Total no. of orders delivered
Efficiency in delivering orders
2 Return Material Authorisation (RMA) Turn Around Time (TAT)
Time taken to handle RMA request (time taken from when RMA request is received to the time when RMA is resolved)
Efficiency in handling and resolving customer requests, and level of customer service
3 Innovation or idea conversion rate
No. of suggestions implemented
Total no. of suggestions
Rate at which new ideas are assessed and implemented successfully through improvement initiatives
Increase output per unit cost of production
4 Cost-to-sales ratio Cost of goods sold
Sales
Cost efficiency of producing goods relative to sales
5 Defect rate No. of defects
Total no. of goods produced
Effectiveness of quality control and system
Optimise use of labour 6 Capability or flexibility of workforce
No. of roles or jobs per worker
Total no. of roles or jobs
Ability of workforce to multi-task, and flexibility of the organisation to deploy its manpower
27A Guide to Productivity Measurement
ANNEX Common Productivity Indicators
Table 3: Common Indicators for the Services Sector
Key Productivity Lever Indicator Formula What It Measures
Optimise use of labour 7 Employee variable pay-provision
Amount of performance-related rewards
Sales
Facilitates strategic decision-making related to variable pay levels
8 Product yield per employee
No. of good output
No. of employees
Effectiveness of manufacturing process and productivity of employee
Optimise use of capital 9 Manufacturing cycle time or throughput time
Time taken to produce a product
Efficiency and effectiveness of manufacturing process
10 Overall equipment effectiveness
Availability x Performance x Quality
Effectiveness of equipment in manufacturing a product
Key Productivity Lever Indicator Formula What It Measures
Increase sales 1 Sales per customer Sales
No. of customers served
Efficiency and effectiveness of marketing strategy
2 Waiting time per meal or customer served
Time taken from the point that customer enters to the point an order is filled
Efficiency in service delivery and level of customer service
3 Compliment to complaint ratio
No. of compliments
No. of complaints
Level of customer service
Table 2: Common Indicators for the Manufacturing Sector (Cont’d)
28 SPRING Singapore
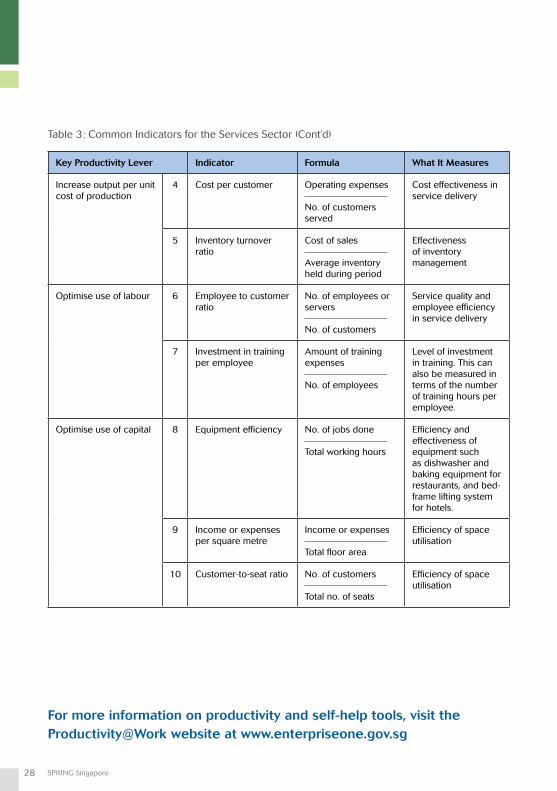
Key Productivity Lever Indicator Formula What It Measures
Increase output per unit cost of production
4 Cost per customer Operating expenses
No. of customers served
Cost effectiveness in service delivery
5 Inventory turnover ratio
Cost of sales
Average inventory held during period
Effectiveness of inventory management
Optimise use of labour 6 Employee to customer ratio
No. of employees or servers
No. of customers
Service quality and employee efficiency in service delivery
7 Investment in training per employee
Amount of training expenses
No. of employees
Level of investment in training. This can also be measured in terms of the number of training hours per employee.
Optimise use of capital 8 Equipment efficiency No. of jobs done
Total working hours
Efficiency and effectiveness of equipment such as dishwasher and baking equipment for restaurants, and bed-frame lifting system for hotels.
9 Income or expenses per square metre
Income or expenses
Total floor area
Efficiency of space utilisation
10 Customer-to-seat ratio No. of customers
Total no. of seats
Efficiency of space utilisation
For more information on productivity and self-help tools, visit the Productivity@Work website at www.enterpriseone.gov.sg
Table 3: Common Indicators for the Services Sector (Cont’d)


SPRING SingaporeSolaris, 1 Fusionopolis Walk, #01-02 South Tower, Singapore 138628
Tel: +65 6278 6666 • Fax: +65 6278 6667 www.spring.gov.sg