Embed Size (px)
Citation preview

The Unscrambler®
A Handy Tool for Doing ChemometricsProf. Waltraud KesslerProf. Dr. Rudolf Kessler
Hochschule Reutlingen, School of Applied ChemistrySteinbeistransferzentrum Prozesskontrolle und Datenanalyse
Camo Process AS
2
Topics
• The Unscrambler® by Camo• Many possibilities for Analysing Data
• Examples • NIR-Spectra• Fluorescence Exitation Emission Spectra
• Life Demonstration• 3-way Data Handling
3
The Unscrambler® Main Features
Exploratory AnalysisDescriptive statisticsPrincipal Component Analysis (PCA)
Multivariate Regression AnalysisPartial Least Squares regression (PLS)Principal Component Regression (PCR)Multiple Linear Regression (MLR)Prediction
ClassificationSoft Independent Modeling of Class Analogies (SIMCA)PLS-Discriminant Analysis
Experimental DesignFractional and full factorial designs, Placket-Burmann,
Box Behnken, Central Composite, Classical mixture designs, D-optimal designs
ANOVA, Response Surface ANOVA, PLS-R
4
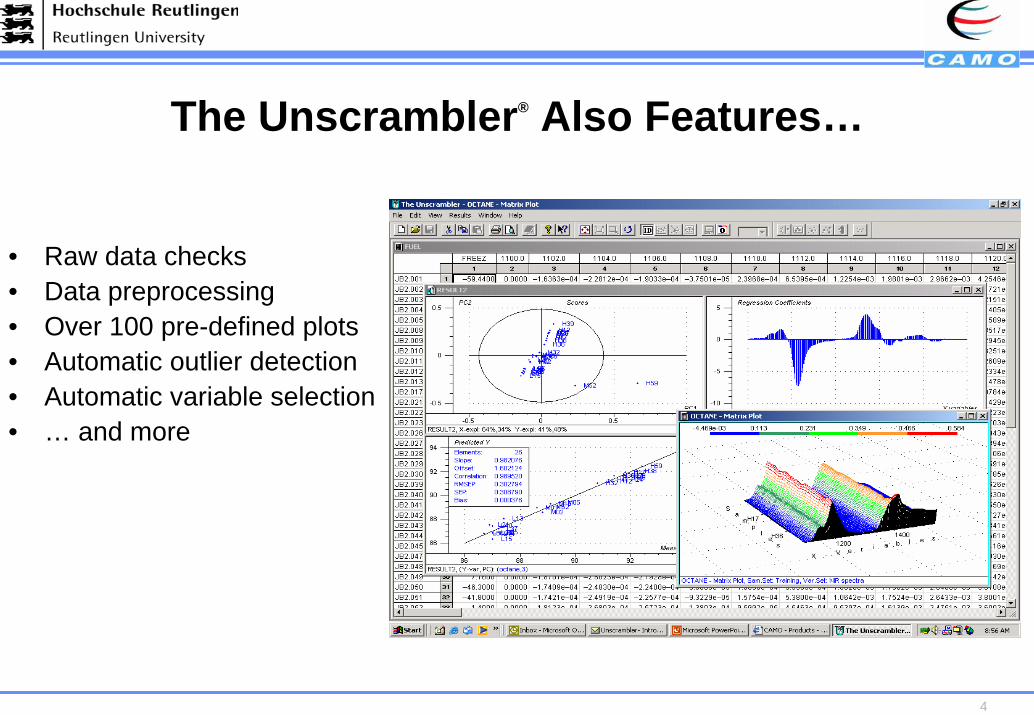
The Unscrambler® Also Features…
• Raw data checks• Data preprocessing• Over 100 pre-defined plots• Automatic outlier detection• Automatic variable selection• … and more
5
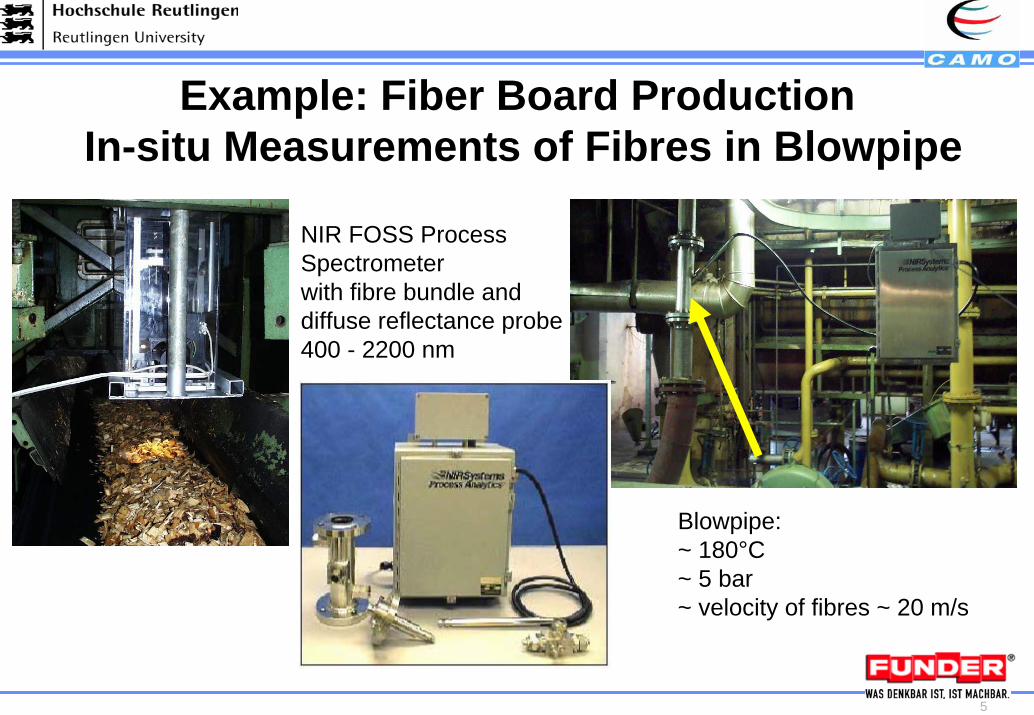
Example: Fiber Board ProductionIn-situ Measurements of Fibres in Blowpipe
Blowpipe:~ 180°C~ 5 bar~ velocity of fibres ~ 20 m/s
NIR FOSS ProcessSpectrometerwith fibre bundle and diffuse reflectance probe 400 - 2200 nm
6
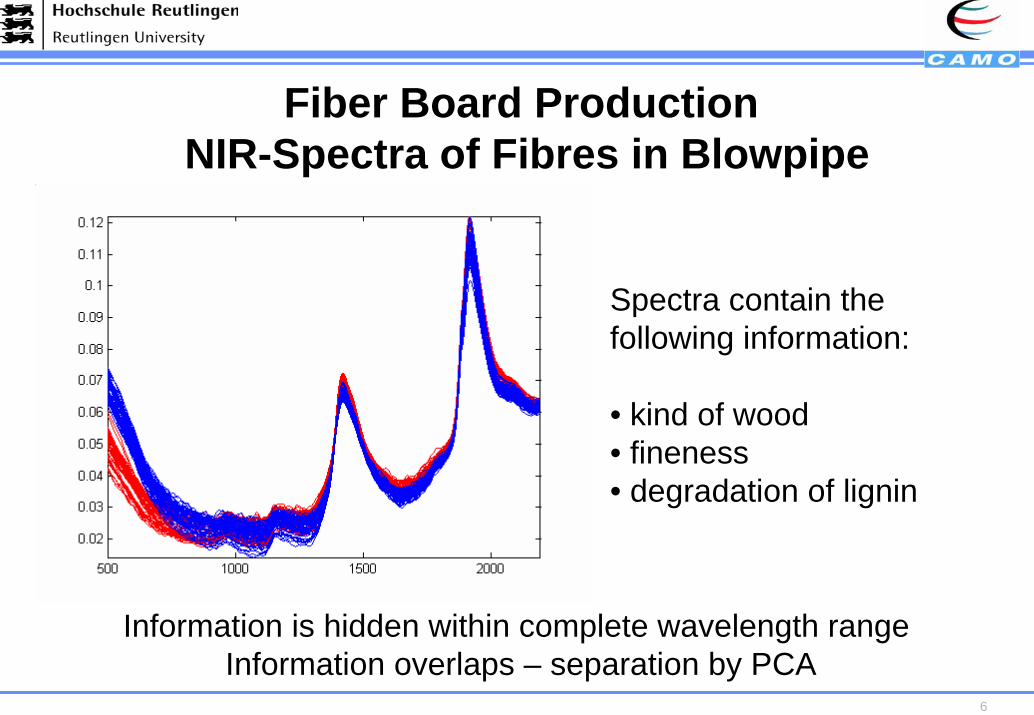
Fiber Board ProductionNIR-Spectra of Fibres in Blowpipe
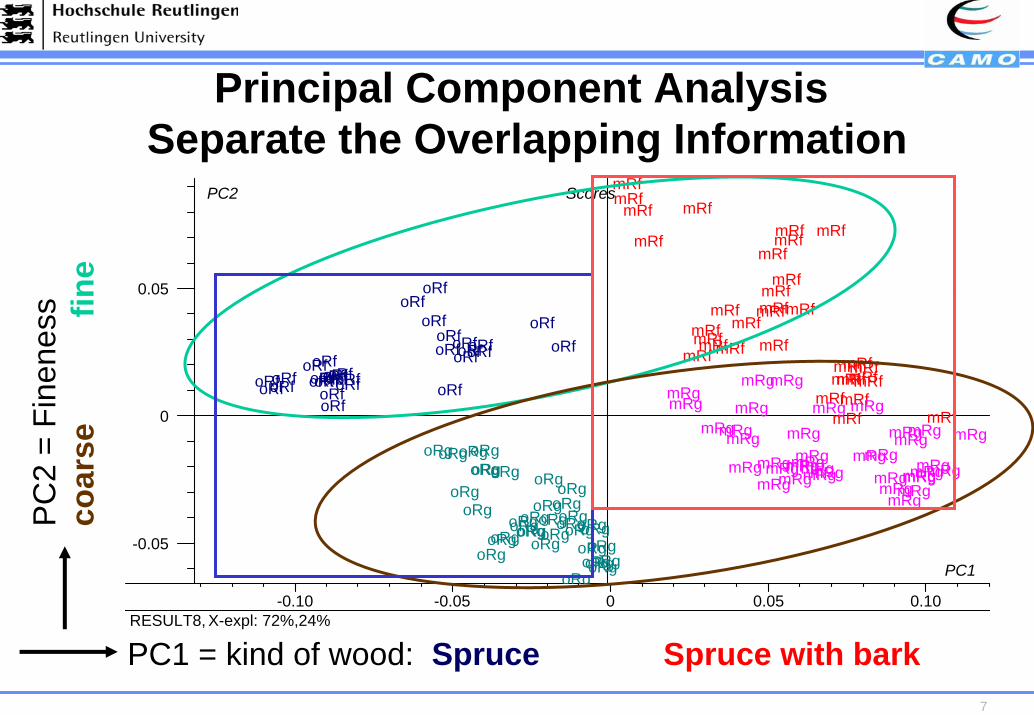
Spectra contain the following information:
• kind of wood • fineness• degradation of lignin
Information is hidden within complete wavelength range Information overlaps – separation by PCA
7
-0.05
0
0.05
-0.10 -0.05 0 0.05 0.10 RESULT8, X-expl: 72%,24%
oRfoRfoRfoRf oRfoRfoRf
oRfoRfoRfoRfoRfoRfoRfoRf
oRfoRf
oRfoRf
oRfoRf
oRfoRf
oRf
oRfoRf oRfoRfoRfoRf
oRg
oRgoRg
oRgoRgoRgoRgoRgoRg
oRgoRg
oRgoRgoRgoRgoRg
oRgoRgoRg
oRg
oRgoRgoRgoRg
oRg
oRgoRgoRgoRgoRgoRg
oRg
oRg
oRg
oRgoRg
mRf
mRf
mRf
mRf
mRfmRf
mRf
mRfmRfmRfmRf
mRf
mRfmRfmRfmRf
mRf
mRfmRfmRfmRf
mRf mRf
mRfmRf
mRfmRfmRf
mRfmRf
mRfmRfmRf
mRg
mRgmRg
mRg
mRg
mRgmRg
mRgmRgmRg
mRgmRgmRgmRg
mRgmRgmRgmRgmRgmRgmRgmRg
mRgmRgmRgmRgmRg
mRg
mRgmRg
mRgmRg
mRg
mRgmRg
mRgmRgmRg
PC1
PC2 Scores
Principal Component AnalysisSeparate the Overlapping Information
PC
2 =
Fine
ness
coar
sefin
e
PC1 = kind of wood: Spruce Spruce with bark
8
-0.1
0
0.1
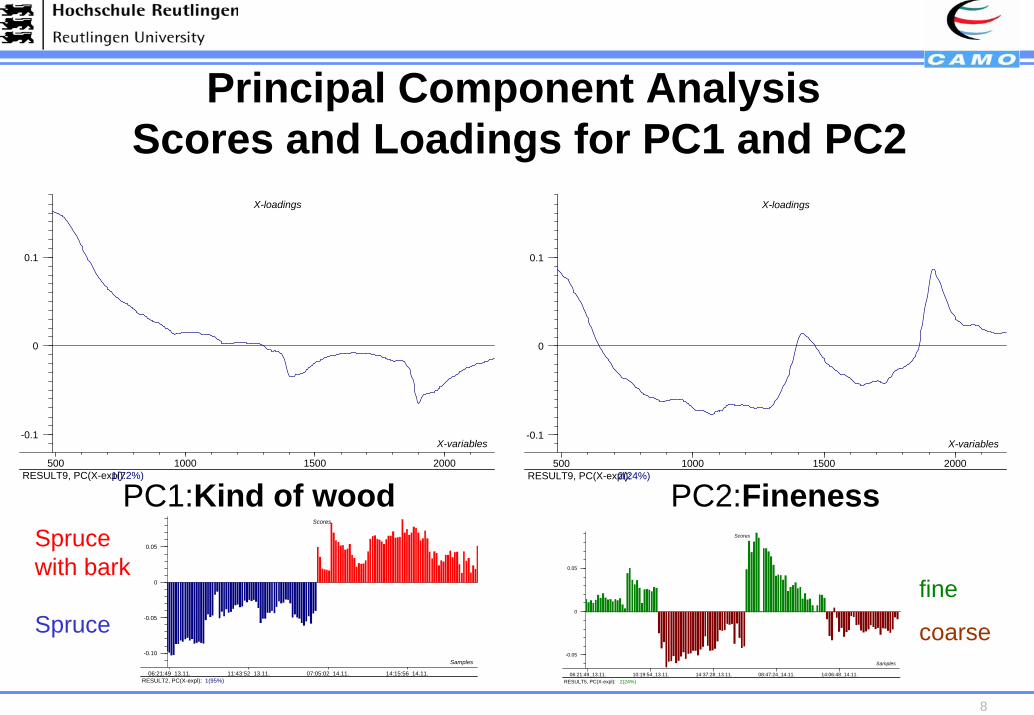
500 1000 1500 2000 RESULT9, PC(X-expl): 1(72%)
X-variables
X-loadings
PC1:Kind of wood
Principal Component AnalysisScores and Loadings for PC1 and PC2
-0.10
-0.05
0
0.05
06:21:49_13.11. 11:43:52_13.11. 07:05:02_14.11. 14:15:56_14.11. RESULT2, PC(X-expl): 1(95%)
Samples
Scores
-0.1
0
0.1
500 1000 1500 2000 RESULT9, PC(X-expl): 2(24%)
X-variables
X-loadings
-0.05
0
0.05
06:21:49_13.11. 10:19:54_13.11. 14:37:28_13.11. 08:47:24_14.11. 14:06:48_14.11. RESULT5, PC(X-expl): 2(24%)
Samples
Scores
PC2:FinenessSprucewith bark
Sprucefine
coarse
9
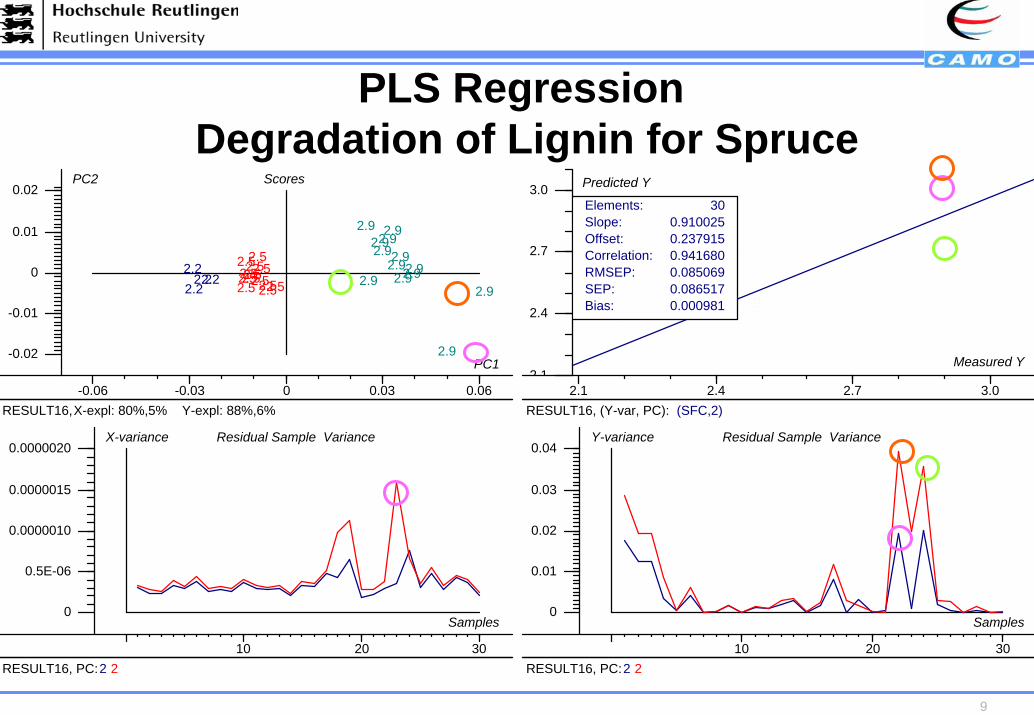
PLS RegressionDegradation of Lignin for Spruce
-0.02
-0.01
0
0.01
0.02
-0.06 -0.03 0 0.03 0.06 RESULT16, X-expl: 80%,5% Y-expl: 88%,6%
2.22.22.22.2
2.52.5
2.52.5
2.52.52.52.52.52.52.52.5
2.5
2.9 2.92.92.9
2.9
2.9
2.9 2.9
2.9
2.92.92.92.9
PC1
PC2 Scores
2 1
2.4
2.7
3.0
2.1 2.4 2.7 3.0 RESULT16, (Y-var, PC): (SFC,2)
Elements:Slope:Offset:Correlation:RMSEP:SEP:Bias:
300.9100250.2379150.9416800.0850690.0865170.000981
Measured Y
Predicted Y
0
0.5E-06
0.0000010
0.0000015
0.0000020
10 20 30 RESULT16, PC: 2 2
Samples
X-variance Residual Sample Variance
0
0.01
0.02
0.03
0.04
10 20 30 RESULT16, PC: 2 2
Samples
Y-variance Residual Sample Variance
10
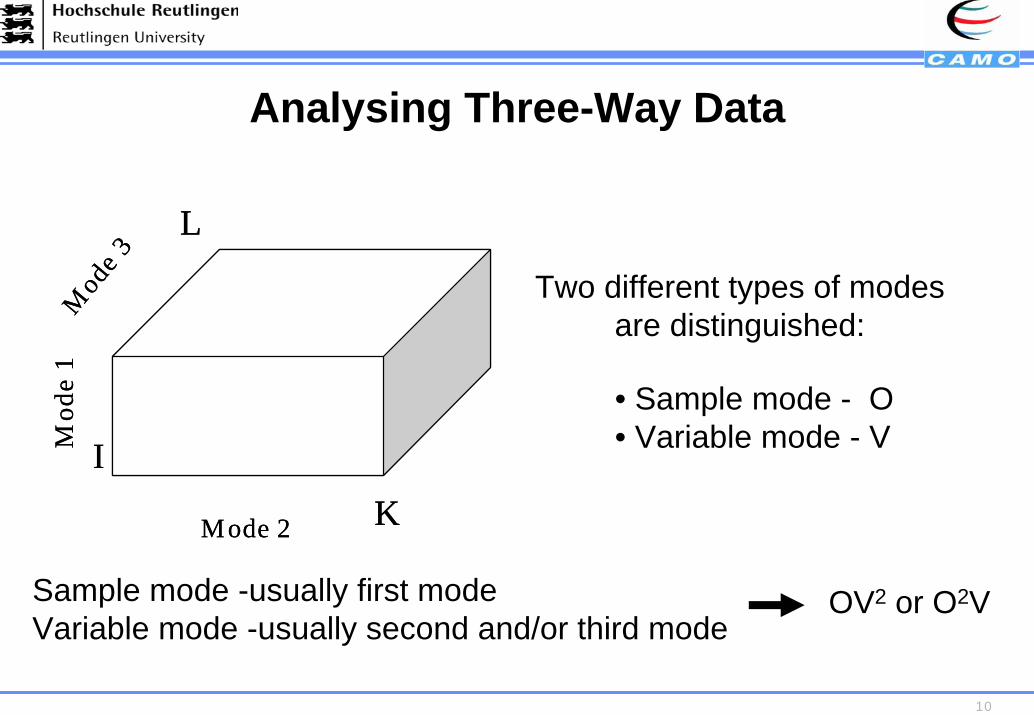
Analysing Three-Way Data
Mode 2
Mod
e 1
Mod
e 3
I
L
KMode 2
Mod
e 1
Mod
e 3
I
L
K
Two different types of modesare distinguished:
Sample mode -usually first modeVariable mode -usually second and/or third mode
• Sample mode - O• Variable mode - V
OV2 or O2V
11
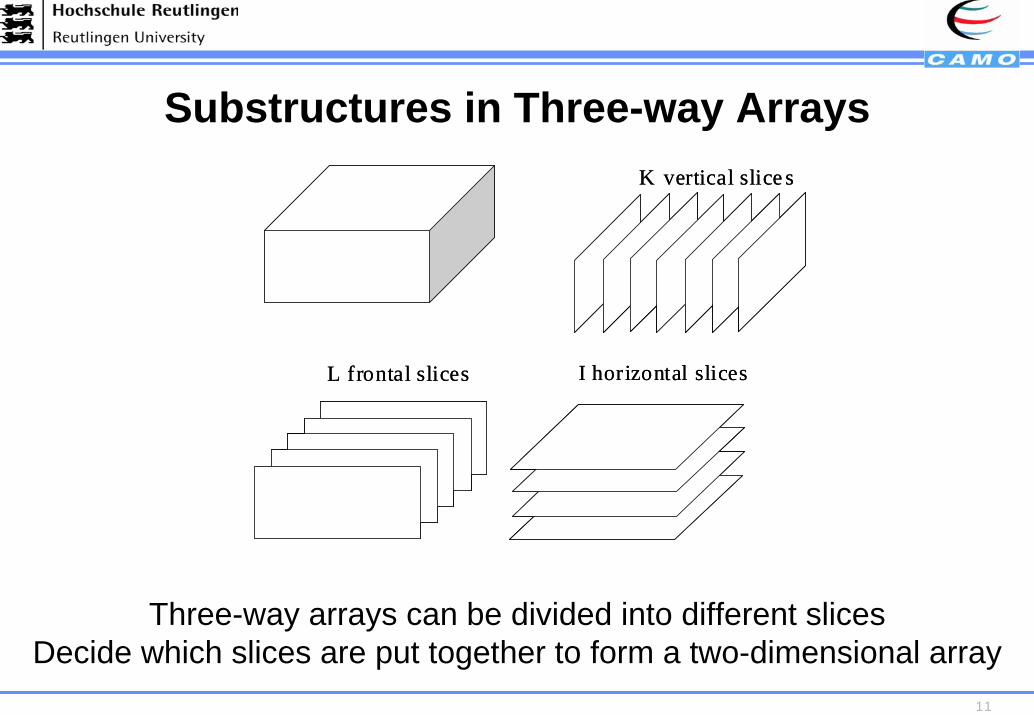
Substructures in Three-way Arrays
L frontal slices I horizontal slices
K vertical slice s
L frontal slices I horizontal slices
K vertical slice s
Three-way arrays can be divided into different slicesDecide which slices are put together to form a two-dimensional array
12
• Samples: 32 fibres from steam treated and ground woodchips
• X-Data: Fluorescence Excitation-Emission spectra(250 - 575 nm) x (300 - 600 nm)
• Y-Data: Kind of wood (beech and spruce)Severity of treatment (a combination of time and temperature)Age of wood (fresh and old) Plate gap of grinding ( fine and coarse).
Three-way Data Example: Fluorescence Excitation Emission Spectra
13
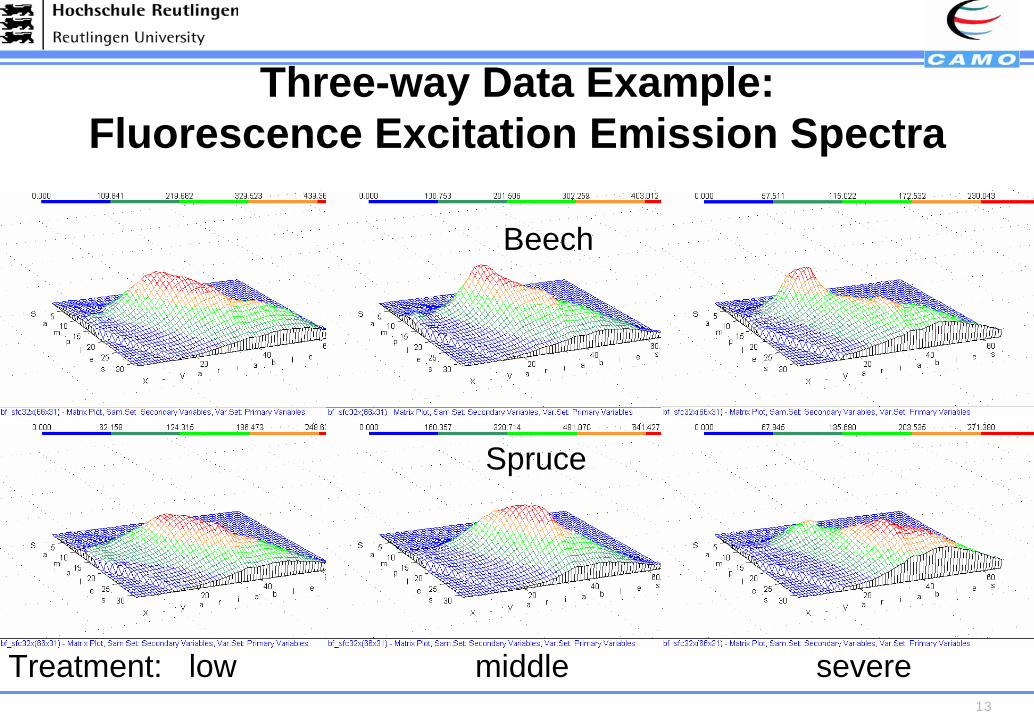
Three-way Data Example: Fluorescence Excitation Emission Spectra
Beech
Spruce
Treatment: low middle severe
14
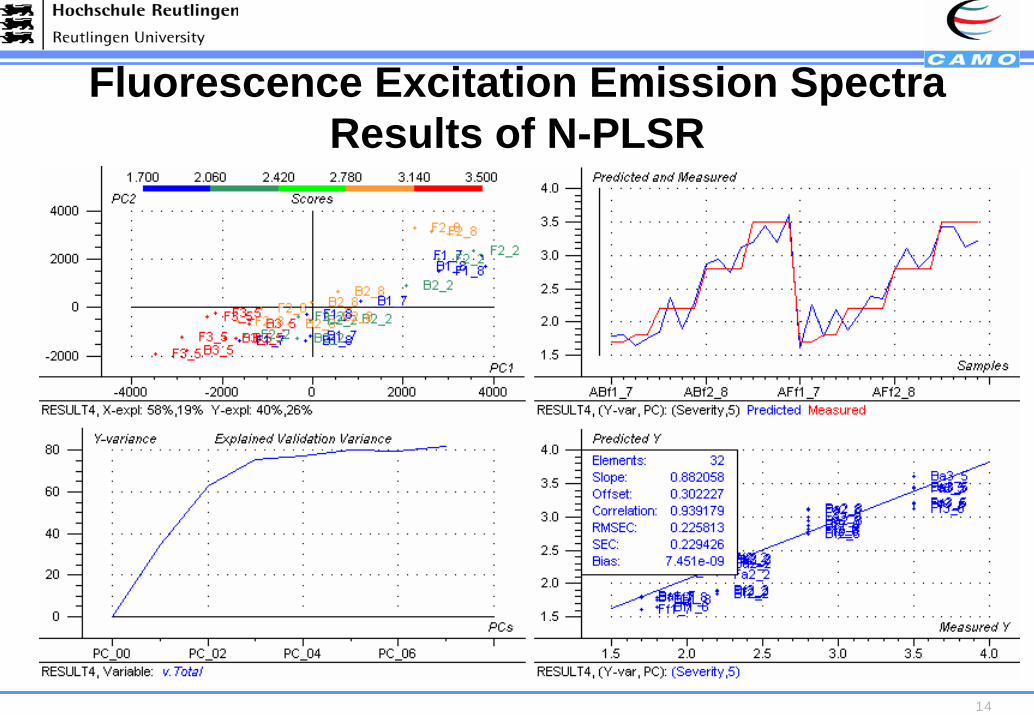
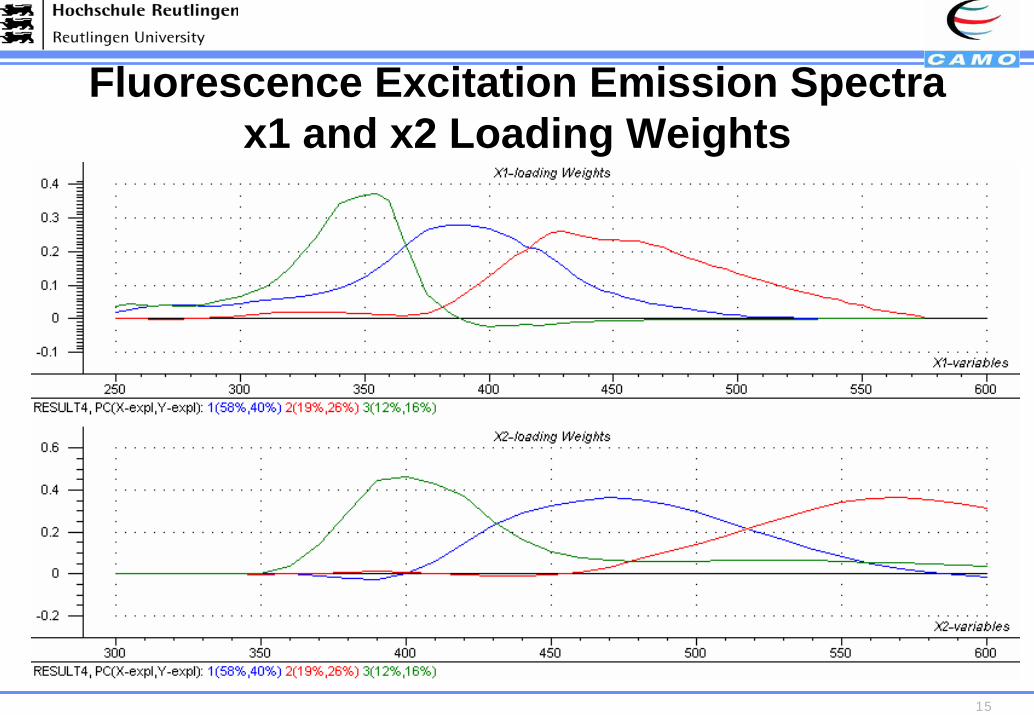
Fluorescence Excitation Emission SpectraResults of N-PLSR
15
Fluorescence Excitation Emission Spectrax1 and x2 Loading Weights
16
• 3D Data Import: ASCII, Excel, JCAMP-DX, Matlab
• Swapping: toggle freely between the 6 OV2 and 6 O2Vlayouts of a 3D table
• Matrix plots: Contour and landscape plots of the samples
• Variable sets: Create Primary variable sets and Secondary Variables sets
Possibilities for Three-way Data in The Unscrambler®
17
• Easy to make models• Easy to interpret results• High user-friendliness• Less time spent doing data analysis,
more information extracted from your data• Faster decision making
The Unscrambler® Benefits
18
Fully functioning versionIncludes the Unscrambler user manualIncludes 7 tutorial exercises and associated filesIncludes 3 demonstration tours
Try The Unscrambler® 9.2 for 30 days
Free trial version available on www.camo.com
CAMO Software India Pvt. Ltd.,14 -15, Krishna Reddy Colony, Domlur Layout,Bangalore - 560071, [email protected]
For details, contact: