Embed Size (px)
Citation preview
RESEARCH ARTICLE
A Longitudinal Analysis of Mosquito NetOwnership and Use in an Indigenous BatwaPopulation after a Targeted DistributionSierra Clark1*, Lea Berrang-Ford2*, Shuaib Lwasa3, Didacus Namanya4,Sabastian Twesigomwe5, IHACC Research Team6¶, Manisha Kulkarni7
1 Dept of Epidemiology, McGill University, Montreal, Quebec, Canada, 2 Dept of Geography, McGillUniversity, Montreal, Quebec, Canada, 3 Dept of Geography, Makerere University, Kampala, Uganda,4 Ministry of Health, Kampala, Uganda, 5 Batwa Development Programme, Buhoma, southwesternUganda, 6 Indigenous Health Adaptation to Climate Change Research Team, McGill University, Montreal,Canada, 7 School of Epidemiology, Public Health and Preventive Medicine, University of Ottawa, Ottawa,Ontario, Canada
¶ Membership of the IHACC Research Team is listed in the Acknowledgments.* [email protected] (LBF); [email protected] (SC)
AbstractMajor efforts for malaria prevention programs have gone into scaling up ownership and use
of insecticidal mosquito nets, particularly in sub-Saharan Africa where the malaria burden is
high. Socioeconomic inequities in access to long lasting insecticidal nets (LLINs) are
reduced with free distributions of nets. However, the relationship between social factors and
retention of nets after a free distribution has been less studied, particularly using a longitudi-
nal approach. Our research aimed to estimate the ownership and use of LLINs, and exam-
ine the determinants of LLIN retention, within an Indigenous Batwa population after a free
LLIN distribution. Two LLINs were given free of charge to each Batwa household in
Kanungu District, Uganda in November 2012. Surveyors collected data on LLIN ownership
and use through six cross-sectional surveys pre- and post-distribution. Household retention,
within household access, and individual use of LLINs were assessed over an 18-month
period. Socioeconomic determinants of household retention of LLINs post-distribution were
modelled longitudinally using logistic regression with random effects. Direct house-to-
house distribution of free LLINs did not result in sustainable increases in the ownership and
use of LLINs. Three months post-distribution, only 73% of households owned at least one
LLIN and this period also saw the greatest reduction in ownership compared to other study
periods. Eighteen-months post distribution, only a third of households still owned a LLIN.
Self-reported age-specific use of LLINs was generally higher for children under five,
declined for children aged 6–12, and was highest for older adults aged over 35. In the
model, household wealth was a significant predictor of LLIN retention, controlling for time
and other variables. This research highlights on-going socioeconomic inequities in access
to malaria prevention measures among the Batwa in southwestern Uganda, even after free
distribution of LLINs, and provides critical information to inform local malaria programs on
PLOSONE | DOI:10.1371/journal.pone.0154808 May 4, 2016 1 / 20
a11111
OPEN ACCESS
Citation: Clark S, Berrang-Ford L, Lwasa S,Namanya D, Twesigomwe S, IHACC ResearchTeam, et al. (2016) A Longitudinal Analysis ofMosquito Net Ownership and Use in an IndigenousBatwa Population after a Targeted Distribution. PLoSONE 11(5): e0154808. doi:10.1371/journal.pone.0154808
Editor: Philip Anglewicz, Tulane University School ofPublic Health, UNITED STATES
Received: September 7, 2015
Accepted: April 19, 2016
Published: May 4, 2016
Copyright: © 2016 Clark et al. This is an openaccess article distributed under the terms of theCreative Commons Attribution License, which permitsunrestricted use, distribution, and reproduction in anymedium, provided the original author and source arecredited.
Data Availability Statement: Our data is availableupon request by the corresponding author SierraClark <[email protected]>, the IHACCproject manager Ms. Michelle Maillet <[email protected]>, and the IHACC databasemanager Ms. Kaitlin Patterson <[email protected]>. The Indigenous Batwacommunity-members we work with are a smallpopulation (~700) of which our dataset is essentially acensus. We do not have ethical approval to publiclyrelease this dataset given the potential for reverse
possible intervention entry-points to increase access and use among this marginalized
population.
IntroductionInsecticide-treated nets (ITNs) and long-lasting insecticidal nets (LLINs) are well recognized ascost-efficient and highly effective interventions for reducing the burden of malaria in endemicregions in sub-Saharan Africa [1]. Treating mosquito nets with an insecticide provides doubleprotection: nets provide a direct barrier against host-biting mosquitoes for the person(s) sleep-ing under them; and mosquitoes may be killed if they come into contact with the insecticide,extending protection to non-users through reduced vector abundance [2]. Building on previousglobal targets, the recent World Health Organization (WHO) technical plan calls for a scale upof the distribution of LLINs to achieve universal coverage in high-risk areas in order to reducemalaria mortality by 40% of the current rate by 2020 and 90% by 2030 [3,4].
A core focus of free mosquito net distribution campaigns has been equitable coverage–within and between populations–with the goal of reducing disparities in access to preventivemeasures for economically or socially marginalized sub-populations. Previous studies showthat large-scale, free net distribution campaigns can reduce inequities in household net owner-ship across socio-economic gradients, relative to other forms of distribution [5–10]. Inequitiesin ownership and use may still persist, however, preventing those among the lowest socioeco-nomic strata from accessing and retaining malaria preventative measures [10,11]. Socioeco-nomic factors, such as household wealth and education, have been identified as consistent andimportant predictors of mosquito net acquisition in the absence of free-distribution campaigns[7,8,12]. However, very few studies have longitudinally investigated the extent to which netretention and continued use are patterned by socio-economic gradients after a free distribution[11,13–16]. It has been postulated that, over the long-term, households that receive nets free ofcharge may experience greater net attrition compared to households that purchase nets. Forexample, in a study that investigated alternate uses of mosquito nets in Ghana, Senegal, Nigeriaand Uganda, nets from a free distribution campaign were six-times more likely to be givenaway than nets purchased or obtained through other means [13]. Marginalized populationsmay be at a greater risk of net attrition following a free-distribution event, relative to less mar-ginalized populations, if a lack of resources incentivizes an alternative use of the net [17–19].Herein, our understanding of the role that socioeconomic gradients play in influencing theretention of LLINs by households remains limited.
Understanding patterns of LLIN ownership and use can provide contextual insight into pos-sible entry points for interventions, including those targeted at increasing rates of LLIN access,LLIN hanging, and sleeping under existing LLINs [20]. According to a framework proposed byVanden Eng et al [20], individuals can be classified into one of four categories of net use ornon-use: 1) they may live in a household that does not own a net (non-use); 2) they may live ina household that owns a net, but does not hang the net (non-use); 3) they may live in a house-hold that owns and hangs a net but they themselves do not sleep under it (non-use); or 4) theymay sleep under a net (use). There is negligible research on access to, and use of, LLINs amongIndigenous populations in sub-Saharan Africa, despite evidence of significant socioeconomicand health inequalities of these populations [21]. Estimation and characterization of LLINnon-use for high-risk sub-populations, particularly vulnerable and marginalized peoples, willbe critical to meeting the Global Malaria Action Plan’s goals of universal coverage.
In Uganda, the Ministry of Health works in partnership with aid agencies to finance andstrategize malaria control initiatives in high-risk regions and for high-risk individuals [22].
Mosquito Net Retention for Indigenous Batwa
PLOSONE | DOI:10.1371/journal.pone.0154808 May 4, 2016 2 / 20
identification given the nature of our variables andsize of the sample. Furthermore, the Batwacommunity-members we work with are partners in theresearch and we do not have their approval topublicly release this data. The study participants arean Indigenous population that have in recent yearsundergone substantial political and socialmarginalization in Uganda, and anonymity in theiranswers is a paramount concern of ours when doingresearch among our partner communities. We havegained approval however to make the relevant dataavailable upon request to interested researchers.When, and if, the data is requested, a cleaned excelfile of the relevant household and/or individual-levelvariables used to carry out the analysis (contingenton the request) will be provided.
Funding: Funding was provided by the InternationalResearch Development Center (IDRC) Tri-CouncilInitiative on Adaptation to Climate Change,Indigenous Health Adaptation to Climate Change(IHACC), IDRC File nos. 106372-003, 004, 005. LBFand IHACC received the funding; Canadian Institutesfor Health Research (CIHR) Open Operating Grant,Adaptation to the health effects of climate changeamong Indigenous peoples in the global south (IP-ADAPT), Application no. 298312. LBF and IHACCreceived the funding. The funders had no role instudy design, data collection and analysis, decision topublish, or preparation of the manuscript.
Competing Interests: The authors have declaredthat no competing interests exist.
Abbreviations: LLIN, Long lasting insecticidal net;ITN, Insecticide-treated net; IHACC, IndigenousHealth Adaptation to Climate Change research group;BIC, Bayesian information criterion; HH, Household.
From the most recent Uganda Malaria Indicator Survey (MIS 2014), nearly 90% of all house-holds in Uganda had at least one LLIN, 74% of children under five slept under a LLIN thenight before the survey, and it was estimated that 79% of the population had access to an ITN[22]. The Uganda MIS 2014 reported that amongst the poorest households, a higher propor-tion owned at least one LLIN (91.5%) compared to amongst the wealthiest households (84.5%),which is likely the result of mass net distribution campaigns over the past decade. Indeed,93.3% of nets owned by the poorest households were obtained from a campaign compared to68% among the wealthiest households. Furthermore, only 2.1% of nets owned by the pooresthouseholds were purchased at a pharmacy, shop, or market, compared to 24.6% of netsobtained by households in the wealthiest quintile [22]. Within the context of mass distributioncampaigns, even though household socioeconomic gradients do not appear to disadvantage netownership for the poorest households at the national level, the most socially and ethnicallymarginalized populations, notably self-identifying Indigenous populations, are lost amongthese estimates. For example, the Indigenous Batwa of southwestern Uganda are an economi-cally, politically, and socially marginalized population that resides in the southwestern high-lands of Uganda. A previous survey conducted in the districts of Kabale and Kisoro in 2011estimated that only half of the Batwa households owned a mosquito net and nets were obtainedfrom a variety of sources, such as international aid agencies, the government, and church orga-nizations [23]. Only two percent of nets were purchased.
Herein, this research is situated in the southwestern Ugandan District of Kanungu, among10 formal Indigenous Batwa communities. The aim of this study was to estimate the levels ofownership and use of LLINs, and identify the socioeconomic determinants of LLIN retentionwithin an Indigenous Batwa population after a targeted LLIN distribution event. Specific objec-tives included to: 1) estimate the pre- and post-distribution levels of ownership and withinhousehold access to LLINs; 2) describe individual-level LLIN use and non-use patterns at 3 and18-months post-distribution; and 3) evaluate socioeconomic factors that affect householdretention of LLINs post-distribution.
Materials and Methods
Study PopulationThe Batwa of Kanungu District, southwestern Uganda, are an Indigenous population tradition-ally based on forest hunter-gatherer livelihoods in what has now been established as the BwindiImpenetrable National Park [24]. Due to recent environmental conservation, animal protec-tion, and ecotourism activities in the park, the Batwa were forced to relocate to lowland areasand take up sedentary-agrarian livelihoods [25–27]. The Batwa continue to live in settlementscharacterized by poorer conditions with less access to adequate shelter, safe water, and sanita-tion infrastructure than their non-Indigenous neighbors [23,28,29]. The majority of Batwaadults are engaged in income generating activities, mostly working as laborers on agriculturalfields, or casual laborers [23].
Distribution of LLINsA targeted distribution of long lasting insecticidal nets (LLIN) was undertaken in November2012 by an international research team (the Indigenous Health Adptation to Climate Change(IHACC) group:<www.ihacc.ca>) working in collaboration with McGill University, theUgandan Ministry of Health, Makerere University, and local development agencies, includingthe Batwa Development Programme (BDP). Two LLINs were provided free of charge to eachBatwa household present at the time of the distribution in each of the 10 formal Batwa commu-nities in Kanungu, which resulted in 98% of eligible households receiving two nets. The list of
Mosquito Net Retention for Indigenous Batwa
PLOSONE | DOI:10.1371/journal.pone.0154808 May 4, 2016 3 / 20
eligible households was derived from a full listing of households in the 10 Batwa settlements,maintained by a local community development organization. Two nets were given regardlessof prior net ownership within the household. LLINs were 100% polyester and treated with del-tamethrin (80mg/m2), effective with a median lifespan of approximately three years. Educationon the proper usage of nets occurred at the time of distribution, and a local health worker vis-ited the communities every few months to provide education on the causes of malaria andmalaria prevention. A list of households that received the IHACC LLINs was linked to the sub-sequent surveys with unique household identifiers assigned by the IHACC research group.
Uganda had two universal coverage campaigns prior to and during the study period. How-ever, the Batwa population only makes up 1% of the total population of residents in KanunguDistrict, and this marginalized population was not specifically targeted in these campaigns.Some examples of net distribution activities in Kanungu during the study period include: 1) in2011, one of the major hospitals, as part of a regional initiative funded by the government ofUganda, distributed subsidized nets to pregnant mothers and children under five years old inthe area at a cost of 3000 Ugandan shillings (~ $1.00 US); 2) in 2013, several thousand netswere donated to be distributed to young children (<5) and expectant mothers through thehealth centers in the area; and 3) in 2014, the Bwindi Community Hospital distributed 300ITNs to the highest risk areas during malaria awareness week.
Longitudinal MonitoringIn total, six cross-sectional, face-to-face, attempted census surveys were administered: one pre-distribution (December 2011), and five post-distribution at approximately 3-month intervalsfrom January 2013-April 2014 (Fig 1). Each survey attempted to capture a census of the Batwapopulation in Kanungu District. Non-participation in a survey was either the result of a declineto participate (proportion of individuals that declined ranged from 1–4%) or where contactcould not be made because the individual or household was away from the community. Threeindividual-level surveys captured Batwa of all ages and were conducted post-distribution: Janu-ary 2013 (n = 583), January 2014 (n = 563), and April 2014 (n = 541). Individual-level surveysconducted in July 2013 and November 2013 captured a survey of adults only (�18 yrs) andwere not used for the individual-level analyses presented here. An attempted census of house-holds was conducted in all six of the cross-sectional surveys: December 2011 (n = 129), January
Fig 1. Schematic timeline of long lasting insecticidal net (LLIN) distribution and cross-sectionalsurvey implementation from December 2011-April 2014 among Batwa in Kanungu District,southwestern Uganda.
doi:10.1371/journal.pone.0154808.g001
Mosquito Net Retention for Indigenous Batwa
PLOSONE | DOI:10.1371/journal.pone.0154808 May 4, 2016 4 / 20
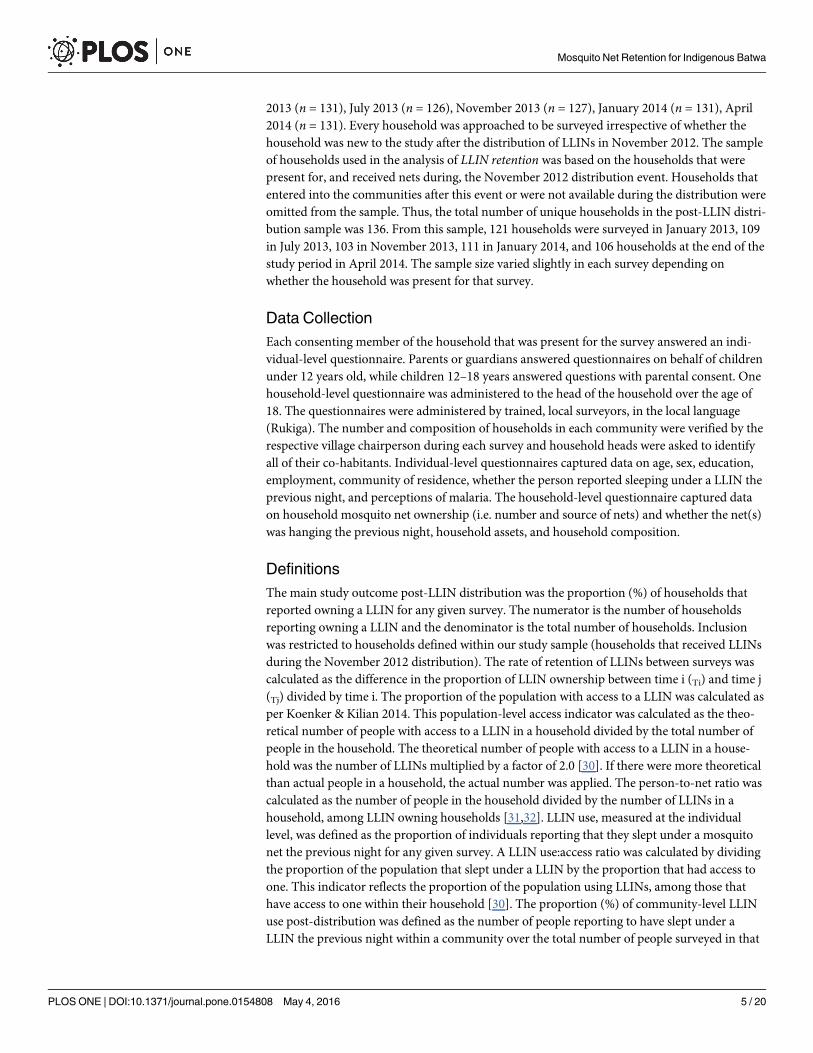
2013 (n = 131), July 2013 (n = 126), November 2013 (n = 127), January 2014 (n = 131), April2014 (n = 131). Every household was approached to be surveyed irrespective of whether thehousehold was new to the study after the distribution of LLINs in November 2012. The sampleof households used in the analysis of LLIN retention was based on the households that werepresent for, and received nets during, the November 2012 distribution event. Households thatentered into the communities after this event or were not available during the distribution wereomitted from the sample. Thus, the total number of unique households in the post-LLIN distri-bution sample was 136. From this sample, 121 households were surveyed in January 2013, 109in July 2013, 103 in November 2013, 111 in January 2014, and 106 households at the end of thestudy period in April 2014. The sample size varied slightly in each survey depending onwhether the household was present for that survey.
Data CollectionEach consenting member of the household that was present for the survey answered an indi-vidual-level questionnaire. Parents or guardians answered questionnaires on behalf of childrenunder 12 years old, while children 12–18 years answered questions with parental consent. Onehousehold-level questionnaire was administered to the head of the household over the age of18. The questionnaires were administered by trained, local surveyors, in the local language(Rukiga). The number and composition of households in each community were verified by therespective village chairperson during each survey and household heads were asked to identifyall of their co-habitants. Individual-level questionnaires captured data on age, sex, education,employment, community of residence, whether the person reported sleeping under a LLIN theprevious night, and perceptions of malaria. The household-level questionnaire captured dataon household mosquito net ownership (i.e. number and source of nets) and whether the net(s)was hanging the previous night, household assets, and household composition.
DefinitionsThe main study outcome post-LLIN distribution was the proportion (%) of households thatreported owning a LLIN for any given survey. The numerator is the number of householdsreporting owning a LLIN and the denominator is the total number of households. Inclusionwas restricted to households defined within our study sample (households that received LLINsduring the November 2012 distribution). The rate of retention of LLINs between surveys wascalculated as the difference in the proportion of LLIN ownership between time i (Ti) and time j(Tj) divided by time i. The proportion of the population with access to a LLIN was calculated asper Koenker & Kilian 2014. This population-level access indicator was calculated as the theo-retical number of people with access to a LLIN in a household divided by the total number ofpeople in the household. The theoretical number of people with access to a LLIN in a house-hold was the number of LLINs multiplied by a factor of 2.0 [30]. If there were more theoreticalthan actual people in a household, the actual number was applied. The person-to-net ratio wascalculated as the number of people in the household divided by the number of LLINs in ahousehold, among LLIN owning households [31,32]. LLIN use, measured at the individuallevel, was defined as the proportion of individuals reporting that they slept under a mosquitonet the previous night for any given survey. A LLIN use:access ratio was calculated by dividingthe proportion of the population that slept under a LLIN by the proportion that had access toone. This indicator reflects the proportion of the population using LLINs, among those thathave access to one within their household [30]. The proportion (%) of community-level LLINuse post-distribution was defined as the number of people reporting to have slept under aLLIN the previous night within a community over the total number of people surveyed in that
Mosquito Net Retention for Indigenous Batwa
PLOSONE | DOI:10.1371/journal.pone.0154808 May 4, 2016 5 / 20
community. The Batwa population is predominantly subsistence based; household wealth (pre-sumed to be time-variant) was thus generated from the correlations of household asset indica-tors (S1 File) using a polychoric Principle Component Analysis (PCA) for categorical data[33]. Using household assets as a proxy for wealth has been determined to be a good predictorof health in rural contexts [34], and has been used as a predictor in similar studies [5,8]. Wegenerated tertiles of the PCA wealth score using natural breaks. Amidst existing socioeconomicgradients within these communities, the population is relatively impoverished and householdswere thus classified as either least poor, poor, or poorest. We further calculated equity ratios,comparing the proportion of LLIN ownership between the lowest defined wealth tertile (poor-est) and highest defined wealth tertile (least poor) Batwa households for each survey post-dis-tribution to see if the gap in ownership increased, decreased, or remained stable over time [5].A decreasing equity ratio value represents an increase in inequities in LLIN ownership (pooresthouseholds [numerator]; least poor households [denominator]). From a ‘mid-point’ survey(January 2013; three months after distribution), we created a household female adult educationvariable and a household adult education variable consisting of the highest reported educationof any female/ adult over the age of 16. Given the low number of observations reporting educa-tion beyond primary school, the variables were binary: no formal education versus some pri-mary or higher education. Adult education and female adult education have sometimes beenshown to be good predictors of household health and uptake of prevention measures[12,35,36]. Time-variant discrete variables indicating household size are based on the numberof people in the household and the number of rooms in the home. Finally, a binary variablewas created to capture a household’s infrastructural capacity to hang a net, based on whether ithad ‘iron sheets’ or ‘grass thatched or banana fiber’ roofing.
Statistical AnalysisIndividual-level descriptive statistics on LLIN use and non-use were based on data collectedfrom the individual-level surveys, while household-level descriptive statistics and regressionmodeling of retention of LLINs were estimated from the household-level surveys. Statistics onthe existing household ownership of LLINs pre-distribution (December 2011) are presentedalongside post-distribution results (January 2013-April 2014) to facilitate a comparison of theBatwa’s retention of nets with prior baseline conditions.
Household LLIN ownership and access. The proportion (%) of households owning atleast one net from each household-level cross-sectional survey and the rate of retention of netsbetween surveys were calculated. Mosquito nets of any kind and nets treated with insecticidewere included in pre-distribution estimates; post-distribution estimates included LLINs only.The proportion of people with access to a LLIN within their household, the person-to-net ratio(among households owning a LLIN) and the median number of nets owned were calculated foreach household survey. Community-level coverage was calculated at the end of the studyperiod (April 2014) to examine variability between the 10 Batwa communities.
LLIN individual use and non-use. Batwa from the individual-level surveys three and18-months post-distribution were classified into one of four mutually exclusive categories ofLLIN use and non-use [20]: 1) living in a household with no LLIN present (non-use); 2) livingin a household that owns but is not hanging an LLIN (non-use); 3) living in household hangingan LLIN but not sleeping under it (non-use); and 4) sleeping under an LLIN (use) [20].
Determinants of household LLIN retention. Post-distribution household-level surveyswere analyzed as paneled data of repeated measures (January 2013-April 2014). The outcomewas households reporting ownership of an IHACC-distributed LLIN, noting that reportedacquisition of nets from other sources in post-distribution surveys was minimal (range: 8–13
Mosquito Net Retention for Indigenous Batwa
PLOSONE | DOI:10.1371/journal.pone.0154808 May 4, 2016 6 / 20
non-IHACC LLINs per survey). Predictor variables for consideration were determined a priorifrom the literature [7,12], and included household wealth, household adult female education orhousehold adult education, number of people in the household, number of rooms in the home,and the type of roofing material, while a factor variable representing the survey month/yearwas used to control for a time effect. First, a series of simple (i.e. one fixed effect) logistic regres-sion models controlling for a household effect with a random intercept were used to explorepotential unconditional associations between predictor variables and the outcome variable.Potential collinearity between predictor variables was assessed using a Spearman’s rank corre-lation coefficient with a cutoff of 70%. Given the likely violation of the assumption of modelindependence from repeated measures on the same households, as well as the possible commu-nity-level effects on the outcome [19], we used a random effects model with random interceptsto account for household and community effects, which assume exchangeable correlationstructures [37,38]. The model was built using a manual backwards elimination process, and thebest-fit model was determined by Bayesian Information Criterian (BIC) statistics of modelcomparison [39]. Models that (i) did not account for any community-level effect, and (ii) hadcommunity as a fixed effect variable, were run separately and assessed, but not found toimprove model fit. Furthermore, examination of the distribution of the model’s residualsagainst the time variable (season [month/year]), and between residuals at different time points,did not display evidence of an autoregressive (non-exchangeable) correlation structure to thedata. Two-way interactions among all predictors that were significant in the best-fit modelwere assessed by iteratively inserting interaction-terms into the model and looking for a changeof 25% or greater in the covariates or any significant p-values<0.05. Model diagnostics wereassessed graphically by visually examining the assumptions of normalcy for the residuals andassumptions of homogeneity of the Best-Linear Unbiased Predictors (BLUPs) of the randomeffects.
EthicsParticipants provided verbal informed consent for participation in each survey of the studyand parental/ guardian verbal informed consent was obtained for all individuals under the ageof 18. For each survey, the trained surveyor described the study aims and goals to the partici-pants, provided information on resources and contacts if participants had questions, reiteratedto the participants that they could leave the study at any time, and that non-participation in thestudy would not inhibit their inclusion in any further community or research activities. Verbalconsent was deemed the most appropriate given low levels of adult literacy in the communities.Data on consent was transferred to, and retained in, a secure database protecting the anonym-ity of participants with unique identifiers; the longitudinal nature of the study requires partici-pant tracking of participation in multiple surveys. This study, and the consent procedure, wasapproved by the McGill University Research Ethics Board and is consistent with the CanadianTri-Council’s Policies and requirements for the Ethical Conduct of Research Involving HumanSubjects. Given the nature of our data, data are available upon request from interestedresearchers; contact<[email protected]> with inquiries.
ResultsUsing the ‘mid-point’ January 2013 survey, and from available estimates [40], the Batwa in ourstudy generally reflect the total Batwa population in Kanungu District; the study had slightlymore males (48.5% compared to 47% in the total population) and is slightly younger (meanage 20 years compared to 23 years in total population) [40]. The majority (63%) of Batwa overthe age of 16 had no formal education, with only 33% obtaining some primary education.
Mosquito Net Retention for Indigenous Batwa
PLOSONE | DOI:10.1371/journal.pone.0154808 May 4, 2016 7 / 20
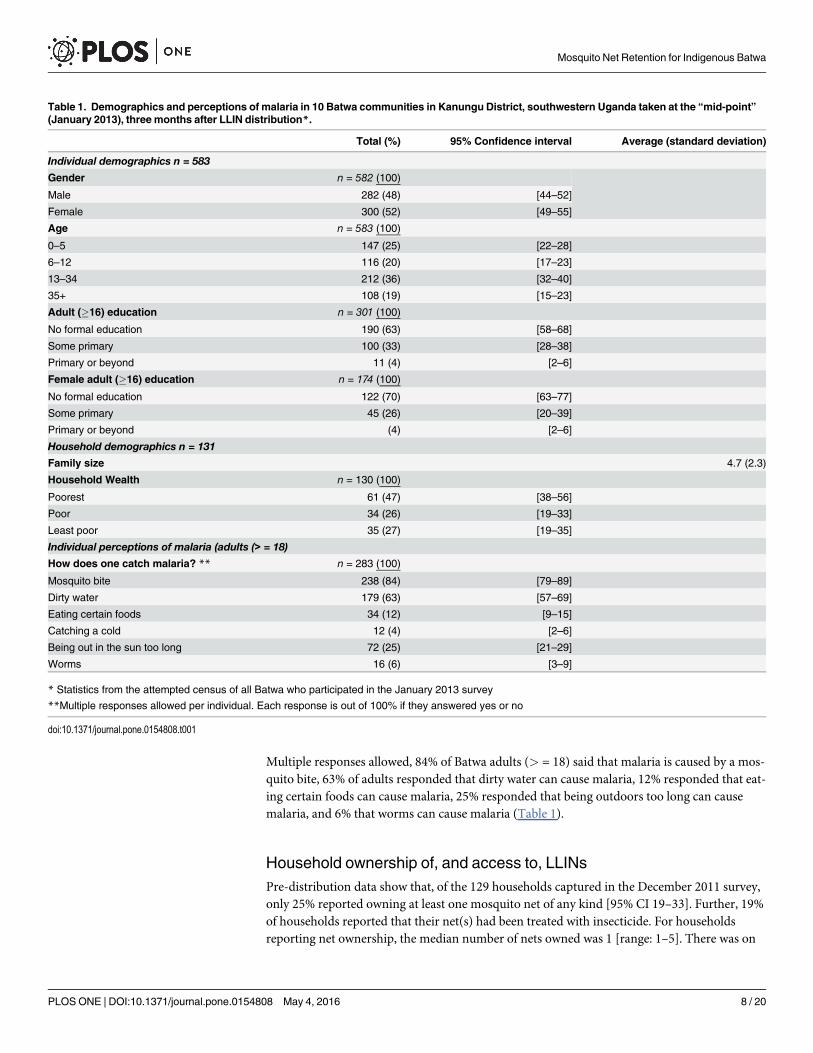
Multiple responses allowed, 84% of Batwa adults (> = 18) said that malaria is caused by a mos-quito bite, 63% of adults responded that dirty water can cause malaria, 12% responded that eat-ing certain foods can cause malaria, 25% responded that being outdoors too long can causemalaria, and 6% that worms can cause malaria (Table 1).
Household ownership of, and access to, LLINsPre-distribution data show that, of the 129 households captured in the December 2011 survey,only 25% reported owning at least one mosquito net of any kind [95% CI 19–33]. Further, 19%of households reported that their net(s) had been treated with insecticide. For householdsreporting net ownership, the median number of nets owned was 1 [range: 1–5]. There was on
Table 1. Demographics and perceptions of malaria in 10 Batwa communities in Kanungu District, southwestern Uganda taken at the “mid-point”(January 2013), three months after LLIN distribution*.
Total (%) 95% Confidence interval Average (standard deviation)
Individual demographics n = 583
Gender n = 582 (100)
Male 282 (48) [44–52]
Female 300 (52) [49–55]
Age n = 583 (100)
0–5 147 (25) [22–28]
6–12 116 (20) [17–23]
13–34 212 (36) [32–40]
35+ 108 (19) [15–23]
Adult (�16) education n = 301 (100)
No formal education 190 (63) [58–68]
Some primary 100 (33) [28–38]
Primary or beyond 11 (4) [2–6]
Female adult (�16) education n = 174 (100)
No formal education 122 (70) [63–77]
Some primary 45 (26) [20–39]
Primary or beyond (4) [2–6]
Household demographics n = 131Family size 4.7 (2.3)
Household Wealth n = 130 (100)
Poorest 61 (47) [38–56]
Poor 34 (26) [19–33]
Least poor 35 (27) [19–35]
Individual perceptions of malaria (adults (> = 18)How does one catch malaria? ** n = 283 (100)
Mosquito bite 238 (84) [79–89]
Dirty water 179 (63) [57–69]
Eating certain foods 34 (12) [9–15]
Catching a cold 12 (4) [2–6]
Being out in the sun too long 72 (25) [21–29]
Worms 16 (6) [3–9]
* Statistics from the attempted census of all Batwa who participated in the January 2013 survey
**Multiple responses allowed per individual. Each response is out of 100% if they answered yes or no
doi:10.1371/journal.pone.0154808.t001
Mosquito Net Retention for Indigenous Batwa
PLOSONE | DOI:10.1371/journal.pone.0154808 May 4, 2016 8 / 20
average 5 people per net [CI 4.0–5.8] in Batwa households approximately a year before LLINdistribution.
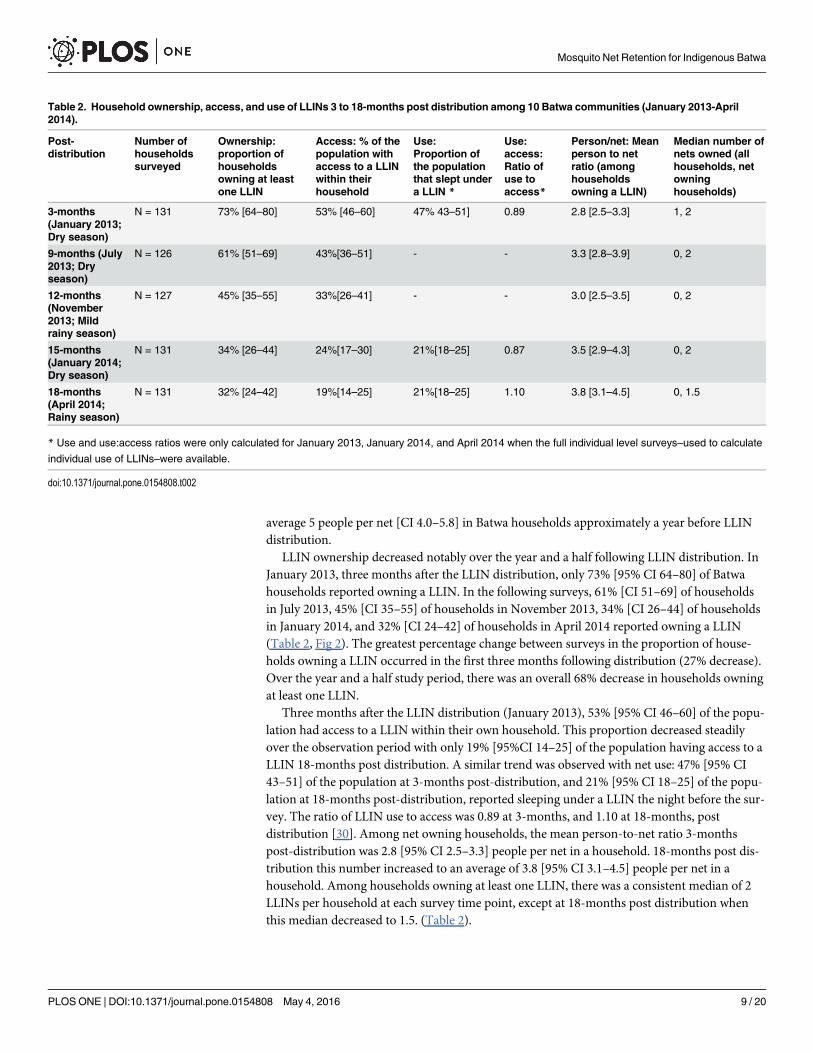
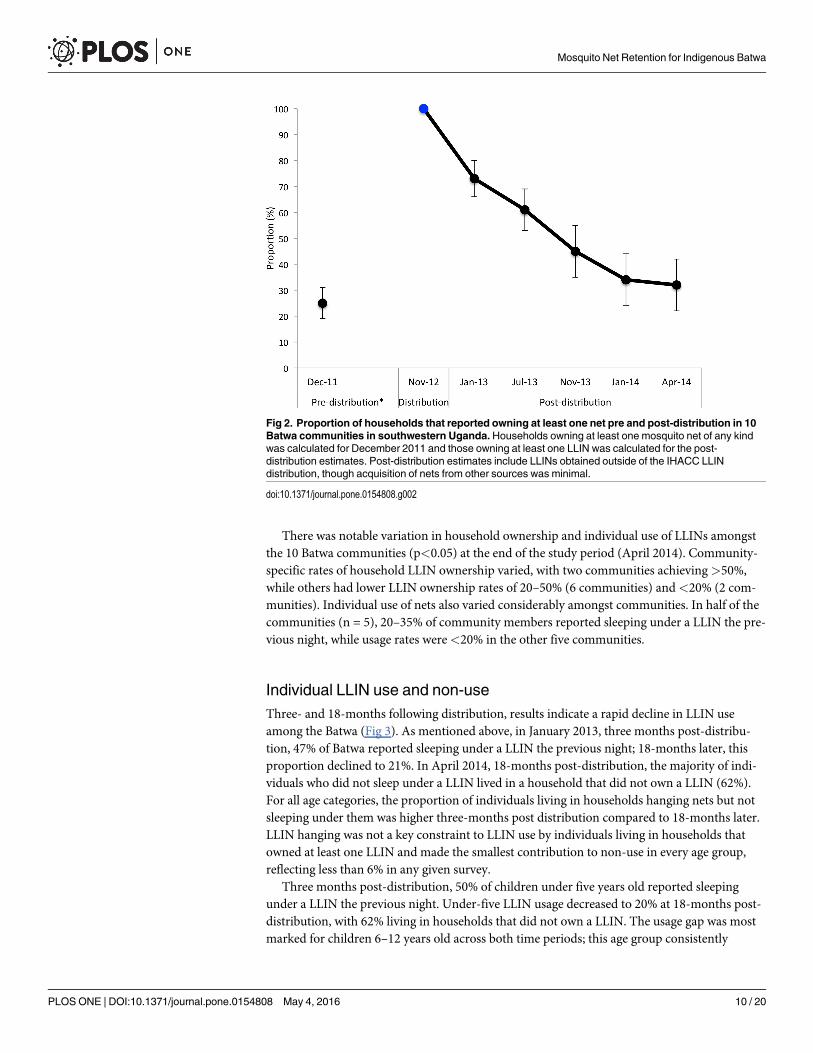
LLIN ownership decreased notably over the year and a half following LLIN distribution. InJanuary 2013, three months after the LLIN distribution, only 73% [95% CI 64–80] of Batwahouseholds reported owning a LLIN. In the following surveys, 61% [CI 51–69] of householdsin July 2013, 45% [CI 35–55] of households in November 2013, 34% [CI 26–44] of householdsin January 2014, and 32% [CI 24–42] of households in April 2014 reported owning a LLIN(Table 2, Fig 2). The greatest percentage change between surveys in the proportion of house-holds owning a LLIN occurred in the first three months following distribution (27% decrease).Over the year and a half study period, there was an overall 68% decrease in households owningat least one LLIN.
Three months after the LLIN distribution (January 2013), 53% [95% CI 46–60] of the popu-lation had access to a LLIN within their own household. This proportion decreased steadilyover the observation period with only 19% [95%CI 14–25] of the population having access to aLLIN 18-months post distribution. A similar trend was observed with net use: 47% [95% CI43–51] of the population at 3-months post-distribution, and 21% [95% CI 18–25] of the popu-lation at 18-months post-distribution, reported sleeping under a LLIN the night before the sur-vey. The ratio of LLIN use to access was 0.89 at 3-months, and 1.10 at 18-months, postdistribution [30]. Among net owning households, the mean person-to-net ratio 3-monthspost-distribution was 2.8 [95% CI 2.5–3.3] people per net in a household. 18-months post dis-tribution this number increased to an average of 3.8 [95% CI 3.1–4.5] people per net in ahousehold. Among households owning at least one LLIN, there was a consistent median of 2LLINs per household at each survey time point, except at 18-months post distribution whenthis median decreased to 1.5. (Table 2).
Table 2. Household ownership, access, and use of LLINs 3 to 18-months post distribution among 10 Batwa communities (January 2013-April2014).
Post-distribution
Number ofhouseholdssurveyed
Ownership:proportion ofhouseholdsowning at leastone LLIN
Access: % of thepopulation withaccess to a LLINwithin theirhousehold
Use:Proportion ofthe populationthat slept undera LLIN *
Use:access:Ratio ofuse toaccess*
Person/net: Meanperson to netratio (amonghouseholdsowning a LLIN)
Median number ofnets owned (allhouseholds, netowninghouseholds)
3-months(January 2013;Dry season)
N = 131 73% [64–80] 53% [46–60] 47% 43–51] 0.89 2.8 [2.5–3.3] 1, 2
9-months (July2013; Dryseason)
N = 126 61% [51–69] 43%[36–51] - - 3.3 [2.8–3.9] 0, 2
12-months(November2013; Mildrainy season)
N = 127 45% [35–55] 33%[26–41] - - 3.0 [2.5–3.5] 0, 2
15-months(January 2014;Dry season)
N = 131 34% [26–44] 24%[17–30] 21%[18–25] 0.87 3.5 [2.9–4.3] 0, 2
18-months(April 2014;Rainy season)
N = 131 32% [24–42] 19%[14–25] 21%[18–25] 1.10 3.8 [3.1–4.5] 0, 1.5
* Use and use:access ratios were only calculated for January 2013, January 2014, and April 2014 when the full individual level surveys–used to calculate
individual use of LLINs–were available.
doi:10.1371/journal.pone.0154808.t002
Mosquito Net Retention for Indigenous Batwa
PLOSONE | DOI:10.1371/journal.pone.0154808 May 4, 2016 9 / 20
There was notable variation in household ownership and individual use of LLINs amongstthe 10 Batwa communities (p<0.05) at the end of the study period (April 2014). Community-specific rates of household LLIN ownership varied, with two communities achieving>50%,while others had lower LLIN ownership rates of 20–50% (6 communities) and<20% (2 com-munities). Individual use of nets also varied considerably amongst communities. In half of thecommunities (n = 5), 20–35% of community members reported sleeping under a LLIN the pre-vious night, while usage rates were<20% in the other five communities.
Individual LLIN use and non-useThree- and 18-months following distribution, results indicate a rapid decline in LLIN useamong the Batwa (Fig 3). As mentioned above, in January 2013, three months post-distribu-tion, 47% of Batwa reported sleeping under a LLIN the previous night; 18-months later, thisproportion declined to 21%. In April 2014, 18-months post-distribution, the majority of indi-viduals who did not sleep under a LLIN lived in a household that did not own a LLIN (62%).For all age categories, the proportion of individuals living in households hanging nets but notsleeping under them was higher three-months post distribution compared to 18-months later.LLIN hanging was not a key constraint to LLIN use by individuals living in households thatowned at least one LLIN and made the smallest contribution to non-use in every age group,reflecting less than 6% in any given survey.
Three months post-distribution, 50% of children under five years old reported sleepingunder a LLIN the previous night. Under-five LLIN usage decreased to 20% at 18-months post-distribution, with 62% living in households that did not own a LLIN. The usage gap was mostmarked for children 6–12 years old across both time periods; this age group consistently
Fig 2. Proportion of households that reported owning at least one net pre and post-distribution in 10Batwa communities in southwestern Uganda.Households owning at least one mosquito net of any kindwas calculated for December 2011 and those owning at least one LLIN was calculated for the post-distribution estimates. Post-distribution estimates include LLINs obtained outside of the IHACC LLINdistribution, though acquisition of nets from other sources was minimal.
doi:10.1371/journal.pone.0154808.g002
Mosquito Net Retention for Indigenous Batwa
PLOSONE | DOI:10.1371/journal.pone.0154808 May 4, 2016 10 / 20
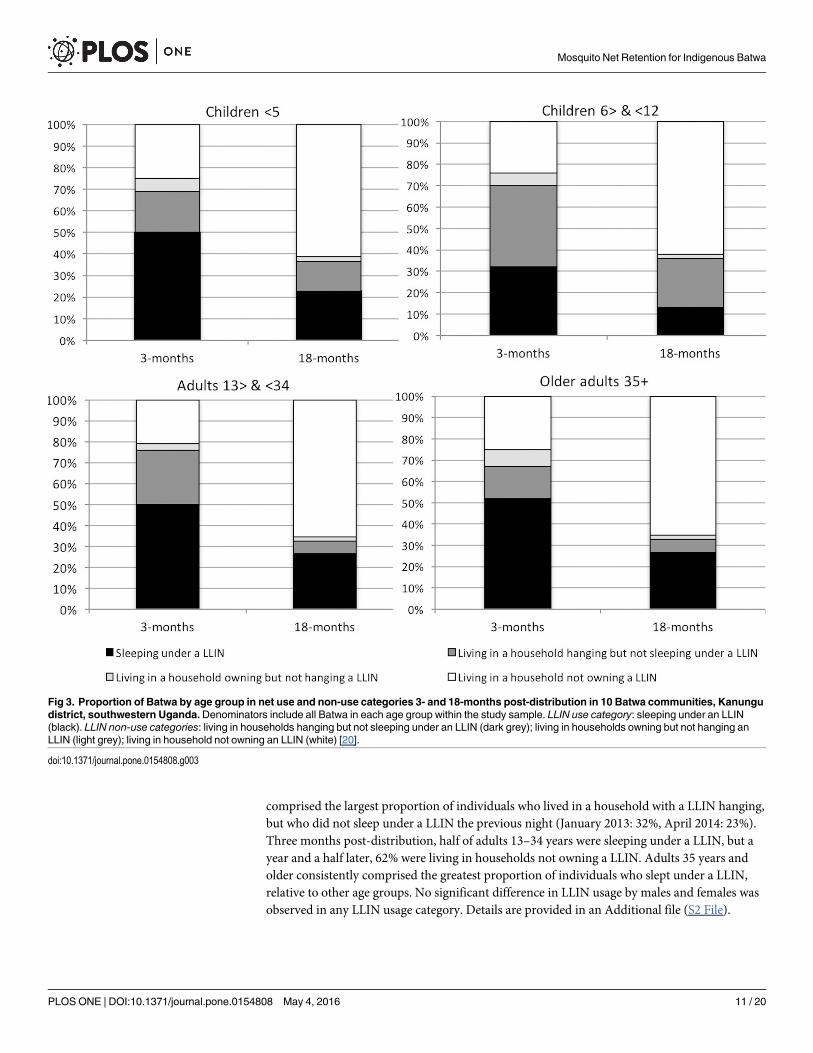
comprised the largest proportion of individuals who lived in a household with a LLIN hanging,but who did not sleep under a LLIN the previous night (January 2013: 32%, April 2014: 23%).Three months post-distribution, half of adults 13–34 years were sleeping under a LLIN, but ayear and a half later, 62% were living in households not owning a LLIN. Adults 35 years andolder consistently comprised the greatest proportion of individuals who slept under a LLIN,relative to other age groups. No significant difference in LLIN usage by males and females wasobserved in any LLIN usage category. Details are provided in an Additional file (S2 File).
Fig 3. Proportion of Batwa by age group in net use and non-use categories 3- and 18-months post-distribution in 10 Batwa communities, Kanungudistrict, southwestern Uganda.Denominators include all Batwa in each age group within the study sample. LLIN use category: sleeping under an LLIN(black). LLIN non-use categories: living in households hanging but not sleeping under an LLIN (dark grey); living in households owning but not hanging anLLIN (light grey); living in household not owning an LLIN (white) [20].
doi:10.1371/journal.pone.0154808.g003
Mosquito Net Retention for Indigenous Batwa
PLOSONE | DOI:10.1371/journal.pone.0154808 May 4, 2016 11 / 20
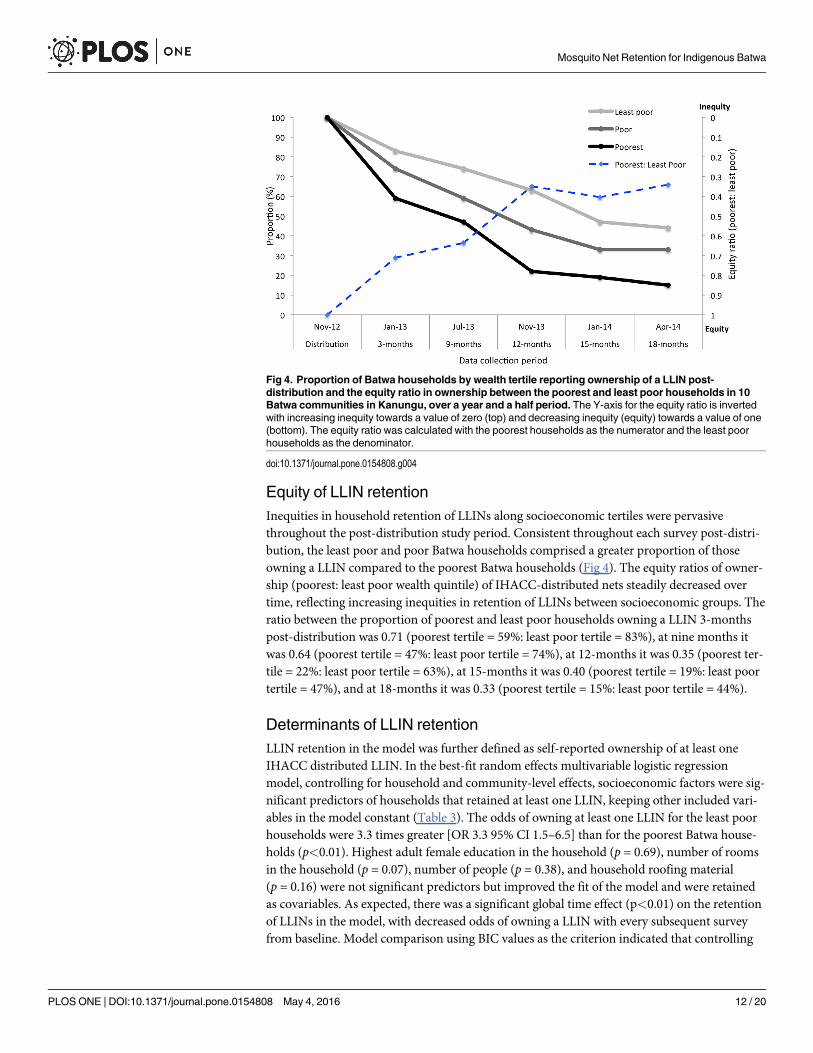
Equity of LLIN retentionInequities in household retention of LLINs along socioeconomic tertiles were pervasivethroughout the post-distribution study period. Consistent throughout each survey post-distri-bution, the least poor and poor Batwa households comprised a greater proportion of thoseowning a LLIN compared to the poorest Batwa households (Fig 4). The equity ratios of owner-ship (poorest: least poor wealth quintile) of IHACC-distributed nets steadily decreased overtime, reflecting increasing inequities in retention of LLINs between socioeconomic groups. Theratio between the proportion of poorest and least poor households owning a LLIN 3-monthspost-distribution was 0.71 (poorest tertile = 59%: least poor tertile = 83%), at nine months itwas 0.64 (poorest tertile = 47%: least poor tertile = 74%), at 12-months it was 0.35 (poorest ter-tile = 22%: least poor tertile = 63%), at 15-months it was 0.40 (poorest tertile = 19%: least poortertile = 47%), and at 18-months it was 0.33 (poorest tertile = 15%: least poor tertile = 44%).
Determinants of LLIN retentionLLIN retention in the model was further defined as self-reported ownership of at least oneIHACC distributed LLIN. In the best-fit random effects multivariable logistic regressionmodel, controlling for household and community-level effects, socioeconomic factors were sig-nificant predictors of households that retained at least one LLIN, keeping other included vari-ables in the model constant (Table 3). The odds of owning at least one LLIN for the least poorhouseholds were 3.3 times greater [OR 3.3 95% CI 1.5–6.5] than for the poorest Batwa house-holds (p<0.01). Highest adult female education in the household (p = 0.69), number of roomsin the household (p = 0.07), number of people (p = 0.38), and household roofing material(p = 0.16) were not significant predictors but improved the fit of the model and were retainedas covariables. As expected, there was a significant global time effect (p<0.01) on the retentionof LLINs in the model, with decreased odds of owning a LLIN with every subsequent surveyfrom baseline. Model comparison using BIC values as the criterion indicated that controlling
Fig 4. Proportion of Batwa households by wealth tertile reporting ownership of a LLIN post-distribution and the equity ratio in ownership between the poorest and least poor households in 10Batwa communities in Kanungu, over a year and a half period. The Y-axis for the equity ratio is invertedwith increasing inequity towards a value of zero (top) and decreasing inequity (equity) towards a value of one(bottom). The equity ratio was calculated with the poorest households as the numerator and the least poorhouseholds as the denominator.
doi:10.1371/journal.pone.0154808.g004
Mosquito Net Retention for Indigenous Batwa
PLOSONE | DOI:10.1371/journal.pone.0154808 May 4, 2016 12 / 20
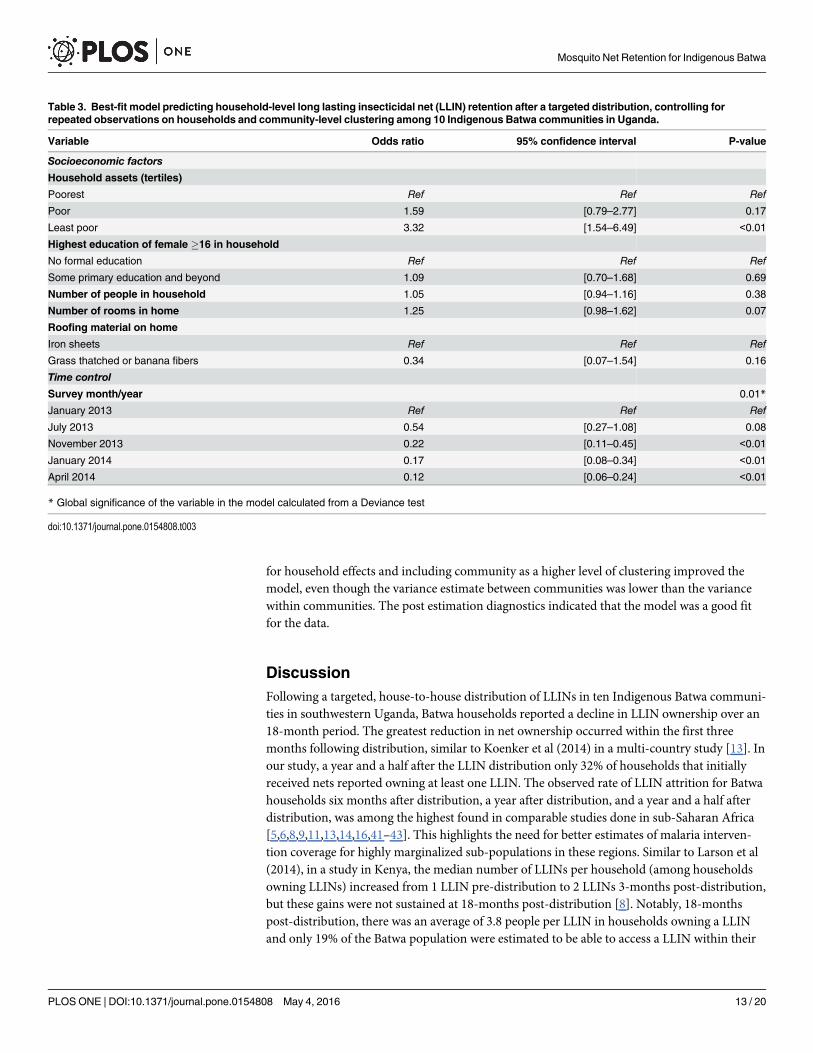
for household effects and including community as a higher level of clustering improved themodel, even though the variance estimate between communities was lower than the variancewithin communities. The post estimation diagnostics indicated that the model was a good fitfor the data.
DiscussionFollowing a targeted, house-to-house distribution of LLINs in ten Indigenous Batwa communi-ties in southwestern Uganda, Batwa households reported a decline in LLIN ownership over an18-month period. The greatest reduction in net ownership occurred within the first threemonths following distribution, similar to Koenker et al (2014) in a multi-country study [13]. Inour study, a year and a half after the LLIN distribution only 32% of households that initiallyreceived nets reported owning at least one LLIN. The observed rate of LLIN attrition for Batwahouseholds six months after distribution, a year after distribution, and a year and a half afterdistribution, was among the highest found in comparable studies done in sub-Saharan Africa[5,6,8,9,11,13,14,16,41–43]. This highlights the need for better estimates of malaria interven-tion coverage for highly marginalized sub-populations in these regions. Similar to Larson et al(2014), in a study in Kenya, the median number of LLINs per household (among householdsowning LLINs) increased from 1 LLIN pre-distribution to 2 LLINs 3-months post-distribution,but these gains were not sustained at 18-months post-distribution [8]. Notably, 18-monthspost-distribution, there was an average of 3.8 people per LLIN in households owning a LLINand only 19% of the Batwa population were estimated to be able to access a LLIN within their
Table 3. Best-fit model predicting household-level long lasting insecticidal net (LLIN) retention after a targeted distribution, controlling forrepeated observations on households and community-level clustering among 10 Indigenous Batwa communities in Uganda.
Variable Odds ratio 95% confidence interval P-value
Socioeconomic factors
Household assets (tertiles)
Poorest Ref Ref Ref
Poor 1.59 [0.79–2.77] 0.17
Least poor 3.32 [1.54–6.49] <0.01
Highest education of female �16 in household
No formal education Ref Ref Ref
Some primary education and beyond 1.09 [0.70–1.68] 0.69
Number of people in household 1.05 [0.94–1.16] 0.38
Number of rooms in home 1.25 [0.98–1.62] 0.07
Roofing material on home
Iron sheets Ref Ref Ref
Grass thatched or banana fibers 0.34 [0.07–1.54] 0.16
Time control
Survey month/year 0.01*
January 2013 Ref Ref Ref
July 2013 0.54 [0.27–1.08] 0.08
November 2013 0.22 [0.11–0.45] <0.01
January 2014 0.17 [0.08–0.34] <0.01
April 2014 0.12 [0.06–0.24] <0.01
* Global significance of the variable in the model calculated from a Deviance test
doi:10.1371/journal.pone.0154808.t003
Mosquito Net Retention for Indigenous Batwa
PLOSONE | DOI:10.1371/journal.pone.0154808 May 4, 2016 13 / 20
own household, which is far below the WHO’s global 80% target for universal coverage[30,32,43].
While Uganda has made notable gains in increasing overall ownership, access, and use ofITNs and LLINs over the past decade, our data suggest that the poorest and most marginalizedpopulations, notably Indigenous populations, may still be disadvantaged from ownership anduse of LLINs compared to the general Ugandan population [22]. An accurate assessment ofsub-national disparities in ITN/LLIN ownership and population non-use is critical to informmalaria prevention programming and identify locally targeted entry points [20]. A year and ahalf after LLIN distribution in April 2014, the proportion of Batwa households that owned atleast one LLIN was substantially lower than the estimated proportion of the Ugandan popula-tion that reported owning LLINs in the 2014 Uganda Malaria Indicator Survey (90% Ugandavs 32% Batwa) [22]. Furthermore, available estimates from 2013 among a small sample ofneighboring non-Indigenous Bakiga in Kanungu District reported that 66% of Bakiga house-holds reported owning at least one LLIN [21], almost double the Batwa’s household ownershipat the end of our study period. Additional studies conducted in April 2014 among non-Indige-nous Bakiga communities in Kanungu District found that 40% of all Bakiga study participantsreported sleeping under a net the previous night [44], again almost twice the rate of LLINusage by the Batwa at that time. These rates highlight the substantial disparity (and associatedsocial gradients) in LLIN use and ownership between the Indigenous Batwa and their non-Indigenous neighbors, even following LLIN free-distribution efforts.
Just three months after the targeted Batwa LLIN distribution, which provided two LLINs toevery household, less than half of the population reported sleeping under a LLIN the previousnight; 18-months post LLIN distribution this proportion dropped as low as 21%. While overalluse of LLINs decreased over the study period due to non-ownership, it is possible that theremaining nets were better used over time, consistent with our observation that the proportionof people living in a household hanging a net but themselves not sleeping under one decreased.However, this observed usage trend could also be explained by the seasonality of malaria trans-mission in the area, as the 3 and 18-months post distribution surveys were conducted duringthe dry and rainy seasons, respectively. For example, the 18-months post-distribution seasonwas conducted in a period of heavy rains, likely resulting in higher mosquito densities, whichhas been shown to coincide with higher net hanging and usage rates [45]. Consistent over thestudy period, and with previous other studies, the highest proportion of LLIN use was amongchildren under five and adults 35 years and older [8,46]. This may reflect the fact that, givenbiological vulnerability to malaria infection, children under 5 years and pregnant women aretargeted globally for increased coverage and use of LLINs; consequently, information, educa-tion and behavior change messages are often tailored to promote net use for these groups [20].In addition, parental-child sleeping arrangements have been found to reflect mosquito net useand may help to explain the observed trends. Studies in sub-Saharan Africa found that childrenwho slept with their mothers were more likely to sleep under a net [47,48]. LLIN usage was dis-proportionately low for children 6–12 years old despite living in households that reportedhanging a LLIN the previous night. Consistent with other studies in sub-Saharan Africa, thisparticular age group may be less prioritized for net usage, particularly when there are notenough nets to cover all members of the household [20,48–50]. Though in such cases, childrenmay still receive some residual benefit from reduced vector abundance in households withLLINs hanging [2,51,52].
It is now well established that both global disease burden and access to preventive measuresare patterned by socioeconomic gradients [53,54]. The association between wealth and willing-ness to pay for insecticidal nets is well recognized, with wealthier households more oftenacquiring nets in areas with market or subsidized access [7,55,56]. However, the relationship
Mosquito Net Retention for Indigenous Batwa
PLOSONE | DOI:10.1371/journal.pone.0154808 May 4, 2016 14 / 20
between wealth and retention of nets after a free LLIN distribution has been less studied, partic-ularly using a longitudinal approach with paneled data [5,8,10,11]. Even though the Batwa inKanungu appear to be a homogeneously poor population [57], within-population socioeco-nomic gradients do exist to pattern the retention of mosquito nets after a targeted distribution,similar to the findings of Hassan et al (2008) in Sudan [11]. Over time, the poorest Batwahouseholds were less likely to retain a LLIN that was given out during the free distribution. Fur-thermore, the equity ratios of household LLIN ownership tended towards increasing inequity(ratio’s decreased) over the course of the study period, reflecting a widening of the gap in LLINretention between the least poor and the poorest Batwa households. However, our findings areinconsistent with those of Larson et al (2014) that found, after a targeted LLIN distribution,social factors (i.e., maternal education and household wealth) no longer predicted the use ofnets [8] and that inequities between social groups in net ownership and use were reduced [5–7,9]. The scale at which our study was conducted only allowed us to make statistical inferencesabout the impact of socioeconomic factors on retention of LLINs between Batwa households.However, given the relatively small socioeconomic gradients within the Batwa population [57]and the significant effect of household wealth on retention, we might expect to see an evengreater relationship between social factors and retention of nets at the population-level, wheresocial gradients between the Batwa and other non-Indigenous African populations are morepronounced [26,54,58].
While this study did not explore the reasons why nets were not kept, local informants work-ing closely with the Batwa and past researchers in the field indicated that nets were often eithersold/given away, used for other purposes, or discarded due to infrastructural limitations ofthatched, semi-permanent housing [13,17,18]. Even though the LLINs were distributed with aclear message and demonstration of their purpose, and follow-up malaria prevention educationoccurred several times throughout the year post-distribution, household economic needs (i.e.,selling nets or using for other purposes) may strongly influence LLIN retention for this margin-alized population [8,17–19]. This presumption is further buttressed by our finding that theperiod with the greatest change in net ownership occurred within the first three months of thedistribution–during a period of low malaria transmission (dry season)–suggesting sale or a lossor repurposing of nets before wear and tear from continual long-term use would likely occur[13,14]. A previous multi-country analysis found that nets obtained from a campaign weremore likely to be given away—to family members, relatives, or others—compared to non-cam-paign nets [13]. For example, Koenker et al 2014 found that a large proportion (34%) of netsthat were lost from households were given away and 63% of these were to relatives, particularlyfamily members who reside elsewhere (i.e., students away at school) [13,59]. This study alsofound however that redistribution of nets was more likely to occur in net-rich environmentswhere access to LLINs was high. Prior to the IHACC LLIN distribution, ownership and accessto LLINs for Batwa was relatively low (<19% of households owned an insecticide treated net)suggesting it might be less likely that redistribution of nets between households would occur ata large scale within this population. However, redistribution to children at school is a possiblemechanism of loss and warrants further investigation to optimize net retention among theBatwa. Past research from Nigeria found that net durability was associated with householdsocioeconomic status, with poorer households more likely to own nets in worse physical condi-tion than less poor households. It is possible that this unmeasured variable (net durability)might have been a mediator on the pathway between household wealth and non-ownership ofnets within our study [60]. In many East African Batwa communities, Batwa live in traditionalgrass thatched huts that may have inadequate infrastructure to properly hang LLINs [23,28].However, within the context of our study, the majority of Batwa households were made ofdried mud or brick and roofs were made of tin. From our analysis, only a small proportion of
Mosquito Net Retention for Indigenous Batwa
PLOSONE | DOI:10.1371/journal.pone.0154808 May 4, 2016 15 / 20
Batwa (<6%) reported living in a household that owned but did not hang a LLIN, and the lackof a statistically significant explanatory effect of roofing type and number of rooms on LLINretention in the model further indicated that housing type was not a substantial driver of thesharp decline in LLIN ownership within this context.
This study has several limitations: first, our low sample size limited the power for statisticalinference, even though our attempted-census surveys of the Batwa in Kanungu successfullycovered a significant proportion of the total population. Conducting this research among aunique Indigenous population is both a strength and weakness of our study: it limits the gener-alizability of our results but offers critical insights into the situation of malaria prevention for ahighly vulnerable population. Our study relies on self-reported measures, which could sufferfrom recall bias or be influenced by participant’s specific motivations or interpretation andunderstanding of a question [61]. It is possible that the Batwa under-reported LLIN ownershipin the hope of receiving more nets, or that they over-reported LLIN ownership so as not toadmit to their loss. However, it is likely that any reporting biases were consistent at each surveyperiod and therefore the observed trends in LLIN retention and use over time are real. Preg-nant women are defined as a biologically vulnerable group to malaria infection from reducedimmunological protection and this study did not capture reliable data on pregnant Batwawomen’s access to and use of LLINs. Given our findings, an in-depth qualitative inquiry intoreasons for non-net ownership, perceptions of protective benefits, and seasonal adherencewould be of value to provide an understanding of the effectiveness of targeted free LLIN distri-butions among marginalized populations.
ConclusionDirect house-to-house distribution of free LLINs did not result in sustainable increases in theownership and use of LLINs among a population of Indigenous Batwa in Kanungu, Uganda. Ayear and a half after LLIN distribution, only one-third of Batwa households in Kanungureported owning at least one LLIN, with levels of ownership reverting to pre-distribution esti-mates. Even after a targeted distribution, which aimed to reduce social, monetary and distancebarriers in access to LLINs for these marginalized Indigenous communities, the use and owner-ship of LLINs among the Batwa remained below national and sub-national estimates, largely asa result of low LLIN retention. Within the Batwa communities, socioeconomic gradients werereinforced: the least poor Batwa households were significantly more likely to retain a LLINcompared to the poorest Batwa households. This research indicates that retention of freely dis-tributed LLINs, particularly for impoverished populations, may remain subject to patterningby socioeconomic gradients over time. More effective longitudinal monitoring and evaluationprograms are needed to assess the long-term impact of free LLIN distributions, and to identifycontextually appropriate interventions to maximize the retention of nets, particularly for mar-ginalized and vulnerable populations.
Supporting InformationS1 File. Relative wealth index: variable description and justification.(DOCX)
S2 File. Classification of individual long lasting insecticidal net (LLIN) use and non-use for10 Batwa communities in Kanungu District, Jan 2013 and April 2014, after a targeted free-distribution in November 2012 (% are calculated across rows within population sub-groups).(DOCX)
Mosquito Net Retention for Indigenous Batwa
PLOSONE | DOI:10.1371/journal.pone.0154808 May 4, 2016 16 / 20
AcknowledgmentsForemost, we thank the 10 Batwa communities in Kanungu District that participated and col-laborated in this study. We also thank key local organizations, including the Batwa Develop-ment Programme (BDP) and the Bwindi Community Hospital (BCH), who facilitated theLLIN distribution and contributed to IHACC surveys. Thanks to the surveyors from KanunguDistrict, and other IHACC members (Mr. Jamen Kasumba, Mr. Martin Kigozi, Ms. ChristineNantongo and Ms. Fortunate Twebaze, Mr. Emmanuel Eloku from the Kanungu DistrictAdministration, and Mr. Hubert Nkabura from the Bwindi Community Hospital). We thankKaitlin Patterson for organization and preparation of datasets. Thank you to Jamen Kasumbafor providing valuable information and insight on the IHACC led LLIN distribution in Novem-ber 2012. Finally, thanks to Blanaid Donnelly for her contributions in bringing qualitative con-textual insight to the interpretation of the data. This research is part of an international projectentitled the ‘Indigenous Health Adaptation to Climate Change’ (IHACC) project (www.ihacc.ca), with parallel field study sites in the Canadian Arctic and Peru. The Indigenous HealthAdaptation to Climate Change (IHACC) author group consists of Alejandro Llanos, CesarCarcamo, Didacus Namanya, James Ford, Lea Berrang-Ford, Sherilee Harper, Shuaib Lwasa,and Victoria Edge.
Author ContributionsConceived and designed the experiments: SC LBF MK. Performed the experiments: SC LBF SLDN ST IHACCMK. Analyzed the data: SC. Contributed reagents/materials/analysis tools: LBFMK. Wrote the paper: SC LBF MK. Review and revisions of the manuscript: SC LBF SL DN STIHACCMK. Community engagement and follow-up activities: ST.
References1. Lengeler C. Insecticide-treated bed nets and curtains for preventing malaria (Review). Cochrane Data-
base Syst Rev. 2004; 2(2).
2. Killeen GF, Smith T, Ferguson HM, Mshinda H, Abdulla S, Lengeler C, et al. Preventing childhoodmalaria in Africa by protecting adults frommosquitoes with insecticide-treated nets. PLoS Med. 2007; 4(7):e229. PMID: 17608562
3. RBM: The global strategic plan roll back malaria 2005–2015. Geneva, Switzerland; 2005.
4. Uganda Bureau of Statistics. Malaria: draft global technical strategy: post 2015, Report by the Secretar-iat. Geneva; 2015.
5. Kulkarni MA, Vanden Eng J, Desrochers RE, Cotte AH, Goodson JL, Johnston A, et al. Contribution ofintegrated campaign distribution of long-lasting insecticidal nets to coverage of target groups and totalpopulations in malaria-endemic areas in Madagascar. Am J Trop Med Hyg. 2010; 82(3):420–5. doi: 10.4269/ajtmh.2010.09-0597 PMID: 20207867
6. Thwing J, Hochberg N, Vanden Eng J, Issifi S, Eliades MJ, Minkoulou E, et al. Insecticide-treated netownership and usage in Niger after a nationwide integrated campaign. Trop Med Int Health. 2008; 13(6):827–34. doi: 10.1111/j.1365-3156.2008.02070.x PMID: 18384476
7. Thawani N, Kulkarni MA, Sohani S. Factors associated with coverage and usage of long-lasting insecti-cidal nets in madagascar. J Trop Med. 2010; 2009:6.
8. Larson PS, Minakawa N, Dida GO, Njenga SM, Ionides EL, Wilson ML. Insecticide-treated net usebefore and after mass distribution in a fishing community along Lake Victoria, Kenya: successes andunavoidable pitfalls. Malar J. 2014; 13(1):466.
9. Noor AM, Amin AA, AkhwaleWS, Snow RW. Increasing coverage and decreasing inequity in insecti-cide-treated bed net use among rural Kenyan children. PLoS Med. 2007; 4(8):e255. PMID: 17713981
10. Bernard J, Mtove G, Mandike R, Mtei F, Maxwell C, Reyburn H. Equity and coverage of insecticide-treated bed nets in an area of intense transmission of Plasmodium falciparum in Tanzania. Malar J.2009; 8:65. doi: 10.1186/1475-2875-8-65 PMID: 19371415
11. Hassan SE-DH, Malik EM, Okoued SI, Eltayeb EM. Retention and efficacy of long-lasting insecticide-treated nets distributed in eastern Sudan: a two-step community-based study. Malar J. 2008; 7(1):85.
Mosquito Net Retention for Indigenous Batwa
PLOSONE | DOI:10.1371/journal.pone.0154808 May 4, 2016 17 / 20
12. Noor AM, Omumbo JA, Amin AA, Zurovac D, Snow RW.Wealth, mother’s education and physicalaccess as determinants of retail sector net use in rural Kenya. Malar J. 2006; 5(1):5.
13. Koenker H, Kilian A, Zegers de Beyl C, Onyefunafoa EO, Selby RA, Abeku T, et al. What happens tolost nets: a multi-country analysis of reasons for LLIN attrition using 14 household surveys in four coun-tries. Malar J. 2014; 13(1):464.
14. Batisso E, Habte T, Tesfaye G, Getachew D, Tekalegne A, Kilian A, et al. A stitch in time: a cross-sec-tional survey looking at long lasting insecticide-treated bed net ownership, utilization and attrition inSNNPR, Ethiopia. Malar J. 2012; 11(183):1–7.
15. Kweka EJ, Himeidan YE, Mahande AM, Mwang’onde BJ, Msangi S, MahandeMJ, et al. Durabilityassociated efficacy of long-lasting insecticidal nets after five years of household use. Parasit Vectors.2011; 4(1):156.
16. Fettene M, BalkewM, Gimblet C. Utilization, retention and bio-efficacy studies of PermaNet in selectedvillages in Buie and Fentalie districts of Ethiopia. Malar J. 2009; 8(1):114.
17. Lover A, Sutton B, Asy AJ, Wilder-Smith A. An exploratory study of treated-bed nets in Timor-Leste:patterns of intended and alternative usage. Malar J. 2011; 10(1):199.
18. Minakawa N, Dida GO, Sonye GO, Futami K, Kaneko S. Unforeseen misuses of bed nets in fishing vil-lages along Lake Victoria. Malar J. 2008; 7:165. doi: 10.1186/1475-2875-7-165 PMID: 18752662
19. Honjo K, Chaves LF, Satake A, Kaneko A, Minakawa N. When they don’t bite, we smell money: under-standing malaria bednet misuse. Parasitology. 2013; 140(5):580–6. doi: 10.1017/S0031182012002077 PMID: 23343880
20. Vanden Eng JL, Thwing J, Wolkon A, Kulkarni MA, Manya A, Erskine M, et al. Assessing bed net useand non-use after long-lasting insecticidal net distribution: a simple framework to guide programmaticstrategies. Malar J. 2010; 9(133):1–9.
21. Namanya DB. Comparative study of malaria risk factors and access to healthcare services by Batwaand non-Batwa communities in Kanungu district southwestern Uganda. International Health SciencesUniversity; 2013.
22. Uganda Bureau of Statistics. Malaria Indicator Survey (MIS) 2014–15 [Internet]. Kampala; 2015. Avail-able from: http://dhsprogram.com/pubs/pdf/MIS21/MIS21.pdf
23. Creative Research and Evaluation Center. Combating child mortality among Batwa project (CCMB):household census/survey 2011. 2011.
24. Bebbington A, Dani A, Hann A de, Walton M, editors. Institutional Pathways to Equity: AddressingInequality Traps. Washinton, D.C: World Bank Publications; 2008. 255 p.
25. Jackson D. The health situation of women and children in central-African Pygmy peoples. Forest Peo-ples Programme. 2006.
26. Lewis J. The Batwa Pygmies of the Great Lakes Region [Internet]. London; 2000 [cited 2014 May 24].Available from: http://www.refworld.org/pdfid/469cbf89d.pdf
27. Baker W. Uganda: the marginalization of minorities. London; 2001.
28. Ohenjo N, Willis R, Jackson D, Nettleton C, Good K, Mugarura B. Indigenous health 3: health of Indige-nous people in Africa. Lancet. 2006; 367(9526):1937–46. PMID: 16765763
29. Clark S, Berrang-Ford L, Lwasa S, Namanya DB, Edge VL, Harper S. The burden and determinants ofself-reported acute gastrointestinal illness in an Indigenous Batwa Pygmy population in southwesternUganda. Epidemiol Infect. 2014;1–12.
30. Koenker H, Kilian A. Recalculating the net use gap: A multi-country comparison of ITN use versus ITNaccess. PLoS One. 2014; 9(5):1–7.
31. WHO. Long-lasting insecticidal nets for malaria prevention-a manual for malaria programmemanagers.Geneva; 2007.
32. Kilian A, Boulay M, Koenker H, Lynch M. Howmany mosquito nets are needed to achieve universalcoverage? Recommendations for the quantification and allocation of long-lasting insecticidal nets formass campaigns. Malar J. 2010; 9:330. doi: 10.1186/1475-2875-9-330 PMID: 21087460
33. Kolenikov S, Angeles G. The use of discrete data in PCA: theory, simulations, and applications to socio-economic indices. 2004.
34. Balen J, McManus DP, Li Y-S, Zhao Z-Y, Yuan L-P, Utzinger J, et al. Comparison of two approachesfor measuring household wealth via an asset-based index in rural and peri-urban settings of Hunanprovince, China. Emerg Themes Epidemiol. 2010; 7(1):7. doi: 10.1186/1742-7622-7-7 PMID:20813070
35. Cleland JG, van Ginneken JK. Maternal education and child survival in developing countries: Thesearch for pathways of influence. Soc Sci Med. 1988; 27(12):1357–68. PMID: 3070762
Mosquito Net Retention for Indigenous Batwa
PLOSONE | DOI:10.1371/journal.pone.0154808 May 4, 2016 18 / 20
36. Muir S. Factors influencing the maternal use of oral rehydration solution in the home treatment of child-hood diarrhea in West Java, Indonesia. Memorial University of Newfoundland; 2002.
37. Merlo J, Chaix B, Ohlsson H, Beckman A, Johnell K, Hjerpe P, et al. A brief conceptual tutorial of multi-level analysis in social epidemiology: using measures of clustering in multilevel logistic regression toinvestigate contextual phenomena. J Epidemiol Community Health. 2006; 60:290–7. PMID: 16537344
38. Larsen K, Merlo J. Appropriate assessment of neighborhood effects on individual health: Integratingrandom and fixed effects in multilevel logistic regression. Am J Epidemiol. 2005; 161(1):81–8. PMID:15615918
39. Neath A, Cavanaugh JE. The Bayesian information criterion: background, derivation, and applications.Comput Stat [Internet]. 2012 Mar 14 [cited 2014 May 20]; 4(2):199–203. Available from: http://doi.wiley.com/10.1002/wics.199
40. Bwindi Community Hospital. Patient database. Buhoma, Kanungu District; Accessed Aug 2014.
41. Bennett A, Smith SJ, Yambasu S, Jambai A, AlemuW, Kabano A, et al. Household possession anduse of insecticide-treated mosquito nets in Sierra Leone 6 months after a national mass-distributioncampaign. PLoS One. 2012; 7(5):e37927. doi: 10.1371/journal.pone.0037927 PMID: 22666414
42. DeressaW, Fentie G, Girma S, Reithinger R. Ownership and use of insecticide-treated nets in Oromiaand Amhara regional states of Ethiopia two years after a nationwide campaign. Trop Med Int Health.2011; 16(12):1552–61. doi: 10.1111/j.1365-3156.2011.02875.x PMID: 21883727
43. Zöllner C, De Allegri M, Louis VR, Yé M, Sié A, Tiendrebéogo J, et al. Insecticide-treated mosquito netsin rural Burkina Faso: assessment of coverage and equity in the wake of a universal distribution cam-paign. Health Policy Plan. 2015; 30(2):171–80. doi: 10.1093/heapol/czt108 PMID: 24463333
44. Garrod G. Examination of antibody responses as a measure of malaria exposure and transmissionintensity in the Batwa pygmies of Uganda. London School of Hygiene and Tropical Medicine; 2014.
45. Korenromp EL, Miller J, Cibulskis RE, ChamMK, Alnwick D, Dye C. Monitoring mosquito net coveragefor malaria control in Africa: possession vs use by children under 5 years. Trop Med Int Heal. 2003; 8(8):693–703.
46. Noor AM, Kirui VC, Brooker SJ, Snow RW. The use of insecticide treated nets by age: implications foruniversal coverage in Africa. BMC Public Health. 2009; 9:369. doi: 10.1186/1471-2458-9-369 PMID:19796380
47. Mugisha F, Arinaitwe J. Sleeping arrangements and mosquito net use among under-fives: results fromthe Uganda Demographic and Health Survey. Malar J. 2003; 10:1–10.
48. Baume CA, Marin MC. Intra-household mosquito net use in Ethiopia, Ghana, Mali, Nigeria, Senegal,and Zambia: Are nets being used?Who in the household uses them? Am J Trop Med Hyg. 2007; 77(5):963–71. PMID: 17984361
49. Kilian A, Koenker H, Baba E, Onyefunafoa EO, Selby R a, Lokko K, et al. Universal coverage withinsecticide-treated nets—applying the revised indicators for ownership and use to the Nigeria 2010malaria indicator survey data. Malar J. 2013; 12(1):314.
50. Ricotta E, Koenker H, Kilian A, Lynch M. Are pregnant women prioritized for bed nets? An assessmentusing survey data from 10 African countries. Glob Heal Sci Pract. 2014; 2(2):165–72.
51. HawleyWA, Phillips-Howard PA, Kuile FO, Terlouw DJ, Vulule JM, Ombok M, et al. Community-wideeffects of permethrin-treated bed nets on child mortality and malaria morbidity in western Kenya. Am JTrop Med Hyg. 2003; 68:121–7. PMID: 12749495
52. Komazawa O, Kaneko S, K’Opiyo J, Kiche I, Wanyua S, Shimada M, et al. Are long-lasting insecticidalnets effective for preventing childhood deaths among non-net users? A community-based cohort studyin western Kenya. PLoS One. 2012; 7(11):e49604. doi: 10.1371/journal.pone.0049604 PMID:23185378
53. Heggenhougen K, Hackethal V, Vivek P. The behavioural and social aspects of malaria and its control.Geneva; 2003.
54. Marmot M. Social determinants of health inequalities. Lancet. Elsevier; 2005; 365(9464):1099–104.
55. Legesse Y, Tegegn A, Belachew T, Tushune K. Households willingness to pay for long-lasting insecti-cide treated nets in three urban communities of Assosa Zone, western Ethiopia. Ethiop Med J. 2007; 45(4):353–62. PMID: 18326345
56. Worrall E, Basu S, Hanson K. Is malaria a disease of poverty? A review of the literature. Trop Med IntHeal. 2005; 10(10):1047–59.
57. Harper S. Social Determinants of Health for Uganda’s Indigenous Batwa Population [Internet]. 2012[cited 2015 Aug 18]. Available from: http://dspace.africaportal.org/jspui/bitstream/123456789/32876/1/BackgrounderNo.32.pdf?1
58. Rose G. Sick individuals and sick populations. Int J Epidemiol. 2001; 30(3):427–31. PMID: 11416056
Mosquito Net Retention for Indigenous Batwa
PLOSONE | DOI:10.1371/journal.pone.0154808 May 4, 2016 19 / 20
59. Kilian A, Balayo C, FeldmanM, Koenker H, Lokko K, Ashton RA, et al. The effect of single or repeatedhome visits on the hanging and use of insecticide-Treated mosquito nets following a mass distributioncampaign—A cluster randomized, controlled trial. PLoS One. 2015; 10(3):1–21.
60. Allan R, O’Reilly L, Gilbos V, Kilian A. An observational study of material durability of three world healthorganization-recommended long-lasting insecticidal nets in Eastern Chad. Am J Trop Med Hyg. 2012;87(3):407–11. doi: 10.4269/ajtmh.2012.11-0331 PMID: 22802441
61. Coughlin SS. Recall bias in epidemiologic studies. J Clin Epidemiol. 1990; 43(1):87–91. PMID:2319285
Mosquito Net Retention for Indigenous Batwa
PLOSONE | DOI:10.1371/journal.pone.0154808 May 4, 2016 20 / 20