Embed Size (px)
Citation preview
626 IEEE JOURNAL OF PHOTOVOLTAICS, VOL. 4, NO. 2, MARCH 2014
A Maximum Power Point Tracking Method Based onPerturb-and-Observe Combined With Particle
Swarm OptimizationK. L. Lian, Member, IEEE, J. H. Jhang, and I. S. Tian
Abstract—Conventional maximum power point tracking(MPPT) methods such as perturb-and-observe (P&O) method canonly track the first local maximum point and stop progressing tothe next maximum point. MPPT methods based on particle swarmoptimization (PSO) have been proposed to track the global max-imum point (GMP). However, the problem with the PSO methodis that the time required for convergence may be long if the rangeof the search space is large. This paper proposes a hybrid method,which combines P&O and PSO methods. Initially, the P&O methodis employed to allocate the nearest local maximum. Then, startingfrom that point on, the PSO method is employed to search forthe GMP. The advantage of using the proposed hybrid method isthat the search space for the PSO is reduced, and hence, the timethat is required for convergence can be greatly improved. The ex-cellent performance of the proposed hybrid method is verified bycomparing it against the PSO method using an experimental setup.
Index Terms—Global optimization, maximum power pointtracking (MPPT), photovoltaic (PV) array, partial shading.
I. INTRODUCTION
OVER the few past decades, many algorithms to trackthe maximum power point (MPP) have been proposed.
Among these, perturb-and-observe (P&O), hill-climbing (HC),and incremental conductance (INC) are the most widely usedmethods [1]–[3]. As shown in [4] and [5], these methods areessentially different ways of envisioning the same fundamentalconcept, and rely on determining the gradient of the power withrespect to the current or voltage using the perturbation methodin each iteration. When the first local maximum point (LMP) isreached, the algorithms stop progressing to the next maximumpoint (if there is any). Consequently, the main drawback of thesemethods is that they tend to converge to a single LMP, which isonly appropriate under uniform insolation conditions.
Under partially shaded conditions, the shaded cells in a mod-ule become reverse biased and behave as a load, leading to the
Manuscript received February 2, 2013; revised August 10, 2013; acceptedDecember 23, 2013. Date of publication January 16, 2014; date of currentversion February 17, 2014. This work was supported by the National ScienceCouncil under Contract NSC 101-2221-E-011-119.
K. L. Lian and J. H. Jhang are with the Power and Energy Group, Na-tional Taiwan University of Science and Technology, Taipei City 10607, Taiwan(e-mail: [email protected]; [email protected]).
I. S. Tian is with MiTAC International Corp., Taipei 11568, Taiwan (e-mail:[email protected]).
Color versions of one or more of the figures in this paper are available onlineat http://ieeexplore.ieee.org.
Digital Object Identifier 10.1109/JPHOTOV.2013.2297513
hot spot problem. To avoid this, bypass diodes are used to con-duct the current that is generated by the nonshaded cells within amodule. However, the connection of bypass diodes will changethe uniform current–voltage (I–V) and power–voltage (P–V)characteristics of the module, resulting in multiple peaks [6]. Tomaximize the efficiency of the module, it is necessary to trackthe global maximum point (GMP). Two approaches are gener-ally used to reduce or counteract the shading effect. The firstis based on hardware fixtures, such as adaptive reconfigurationschemes for the PV arrays [7] and multilevel converter sys-tems [8] that allow each PV source to be controlled separately.This approach is complex and costly [9]. The second approachis to track the GMP by developing advanced control algorithms,and this will be the focus of this paper.
Kobayashi et al. [10] have proposed a two-stage method totrack the GMP. In the first stage, the operating point of the pho-tovoltaic (PV) system moves into the vicinity of the GMP byestimating the equivalent load line. Then, the INC method isemployed to converge to the MPP in the second stage. Becausethe equivalent load line in the first stage is estimated underuniform insolation conditions, some partial shading conditions(PSCs) may cause an LMP to be tracked in the second stage [11].In [9], a scanning process is first utilized to detect the regionswhich contain the GMP. After that, a P&O algorithm is used tofind the GMP. Although this method can successfully find theGMP, the tracking speed is limited because almost all LMPsmust be found and compared to obtain the GMP. A Fibonaccisearch (FS) method was proposed in [12]. However, as this isa linear search method, a GMP still cannot be guaranteed. The“DIRECT” (dividing rectangles) algorithm, which is proposedin [7], is based on a Lipschitz condition to find the maximumpoint. To ensure that the GMP is found, the search areas to bedivided must be selected with care; otherwise, false GMP maybe found. Lei et al. [13] proposed a sequential extremum seek-ing control strategy for GMP tracking. However, this processrequires the variation bound for the turning-point voltage to befound. This in turn requires knowledge of the P–V or P–I char-acteristics under variable-shading circumstances, which may bedifficult to obtain in practice. Researchers have also used arti-ficial intelligence algorithms to develop maximum power pointtracking (MPPT) methods. In [6], a radial basis function anda three-layered feedforward neural network are used to trackthe GMP. However, the accuracy of this scheme depends on thevolume of training data, and considerable computational effortis needed to ensure reliability and accuracy under any shadingcondition.
2156-3381 © 2014 IEEE. Personal use is permitted, but republication/redistribution requires IEEE permission.See http://www.ieee.org/publications standards/publications/rights/index.html for more information.
LIAN et al.: MAXIMUM POWER POINT TRACKING METHOD BASED ON PERTURB-AND-OBSERVE COMBINED 627
Chen et al. [14] demonstrated an MPPT method that is basedon biological swarm chasing behavior to increase the track-ing performance. Nevertheless, only uniform insolation condi-tions were considered and PSCs were not addressed. Miyatakeet al. [15] have realized centralized MPPT control of modu-lar PV systems, and used particle swarm optimization (PSO)to determine the individual module voltage. They showed thatPSO can outperform conventional methods such as HC andFS under PSCs. Ishaque et al. [16] and Liu et al. [17] imple-mented PSO-based MPPT control algorithms in a PV system,consisting of a high-power single-stage converter. However, asreported in [18], one problem of the PSO algorithm is the longGMP tracking time for large search spaces. In [18], the authorsproposed to remove the random number from the PSO accelera-tion factors to reduce the tracking time. Nevertheless, the valueof the maximum change in the particle velocity must be re-stricted; otherwise, LMPs may be obtained. Moreover, Ishaqueand Salam [18] gave no guidelines on how to select this value.
This paper proposes a hybrid of the P&O and PSO methods.Initially, the P&O method is employed to identify the near-est local maximum. Starting from that point, the PSO methodis used to search for the GMP. The advantage of this hybridmethod is that the search space of the PSO is reduced, andhence, the time required for convergence can be greatly de-creased. Moreover, there is no need to place a restriction on themaximum particle velocity. The rest of this paper is arranged asfollows. The PSO method will be briefly reviewed in Section II.Section III then describes the proposed method. The experi-mental setup and a comparison of PSO and the proposed hybridmethod are described in Section IV. Finally, the paper is con-cluded in Section V.
II. REVIEW OF THE PARTICLE SWARM OPTIMIZATION METHOD
In this paper, a voltage-based controller will be discussed.The PV voltage as the regulated variable is easier to imple-ment because the MPPT controller can quickly decide the initialpoints according to the percentage of the open-circuit voltage(Voc) [19]. In addition, current-based control implementationrequires caution to prevent the PV current to reach its short-circuit current, Isc , resulting in sudden voltage drop and causingpower losses [19]. In [19] and [20], a detailed discussion on thecomparison of voltage- and current-based MPPT controllers isprovided.
The PSO method is a metaheuristic approach [21] that can beapplied to optimize a function which is difficult or impossibleto express analytically. The PSO algorithm can be expressedmathematically by two equations which specify the velocityand position update of a particle i
uk+1i = ωuk
i + c1r1(pbesti − xk
i
)+ c2r2
(gbest − xk
i
)(1)
xk+1i = xk
i + uk+1i (2)
where uki is the velocity of individual i at iteration k, ω is an
inertia weight parameter, c1 and c2 are acceleration coefficients,r1 and r2 are random numbers between 0 and 1, xk
i is the po-sition of individual i at iteration k, pbesti is the best position ofindividual i at iteration k, and gbest is the best position of the
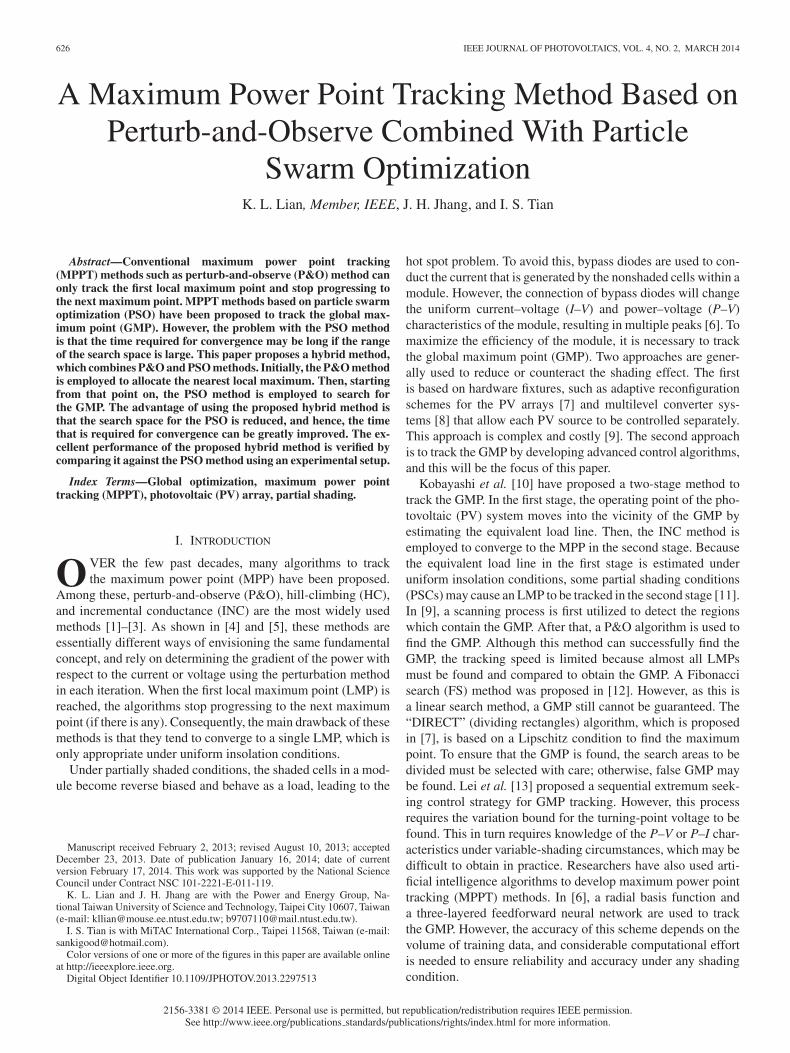
Fig. 1. Flowchart for the PSO method.
group up to iteration k. The value of ω can be determined by anequation or set to a fixed value. The purpose of the MPPT blockis to obtain Vref , which is sent to the PI controller. Therefore,the position (x) variables in (1) and (2) are actually the voltagereferences (Vref ), whereas the velocity (u) variables can be re-garded as the correction terms for the voltage references. Sincethe converter can only respond to one command at a time, theparticles are initialized and evaluated in a successive manner.The interval between successive particles, Tint , must be greaterthan the settling time of the system in order to obtain correctcurrent and voltage samples [6], [17]. Fig. 1 summarizes thecontrol action of the PSO method used for MPPT. In the firstiteration, Vref is initially set to some value (see Section IV-B).It is then updated according to (1) and (2). The power Ppv ,i iscalculated by multiplying the measured voltage (Vpv ) and cur-rent (Ipv ). Then, the algorithm proceeds to check whether thisvoltage reference value will result in a better individual fitnessvalue [17] by evaluating the following equation:
Ppv ,i > Ppv ,i−1 . (3)
If (3) is satisfied, the individual fitness value (pbesti) is updated;otherwise, pbesti retains its present value. Ppv ,i is then checkedagainst the power of the other particles to see if the global fitness
628 IEEE JOURNAL OF PHOTOVOLTAICS, VOL. 4, NO. 2, MARCH 2014
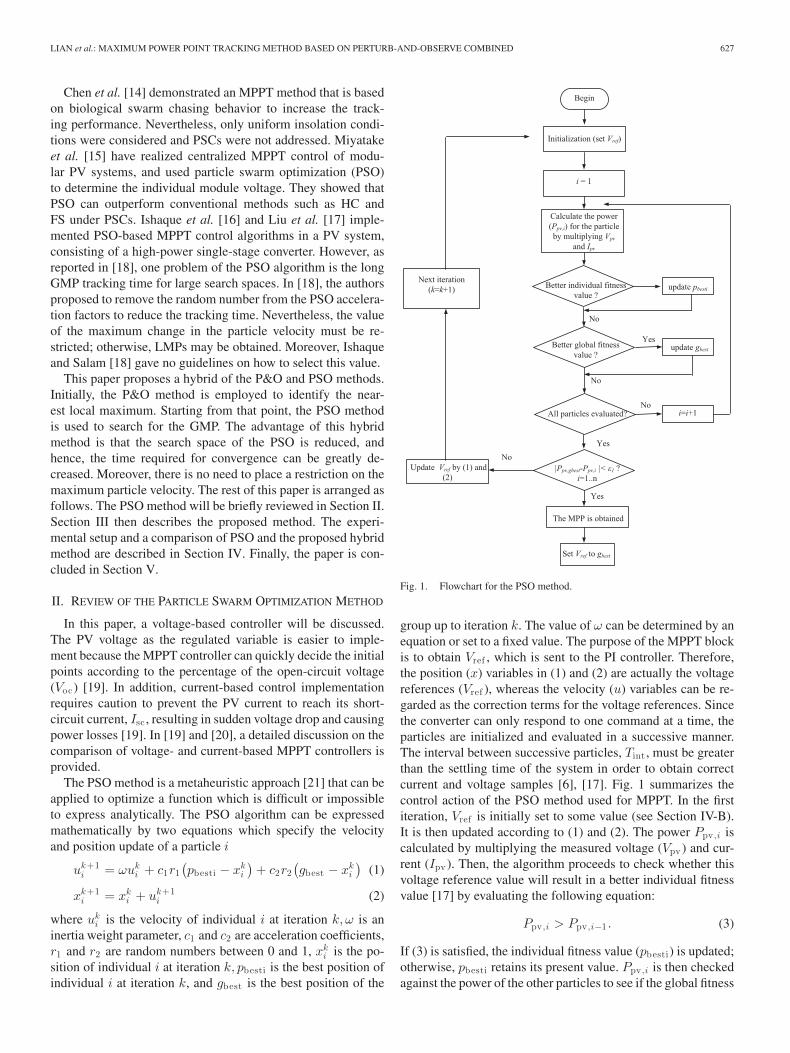
Fig. 2. Flowchart for the proposed method.
value (gbest) requires updating. A sufficient amount of time mustbe provided for each particle to perform all the aforementionedsteps. Finally, the convergence criterion as defined in (4) ischecked to ensure that all the particles converge to the GMP
|Ppv ,gbest − Ppv ,i | < ε1 ; i = 1 . . . n (4)
where ε1 is the tolerance value.
III. PROPOSED METHOD
Fig. 2 illustrates the proposed hybrid algorithm as a flowchart.The method consists of two stages. In the first stage, the P&Omethod is employed to quickly search for the first local max-imum. The operating voltage (Vpv ) is perturbed by a smallamount (Vc ) [19], [22] every control cycle (Tperb ) to determinewhether the algorithm is traveling up or down in the P–V curve.Note that a convergence criterion (ΔPpv < ε2) needs to be in-troduced in the first stage of the proposed method, as shownin Fig. 2 to locate the first LMP and to pass it to the secondstage. The value of ε2 should be chosen with care because if itis too large, the program may switch to the second stage beforereaching the first LMP. On the other hand, if it is too small,the time staying in the first stage may be long before proceed-ing to the second stage. Although ε2 may be obtained by trialand error, it can also be obtained by a systematic procedure,as suggested in [23] and [24]. This is especially useful whenoscillations occur in the voltage of the energy storage capaci-tor because the program needs to distinguish variations in the
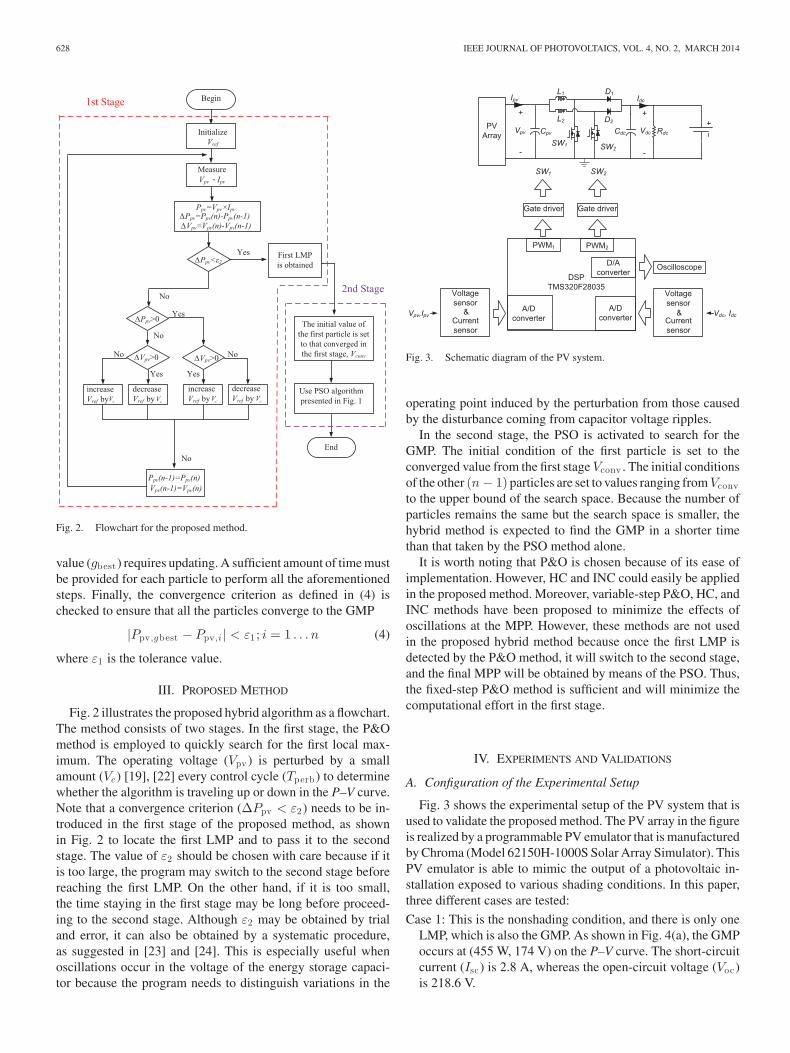
Fig. 3. Schematic diagram of the PV system.
operating point induced by the perturbation from those causedby the disturbance coming from capacitor voltage ripples.
In the second stage, the PSO is activated to search for theGMP. The initial condition of the first particle is set to theconverged value from the first stage Vconv . The initial conditionsof the other (n − 1) particles are set to values ranging from Vconvto the upper bound of the search space. Because the number ofparticles remains the same but the search space is smaller, thehybrid method is expected to find the GMP in a shorter timethan that taken by the PSO method alone.
It is worth noting that P&O is chosen because of its ease ofimplementation. However, HC and INC could easily be appliedin the proposed method. Moreover, variable-step P&O, HC, andINC methods have been proposed to minimize the effects ofoscillations at the MPP. However, these methods are not usedin the proposed hybrid method because once the first LMP isdetected by the P&O method, it will switch to the second stage,and the final MPP will be obtained by means of the PSO. Thus,the fixed-step P&O method is sufficient and will minimize thecomputational effort in the first stage.
IV. EXPERIMENTS AND VALIDATIONS
A. Configuration of the Experimental Setup
Fig. 3 shows the experimental setup of the PV system that isused to validate the proposed method. The PV array in the figureis realized by a programmable PV emulator that is manufacturedby Chroma (Model 62150H-1000S Solar Array Simulator). ThisPV emulator is able to mimic the output of a photovoltaic in-stallation exposed to various shading conditions. In this paper,three different cases are tested:
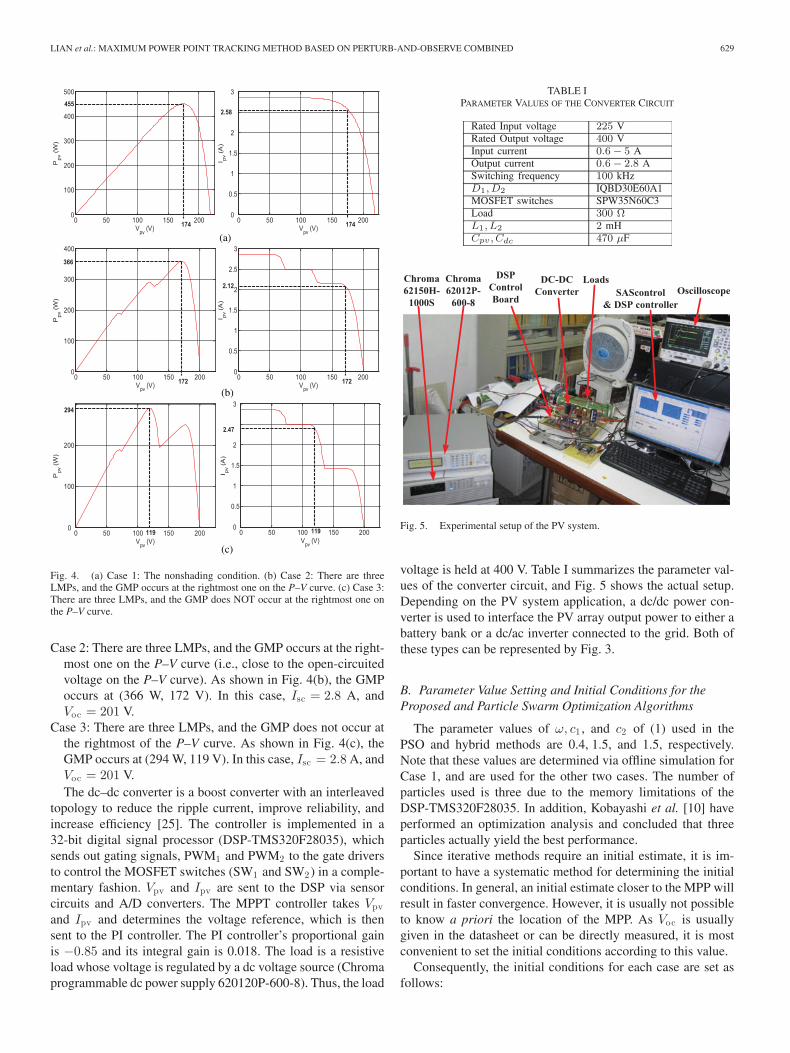
Case 1: This is the nonshading condition, and there is only oneLMP, which is also the GMP. As shown in Fig. 4(a), the GMPoccurs at (455 W, 174 V) on the P–V curve. The short-circuitcurrent (Isc) is 2.8 A, whereas the open-circuit voltage (Voc)is 218.6 V.
LIAN et al.: MAXIMUM POWER POINT TRACKING METHOD BASED ON PERTURB-AND-OBSERVE COMBINED 629
(a)
(b)
(c)
Fig. 4. (a) Case 1: The nonshading condition. (b) Case 2: There are threeLMPs, and the GMP occurs at the rightmost one on the P–V curve. (c) Case 3:There are three LMPs, and the GMP does NOT occur at the rightmost one onthe P–V curve.
Case 2: There are three LMPs, and the GMP occurs at the right-most one on the P–V curve (i.e., close to the open-circuitedvoltage on the P–V curve). As shown in Fig. 4(b), the GMPoccurs at (366 W, 172 V). In this case, Isc = 2.8 A, andVoc = 201 V.
Case 3: There are three LMPs, and the GMP does not occur atthe rightmost of the P–V curve. As shown in Fig. 4(c), theGMP occurs at (294 W, 119 V). In this case, Isc = 2.8 A, andVoc = 201 V.The dc–dc converter is a boost converter with an interleaved
topology to reduce the ripple current, improve reliability, andincrease efficiency [25]. The controller is implemented in a32-bit digital signal processor (DSP-TMS320F28035), whichsends out gating signals, PWM1 and PWM2 to the gate driversto control the MOSFET switches (SW1 and SW2) in a comple-mentary fashion. Vpv and Ipv are sent to the DSP via sensorcircuits and A/D converters. The MPPT controller takes Vpvand Ipv and determines the voltage reference, which is thensent to the PI controller. The PI controller’s proportional gainis −0.85 and its integral gain is 0.018. The load is a resistiveload whose voltage is regulated by a dc voltage source (Chromaprogrammable dc power supply 620120P-600-8). Thus, the load
TABLE IPARAMETER VALUES OF THE CONVERTER CIRCUIT
Fig. 5. Experimental setup of the PV system.
voltage is held at 400 V. Table I summarizes the parameter val-ues of the converter circuit, and Fig. 5 shows the actual setup.Depending on the PV system application, a dc/dc power con-verter is used to interface the PV array output power to either abattery bank or a dc/ac inverter connected to the grid. Both ofthese types can be represented by Fig. 3.
B. Parameter Value Setting and Initial Conditions for theProposed and Particle Swarm Optimization Algorithms
The parameter values of ω, c1 , and c2 of (1) used in thePSO and hybrid methods are 0.4, 1.5, and 1.5, respectively.Note that these values are determined via offline simulation forCase 1, and are used for the other two cases. The number ofparticles used is three due to the memory limitations of theDSP-TMS320F28035. In addition, Kobayashi et al. [10] haveperformed an optimization analysis and concluded that threeparticles actually yield the best performance.
Since iterative methods require an initial estimate, it is im-portant to have a systematic method for determining the initialconditions. In general, an initial estimate closer to the MPP willresult in faster convergence. However, it is usually not possibleto know a priori the location of the MPP. As Voc is usuallygiven in the datasheet or can be directly measured, it is mostconvenient to set the initial conditions according to this value.
Consequently, the initial conditions for each case are set asfollows:
630 IEEE JOURNAL OF PHOTOVOLTAICS, VOL. 4, NO. 2, MARCH 2014
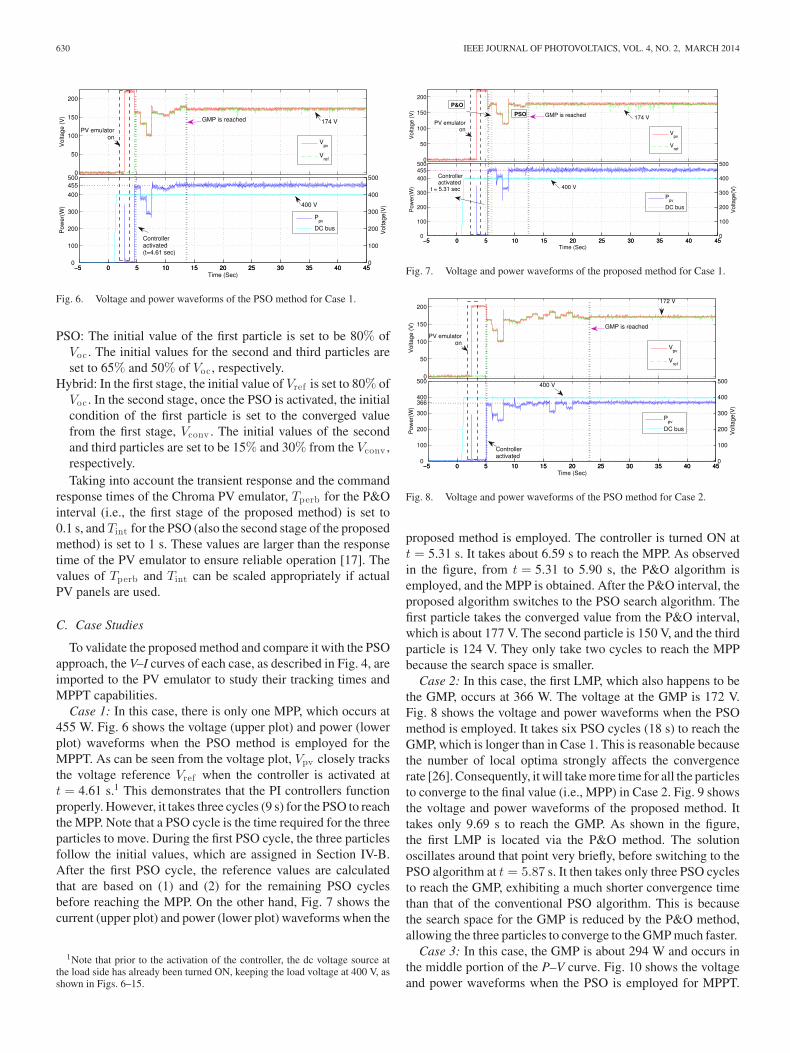
Fig. 6. Voltage and power waveforms of the PSO method for Case 1.
PSO: The initial value of the first particle is set to be 80% ofVoc . The initial values for the second and third particles areset to 65% and 50% of Voc , respectively.
Hybrid: In the first stage, the initial value of Vref is set to 80% ofVoc . In the second stage, once the PSO is activated, the initialcondition of the first particle is set to the converged valuefrom the first stage, Vconv . The initial values of the secondand third particles are set to be 15% and 30% from the Vconv ,respectively.Taking into account the transient response and the command
response times of the Chroma PV emulator, Tperb for the P&Ointerval (i.e., the first stage of the proposed method) is set to0.1 s, and Tint for the PSO (also the second stage of the proposedmethod) is set to 1 s. These values are larger than the responsetime of the PV emulator to ensure reliable operation [17]. Thevalues of Tperb and Tint can be scaled appropriately if actualPV panels are used.
C. Case Studies
To validate the proposed method and compare it with the PSOapproach, the V–I curves of each case, as described in Fig. 4, areimported to the PV emulator to study their tracking times andMPPT capabilities.
Case 1: In this case, there is only one MPP, which occurs at455 W. Fig. 6 shows the voltage (upper plot) and power (lowerplot) waveforms when the PSO method is employed for theMPPT. As can be seen from the voltage plot, Vpv closely tracksthe voltage reference Vref when the controller is activated att = 4.61 s.1 This demonstrates that the PI controllers functionproperly. However, it takes three cycles (9 s) for the PSO to reachthe MPP. Note that a PSO cycle is the time required for the threeparticles to move. During the first PSO cycle, the three particlesfollow the initial values, which are assigned in Section IV-B.After the first PSO cycle, the reference values are calculatedthat are based on (1) and (2) for the remaining PSO cyclesbefore reaching the MPP. On the other hand, Fig. 7 shows thecurrent (upper plot) and power (lower plot) waveforms when the
1Note that prior to the activation of the controller, the dc voltage source atthe load side has already been turned ON, keeping the load voltage at 400 V, asshown in Figs. 6–15.
Fig. 7. Voltage and power waveforms of the proposed method for Case 1.
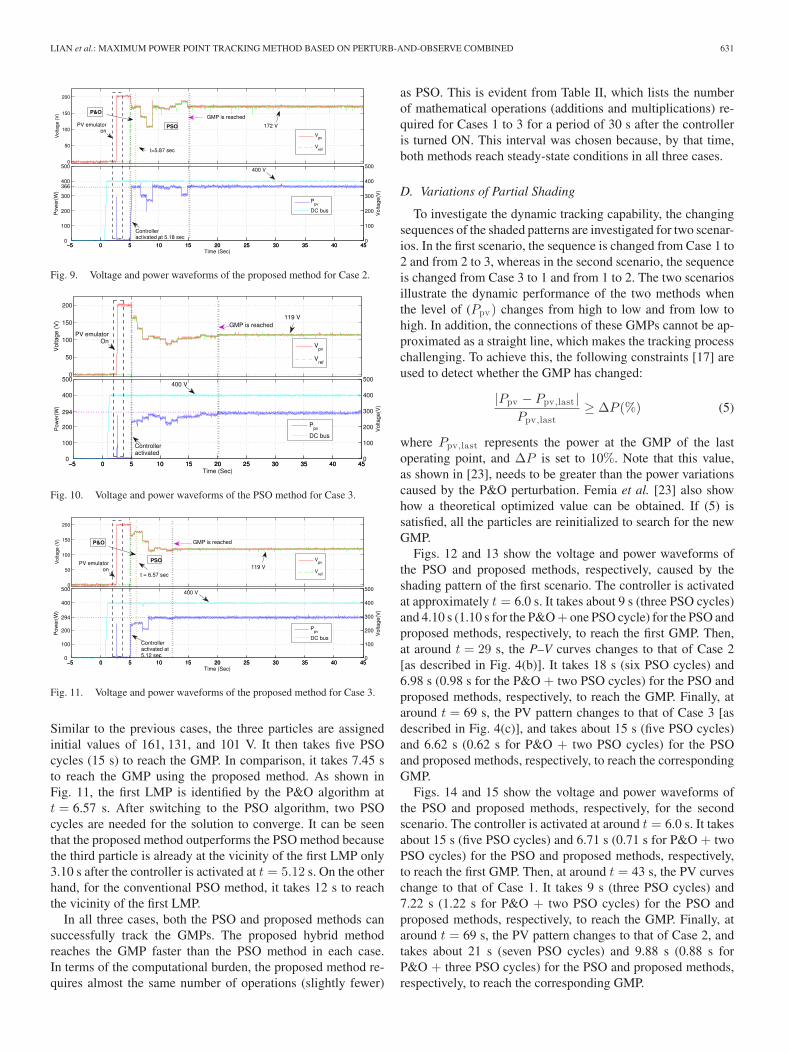
Fig. 8. Voltage and power waveforms of the PSO method for Case 2.
proposed method is employed. The controller is turned ON att = 5.31 s. It takes about 6.59 s to reach the MPP. As observedin the figure, from t = 5.31 to 5.90 s, the P&O algorithm isemployed, and the MPP is obtained. After the P&O interval, theproposed algorithm switches to the PSO search algorithm. Thefirst particle takes the converged value from the P&O interval,which is about 177 V. The second particle is 150 V, and the thirdparticle is 124 V. They only take two cycles to reach the MPPbecause the search space is smaller.
Case 2: In this case, the first LMP, which also happens to bethe GMP, occurs at 366 W. The voltage at the GMP is 172 V.Fig. 8 shows the voltage and power waveforms when the PSOmethod is employed. It takes six PSO cycles (18 s) to reach theGMP, which is longer than in Case 1. This is reasonable becausethe number of local optima strongly affects the convergencerate [26]. Consequently, it will take more time for all the particlesto converge to the final value (i.e., MPP) in Case 2. Fig. 9 showsthe voltage and power waveforms of the proposed method. Ittakes only 9.69 s to reach the GMP. As shown in the figure,the first LMP is located via the P&O method. The solutionoscillates around that point very briefly, before switching to thePSO algorithm at t = 5.87 s. It then takes only three PSO cyclesto reach the GMP, exhibiting a much shorter convergence timethan that of the conventional PSO algorithm. This is becausethe search space for the GMP is reduced by the P&O method,allowing the three particles to converge to the GMP much faster.
Case 3: In this case, the GMP is about 294 W and occurs inthe middle portion of the P–V curve. Fig. 10 shows the voltageand power waveforms when the PSO is employed for MPPT.
LIAN et al.: MAXIMUM POWER POINT TRACKING METHOD BASED ON PERTURB-AND-OBSERVE COMBINED 631
Fig. 9. Voltage and power waveforms of the proposed method for Case 2.
Fig. 10. Voltage and power waveforms of the PSO method for Case 3.
Fig. 11. Voltage and power waveforms of the proposed method for Case 3.
Similar to the previous cases, the three particles are assignedinitial values of 161, 131, and 101 V. It then takes five PSOcycles (15 s) to reach the GMP. In comparison, it takes 7.45 sto reach the GMP using the proposed method. As shown inFig. 11, the first LMP is identified by the P&O algorithm att = 6.57 s. After switching to the PSO algorithm, two PSOcycles are needed for the solution to converge. It can be seenthat the proposed method outperforms the PSO method becausethe third particle is already at the vicinity of the first LMP only3.10 s after the controller is activated at t = 5.12 s. On the otherhand, for the conventional PSO method, it takes 12 s to reachthe vicinity of the first LMP.
In all three cases, both the PSO and proposed methods cansuccessfully track the GMPs. The proposed hybrid methodreaches the GMP faster than the PSO method in each case.In terms of the computational burden, the proposed method re-quires almost the same number of operations (slightly fewer)
as PSO. This is evident from Table II, which lists the numberof mathematical operations (additions and multiplications) re-quired for Cases 1 to 3 for a period of 30 s after the controlleris turned ON. This interval was chosen because, by that time,both methods reach steady-state conditions in all three cases.
D. Variations of Partial Shading
To investigate the dynamic tracking capability, the changingsequences of the shaded patterns are investigated for two scenar-ios. In the first scenario, the sequence is changed from Case 1 to2 and from 2 to 3, whereas in the second scenario, the sequenceis changed from Case 3 to 1 and from 1 to 2. The two scenariosillustrate the dynamic performance of the two methods whenthe level of (Ppv) changes from high to low and from low tohigh. In addition, the connections of these GMPs cannot be ap-proximated as a straight line, which makes the tracking processchallenging. To achieve this, the following constraints [17] areused to detect whether the GMP has changed:
|Ppv − Ppv ,last |Ppv ,last
≥ ΔP (%) (5)
where Ppv ,last represents the power at the GMP of the lastoperating point, and ΔP is set to 10%. Note that this value,as shown in [23], needs to be greater than the power variationscaused by the P&O perturbation. Femia et al. [23] also showhow a theoretical optimized value can be obtained. If (5) issatisfied, all the particles are reinitialized to search for the newGMP.
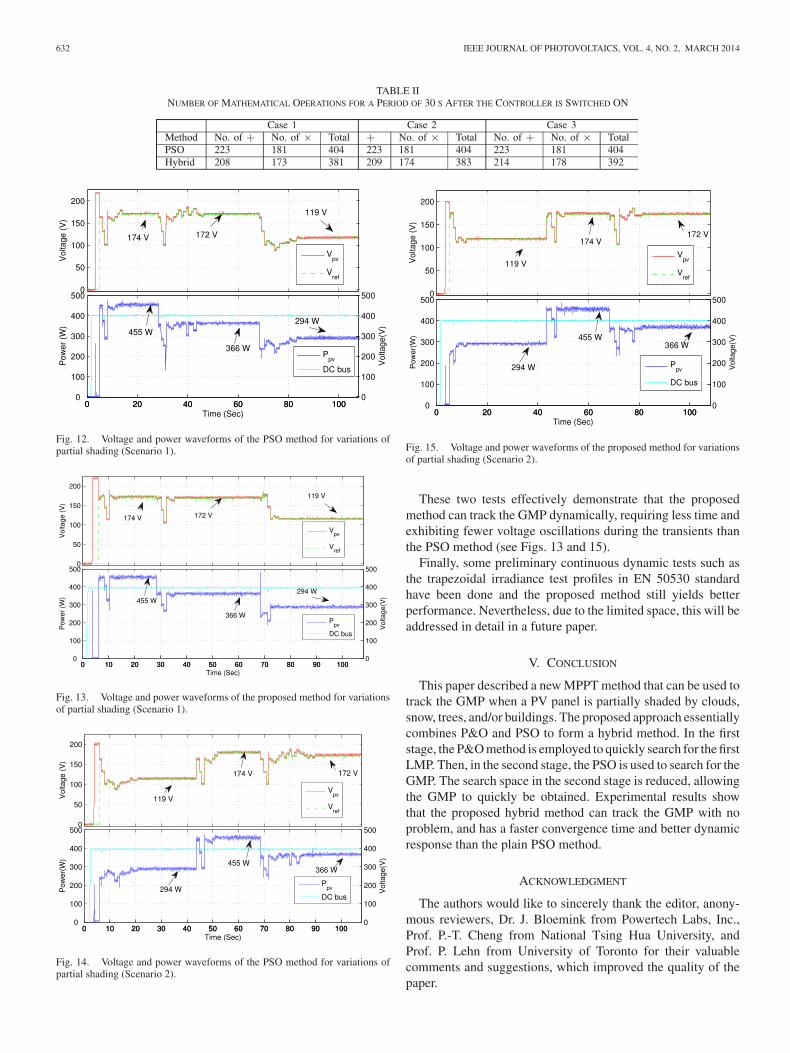
Figs. 12 and 13 show the voltage and power waveforms ofthe PSO and proposed methods, respectively, caused by theshading pattern of the first scenario. The controller is activatedat approximately t = 6.0 s. It takes about 9 s (three PSO cycles)and 4.10 s (1.10 s for the P&O + one PSO cycle) for the PSO andproposed methods, respectively, to reach the first GMP. Then,at around t = 29 s, the P–V curves changes to that of Case 2[as described in Fig. 4(b)]. It takes 18 s (six PSO cycles) and6.98 s (0.98 s for the P&O + two PSO cycles) for the PSO andproposed methods, respectively, to reach the GMP. Finally, ataround t = 69 s, the PV pattern changes to that of Case 3 [asdescribed in Fig. 4(c)], and takes about 15 s (five PSO cycles)and 6.62 s (0.62 s for P&O + two PSO cycles) for the PSOand proposed methods, respectively, to reach the correspondingGMP.
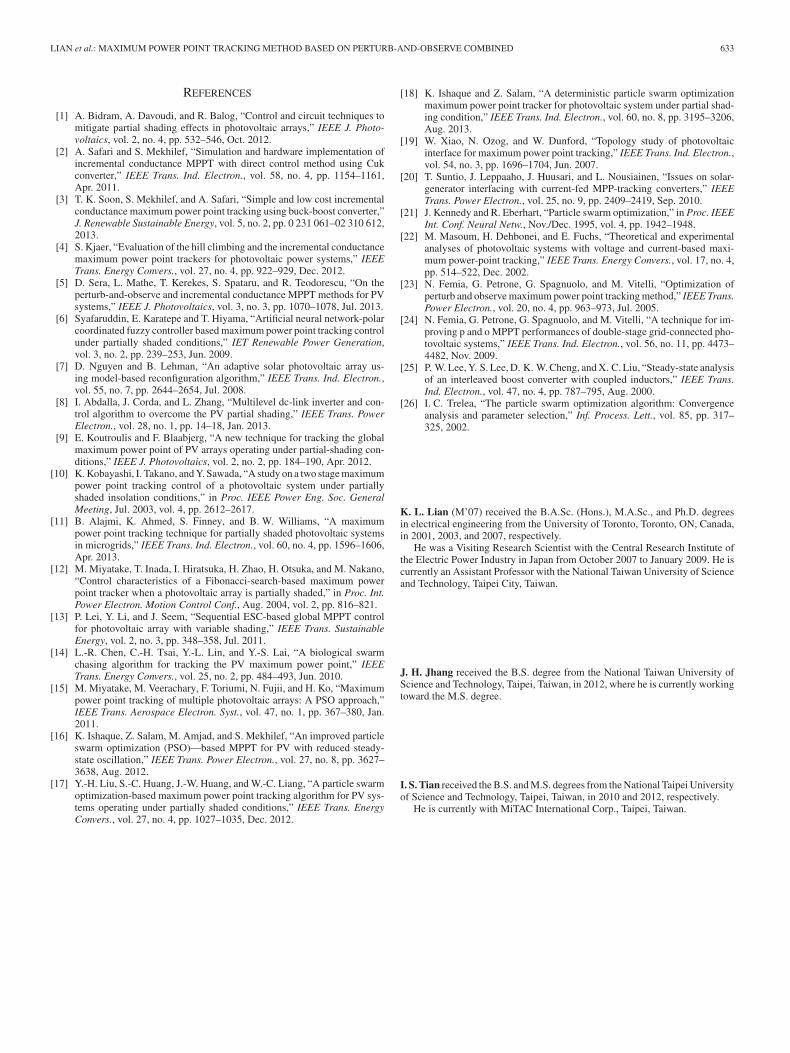
Figs. 14 and 15 show the voltage and power waveforms ofthe PSO and proposed methods, respectively, for the secondscenario. The controller is activated at around t = 6.0 s. It takesabout 15 s (five PSO cycles) and 6.71 s (0.71 s for P&O + twoPSO cycles) for the PSO and proposed methods, respectively,to reach the first GMP. Then, at around t = 43 s, the PV curveschange to that of Case 1. It takes 9 s (three PSO cycles) and7.22 s (1.22 s for P&O + two PSO cycles) for the PSO andproposed methods, respectively, to reach the GMP. Finally, ataround t = 69 s, the PV pattern changes to that of Case 2, andtakes about 21 s (seven PSO cycles) and 9.88 s (0.88 s forP&O + three PSO cycles) for the PSO and proposed methods,respectively, to reach the corresponding GMP.
632 IEEE JOURNAL OF PHOTOVOLTAICS, VOL. 4, NO. 2, MARCH 2014
TABLE IINUMBER OF MATHEMATICAL OPERATIONS FOR A PERIOD OF 30 S AFTER THE CONTROLLER IS SWITCHED ON
Fig. 12. Voltage and power waveforms of the PSO method for variations ofpartial shading (Scenario 1).
Fig. 13. Voltage and power waveforms of the proposed method for variationsof partial shading (Scenario 1).
Fig. 14. Voltage and power waveforms of the PSO method for variations ofpartial shading (Scenario 2).
Fig. 15. Voltage and power waveforms of the proposed method for variationsof partial shading (Scenario 2).
These two tests effectively demonstrate that the proposedmethod can track the GMP dynamically, requiring less time andexhibiting fewer voltage oscillations during the transients thanthe PSO method (see Figs. 13 and 15).
Finally, some preliminary continuous dynamic tests such asthe trapezoidal irradiance test profiles in EN 50530 standardhave been done and the proposed method still yields betterperformance. Nevertheless, due to the limited space, this will beaddressed in detail in a future paper.
V. CONCLUSION
This paper described a new MPPT method that can be used totrack the GMP when a PV panel is partially shaded by clouds,snow, trees, and/or buildings. The proposed approach essentiallycombines P&O and PSO to form a hybrid method. In the firststage, the P&O method is employed to quickly search for the firstLMP. Then, in the second stage, the PSO is used to search for theGMP. The search space in the second stage is reduced, allowingthe GMP to quickly be obtained. Experimental results showthat the proposed hybrid method can track the GMP with noproblem, and has a faster convergence time and better dynamicresponse than the plain PSO method.
ACKNOWLEDGMENT
The authors would like to sincerely thank the editor, anony-mous reviewers, Dr. J. Bloemink from Powertech Labs, Inc.,Prof. P.-T. Cheng from National Tsing Hua University, andProf. P. Lehn from University of Toronto for their valuablecomments and suggestions, which improved the quality of thepaper.
LIAN et al.: MAXIMUM POWER POINT TRACKING METHOD BASED ON PERTURB-AND-OBSERVE COMBINED 633
REFERENCES
[1] A. Bidram, A. Davoudi, and R. Balog, “Control and circuit techniques tomitigate partial shading effects in photovoltaic arrays,” IEEE J. Photo-voltaics, vol. 2, no. 4, pp. 532–546, Oct. 2012.
[2] A. Safari and S. Mekhilef, “Simulation and hardware implementation ofincremental conductance MPPT with direct control method using Cukconverter,” IEEE Trans. Ind. Electron., vol. 58, no. 4, pp. 1154–1161,Apr. 2011.
[3] T. K. Soon, S. Mekhilef, and A. Safari, “Simple and low cost incrementalconductance maximum power point tracking using buck-boost converter,”J. Renewable Sustainable Energy, vol. 5, no. 2, pp. 0 231 061–02 310 612,2013.
[4] S. Kjaer, “Evaluation of the hill climbing and the incremental conductancemaximum power point trackers for photovoltaic power systems,” IEEETrans. Energy Convers., vol. 27, no. 4, pp. 922–929, Dec. 2012.
[5] D. Sera, L. Mathe, T. Kerekes, S. Spataru, and R. Teodorescu, “On theperturb-and-observe and incremental conductance MPPT methods for PVsystems,” IEEE J. Photovoltaics, vol. 3, no. 3, pp. 1070–1078, Jul. 2013.
[6] Syafaruddin, E. Karatepe and T. Hiyama, “Artificial neural network-polarcoordinated fuzzy controller based maximum power point tracking controlunder partially shaded conditions,” IET Renewable Power Generation,vol. 3, no. 2, pp. 239–253, Jun. 2009.
[7] D. Nguyen and B. Lehman, “An adaptive solar photovoltaic array us-ing model-based reconfiguration algorithm,” IEEE Trans. Ind. Electron.,vol. 55, no. 7, pp. 2644–2654, Jul. 2008.
[8] I. Abdalla, J. Corda, and L. Zhang, “Multilevel dc-link inverter and con-trol algorithm to overcome the PV partial shading,” IEEE Trans. PowerElectron., vol. 28, no. 1, pp. 14–18, Jan. 2013.
[9] E. Koutroulis and F. Blaabjerg, “A new technique for tracking the globalmaximum power point of PV arrays operating under partial-shading con-ditions,” IEEE J. Photovoltaics, vol. 2, no. 2, pp. 184–190, Apr. 2012.
[10] K. Kobayashi, I. Takano, and Y. Sawada, “A study on a two stage maximumpower point tracking control of a photovoltaic system under partiallyshaded insolation conditions,” in Proc. IEEE Power Eng. Soc. GeneralMeeting, Jul. 2003, vol. 4, pp. 2612–2617.
[11] B. Alajmi, K. Ahmed, S. Finney, and B. W. Williams, “A maximumpower point tracking technique for partially shaded photovoltaic systemsin microgrids,” IEEE Trans. Ind. Electron., vol. 60, no. 4, pp. 1596–1606,Apr. 2013.
[12] M. Miyatake, T. Inada, I. Hiratsuka, H. Zhao, H. Otsuka, and M. Nakano,“Control characteristics of a Fibonacci-search-based maximum powerpoint tracker when a photovoltaic array is partially shaded,” in Proc. Int.Power Electron. Motion Control Conf., Aug. 2004, vol. 2, pp. 816–821.
[13] P. Lei, Y. Li, and J. Seem, “Sequential ESC-based global MPPT controlfor photovoltaic array with variable shading,” IEEE Trans. SustainableEnergy, vol. 2, no. 3, pp. 348–358, Jul. 2011.
[14] L.-R. Chen, C.-H. Tsai, Y.-L. Lin, and Y.-S. Lai, “A biological swarmchasing algorithm for tracking the PV maximum power point,” IEEETrans. Energy Convers., vol. 25, no. 2, pp. 484–493, Jun. 2010.
[15] M. Miyatake, M. Veerachary, F. Toriumi, N. Fujii, and H. Ko, “Maximumpower point tracking of multiple photovoltaic arrays: A PSO approach,”IEEE Trans. Aerospace Electron. Syst., vol. 47, no. 1, pp. 367–380, Jan.2011.
[16] K. Ishaque, Z. Salam, M. Amjad, and S. Mekhilef, “An improved particleswarm optimization (PSO)—based MPPT for PV with reduced steady-state oscillation,” IEEE Trans. Power Electron., vol. 27, no. 8, pp. 3627–3638, Aug. 2012.
[17] Y.-H. Liu, S.-C. Huang, J.-W. Huang, and W.-C. Liang, “A particle swarmoptimization-based maximum power point tracking algorithm for PV sys-tems operating under partially shaded conditions,” IEEE Trans. EnergyConvers., vol. 27, no. 4, pp. 1027–1035, Dec. 2012.
[18] K. Ishaque and Z. Salam, “A deterministic particle swarm optimizationmaximum power point tracker for photovoltaic system under partial shad-ing condition,” IEEE Trans. Ind. Electron., vol. 60, no. 8, pp. 3195–3206,Aug. 2013.
[19] W. Xiao, N. Ozog, and W. Dunford, “Topology study of photovoltaicinterface for maximum power point tracking,” IEEE Trans. Ind. Electron.,vol. 54, no. 3, pp. 1696–1704, Jun. 2007.
[20] T. Suntio, J. Leppaaho, J. Huusari, and L. Nousiainen, “Issues on solar-generator interfacing with current-fed MPP-tracking converters,” IEEETrans. Power Electron., vol. 25, no. 9, pp. 2409–2419, Sep. 2010.
[21] J. Kennedy and R. Eberhart, “Particle swarm optimization,” in Proc. IEEEInt. Conf. Neural Netw., Nov./Dec. 1995, vol. 4, pp. 1942–1948.
[22] M. Masoum, H. Dehbonei, and E. Fuchs, “Theoretical and experimentalanalyses of photovoltaic systems with voltage and current-based maxi-mum power-point tracking,” IEEE Trans. Energy Convers., vol. 17, no. 4,pp. 514–522, Dec. 2002.
[23] N. Femia, G. Petrone, G. Spagnuolo, and M. Vitelli, “Optimization ofperturb and observe maximum power point tracking method,” IEEE Trans.Power Electron., vol. 20, no. 4, pp. 963–973, Jul. 2005.
[24] N. Femia, G. Petrone, G. Spagnuolo, and M. Vitelli, “A technique for im-proving p and o MPPT performances of double-stage grid-connected pho-tovoltaic systems,” IEEE Trans. Ind. Electron., vol. 56, no. 11, pp. 4473–4482, Nov. 2009.
[25] P. W. Lee, Y. S. Lee, D. K. W. Cheng, and X. C. Liu, “Steady-state analysisof an interleaved boost converter with coupled inductors,” IEEE Trans.Ind. Electron., vol. 47, no. 4, pp. 787–795, Aug. 2000.
[26] I. C. Trelea, “The particle swarm optimization algorithm: Convergenceanalysis and parameter selection,” Inf. Process. Lett., vol. 85, pp. 317–325, 2002.
K. L. Lian (M’07) received the B.A.Sc. (Hons.), M.A.Sc., and Ph.D. degreesin electrical engineering from the University of Toronto, Toronto, ON, Canada,in 2001, 2003, and 2007, respectively.
He was a Visiting Research Scientist with the Central Research Institute ofthe Electric Power Industry in Japan from October 2007 to January 2009. He iscurrently an Assistant Professor with the National Taiwan University of Scienceand Technology, Taipei City, Taiwan.
J. H. Jhang received the B.S. degree from the National Taiwan University ofScience and Technology, Taipei, Taiwan, in 2012, where he is currently workingtoward the M.S. degree.
I. S. Tian received the B.S. and M.S. degrees from the National Taipei Universityof Science and Technology, Taipei, Taiwan, in 2010 and 2012, respectively.
He is currently with MiTAC International Corp., Taipei, Taiwan.