Embed Size (px)
Citation preview
A method for the characterisation of ambient dust: geochemical analyses of directional sticky pad dust samples H. Datson1,2 & M. Fowler3 1DustScan Ltd, Charlbury, UK 2School of Process, Environmental and Materials Engineering, University of Leeds, UK 3School of Earth and Environmental Sciences, University of Portsmouth, UK
Abstract
DustScan is a method of sampling ambient dust. It was developed at the University of Leeds as a low-cost technique for directional nuisance dust monitoring. It is a passive system that uses self-adhesive ‘sticky pad’ collection slides mounted on cylinders to collect dust in flux at quarries, waste facilities, etc. After typically 1–2 weeks the sticky pads are sealed with a transparent film then scanned on a flatbed scanner linked to a computer. Directional dust levels are quantified using specific software as Absolute Area Coverage (presence of dust irrespective of colour, AAC%) and Effective Area Coverage (darkness of dust, EAC%). National Air Quality Standards (NAQS) require particular elements in air (e.g. Pb) to be assessed. Concentrations are usually determined using active monitoring equipment where dust, typically at a size convention (e.g. PM10), is drawn onto a filter. Such methods may be non-directional and require a power supply. This paper describes the development of methods to characterise DustScan samples using ICP-OES and ICPMS, including determination of indicative elemental mass concentrations in air. Dust is not readily removed from the sticky pads and its mass is low in relation to the substrate. Sample preparation is based on ‘total’ digestion of the dust in using HF and HNO3. Rigorous blank correction is important as some elements are at significant and variable concentrations in the sticky pads themselves. The analytical method has been refined to determine the mass of the mineral residue of the sample after ignition at 550°C. From this, plus duration of sampling and average wind speed, it is possible to estimate average concentrations of specific elements in ambient air by direction. Keywords: ambient and directional dust, dust monitoring and characterisation, sticky pad, landfill.
www.witpress.com, ISSN 1743-3541 (on-line) WIT Transactions on Ecology and the Environment, Vol 101, © 2007 WIT Press
Air Pollution XV 413
doi:10.2495/AIR070411
1 Introduction
‘Dust’ is defined in BS6069, Part 2, (British Standards Institution [1]) as particulate matter 1–75 µm in diameter, produced at mineral extraction sites mainly through the crushing and abrasion of minerals (ODPM [2]). Other properties such as shape, particle chemistry and physical behaviour in air can also be used to evaluate and characterise dust (Environment Agency [3]). Dust monitoring methods are described and discussed in detail elsewhere, such as in Monitoring Methods for Ambient Air: Technical Guidance Note M9 (Environment Agency [4]) or at www.goodquarry.com [5]. Dust sampled by different methods can be analysed using a variety of techniques. These range from tests that can be carried out on site, such as visual inspection, to laboratory analyses such as SEM-EDX and ICP-AES [3]. Dust characterisation through its analysis and speciation is a feature of Local Air Quality Monitoring for National Air Quality Standards (NAQS) (Defra [6]) and is an important aspect of air quality testing at sites such as landfills and waste transfer operations [3]. The physical and/or chemical properties of dust can be characterised through various analytical techniques. Different analytical methods are applied to dust characterisation according to the properties in question. Size fractions are determined gravimetrically with reference to CEN method EN 12341 [3]. Mineral fibres such as asbestiforms are assessed in accordance with health and safety legislation and guidance (HSE [7]). Specific chemical elements in dust (e.g. Pb) are monitored as part of NAQS (DETR [8]). Increasing attention is being paid to concentrations of other elements (e.g. Cr, Ni, Cu, As and Cd) [3]. There are no standard methods for the chemical characterisation of dust although a draft CEN method for analysis of Cd, Ni, As and Pb in PM10 is being validated [3]. The cost, practicality and availability of equipment for dust sampling, and methods available for its characterisation are important considerations in air quality monitoring, and no standard method yet exists. In the absence of a standard method for the chemical characterisation of dust in flux, a range of analytical methods to characterise directional sticky pad samples has been investigated including optical microscopy, SEM-EDX and ICP-OES (Datson and Fowler [9]). This paper documents the development of a new approach to chemical characterisation of ambient dust through ICP-OES/MS analyses of sticky pad directional dust samples, and outlines potential applications by briefly reviewing several case studies.
2 Dust sampling methodology
2.1 Directional dust sampling
Ambient dust was sampled with DustScan directional gauges, which use the ‘sticky pad’ method for dust monitoring. Sticky pad dust monitoring was popularised in the UK by Beaman and Kingsbury [10, 11]. The method is widely
www.witpress.com, ISSN 1743-3541 (on-line) WIT Transactions on Ecology and the Environment, Vol 101, © 2007 WIT Press
414 Air Pollution XV
used as a method for assessing potential nuisance caused by dust at quarries, landfill sites, opencast coal workings etc. Dust in settlement and in flux adheres to the adhesive surface of the sticky pad for subsequent quantification. Dust coverage is assessed as soiling effect either by using a hand-held reflectometer [3] or computer-based scanning (Datson and Birch [12]). The mass or particle size distribution of dust is not generally determined, although mass deposition can be estimated where particle size as cross-sectional area, density and reflectivity are known [11]. DustScan was developed at the University of Leeds for monitoring nuisance dust at opencast coal sites and quarries (Farnfield and Birch [13]). Further developments to the system have been carried out since 2001, firstly by The Geoffrey Walton Practice, Charlbury, Oxford, UK, and from 2004 by DustScan Ltd, Charlbury, Oxford, UK (Hull and Datson [14]). DustScan is a passive dust monitoring system to monitor fugitive dust 360° around a replaceable sampling head. It uses a transparent, permanent adhesive, ‘sticky pad’ on a 70 mm diameter cylindrical monitoring head. The dust monitoring head is mounted on a stand and fixed approximately 2 m from the ground. The sticky pads are manufactured by specialist suppliers from stock material and comprise three principal layers: a transparent PVC film, a permanent, cross-linked polymer acrylic adhesive and a silicone-coated paper liner (Avery Dennison [15]). The sticky pads are 297 × 219 mm and the paper liner is pre-scored to form a 217 × 178 mm sampling area. 6 mm diameter holes are pre-punched into the sticky pads to enable precise fitting to pegs on the cylindrical monitoring head. The paper liner is removed from the sampling area at the start of a monitoring period and the monitoring head samples continuously whilst installed in the field. Dust in flux impacts on the exposed section and is held on the adhesive surface. At the end of a sampling period, the monitoring head is removed and placed in a protective carrying flask and a replacement head fitted. Used sampling heads are normally sent to DustScan Ltd for processing. The remainder of the paper liner is removed from the edges of the sticky pad when the sample is sealed to enable encapsulation and to provide an unexposed ‘reference area’ for computer analysis [12]. The sticky pads are sealed with a standard A4 transparent PET office laser printer film. A typical field installation is shown in Figure 1. Measurement of dust coverage on the sticky pads uses a computer-based scanning system and specific software. The pattern of dusting on the sticky pad indicates the direction and scale of potential dust nuisance by direction. Measurements are taken over 5° intervals around the cylinder and reported at 15° intervals by comparing the colour of the exposed area of the sticky pad with the unexposed, blank, ‘reference area’. The results are normally reported in two nuisance dust measurements:
• Absolute Area Coverage (AAC%) – the presence of dust irrespective of colour;
• Effective Area Coverage (EAC%) – the darkness or potential soiling of dust.
www.witpress.com, ISSN 1743-3541 (on-line) WIT Transactions on Ecology and the Environment, Vol 101, © 2007 WIT Press
Air Pollution XV 415
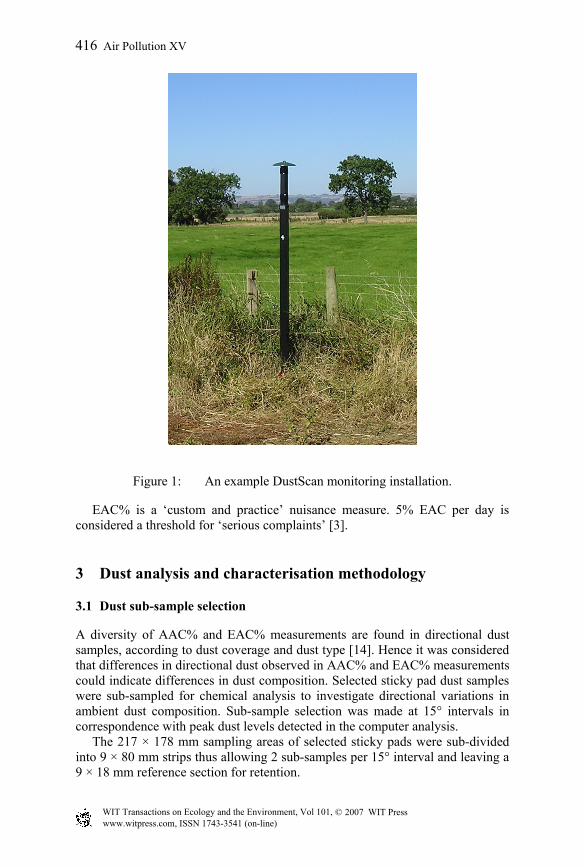
Figure 1: An example DustScan monitoring installation.
EAC% is a ‘custom and practice’ nuisance measure. 5% EAC per day is considered a threshold for ‘serious complaints’ [3].
3 Dust analysis and characterisation methodology
3.1 Dust sub-sample selection
A diversity of AAC% and EAC% measurements are found in directional dust samples, according to dust coverage and dust type [14]. Hence it was considered that differences in directional dust observed in AAC% and EAC% measurements could indicate differences in dust composition. Selected sticky pad dust samples were sub-sampled for chemical analysis to investigate directional variations in ambient dust composition. Sub-sample selection was made at 15° intervals in correspondence with peak dust levels detected in the computer analysis. The 217 × 178 mm sampling areas of selected sticky pads were sub-divided into 9 × 80 mm strips thus allowing 2 sub-samples per 15° interval and leaving a 9 × 18 mm reference section for retention.
www.witpress.com, ISSN 1743-3541 (on-line) WIT Transactions on Ecology and the Environment, Vol 101, © 2007 WIT Press
416 Air Pollution XV
3.2 Dust sub-sample preparation
Dust is not readily removed from sealed sticky pads and the cross-linked polymer acrylic adhesive is not soluble in common organic solvents (Datson [16]). Alternative, commercially-available adhesives are not necessarily transparent or UV-stable. UV-stability is necessary to prevent discolouration by sunlight which can affect some sticky pads and hence the potential soiling measurement of the sample (Merefield [17]). Thus the dust was not removed from the sticky pads and the samples were prepared for ICP-OES/MS analysis (at the Universities of Gloucestershire and Portsmouth respectively) by ‘total’ digestion using HF and HNO3 following an adaptation of standard procedures (Chao and Sanzolone [18]). Each 9 × 80 mm sub-sample was placed in a clean, labelled, 25 cm3 PTFE beaker to which 3 cm3 concentrated analytical grade HNO3 and 3 cm3 concentrated analytical grade HF were added. Each sample was left to stand overnight then held at ≈100°C until incipient dryness. A further 3 cm3 of concentrated HNO3 were added carefully to collect any remaining HF, and evaporated to dryness. To take up the resulting salts, 3 cm3 10% HNO3 were added to each beaker which was agitated gently and again left overnight. The resulting solutions were carefully decanted into clean, labelled, 15 cm3 centrifuge tubes. A final 2 cm3 10% HNO3 were added to the beakers and left to stand for approximately 2 hours, in order to dissolve any recalcitrant salts. These solutions were decanted into the appropriate centrifuge tubes, and stored ready for analysis by ICP-OES at a final volume of 5 cm3. For ICPMS analysis the solutions were made up to 25 cm3 and stored prior to analysis.
3.3 Dust sub-sample analysis
At the University of Gloucestershire, samples were analysed by ICP-OES using a Perkin-Elmer Optima 4300 dual view instrument. Calibrations were constructed using synthetic multi-element solutions, and analytical wavelengths were those suggested by the USEPA. Routine reproducibility tests confirm instrumental precision to be well within +/- 5%. At the University of Portsmouth, samples were analysed by ICPMS using an Agilent 7500cs instrument equipped with an octopole reaction cell. Calibrations were again constructed using synthetic multielement solutions, and similar levels of instrumental precision are routinely attained. The procedural detection limit of most elements with the method used for the analyses is estimated to be ca. 0.01 ppm in solution although the ICPMS equipment is considerably more sensitive than this, and its full capabilities are currently being explored. Samples at or below this limit are reported as ‘bdl’. For sticky pads with typical dust loading, the detection limit equates to approximately 10 ppm in the dust, because of the dilution factor introduced during sample dissolution.
www.witpress.com, ISSN 1743-3541 (on-line) WIT Transactions on Ecology and the Environment, Vol 101, © 2007 WIT Press
Air Pollution XV 417
3.4 Sample blank-correction
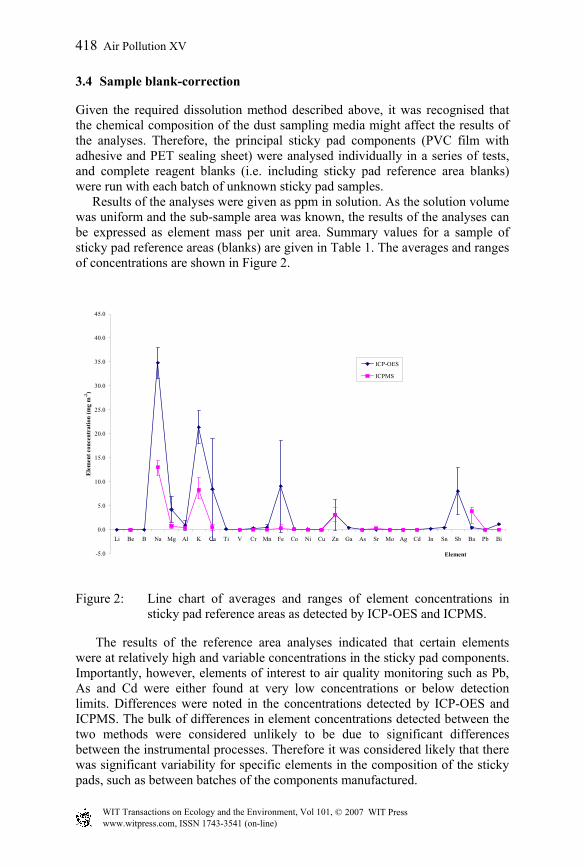
Given the required dissolution method described above, it was recognised that the chemical composition of the dust sampling media might affect the results of the analyses. Therefore, the principal sticky pad components (PVC film with adhesive and PET sealing sheet) were analysed individually in a series of tests, and complete reagent blanks (i.e. including sticky pad reference area blanks) were run with each batch of unknown sticky pad samples. Results of the analyses were given as ppm in solution. As the solution volume was uniform and the sub-sample area was known, the results of the analyses can be expressed as element mass per unit area. Summary values for a sample of sticky pad reference areas (blanks) are given in Table 1. The averages and ranges of concentrations are shown in Figure 2.
-5.0
0.0
5.0
10.0
15.0
20.0
25.0
30.0
35.0
40.0
45.0
Li Be B Na Mg Al K Ca Ti V Cr Mn Fe Co Ni Cu Zn Ga As Sr Mo Ag Cd In Sn Sb Ba Pb Bi
Element
Elem
ent c
once
ntra
tion
(mg
m-2
)
ICP-OES
ICPMS
Figure 2: Line chart of averages and ranges of element concentrations in sticky pad reference areas as detected by ICP-OES and ICPMS.
The results of the reference area analyses indicated that certain elements were at relatively high and variable concentrations in the sticky pad components. Importantly, however, elements of interest to air quality monitoring such as Pb, As and Cd were either found at very low concentrations or below detection limits. Differences were noted in the concentrations detected by ICP-OES and ICPMS. The bulk of differences in element concentrations detected between the two methods were considered unlikely to be due to significant differences between the instrumental processes. Therefore it was considered likely that there was significant variability for specific elements in the composition of the sticky pads, such as between batches of the components manufactured.
www.witpress.com, ISSN 1743-3541 (on-line) WIT Transactions on Ecology and the Environment, Vol 101, © 2007 WIT Press
418 Air Pollution XV
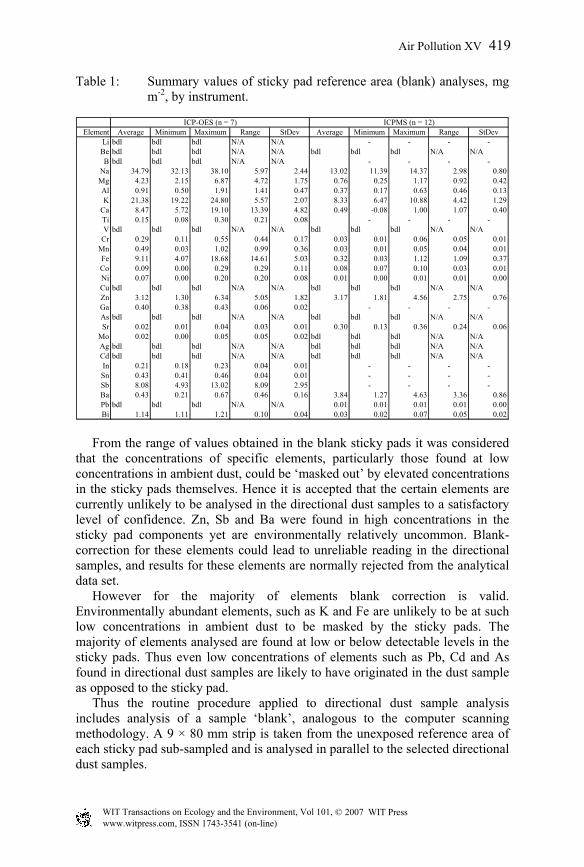
Table 1: Summary values of sticky pad reference area (blank) analyses, mg m-2, by instrument.
Element Average Minimum Maximum Range StDev Average Minimum Maximum Range StDevLi bdl bdl bdl N/A N/A - - - -Be bdl bdl bdl N/A N/A bdl bdl bdl N/A N/AB bdl bdl bdl N/A N/A - - - -
Na 34.79 32.13 38.10 5.97 2.44 13.02 11.39 14.37 2.98 0.80Mg 4.23 2.15 6.87 4.72 1.75 0.76 0.25 1.17 0.92 0.42Al 0.91 0.50 1.91 1.41 0.47 0.37 0.17 0.63 0.46 0.13K 21.38 19.22 24.80 5.57 2.07 8.33 6.47 10.88 4.42 1.29
Ca 8.47 5.72 19.10 13.39 4.82 0.49 -0.08 1.00 1.07 0.40Ti 0.15 0.08 0.30 0.21 0.08 - - - -V bdl bdl bdl N/A N/A bdl bdl bdl N/A N/A
Cr 0.29 0.11 0.55 0.44 0.17 0.03 0.01 0.06 0.05 0.01Mn 0.49 0.03 1.02 0.99 0.36 0.03 0.01 0.05 0.04 0.01Fe 9.11 4.07 18.68 14.61 5.03 0.32 0.03 1.12 1.09 0.37Co 0.09 0.00 0.29 0.29 0.11 0.08 0.07 0.10 0.03 0.01Ni 0.07 0.00 0.20 0.20 0.08 0.01 0.00 0.01 0.01 0.00Cu bdl bdl bdl N/A N/A bdl bdl bdl N/A N/AZn 3.12 1.30 6.34 5.05 1.82 3.17 1.81 4.56 2.75 0.76Ga 0.40 0.38 0.43 0.06 0.02 - - - -As bdl bdl bdl N/A N/A bdl bdl bdl N/A N/ASr 0.02 0.01 0.04 0.03 0.01 0.30 0.13 0.36 0.24 0.06
Mo 0.02 0.00 0.05 0.05 0.02 bdl bdl bdl N/A N/AAg bdl bdl bdl N/A N/A bdl bdl bdl N/A N/ACd bdl bdl bdl N/A N/A bdl bdl bdl N/A N/AIn 0.21 0.18 0.23 0.04 0.01 - - - -Sn 0.43 0.41 0.46 0.04 0.01 - - - -Sb 8.08 4.93 13.02 8.09 2.95 - - - -Ba 0.43 0.21 0.67 0.46 0.16 3.84 1.27 4.63 3.36 0.86Pb bdl bdl bdl N/A N/A 0.01 0.01 0.01 0.01 0.00Bi 1.14 1.11 1.21 0.10 0.04 0.03 0.02 0.07 0.05 0.02
ICPMS (n = 12)ICP-OES (n = 7)
From the range of values obtained in the blank sticky pads it was considered that the concentrations of specific elements, particularly those found at low concentrations in ambient dust, could be ‘masked out’ by elevated concentrations in the sticky pads themselves. Hence it is accepted that the certain elements are currently unlikely to be analysed in the directional dust samples to a satisfactory level of confidence. Zn, Sb and Ba were found in high concentrations in the sticky pad components yet are environmentally relatively uncommon. Blank-correction for these elements could lead to unreliable reading in the directional samples, and results for these elements are normally rejected from the analytical data set. However for the majority of elements blank correction is valid. Environmentally abundant elements, such as K and Fe are unlikely to be at such low concentrations in ambient dust to be masked by the sticky pads. The majority of elements analysed are found at low or below detectable levels in the sticky pads. Thus even low concentrations of elements such as Pb, Cd and As found in directional dust samples are likely to have originated in the dust sample as opposed to the sticky pad. Thus the routine procedure applied to directional dust sample analysis includes analysis of a sample ‘blank’, analogous to the computer scanning methodology. A 9 × 80 mm strip is taken from the unexposed reference area of each sticky pad sub-sampled and is analysed in parallel to the selected directional dust samples.
www.witpress.com, ISSN 1743-3541 (on-line) WIT Transactions on Ecology and the Environment, Vol 101, © 2007 WIT Press
Air Pollution XV 419
3.5 Validation of the analytical method
As noted above, instrument precision was routinely determined to be better than +/- 5% with both instruments for all elements. To determine the accuracy of the whole procedure, replicate samples of certified reference materials (CRM) were run with the batches of sticky pad sub-samples. In the absence of appropriate reference dusts, rock and soil powder CRM were used. In order to mimic sticky pad dissolution as closely as possible, several CRM-dosed sticky pad ‘samples’ were made as follows. A standard, stock, DustScan sticky pad was laid flat on a bench and the paper liner removed from the sampling area. NIST SRM2710 Montana soil (National Institute of Standards and Technology [19]) and USGS reference rock SCo-1 were scattered by hand onto the sampling area from approximately 15 cm through a 75 µm screen. The sticky pad was dusted until powder did not adhere further. The sticky pads were held perpendicular to the bench and tapped lightly to distribute any powder not adhering to the sticky pad and to remove excess. The sticky pads were sealed in the same manner as normal DustScan samples with a PET film and sub-sampled for analysis in the normal way.
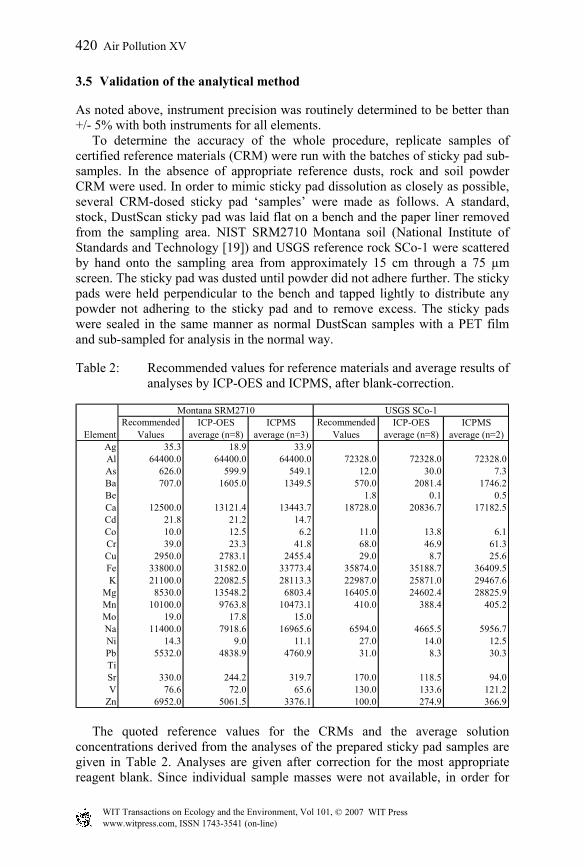
Table 2: Recommended values for reference materials and average results of analyses by ICP-OES and ICPMS, after blank-correction.
ICP-OES ICPMS ICP-OES ICPMSElement average (n=8) average (n=3) average (n=8) average (n=2)
Ag 35.3 18.9 33.9Al 64400.0 64400.0 64400.0 72328.0 72328.0 72328.0As 626.0 599.9 549.1 12.0 30.0 7.3Ba 707.0 1605.0 1349.5 570.0 2081.4 1746.2Be 1.8 0.1 0.5Ca 12500.0 13121.4 13443.7 18728.0 20836.7 17182.5Cd 21.8 21.2 14.7Co 10.0 12.5 6.2 11.0 13.8 6.1Cr 39.0 23.3 41.8 68.0 46.9 61.3Cu 2950.0 2783.1 2455.4 29.0 8.7 25.6Fe 33800.0 31582.0 33773.4 35874.0 35188.7 36409.5K 21100.0 22082.5 28113.3 22987.0 25871.0 29467.6
Mg 8530.0 13548.2 6803.4 16405.0 24602.4 28825.9Mn 10100.0 9763.8 10473.1 410.0 388.4 405.2Mo 19.0 17.8 15.0Na 11400.0 7918.6 16965.6 6594.0 4665.5 5956.7Ni 14.3 9.0 11.1 27.0 14.0 12.5Pb 5532.0 4838.9 4760.9 31.0 8.3 30.3TiSr 330.0 244.2 319.7 170.0 118.5 94.0V 76.6 72.0 65.6 130.0 133.6 121.2
Zn 6952.0 5061.5 3376.1 100.0 274.9 366.9
Montana SRM2710 USGS SCo-1Recommended
ValuesRecommended
Values
The quoted reference values for the CRMs and the average solution concentrations derived from the analyses of the prepared sticky pad samples are given in Table 2. Analyses are given after correction for the most appropriate reagent blank. Since individual sample masses were not available, in order for
www.witpress.com, ISSN 1743-3541 (on-line) WIT Transactions on Ecology and the Environment, Vol 101, © 2007 WIT Press
420 Air Pollution XV
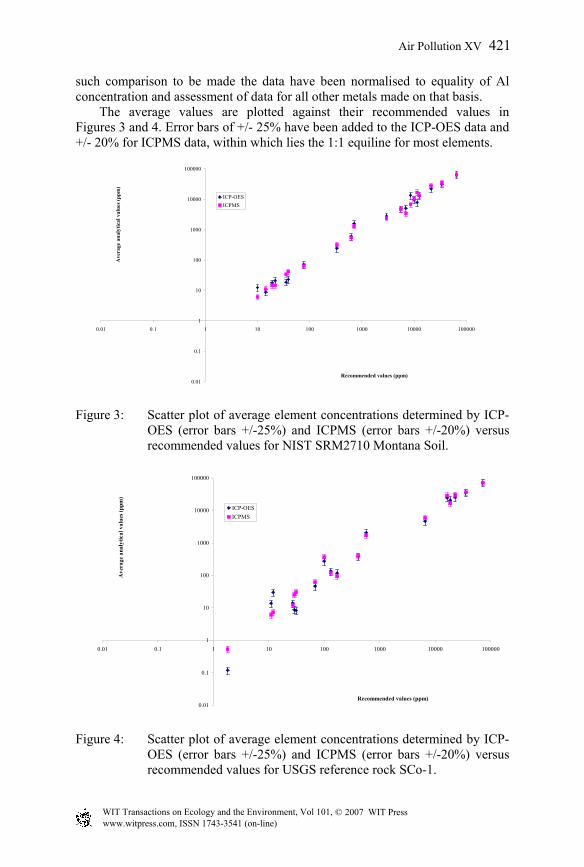
such comparison to be made the data have been normalised to equality of Al concentration and assessment of data for all other metals made on that basis.
The average values are plotted against their recommended values in Figures 3 and 4. Error bars of +/- 25% have been added to the ICP-OES data and +/- 20% for ICPMS data, within which lies the 1:1 equiline for most elements.
0.01
0.1
1
10
100
1000
10000
100000
0.01 0.1 1 10 100 1000 10000 100000
Recommended values (ppm)
Ave
rage
ana
lytic
al v
alue
s (pp
m)
ICP-OESICPMS
Figure 3: Scatter plot of average element concentrations determined by ICP-OES (error bars +/-25%) and ICPMS (error bars +/-20%) versus recommended values for NIST SRM2710 Montana Soil.
0.01
0.1
1
10
100
1000
10000
100000
0.01 0.1 1 10 100 1000 10000 100000
Recommended values (ppm)
Ave
rage
ana
lytic
al v
alue
s (pp
m)
ICP-OESICPMS
Figure 4: Scatter plot of average element concentrations determined by ICP-OES (error bars +/-25%) and ICPMS (error bars +/-20%) versus recommended values for USGS reference rock SCo-1.
www.witpress.com, ISSN 1743-3541 (on-line) WIT Transactions on Ecology and the Environment, Vol 101, © 2007 WIT Press
Air Pollution XV 421
3.6 Estimation of dust ‘mineral mass’
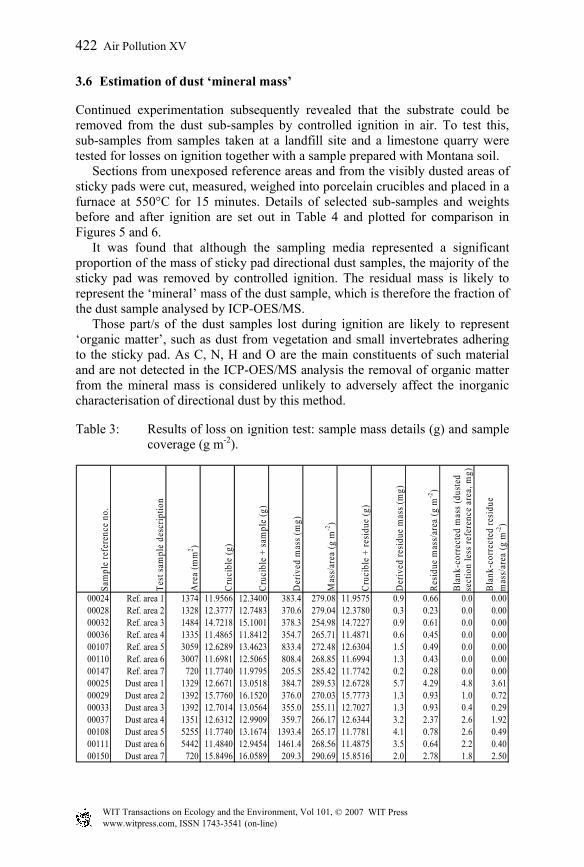
Continued experimentation subsequently revealed that the substrate could be removed from the dust sub-samples by controlled ignition in air. To test this, sub-samples from samples taken at a landfill site and a limestone quarry were tested for losses on ignition together with a sample prepared with Montana soil. Sections from unexposed reference areas and from the visibly dusted areas of sticky pads were cut, measured, weighed into porcelain crucibles and placed in a furnace at 550°C for 15 minutes. Details of selected sub-samples and weights before and after ignition are set out in Table 4 and plotted for comparison in Figures 5 and 6. It was found that although the sampling media represented a significant proportion of the mass of sticky pad directional dust samples, the majority of the sticky pad was removed by controlled ignition. The residual mass is likely to represent the ‘mineral’ mass of the dust sample, which is therefore the fraction of the dust sample analysed by ICP-OES/MS. Those part/s of the dust samples lost during ignition are likely to represent ‘organic matter’, such as dust from vegetation and small invertebrates adhering to the sticky pad. As C, N, H and O are the main constituents of such material and are not detected in the ICP-OES/MS analysis the removal of organic matter from the mineral mass is considered unlikely to adversely affect the inorganic characterisation of directional dust by this method.
Table 3: Results of loss on ignition test: sample mass details (g) and sample coverage (g m-2).
Sam
ple
refe
renc
e no
.
Test
sam
ple
desc
riptio
n
Are
a (m
m2 )
Cru
cibl
e (g
)
Cru
cibl
e +
sam
ple
(g)
Der
ived
mas
s (m
g)
Mas
s/ar
ea (g
m-2
)
Cru
cibl
e +
resi
due
(g)
Der
ived
resi
due
mas
s (m
g)
Res
idue
mas
s/ar
ea (g
m-2
)
Bla
nk-c
orre
cted
mas
s (du
sted
se
ctio
n le
ss re
fere
nce
area
, mg)
Bla
nk-c
orre
cted
resi
due
mas
s/ar
ea (g
m-2
)
00024 Ref. area 1 1374 11.9566 12.3400 383.4 279.08 11.9575 0.9 0.66 0.0 0.0000028 Ref. area 2 1328 12.3777 12.7483 370.6 279.04 12.3780 0.3 0.23 0.0 0.0000032 Ref. area 3 1484 14.7218 15.1001 378.3 254.98 14.7227 0.9 0.61 0.0 0.0000036 Ref. area 4 1335 11.4865 11.8412 354.7 265.71 11.4871 0.6 0.45 0.0 0.0000107 Ref. area 5 3059 12.6289 13.4623 833.4 272.48 12.6304 1.5 0.49 0.0 0.0000110 Ref. area 6 3007 11.6981 12.5065 808.4 268.85 11.6994 1.3 0.43 0.0 0.0000147 Ref. area 7 720 11.7740 11.9795 205.5 285.42 11.7742 0.2 0.28 0.0 0.0000025 Dust area 1 1329 12.6671 13.0518 384.7 289.53 12.6728 5.7 4.29 4.8 3.6100029 Dust area 2 1392 15.7760 16.1520 376.0 270.03 15.7773 1.3 0.93 1.0 0.7200033 Dust area 3 1392 12.7014 13.0564 355.0 255.11 12.7027 1.3 0.93 0.4 0.2900037 Dust area 4 1351 12.6312 12.9909 359.7 266.17 12.6344 3.2 2.37 2.6 1.9200108 Dust area 5 5255 11.7740 13.1674 1393.4 265.17 11.7781 4.1 0.78 2.6 0.4900111 Dust area 6 5442 11.4840 12.9454 1461.4 268.56 11.4875 3.5 0.64 2.2 0.4000150 Dust area 7 720 15.8496 16.0589 209.3 290.69 15.8516 2.0 2.78 1.8 2.50
www.witpress.com, ISSN 1743-3541 (on-line) WIT Transactions on Ecology and the Environment, Vol 101, © 2007 WIT Press
422 Air Pollution XV
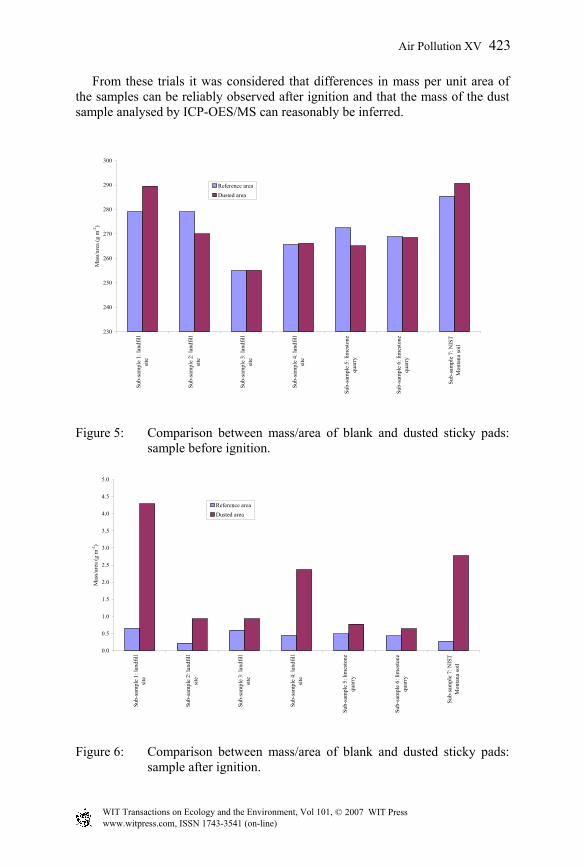
From these trials it was considered that differences in mass per unit area of the samples can be reliably observed after ignition and that the mass of the dust sample analysed by ICP-OES/MS can reasonably be inferred.
230
240
250
260
270
280
290
300
Sub-
sam
ple
1: la
ndfil
lsi
te
Sub-
sam
ple
2: la
ndfil
lsi
te
Sub-
sam
ple
3: la
ndfil
lsi
te
Sub-
sam
ple
4: la
ndfil
lsi
te
Sub-
sam
ple
5: li
mes
tone
quar
ry
Sub-
sam
ple
6: li
mes
tone
quar
ry
Sub-
sam
ple
7: N
IST
Mon
tana
soil
Mas
s/ar
ea (g
m-2
)
Reference areaDusted area
Figure 5: Comparison between mass/area of blank and dusted sticky pads: sample before ignition.
0.0
0.5
1.0
1.5
2.0
2.5
3.0
3.5
4.0
4.5
5.0
Sub-
sam
ple
1: la
ndfil
lsi
te
Sub-
sam
ple
2: la
ndfil
lsi
te
Sub-
sam
ple
3: la
ndfil
lsi
te
Sub-
sam
ple
4: la
ndfil
lsi
te
Sub-
sam
ple
5: li
mes
tone
quar
ry
Sub-
sam
ple
6: li
mes
tone
quar
ry
Sub-
sam
ple
7: N
IST
Mon
tana
soil
Mas
s/ar
ea (g
m-2
)
Reference areaDusted area
Figure 6: Comparison between mass/area of blank and dusted sticky pads: sample after ignition.
www.witpress.com, ISSN 1743-3541 (on-line) WIT Transactions on Ecology and the Environment, Vol 101, © 2007 WIT Press
Air Pollution XV 423
3.7 Estimation of element concentrations in directional dust samples
As it was found that sticky pads were largely eliminated by the ignition procedure, experimentation with sample size showed that 9 × 80 mm strips of sticky pad generally yield sufficient dust mineral residue to obtain a readily quantified mineral mass. As a 15° sub-section of sticky pad is 9 mm wide, 2 no. 9 × 80 mm strips and one 9 × 18 mm section are available for each 15° directional dust sample. ICP-OES/MS analysis may be carried out using one of the 9 × 80 mm strips. The parallel 9 × 80 mm strip, from the same 15° sampling direction, can be used to obtain the dust mineral mass. Assuming the directional samples are vertically homogeneous at this scale it is reasonable to consider that the mass per unit area of the ignited strip equates that of the strip analysed by ICP-OES/MS. Therefore element concentrations in the directional dust samples can be estimated from the mineral mass and the element concentrations in solution. Many directional dust samplers are installed at sites where weather data are also recorded. An estimate of the directional ‘wind run’ can be determined as the perpendicular component of wind velocity in relation to the directional sampling surface with time, expressed as a linear value (m). Thus it is possible to infer the dust mass concentrations and element concentrations in ambient air during the sampling period. As the area of the directional sub-samples is known, both the dust mass concentration and the element mass concentrations can be determined. Whilst it is accepted that the values derived are time-integrated and approximate, it is considered that they may be of value as relatively low-cost, flexible and useful guides to aid local air quality assessment and monitoring.
4 Conclusion
The methodology described above is still being developed, but has reached the stage where reliable chemical information may be gathered from dust samples which have been collected on a directional basis. This opens the way to construction of dynamic dust flux models from sites at which sufficient monitoring takes place. Given the increasing stringency of environmental legislation, and the desire for sustainable use of resources, monitoring of this type is likely to become more important. Latest modifications suggest that an indication of average ambient air concentrations is possible, also on a directional basis, which could fulfil present and future regulatory requirements. In order to illustrate some of the potential applications of the method, a few brief case-studies are presented below.
4.1 Case study 1: limestone quarry
Residences near a limestone quarry in North Wales were affected by nuisance dust that was believed to have originated at the quarry. DustScan directional gauges were installed on the perimeter of the quarry and near the homes of the
www.witpress.com, ISSN 1743-3541 (on-line) WIT Transactions on Ecology and the Environment, Vol 101, © 2007 WIT Press
424 Air Pollution XV
residents. AAC% and EAC% data from the gauges at the residences showed that dust propagated towards the quarry as well as away from it. Sub-samples were taken from sticky pad samples taken at the quarry boundary and at the residences. The sub-samples at the houses were taken from the direction of the quarry and from the opposite direction. The sub-samples were analysed using ICP-OES. Dust at the quarry boundary had higher levels of Ca than from either direction at the residences. Dust from the direction of the quarry at the houses had more Ca than from the opposite direction. Concentrations of Fe were higher from the opposite direction to the quarry and concentrations of Na were greater from either direction at the houses than at the quarry. However concentrations of most elements were more similar between the samples from either direction at the residences than between the quarry and the residences. Therefore it was concluded that not all the dust at the residences had originated at the quarry, and that there was a significant background dust source that was contributing to dust at the residences.
4.2 Case study 2: landfill site ‘A’
DustScan directional dust gauges were installed at a landfill site in Cambridgeshire. The site operator wanted to know if remediation works on a cell at the site might lead to emissions of identifiable dust from the cell. Directional sticky pad dust samples were sub-sampled from a range of locations on the site perimeter. The sub-samples were analysed for a range of elements using ICP-OES. The highest concentrations of Al, Mn, Cu and Pb were found in samples nearest downwind of the remediation works. The lowest concentrations of Pb were found upwind of the remediation. The results of the analyses were compared using enrichment factors, which is an established method for analysis and comparison of aerosols (Rahn [20]). The EF of an element is calculated as the relative concentration of an element in a sample proportionate to its relative concentration in the earth’s crust. EFs are determined in relation to an abundant element and for crustally-derived aerosols, this is typically Al, hence the EF for Al in all samples is 1.00. Although the highest concentrations of Al were found nearest the remediation works, EFs for Mn, Cu and Pb were also higher at this location. From the results of the analyses and comparison of EFs it was concluded that dust nearest the remediation works was different to dust at other locations on the site and from elevated levels of, in particular Cu and Pb, was likely to have originated from the landfill cell.
4.3 Case study 3: Dolerite quarry
DustScan gauges were installed at a Dolerite quarry in Cornwall. Rocks in the region of the quarry are known to contain variable and high concentrations of
www.witpress.com, ISSN 1743-3541 (on-line) WIT Transactions on Ecology and the Environment, Vol 101, © 2007 WIT Press
Air Pollution XV 425
As. Consequently it was considered that dust propagating from the quarry could contain significant concentrations of As. The directional dust gauges were installed within the quarry workings and on nearby farmland. Directional AAC% and EAC% measurements indicated that some of the dust sampled at the quarry could have propagated from the farmland as well as the quarry. Directional dust samples were selected for analysis according to dust direction and monitoring location. Loose soil samples (grab samples) were also collected from the ground surface in the vicinity of 3 of the directional gauges. The soil samples were sieved to <75µm to obtain the dust fractions. To test the accessibility of As in the directional samples and the soil dust samples the analytical method was modified. Sequential extractions were carried out using ultrapure H2O, 0.5M HNO3 and ‘total’ digestion in HF as normal. Only directional samples with sufficient dust coverage to enable the PET covering film to be removed from the sticky pad were selected for analysis. Blank-correction was carried out for the sticky pads at each extraction stage. In the ultrapure H2O extraction As was below detection limits in the sticky pad samples and low concentrations were found in the soil dusts. As was detected in both sample sets in the 0.5M HNO3 extraction. The highest concentrations of As were found in both sample sets in the HF extraction. Higher levels of As were found in the directional and soil dust samples from the quarry than from the farmland. However a greater proportion of the As from the farmland was extracted in the ultrapure H2O and 0.5M HNO3 extractions. It was considered that these extractions would be likely to comprise bioaccessible As. A ‘bioaccessibility ratio’ of (ultrapure H2O extraction plus 0.5M HNO3 extraction) divided by (ultrapure H2O extraction plus 0.5M HNO3 extraction plus HF extraction) was derived which showed that As was more bioaccessible in the dusts from the farmland than from the quarry.
4.4 Case study 4: landfill site ‘B’
DustScan directional dust gauges were installed on a landfill site in Gloucestershire. The site disposes of air pollution control residue (APC). Sub-samples of the directional dust samples were taken both upwind and downwind of the site to evaluate possible changes in air quality across the site. Sub-samples of the sticky pad samples were analysed by both ICP-OES and ICPMS. It was found that dust coverage on the sticky pads was of significance in reliable analysis of the directional dust samples. Where dust coverage was low, generally as indicated by low AAC% levels, many elements were masked out by the sticky pad blank. Consequently it was considered that where AAC was less than 50% there was insufficient dust for reliable ICP-OES/MS analysis. The mineral mass of many of the directional samples was determined by controlled combustion of parallel 15° sub-samples. Weather data were supplied by the site operator, as were analyses of the APC residues disposed of at the site during the intervals when directional samples were analysed. Local soils and clays used for cell engineering were sampled and analysed by ICPMS. The APC
www.witpress.com, ISSN 1743-3541 (on-line) WIT Transactions on Ecology and the Environment, Vol 101, © 2007 WIT Press
426 Air Pollution XV
analyses and the soil and clay analyses were considered to be local reference materials. Observations were made from the directional sample analyses regarding possible changes in dust composition (and therefore air quality) across the site and in relation to other dust-producing operations in the vicinity. Concentrations of dust mineral mass and inferred directional concentrations of elements in the dust were calculated from the results of the analyses and the weather data. The analyses of the directional samples were compared with the analyses of the APC residues and local soils and clays. It was considered that the local soils and clays and APC residues could comprise the end members of dust sampled at the site. Ratios were calculated between pairs of elements selected to maximise the differences between the local soils and the APC residue. Data for all directional dust samples with sufficient dust coverage defined a binary mixing line between the end members, from which the APC component of any sample could be estimated. This approach could be applied to a range of settings where assessment of dust propagation from a particular source or activity is desired.
Acknowledgements
The authors would like to acknowledge the financial support of the Royal Commission for the Exhibition of 1851 and Grundon Waste Management Limited. Professor Geoffrey Walton is thanked for his continued support and encouragement of this work.
References
[1] British Standards Institution, BS 6069 (Part Two), Glossary of Terms. BSI, London, (1987).
[2] Office of the Deputy Prime Minister, Minerals policy statement 2 – Controlling and mitigating the environmental effects of mineral extraction in England; Annex 1. Dust, ODPM, London, 2003.
[3] Environment Agency, Monitoring of Particulate Matter in Ambient Air around Waste Facilities: Technical Guidance Document (Monitoring) M17, Environment Agency, Bristol, 2004.
[4] Environment Agency, Monitoring Methods for Ambient Air: Technical Guidance Note M9, Environment Agency, Bristol, 2000.
[5] Department of Mining and Mineral Engineering, University of Leeds, Air Pollution. In: Minimising the environmental effects of quarries and surface mineral workings. http://www.goodquarry.com, 2004.
[6] Department for Environment, Food and Rural Affairs, Local Air Quality Management: Technical Guidance. LAQM. TG (03), DEFRA, London, 2003.
[7] Health and Safety Executive, Guidance Note EH10: Asbestos: Exposure limits and measurement of airborne concentrations, HMSO, Norwich, 2001.
www.witpress.com, ISSN 1743-3541 (on-line) WIT Transactions on Ecology and the Environment, Vol 101, © 2007 WIT Press
Air Pollution XV 427
[8] Department of the Environment, Transport and the Regions, The Air Quality Strategy for England, Scotland, Wales and Northern Ireland: HMSO, London, 2000.
[9] Datson, H. and Fowler, M., Developments in directional dust monitoring: low-cost sampling for multiple analyses. Environmental Mineralogy, Geochemistry and Human Health, Mineralogical Society Winter Meeting, Bath, UK, 6 – 7 January 2005. Conference Convenor: Valsami-Jones, E., Mineralogical Society, London.
[10] Beaman, A. L. and Kingsbury, R. W. S. M., Assessment of Nuisance from Deposited Particles Using a Simple and Inexpensive Measuring System. Clean Air 11 (2), pp. 77 – 81, 1981.
[11] Beaman, A. L. and Kingsbury, R. W. S. M., Recent Developments in the Method of Using Sticky Pads for the Measurement of Particulate Nuisance. Clean Air 14 (2), pp. 74 – 81, 1984.
[12] Datson, H. and Birch, W. J., The development of a novel method for directional dust monitoring. Environmental Monitoring and Assessment DOI 10.1007/s10661-006-9227-4, December 2006.
[13] Farnfield, R. A. and Birch, W. J., Environmental Dust Monitoring Using Computer Scanned Images Obtained From Sticky Pad Poly-directional Dust Gauges. Clean Air 27, pp. 73 –76, 1997.
[14] Hull, G. and Datson, H., Low-cost directional monitoring of nuisance dust around mineral workings. Report of a Mineral Industry Sustainable Technology Project for MIRO, Leeds, 2004.
[15] Avery Dennison (2003). Fasson Product Summary. Avery Dennison Roll Materials Europe, www.europe.fasson.com.
[16] Datson, H., Field and Laboratory investigation of the Sticky Pad nuisance dust monitoring method. Unpublished BSc thesis, Oxford Brookes University, Oxford, 2002.
[17] Merefield, J., 21 March 2005. Personal communication, University of Exeter, UK.
[18] Chao, T. T. and Sanzolone, R. F., Decomposition techniques. Journal of Geochemical Exploration 44, pp. 65 – 106, 1992.
[19] National Institute of Standards and Technology, Certificate of Analysis, Standard Reference Material 2710. NIST, Gaithersburg, USA, 2003.
[20] Rahn, K. A., A graphical technique for determining major components in a mixed aerosol. I. Descriptive aspects. Atmospheric Environment 33, pp. 1441 – 1455, 1999.
www.witpress.com, ISSN 1743-3541 (on-line) WIT Transactions on Ecology and the Environment, Vol 101, © 2007 WIT Press
428 Air Pollution XV