Embed Size (px)
Citation preview
ARTICLE IN PRESS
Mechanical Systemsand
Signal ProcessingMechanical Systems and Signal Processing 19 (2005) 939–954
0888-3270/$ -
doi:10.1016/j.
�CorresponE-mail add
www.elsevier.com/locate/jnlabr/ymssp
A method for the correlation dimension estimation for on-linecondition monitoring of large rotating machinery
Alberto Rolo-Naranjo�, Marıa-Elena Montesino-Otero
Higher Institute of Nuclear Sciences and Technology, Ave Salvador Allende y Luaces, Quinta de los Molinos,
Plaza de la Revolucion, Ciudad Habana, CP 10600, AP 6163, Cuba
Received 19 August 2003; received in revised form 23 July 2004; accepted 4 August 2004
Available online 18 September 2004
Abstract
In this paper, we introduce a robust method for the correlation dimension estimation in an automaticway for its implementation in on-line condition monitoring of large rotating machinery. The method iscalled Automatic-Attractor Dimension-Quantitative Estimation (A-AD-QE). It is based on a systemicanalysis of the second derivative of the correlation integral obtained by the Grassberger and Procacciaalgorithm. The A-AD-QE method concentrates its attention on the scaling region definition and it also hasthe possibility to analyse the geometrical structure of the obtained multidimensional second derivative ofthe correlation integral and its relation with the pseudo-phase portrait. The effectiveness of the introducedmethod was verified by means of the calculation of well-known analytic models as Lorenz attractor, van derPol oscillator and Henon Map. Furthermore, the A-AD-QE method was applied to process real vibrationsignals of large rotating machines. As a typical example we analysed four measurements, recorded atdifferent points. The obtained results demonstrate the applicability of the method in real vibration signalprocessing for this kind of machines.r 2004 Published by Elsevier Ltd.
1. Introduction
The development of nonlinear dynamics theory has brought new methodologies to identify andforecast complex nonlinear vibration behaviours. Nowadays, the application of nonlinear
see front matter r 2004 Published by Elsevier Ltd.
ymssp.2004.08.001
ding author.
ress: [email protected] (A. Rolo-Naranjo).
ARTICLE IN PRESS
Nomenclature
Cðr;mÞ correlation integralYð Þ Heaviside functiont lag timem embedding dimensionD2 (m) correlation exponent estimated from m-dimensional embedding spaceD2 correlation dimensionN data volume of time seriesxi time seriesXi embedding spaceA-AD-QE automatic-attractor dimension-quantitative estimationLPZ length of the plateau zoneBPFW resizable xy-band-pass filters windowsx height of the BPFWL length of the BPFW
A. Rolo-Naranjo, M.-E. Montesino-Otero / Mechanical Systems and Signal Processing 19 (2005) 939–954940
procedures in condition monitoring is a very active research field. One of the main objectives ofthe introduction of these techniques is to extract the maximum of the all-significant diagnosticinformation from the original signals.Many authors have treated the evaluations of the chaotic patterns that can appear in some
mechanical systems [1–5]. For large rotating machines the chaotic behaviour is related to theinteractions in the rotor/bearing/stator system. The system nonlinearity can be found in thediscontinuous stiffness, damping, surface friction and impact. Muszynska and Goldman [2]reported an important theoretical and practical review of these phenomena.The system nonlinearity evaluation by means of traditional descriptors, i.e. FFT-based methods,
can give inappropriate results. These behaviours are described and characterised by means ofnonlinear tools such as correlation dimension, the pseudo-space portraits and others. Nowadays, thecorrelation dimension has been widely used as a powerful tool for interpreting irregular signals inelectrical, mechanical and other engineering domains. The correlation dimension as a diagnosticsindicator gives information about the dimensionality and complexity of dynamical system. Veryrecent studies applied this descriptor as a representative approach to the fault characterisation [6–12].Logan and Mathew [6,7] related the correlation dimension with faults in rolling bearings
condition monitoring. They shown that the correlation dimension can classify three major rollingelement-bearing faults: outer race fault, inner race fault and roller fault. Also, the methodologyfor the practical computation of the correlation dimension, based on the embedding procedure isdescribed there. Based on this methodology, all the parameters for the embedding procedure areintroduced manually by the user. Finally, the user fits the straight line of the correlation integralplot interactively (on screen). Furthermore, the user has to fix the qualitative and quantitativeresults of the calculation. Thus, the correlation dimension estimation is strongly influenced by theuser. Better results can be expected if the embedding parameters were defined in correspondencewith the studied dynamic system.
ARTICLE IN PRESS
A. Rolo-Naranjo, M.-E. Montesino-Otero / Mechanical Systems and Signal Processing 19 (2005) 939–954 941
In [8], the correlation dimension is applied for gearbox fault diagnosis and its great potentialityas a diagnostic indicator is shown. Craig et al. [10] used the correlation dimension in conditionmonitoring of systems with clearance. One of the main results in this paper is related with thepotentiality of chaos techniques, as an alternative approach, in health monitoring of plant ormachinery.Wang et al. [10,11] introduced a very important contribution for the diagnostic process of large
rotating machinery and gearboxes by means of the use of nonlinear methods. A high sensitivity ofthe pseudo-phase portrait, the singular-spectrum analysis as well as the correlation dimension wasshown. More studies related with the application of pseudo-phase portrait, as indicator can befound in [13,14]. In [14], a qualitative approach to the sensitive evaluation of the pseudo-phaseportraits is given.Instead of the correlation dimension value, Koizumi et al. [12] introduced the correlation
exponent as a fault descriptor, estimated with the modified version of the well-known Grassbergerand Procaccia algorithm. The modified version was based on a re-embedding procedure reportedby Fraedrich and Wang [15]. These authors applied the correlation exponent to investigate thechattering vibration during the cutting process. Good results can be obtained with the correlationexponent of some previous defined embedding dimension and fixed scaling region. Nevertheless,its value only gives a partial portrait of the real complexity of the studied dynamical system.One of the problems derived for the correlation dimension determination in multidimensional
analysis, is the scaling region definition of the correlation integral as a function of the embeddingdimension. Quite frequently the derivative of the log–log plot of C(r,m) vs. ln r is used for itscalculation [6–12]. Here, the correlation dimension is expressed as a function of the embeddingdimension:
D2ðr;mÞ ffid½lnðCðr;mÞ�
dðln rÞ(1)
which is approximated by
D2ðr;mÞ ¼D½lnðCðr;mÞÞ�
Dðln rÞ; (2)
where operator D is defined by Df ðrÞ ffi f ðr þ 1Þ � f ðrÞ [16]. Relating the plateau appearance tothe attractor dimension value, this method provides good visual results. The plateau zone(sometimes fitted by eyes) defines the correlation dimension value. Regardless of their advantages,the correlation dimension calculated with this method introduces some errors associated to theobserver’s subjectivity and it also limits the velocity of the decision in accordance with itsintroduction as an indicator in a real system condition monitoring.A statistical approach to the correlation dimension estimation is given in [17]. The authors
introduce a method based on the maximum-likelihood principle, by means of which, the explicitexpressions for the maximum-likelihood estimate of correlation dimension and its asymptoticvariance are derived. They show how the w2 test is used to find the upper cutoff of the scaling region.We can realise the correlation dimension has a high applicability to the fault diagnostic of
mechanical system but its calculation in an automatic way is lacking. In this paper, we introduce arobust method for the correlation dimension estimation in an automatic way for itsimplementation in on-line condition monitoring of large rotating machinery. The method is
ARTICLE IN PRESS
A. Rolo-Naranjo, M.-E. Montesino-Otero / Mechanical Systems and Signal Processing 19 (2005) 939–954942
called Automatic-Attractor Dimension-Quantitative Estimation (A-AD-QE). It is based on thesystemic analysis of the second derivative of the correlation integral defined by Grassberger andProcaccia algorithm. The A-AD-QE method concentrates its attention on the scaling regiondefinition and it also has the possibility to analyse the geometrical structure of the obtainedmultidimensional second derivative of the correlation integral and its relation with the pseudo-phase portrait. Some applications of this method to the monitoring and surveillance of NuclearPower Plant can be found in [18,19].One of the most important properties of the correlation dimension is its high sensitivity to the
dynamical changes of the analysed system. Its application to the real system condition monitoringimproves the real signal characterisation. More than 180 measurements of different points of alarge rotating machine were analysed in order to evaluate the applicability of the introduced A-AD-QE method. Four of them are presented in this paper.The structure of this paper is as follows: In Section 2 a theoretical background of the A-AD-QE
method is given, starting with a brief review of the embedding procedure and some details aboutthe correlation dimension. In the same section, the introduced method is tested by means of well-known analytic models, such as Lorenz attractor, van der Pol oscillator and Henon Map. InSection 3, we show some applications of the A-AD-QE method to the correlation dimensionestimation of real measurements of a large rotating machine. Finally, the main conclusions aregiven in Section 4.
2. Theoretical background
2.1. Embedding procedure
The embedding procedure is the first step of the phase space reconstruction of a dynamicalsystem from the observation of a single variable. The most common phase space reconstructiontechnique is the method of delays (MOD) proposed by Takens [20]. By means of MOD it ispossible to build an attractor by replacing the derivatives with delayed repetitions of only onemeasured variable of the system.The time series x1;x2; x3; . . . ; xN is represented as a sequence of vectors
X i ¼ fxi; xiþt; . . . ;xiþðm�1Þtg; (3)
where i ¼ 1; 2; . . . ;N � ðm � 1Þt; where N�(m�1) is the length of the reconstructed vector Xi, m isthe embedding dimension of the reconstructed phase space and t is the lag time in units ofsampling interval.In recent investigations, the calculation of the embedding parameters t and m is a question of
special interest. The optimal choice of these embedding parameters depends of the respectiveapplication [21]. A good definition of t is of importance for the MOD to give sensible results. Twomajor problems are described in [22]: redundancy and irrelevance. The first one is related to thechoice of t as small as possible. In this case the consecutive measurements of the reconstructedvectors will give nearly the same results. Hence, the topological vectors constructed via the MOD,will be stretched along the diagonal in the m-dimensional embedding space and thus the analysisof the picture of the attractor will be very difficult [23].
ARTICLE IN PRESS
A. Rolo-Naranjo, M.-E. Montesino-Otero / Mechanical Systems and Signal Processing 19 (2005) 939–954 943
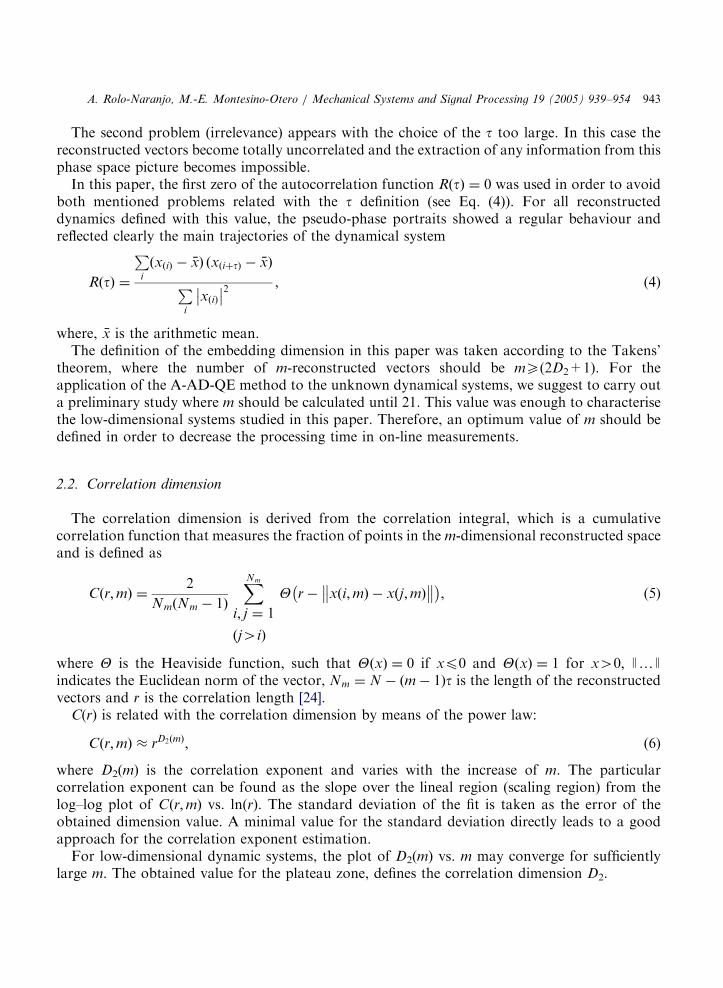
The second problem (irrelevance) appears with the choice of the t too large. In this case thereconstructed vectors become totally uncorrelated and the extraction of any information from thisphase space picture becomes impossible.In this paper, the first zero of the autocorrelation function RðtÞ ¼ 0 was used in order to avoid
both mentioned problems related with the t definition (see Eq. (4)). For all reconstructeddynamics defined with this value, the pseudo-phase portraits showed a regular behaviour andreflected clearly the main trajectories of the dynamical system
RðtÞ ¼
Pi
ðxðiÞ � �xÞ ðxðiþtÞ � �xÞ
Pi
xðiÞ
�� ��2 ; (4)
where, �x is the arithmetic mean.The definition of the embedding dimension in this paper was taken according to the Takens’
theorem, where the number of m-reconstructed vectors should be mX(2D2+1). For theapplication of the A-AD-QE method to the unknown dynamical systems, we suggest to carry outa preliminary study where m should be calculated until 21. This value was enough to characterisethe low-dimensional systems studied in this paper. Therefore, an optimum value of m should bedefined in order to decrease the processing time in on-line measurements.
2.2. Correlation dimension
The correlation dimension is derived from the correlation integral, which is a cumulativecorrelation function that measures the fraction of points in the m-dimensional reconstructed spaceand is defined as
Cðr;mÞ ¼2
NmðNm � 1Þ
XNm
i; j ¼ 1
ðj4iÞ
Y r � xði;mÞ�� � xðj;mÞ
��� �; (5)
where Y is the Heaviside function, such that YðxÞ ¼ 0 if xp0 and YðxÞ ¼ 1 for x40; JyJindicates the Euclidean norm of the vector, Nm ¼ N � ðm � 1Þt is the length of the reconstructedvectors and r is the correlation length [24].
C(r) is related with the correlation dimension by means of the power law:
Cðr;mÞ � rD2ðmÞ; (6)
where D2(m) is the correlation exponent and varies with the increase of m. The particularcorrelation exponent can be found as the slope over the lineal region (scaling region) from thelog–log plot of Cðr;mÞ vs. ln(r). The standard deviation of the fit is taken as the error of theobtained dimension value. A minimal value for the standard deviation directly leads to a goodapproach for the correlation exponent estimation.For low-dimensional dynamic systems, the plot of D2(m) vs. m may converge for sufficiently
large m. The obtained value for the plateau zone, defines the correlation dimension D2.
ARTICLE IN PRESS
A. Rolo-Naranjo, M.-E. Montesino-Otero / Mechanical Systems and Signal Processing 19 (2005) 939–954944
2.3. The A-AD-QE method
The A-AD-QE method is called to be a robust tool for the D2 estimation in an automatic wayfor its implementation in on-line condition monitoring of large rotating machinery. Its principalidea is to provide a D2 definition taking as reference the second derivative application to thecorrelation integral (d2½lnðCðr;mÞÞ�=dðln rÞ2 vs. lnðri=r0Þ).The implementation of the A-AD-QE method is based on the use of resizable xy-band-pass
filter windows (BPFW) with dimensions: height x and length L, over all points of the normalisedsecond derivative of the correlation integral. This BPFW is moving in a zero-vicinity of x-axis ofthe second derivative function.Once the second derivative to the correlation integral is computed, the following step
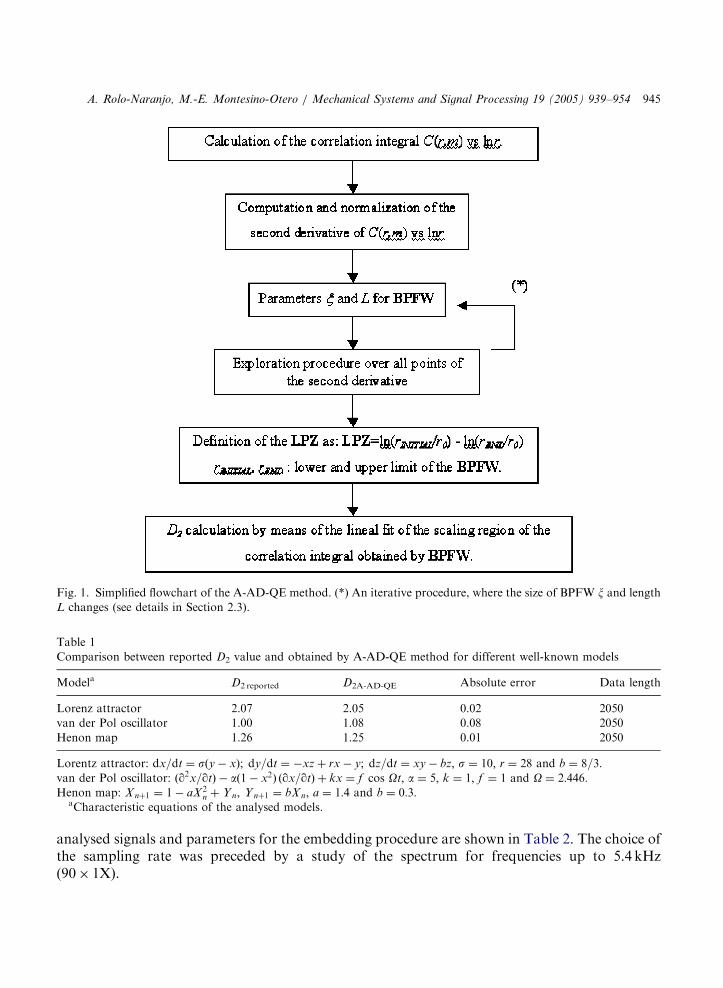
in the A-AD-QE method is an iterative change of the size definition of the BPFW. Initialparameter x should be taken as minimum as possible and L increases accordingly with thenumber of analysed points, which should satisfy that their ordinate is smaller than the heightof the specific window, according to the iterative process. The necessary and sufficient con-ditions to stop this process are the existence of the appropriate number of continuous pointsthat are within the specific BPFW dimensions. In our experience the number of point shouldbe higher or equal to six, in order to obtain a good approach to the proper scaling regiondefinition of the correlation integral. As an important result, the difference among the initialand final points of the BPFW (length of the plateau zone—LPZ=ln(rINITIAL/r0)�ln(rEND/r0))defines the length of the best plateau zone LPZ, which is located in a zero vicinity. TheLPZ definition is in correspondence with the scaling region of the correlation integral, whichallows the D2 determination in an automatic way. This is a principal advantage of the intro-duced method in on-line monitoring system. Fig. 1 shows a simplified flowchart of theA-AD-QE method.The appearance in the correlation integral plot of more than one scaling region is a real
problem for some mechanical systems [7]. In this case, the A-AD-QE method defines the first LPZas a criterion for the scaling region definition.The introduced method was tested by means of well-known analytic models, such as van der
Pol oscillator [25], Henon Map [26] and Lorenz attractor [27]. The obtained results for the D2
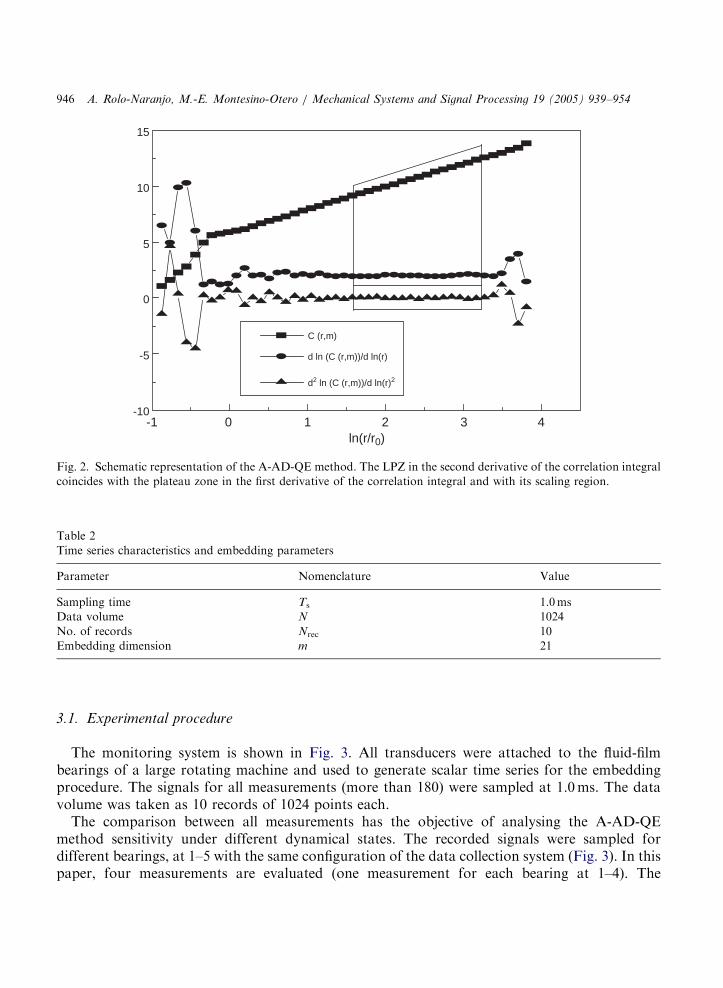
estimation are comparable with other reported models (see Table 1).Fig. 2 shows a schematic representation of practical application of the A-AD-QE method. In
this figure, the correlation integral as well as its first and second derivatives of the 12th embeddingdimension of the Lorenz attractor are shown. The LPZ coincides with the plateau zone in the firstderivative plot and with the scaling region of the correlation integral. The least square regressionof the selected scaling region yields that the slope of the scaling region is 2.057(o0.01). The D2
for this model is 2.07.
3. Case study
In order to test the applicability of the A-AD-QE method in on-line monitoring, vibrationmeasurements of large rotating machines have been analysed. The main characteristics of these
ARTICLE IN PRESS
Fig. 1. Simplified flowchart of the A-AD-QE method. (*) An iterative procedure, where the size of BPFW x and lengthL changes (see details in Section 2.3).
Table 1
Comparison between reported D2 value and obtained by A-AD-QE method for different well-known models
Modela D2 reported D2A-AD-QE Absolute error Data length
Lorenz attractor 2.07 2.05 0.02 2050
van der Pol oscillator 1.00 1.08 0.08 2050
Henon map 1.26 1.25 0.01 2050
Lorentz attractor: dx=dt ¼ sðy � xÞ; dy=dt ¼ �xz þ rx � y; dz=dt ¼ xy � bz; s ¼ 10; r ¼ 28 and b ¼ 8=3:van der Pol oscillator: ðq2x=qtÞ � að1� x2Þ ðqx=qtÞ þ kx ¼ f cos Ot; a ¼ 5; k ¼ 1; f ¼ 1 and O ¼ 2:446:Henon map: X nþ1 ¼ 1� aX 2
n þ Y n; Y nþ1 ¼ bX n; a ¼ 1:4 and b ¼ 0:3:aCharacteristic equations of the analysed models.
A. Rolo-Naranjo, M.-E. Montesino-Otero / Mechanical Systems and Signal Processing 19 (2005) 939–954 945
analysed signals and parameters for the embedding procedure are shown in Table 2. The choice ofthe sampling rate was preceded by a study of the spectrum for frequencies up to 5.4 kHz(90� 1X).
ARTICLE IN PRESS
-1 1 2 3 40-10
-5
0
5
10
15
C (r,m)
d ln (C (r,m))/d ln(r)
d2 ln (C (r,m))/d ln(r)2
ln(r/r0)
Fig. 2. Schematic representation of the A-AD-QE method. The LPZ in the second derivative of the correlation integral
coincides with the plateau zone in the first derivative of the correlation integral and with its scaling region.
Table 2
Time series characteristics and embedding parameters
Parameter Nomenclature Value
Sampling time Ts 1.0ms
Data volume N 1024
No. of records Nrec 10
Embedding dimension m 21
A. Rolo-Naranjo, M.-E. Montesino-Otero / Mechanical Systems and Signal Processing 19 (2005) 939–954946
3.1. Experimental procedure
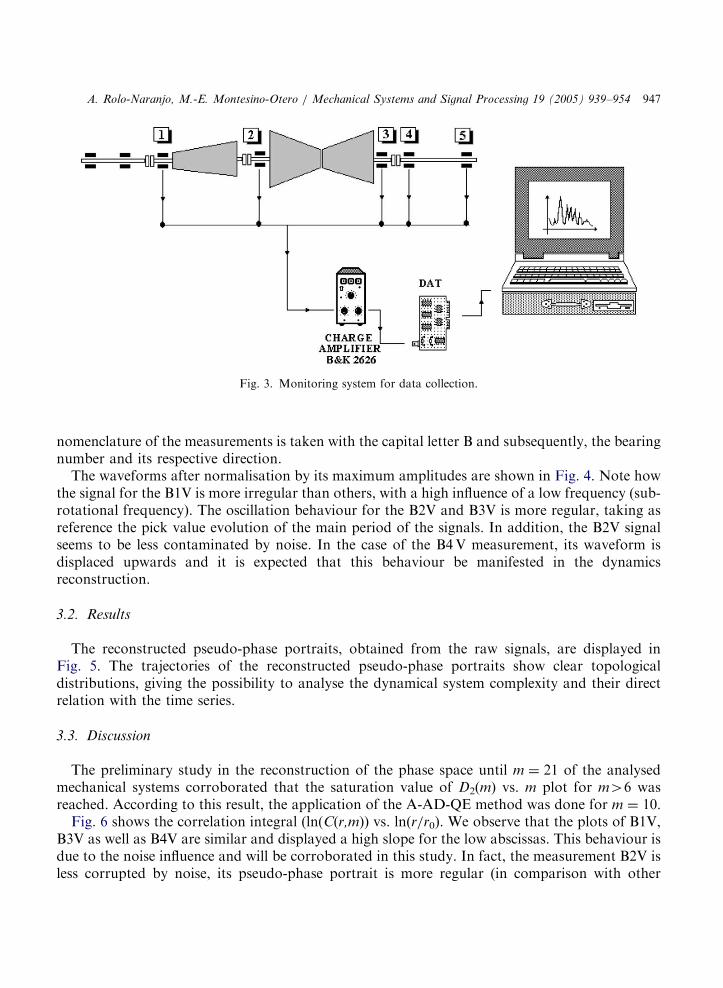
The monitoring system is shown in Fig. 3. All transducers were attached to the fluid-filmbearings of a large rotating machine and used to generate scalar time series for the embeddingprocedure. The signals for all measurements (more than 180) were sampled at 1.0ms. The datavolume was taken as 10 records of 1024 points each.The comparison between all measurements has the objective of analysing the A-AD-QE
method sensitivity under different dynamical states. The recorded signals were sampled fordifferent bearings, at 1–5 with the same configuration of the data collection system (Fig. 3). In thispaper, four measurements are evaluated (one measurement for each bearing at 1–4). The
ARTICLE IN PRESS
Fig. 3. Monitoring system for data collection.
A. Rolo-Naranjo, M.-E. Montesino-Otero / Mechanical Systems and Signal Processing 19 (2005) 939–954 947
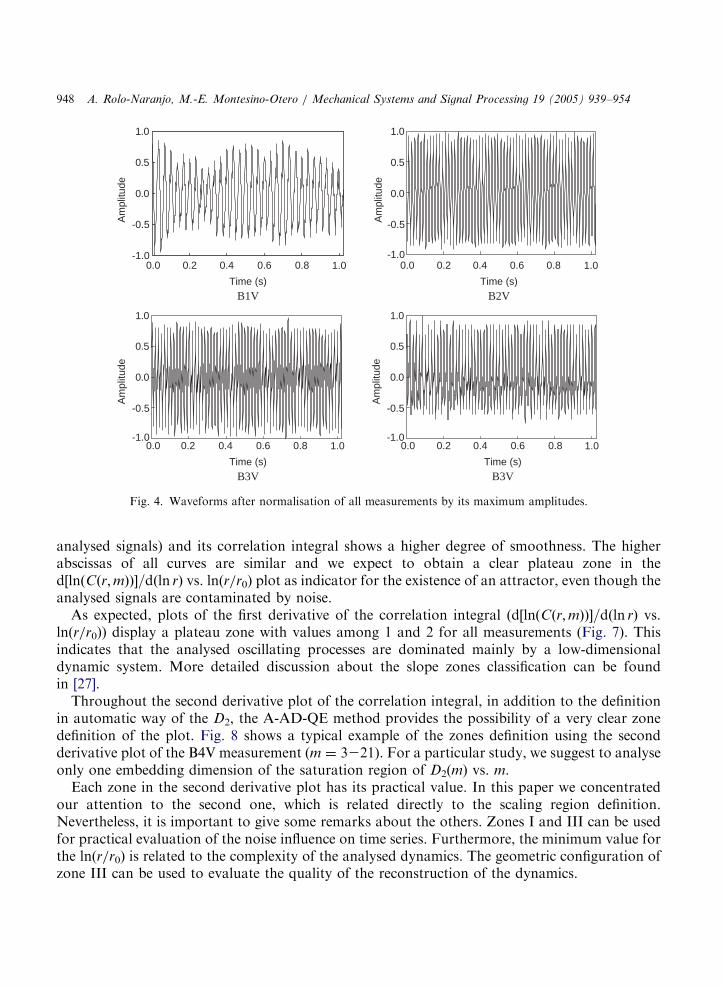
nomenclature of the measurements is taken with the capital letter B and subsequently, the bearingnumber and its respective direction.The waveforms after normalisation by its maximum amplitudes are shown in Fig. 4. Note how
the signal for the B1V is more irregular than others, with a high influence of a low frequency (sub-rotational frequency). The oscillation behaviour for the B2V and B3V is more regular, taking asreference the pick value evolution of the main period of the signals. In addition, the B2V signalseems to be less contaminated by noise. In the case of the B4V measurement, its waveform isdisplaced upwards and it is expected that this behaviour be manifested in the dynamicsreconstruction.
3.2. Results
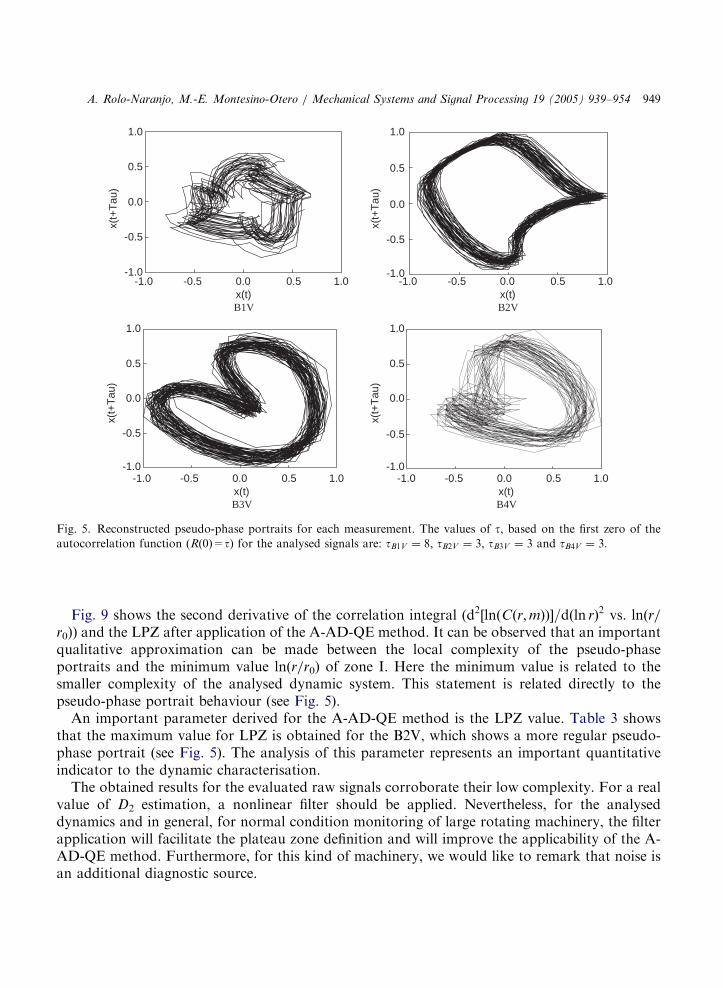
The reconstructed pseudo-phase portraits, obtained from the raw signals, are displayed inFig. 5. The trajectories of the reconstructed pseudo-phase portraits show clear topologicaldistributions, giving the possibility to analyse the dynamical system complexity and their directrelation with the time series.
3.3. Discussion
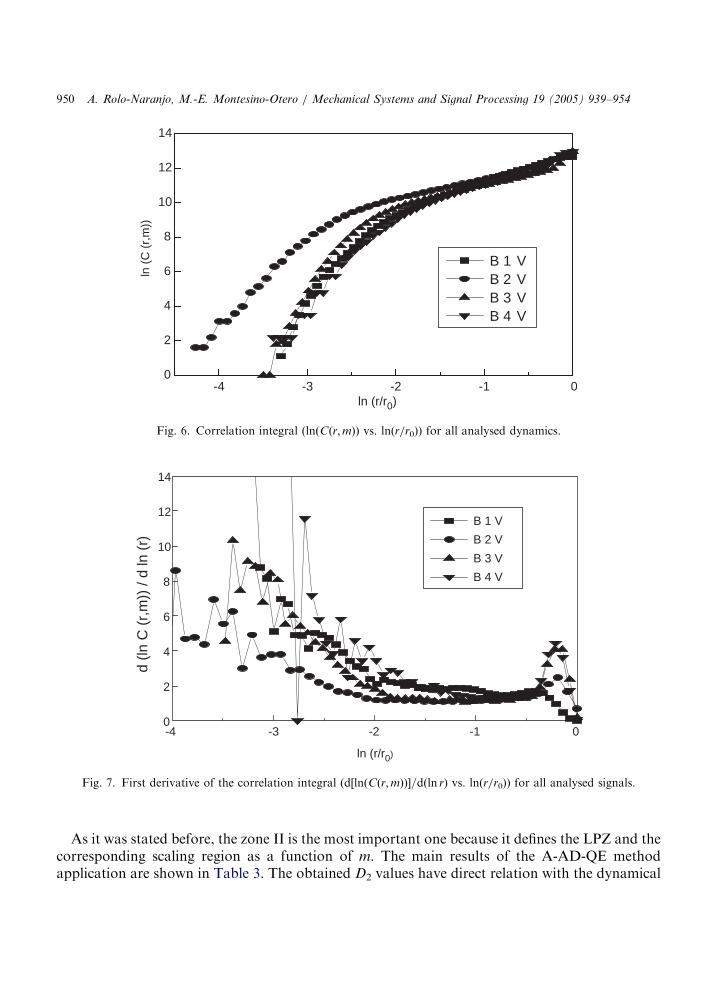
The preliminary study in the reconstruction of the phase space until m ¼ 21 of the analysedmechanical systems corroborated that the saturation value of D2(m) vs. m plot for m46 wasreached. According to this result, the application of the A-AD-QE method was done for m ¼ 10:Fig. 6 shows the correlation integral (ln(C(r,m)) vs. ln(r/r0). We observe that the plots of B1V,
B3V as well as B4V are similar and displayed a high slope for the low abscissas. This behaviour isdue to the noise influence and will be corroborated in this study. In fact, the measurement B2V isless corrupted by noise, its pseudo-phase portrait is more regular (in comparison with other
ARTICLE IN PRESS
-1.0
-0.5
0.0
0.5
1.0
-1.0
-0.5
0.0
0.5
1.0
0.0 0.2 0.4 0.6 0.8 1.0 0.0 0.2 0.4 0.6 0.8 1.0
Am
plitu
de
-1.0
-0.5
0.0
0.5
1.0
Am
plitu
de
-1.0
-0.5
0.0
0.5
1.0
Am
plitu
deA
mpl
itude
Time (s)
B1V
0.0 0.2 0.4 0.6 0.8 1.0
Time (s)
B3V
0.0 0.2 0.4 0.6 0.8 1.0
Time (s)
B3V
Time (s)
B2V
Fig. 4. Waveforms after normalisation of all measurements by its maximum amplitudes.
A. Rolo-Naranjo, M.-E. Montesino-Otero / Mechanical Systems and Signal Processing 19 (2005) 939–954948
analysed signals) and its correlation integral shows a higher degree of smoothness. The higherabscissas of all curves are similar and we expect to obtain a clear plateau zone in thed½lnðCðr;mÞÞ�=dðln rÞ vs. ln(r/r0) plot as indicator for the existence of an attractor, even though theanalysed signals are contaminated by noise.As expected, plots of the first derivative of the correlation integral (d½lnðCðr;mÞÞ�=dðln rÞ vs.
ln(r/r0)) display a plateau zone with values among 1 and 2 for all measurements (Fig. 7). Thisindicates that the analysed oscillating processes are dominated mainly by a low-dimensionaldynamic system. More detailed discussion about the slope zones classification can be foundin [27].Throughout the second derivative plot of the correlation integral, in addition to the definition
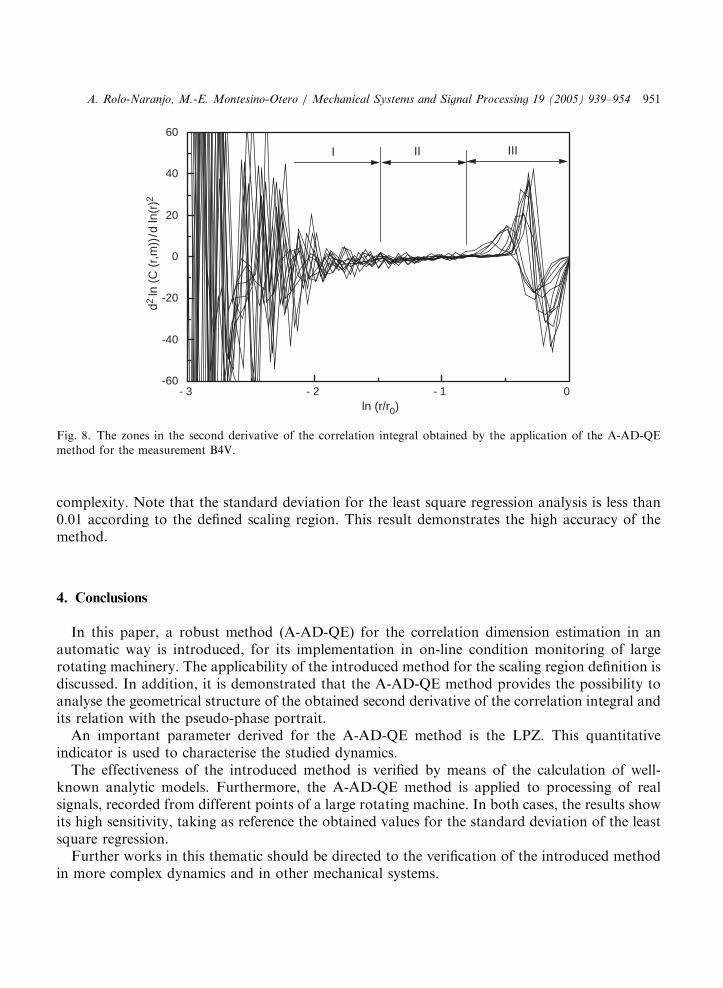
in automatic way of the D2, the A-AD-QE method provides the possibility of a very clear zonedefinition of the plot. Fig. 8 shows a typical example of the zones definition using the secondderivative plot of the B4V measurement (m ¼ 3221). For a particular study, we suggest to analyseonly one embedding dimension of the saturation region of D2(m) vs. m.Each zone in the second derivative plot has its practical value. In this paper we concentrated
our attention to the second one, which is related directly to the scaling region definition.Nevertheless, it is important to give some remarks about the others. Zones I and III can be usedfor practical evaluation of the noise influence on time series. Furthermore, the minimum value forthe ln(r/r0) is related to the complexity of the analysed dynamics. The geometric configuration ofzone III can be used to evaluate the quality of the reconstruction of the dynamics.
ARTICLE IN PRESS
-1.0-1.0
-0.5
-0.5
0.0
0.0
0.5
0.5
1.0
1.0
x(t+
Tau
)
-1.0
-0.5
0.0
0.5
1.0
x(t+
Tau
)
-1.0
-0.5
0.0
0.5
1.0
x(t+
Tau
)
-1.0
-0.5
0.0
0.5
1.0
x(t+
Tau
)
x(t)B1V
-1.0 -0.5 0.0 0.5 1.0x(t)B3V
-1.0 -0.5 0.0 0.5 1.0x(t)B4V
-1.0 -0.5 0.0 0.5 1.0x(t)B2V
Fig. 5. Reconstructed pseudo-phase portraits for each measurement. The values of t; based on the first zero of the
autocorrelation function (R(0)=t) for the analysed signals are: tB1V ¼ 8; tB2V ¼ 3; tB3V ¼ 3 and tB4V ¼ 3:
A. Rolo-Naranjo, M.-E. Montesino-Otero / Mechanical Systems and Signal Processing 19 (2005) 939–954 949
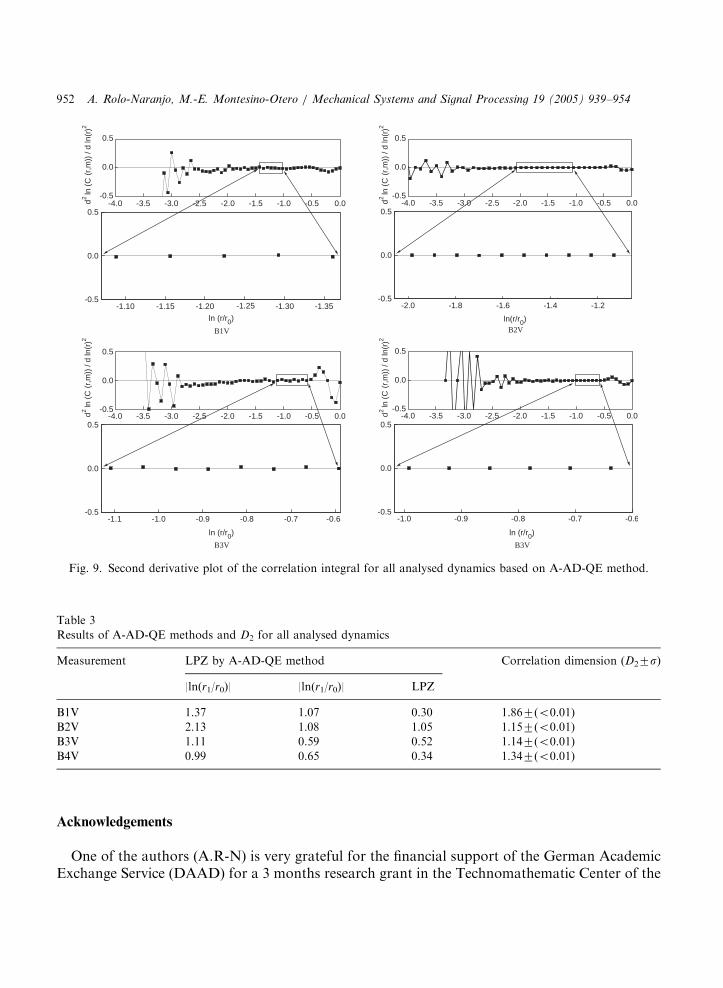
Fig. 9 shows the second derivative of the correlation integral (d2½lnðCðr;mÞÞ�=dðln rÞ2 vs. ln(r/r0)) and the LPZ after application of the A-AD-QE method. It can be observed that an importantqualitative approximation can be made between the local complexity of the pseudo-phaseportraits and the minimum value ln(r/r0) of zone I. Here the minimum value is related to thesmaller complexity of the analysed dynamic system. This statement is related directly to thepseudo-phase portrait behaviour (see Fig. 5).An important parameter derived for the A-AD-QE method is the LPZ value. Table 3 shows
that the maximum value for LPZ is obtained for the B2V, which shows a more regular pseudo-phase portrait (see Fig. 5). The analysis of this parameter represents an important quantitativeindicator to the dynamic characterisation.The obtained results for the evaluated raw signals corroborate their low complexity. For a real
value of D2 estimation, a nonlinear filter should be applied. Nevertheless, for the analyseddynamics and in general, for normal condition monitoring of large rotating machinery, the filterapplication will facilitate the plateau zone definition and will improve the applicability of the A-AD-QE method. Furthermore, for this kind of machinery, we would like to remark that noise isan additional diagnostic source.
ARTICLE IN PRESS
-4 -3 -2 -1 00
2
4
6
8
10
12
14
B 1 V B 2 V B 3 V B 4 V
ln (
C (
r,m
))
ln (r/r0)
Fig. 6. Correlation integral (lnðCðr;mÞÞ vs. ln(r/r0)) for all analysed dynamics.
-4 -3 -2 -1 00
2
4
6
8
10
12
14
B 1 V
B 2 V
B 3 V
B 4 V
d (ln
C (
r,m
)) /
d ln
(r)
ln (r/r0)
Fig. 7. First derivative of the correlation integral (d½lnðCðr;mÞÞ�=dðln rÞ vs. ln(r/r0)) for all analysed signals.
A. Rolo-Naranjo, M.-E. Montesino-Otero / Mechanical Systems and Signal Processing 19 (2005) 939–954950
As it was stated before, the zone II is the most important one because it defines the LPZ and thecorresponding scaling region as a function of m. The main results of the A-AD-QE methodapplication are shown in Table 3. The obtained D2 values have direct relation with the dynamical
ARTICLE IN PRESS
- 3 - 2 - 1 0-60
-40
-20
0
20
40
60
IIIIIId2
ln (
C (
r,m
))/d
ln(r
)2
ln (r/r0)
Fig. 8. The zones in the second derivative of the correlation integral obtained by the application of the A-AD-QE
method for the measurement B4V.
A. Rolo-Naranjo, M.-E. Montesino-Otero / Mechanical Systems and Signal Processing 19 (2005) 939–954 951
complexity. Note that the standard deviation for the least square regression analysis is less than0.01 according to the defined scaling region. This result demonstrates the high accuracy of themethod.
4. Conclusions
In this paper, a robust method (A-AD-QE) for the correlation dimension estimation in anautomatic way is introduced, for its implementation in on-line condition monitoring of largerotating machinery. The applicability of the introduced method for the scaling region definition isdiscussed. In addition, it is demonstrated that the A-AD-QE method provides the possibility toanalyse the geometrical structure of the obtained second derivative of the correlation integral andits relation with the pseudo-phase portrait.An important parameter derived for the A-AD-QE method is the LPZ. This quantitative
indicator is used to characterise the studied dynamics.The effectiveness of the introduced method is verified by means of the calculation of well-
known analytic models. Furthermore, the A-AD-QE method is applied to processing of realsignals, recorded from different points of a large rotating machine. In both cases, the results showits high sensitivity, taking as reference the obtained values for the standard deviation of the leastsquare regression.Further works in this thematic should be directed to the verification of the introduced method
in more complex dynamics and in other mechanical systems.
ARTICLE IN PRESS
-4.0 -3.5 -3.0 -2.5 -2.0 -1.5 -1.0 -0.5 0.0-0.5
0.0
0.5
-0.5
0.0
0.5
-0.5
0.0
0.5
d2
ln (
C (
r,m
)) /
d ln
(r)2
d2
ln (
C (
r,m
)) /
d ln
(r)2
d2
ln (
C (
r,m
)) /
d ln
(r)2
d2
ln (
C (
r,m
)) /
d ln
(r)2
-0.5
0.0
0.5
-0.5-1.10 -1.15 -1.20 -1.25 -1.30 -1.35
0.0
0.5
ln (r/r0)
B1V
ln (r/r0)
B3V
ln (r/r0)
B3V
-4.0 -3.5 -3.0 -2.5 -2.0 -1.5 -1.0 -0.5 0.0
-2.0 -1.8 -1.6 -1.4 -1.2-0.5
0.0
0.5
ln(r/r0)B2V
-4.0 -3.5 -3.0 -2.5 -2.0 -1.5 -1.0 -0.5 0.0
-1.1 -1.0 -0.9 -0.8 -0.7 -0.6-0.5
0.0
0.5-4.0 -3.5 -3.0 -2.5 -2.0 -1.5 -1.0 -0.5 0.0
-1.0 -0.9 -0.8 -0.7 -0.6-0.5
0.0
0.5
Fig. 9. Second derivative plot of the correlation integral for all analysed dynamics based on A-AD-QE method.
Table 3
Results of A-AD-QE methods and D2 for all analysed dynamics
Measurement LPZ by A-AD-QE method Correlation dimension (D27s)
|ln(r1/r0)| |ln(r1/r0)| LPZ
B1V 1.37 1.07 0.30 1.867(o0.01)
B2V 2.13 1.08 1.05 1.157(o0.01)
B3V 1.11 0.59 0.52 1.147(o0.01)
B4V 0.99 0.65 0.34 1.347(o0.01)
A. Rolo-Naranjo, M.-E. Montesino-Otero / Mechanical Systems and Signal Processing 19 (2005) 939–954952
Acknowledgements
One of the authors (A.R-N) is very grateful for the financial support of the German AcademicExchange Service (DAAD) for a 3 months research grant in the Technomathematic Center of the
ARTICLE IN PRESS
A. Rolo-Naranjo, M.-E. Montesino-Otero / Mechanical Systems and Signal Processing 19 (2005) 939–954 953
University of Bremen. He would also like to express his gratefulness to Prof. Dr. Peter Maab andto Dr. Torsten Kohler for the interesting discussions and their invaluable scientific advice.
References
[1] A. Muszynska, Whirl and whip—rotor bearing stability problems, Journal of Sound and Vibration 110 (1986)
443–462.
[2] A. Muszynska, P. Goldman, Chaotic responses of unbalanced rotor/bearing/stator systems with looseness or rubs,
Chaos, Solitons and Fractals 5 (1995) 1683–1704.
[3] F.L. Chu, Z.S. Zhang, Periodic, quasi-periodic and chaotic vibrations of a rub-impact system supported on oil film
bearings, International Journal of Engineering Science 35 (1997) 963–973.
[4] J. Zapomel, E. Malenovsky, Approaches to investigation of the character of vibration of rotor systems supported
by fluid-film bearings, International Conference on Engineering Mechanics, Avractka, Czech Republic, 15–18 May
2000.
[5] J. Zapomel, E. Malenovsky, Approaches to numerical investigation of the character and stability of forced and
self-excited vibration of flexible rotors with non-linear supports, C576/016/2000, 2000.
[6] D. Logan, J. Mathew, Using de correlation dimension for vibration fault diagnosis of rolling element bearings—I.
Basic concepts, Mechanical Systems and Signal Processing 10 (1996) 241–250.
[7] D. Logan, J. Mathew, Using de correlation dimension for vibration fault diagnosis of rolling element bearings—II.
Selection of experimental parameters, Mechanical Systems and Signal Processing 10 (1996) 251–264.
[8] J.D. Jiang, J. Chen, L.S. Qu, The application of correlation dimension in gearbox condition monitoring, Journal of
Sound and Vibration 23 (1999) 529–542.
[9] C. Craig, R.D. Neilson, J. Penman, The use of correlation dimension in condition monitoring of systems with
clearance, Journal of Sound and Vibration 231 (2000) 1–17.
[10] W.J. Wang, J. Chen, X. K, Z.T. Wu, The application of some non-linear methods in rotating machinery fault
diagnosis, Mechanical Systems and Signal Processing 15 (2001) 697–705.
[11] W.J. Wang, R.M. Lin, The application of pseudo-phase portrait in machine condition monitoring, Journal of
Sound and Vibration 259 (2003) 1–16.
[12] T. Koizumi, N. Tsujiuchi, Y. Matsumura, Diagnosis with the correlation integral in time domain, Mechanical
Systems and Signal Processing 14 (2000) 1003–1010.
[13] Liangsheng Qu, Ailin Xie, Xiao Li, Study and performance evaluation of some nonlinear diagnostic methods for
large rotating machinery, Mechanism and Machine Theory 28 (1993) 699–713.
[14] A. Rolo, M. Piedra, M.E. Montesino, A. Companiony, Integral sensitivity of the phase-space and the lag time as
indicators of mechanical faults, III International Workshop of Management Sciences, III Maintenance Congress,
Villa Clara, Cuba, 2000.
[15] K. Fraedrich, R. Wang, Estimating the correlation dimension of an attractor from noisy and small datasets based
on re-embedding, Physica D 65 (1993) 373–398.
[16] J. Thiler, Spurious dimension from correlation algorithms applied to limited time-series data, Physical Review A
34 (1986) 2427–2432.
[17] D.V. Pisarenko, V.F. Pisarenko, Statistical estimation of the correlation dimension, Physics Letters A 197 (1995)
31–39.
[18] A. Rolo, M.E. Montesino, A. Companioni, A. Azoy, A method for practical determination of attractor dimension
applied to the monitoring and surveillance in Nuclear Power Plants, ENFIR XIII, Brazil, 2002.
[19] M.E. Montesino, A. Rolo, A. Azoy, The attractor dimension determination applied to monitoring and surveillance
in nuclear power plants, Progress in Nuclear Energy 43 (2003) 389–395.
[20] F. Takens, Detecting Strange Attractors in Turbulence, Lecture Notes in Mathematics, vol. 898, Springer, New
York, 1981, pp. 366–381.
[21] R. Hegger, H. Kantz, T. Schreiber, Practical implementation of nonlinear time series methods: the TISEAN
package, Chaos 9 (1999) 413.

ARTICLE IN PRESS
A. Rolo-Naranjo, M.-E. Montesino-Otero / Mechanical Systems and Signal Processing 19 (2005) 939–954954
[22] M. Casdagli, S. Eubank, J.D. Farmer, J. Gibson, State space reconstruction in the presence of noise, Physica D 51
(1991) 52.
[23] D. Kugiumtzis, State space reconstruction in the analysis of chaotic time series—the role of the time window
length, Physica D 95 (1996) 13–28.
[24] P. Grassberger, I. Procaccia, Measuring the strangeness of strange attractors, Physica D 9 (1983) 189–208.
[25] Y. Ashkenazy, The use of generalized information dimension in measuring fractal dimension of time series, Physics
Letters A 269 (1999) 427–447.
[26] J. Argyris, I. Andreadis, G. Pavlos, M. Athanasiou, On the influence of noise on the largest Lyapunov exponent on
the geometric structure of attractors, Chaos, Solitons and Fractals 9 (1998) 947–958.
[27] P. Sekar, S. Narayanan, Chaos in mechanical systems. A review, Sadhana 20 (1995) 529–582.