Embed Size (px)
Citation preview
Gest. Prod., São Carlos http://dx.doi.org/10.1590/0104-530X2625-15
Resumo: Na literatura acadêmica, tanto a seleção quanto a avaliação para o desenvolvimento de fornecedores vêm sendo abordadas como um problema de tomada de decisão no qual um conjunto de fornecedores é avaliado com base em múltiplos critérios de desempenho. Embora já existam centenas de metodologias quantitativas voltadas para o apoio à etapa de seleção de fornecedores, a avaliação de desempenho objetivando o desenvolvimento de fornecedores ainda é pouco explorada na literatura. Além disso, a maioria das abordagens existentes apresentam algumas limitações devido ao uso de técnicas inadequadas. Diante disso, este estudo propõe uma nova metodologia de apoio à avaliação de desempenho de fornecedores, desenvolvida a partir da combinação de sistemas de inferência fuzzy com alguns indicadores de desempenho do modelo SCOR (Supply Chain Operations Reference). A abordagem proposta permite avaliar aspectos relacionados ao desempenho das operações e aos custos do fornecedor. Os resultados dessa avaliação são usados para categorizar os fornecedores com desempenho similar e indicar diretrizes adequadas para o gerenciamento de cada grupo de fornecedores. Visando demonstrar o processo de modelagem e uso, bem como avaliar a adequabilidade da proposta, foi realizada uma aplicação piloto que envolveu a avaliação de 10 fornecedores de uma empresa do setor automotivo. Quatro sistemas de inferência fuzzy foram implementados usando MATLAB e parametrizados de acordo com os julgamentos de dois funcionários da empresa. Também foi realizada uma análise de sensibilidade para verificar a consistência dos resultados fornecidos por esses sistemas.
Abstract: In the academic literature, supplier selection and evaluation have been addressed as a decision-making problem in which a set of suppliers is assessed based on multiple criteria. Although there are hundreds of quantitative methodologies to support the supplier selection problem, supplier evaluation aiming at developing suppliers is little explored in the literature. Furthermore, most of the existing approaches have some limitations due to the use of inadequate techniques. Thus this study proposes a new methodology to support the assessment of supplier performance, developed from the combination of fuzzy inference systems with some performance indicators of the SCOR model (Supply Chain Operations Reference). The proposed approach enables the evaluation of aspects related to the performance of operations and costs. The results of this evaluation are used to categorize the suppliers with similar performance and identify guidelines for the management of each supplier group. To demonstrate the modeling process and use, and also to evaluate the suitability of this proposal, a pilot application involving the evaluation of 10 suppliers of a company in the automotive sector was conducted. Four fuzzy inference systems were implemented using MATLAB and parameterized according to the judgments of two employees of the company. A sensitivity analysis was performed to verify the consistency of the results yielded by these systems. The results support the suitability of the proposed methodology and the parameterization performed during implementation. When compared with the methodologies for the assessment of suppliers in the literature, this approach presents advantages such as the appointment of guidelines for the management of the supplier base; the possibility of integration with the supply chain performance evaluation; the ability to assess simultaneously a non-limited amount of suppliers, the representation and processing of information in a linguistic format, and the mapping and internal storage of all decision scenarios of the problem.Keywords: Supplier evaluation; Supplier development; SCOR model; Fuzzy inference; Fuzzy logic.
A methodology based on fuzzy inference and SCOR model for supplier performance evaluation
Uma metodologia baseada no modelo SCOR e em inferência fuzzy para apoiar a avaliação de desempenho de fornecedores
Francisco Rodrigues Lima Junior1
Giovani Mantovani Roza Carvalho2
Luiz Cesar Ribeiro Carpinetti1
1 Departamento de Engenharia de Produção, Escola de Engenharia de São Carlos, Universidade de São Paulo – USP, Avenida Trabalhador São-Carlense, 400, Parque Arnold Shimidt, CEP 13566-590, São Carlos, SP, Brazil, e-mail: [email protected]; [email protected]
2 Engenharia de Produção e Qualidade, Centro Universitário da Fundação Educacional Guaxupé – UNIFEG, Avenida Dona Floriana, 463, Centro, CEP 37800-000, Guaxupé, MG, Brazil, e-mail: [email protected]
Received Sept. 13, 2015 - Accepted Feb. 24, 2016Financial support: CAPES and CNPq.
Lima, F. R., Jr. et al.2 Gest. Prod., São Carlos
1 IntroductionIn industrial organizations, sourcing management
of products and services consists of a key process for supply chain management. Lee & Drake (2010) point that manufacturing companies have spent from 50% to 70% of its sales revenue buying raw materials. In this sense, the performance of suppliers affects directly the production costs of the buyer. In addition, it affects the quality products of the buyer as well as the satisfaction of the final costumers (González et al., 2004). Thus, managing the performance of suppliers and supporting their continuous improvement have become critical for supply chain management.
The performance evaluation of a supplier happens at least in two phases in the supplier management process. First, the evaluation is made during the selection of new suppliers, when the final goal is to define a preference order among the alternatives for the selection of those preferred ones. After this, in the phase of supplier development, supplier evaluation is conducted so that some management practices can be planned and implemented aiming at improving the performance and capabilities of the supplier so as to better fulfill the supply needs (Osiro et al., 2014). Since there are many possible practices for supplier development, the choice of the most suitable practices depends on the results of performance evaluation (Sarkar & Mohapatra, 2006; Osiro et al., 2014).
In the academic literature, supplier selection and supplier evaluation for development have been dealt as a decision making problem in which a set of suppliers are evaluated based on multiple performance criteria. Although there are hundreds of quantitative methodologies to support the supplier selection step (De Boer et al., 2001; Wu & Barnes, 2011; Lima et al., 2013; Chai et al., 2013; Lima et al., 2014a), the performance evaluation for supplier development still is little explored. In addition, the most of methodologies found in the literature to support supplier evaluation for development present some limitations caused by the use of inadequate
techniques to this domain problem. Moreover, these methodologies adopt criteria similar to ones used in supplier selection (Aksoy & Öztürk, 2011; Rezaei & Ortt, 2013). However, since the performance of a focal organization in a supply chain is dependent upon the performance of its suppliers, it is desirable that the performance evaluation of suppliers be aligned with the performance evaluation of the supply chain. In this sense, the metrics to be used in the supplier evaluation should be similar to ones used to evaluate the performance of the supply chain.
One approach widely adopted by managers to evaluate the supply chain performance is the Supply Chain Operations Reference (SCOR) model. This model proposes a hierarchy of performance measurement metrics that evaluates aspects related to reliability, responsiveness, agility, cost, and asset management (SCC, 2012). A differential of the SCOR metrics is that it allows that the focus company compares its performance with others supply chains by using a global benchmarking base, named SCORmark. However, none of the studies found in the literature proposes a methodology for supplier performance evaluation that considers the metrics proposed by the SCOR model.
In this context, this paper proposes a new methodology for supplier performance evaluation based on the combination of fuzzy inference systems with some of the SCOR metrics. By using a two-dimensional classification grid, each supplier is categorized according to its performance in operations and cost. The aim is that the categorization of the evaluated suppliers can guide further development of the supplier base. To demonstrate the applicability of the proposal, it was developed an illustrative application case in which 10 suppliers of an automotive company were evaluated. The fuzzy inference systems were implemented using the software MATLAB and parameterized according to the opinions of two company’s employers. In addition, a sensitivity analysis was made to verify the consistency of the results yielded.
Os resultados obtidos reforçam a adequação da metodologia proposta e das parametrizações realizadas durante a implementação. Quando comparada com as metodologias de avaliação de fornecedores encontradas na literatura, esta abordagem apresenta vantagens como o apontamento de diretrizes para a gestão da base de fornecedores, a possibilidade de integração com a avaliação de desempenho de cadeias de suprimento, a capacidade de avaliar simultaneamente uma quantidade não limitada de fornecedores, a representação e o processamento de informações em formato linguístico e o mapeamento e armazenagem interna de todos os cenários de decisão do problema por meio de regras de inferência facilmente interpretáveis.Palavras-chave: Avaliação de fornecedores; Desenvolvimento de fornecedores; Modelo SCOR; Inferência fuzzy; Lógica fuzzy.
3A methodology based on fuzzy inference and SCOR® model
This paper is organized as follows: Section 2 presents a literature review about supplier evaluation, SCOR model and fuzzy inference. Section 3 presents the applied methodical procedures. Section 4 presents the proposed methodology to support supplier’s evaluation, application case and sensibility analysis. At the end, Section 5 presents conclusions and suggestions for future researches.
2 Theoretical background2.1 Supplier evaluation and management
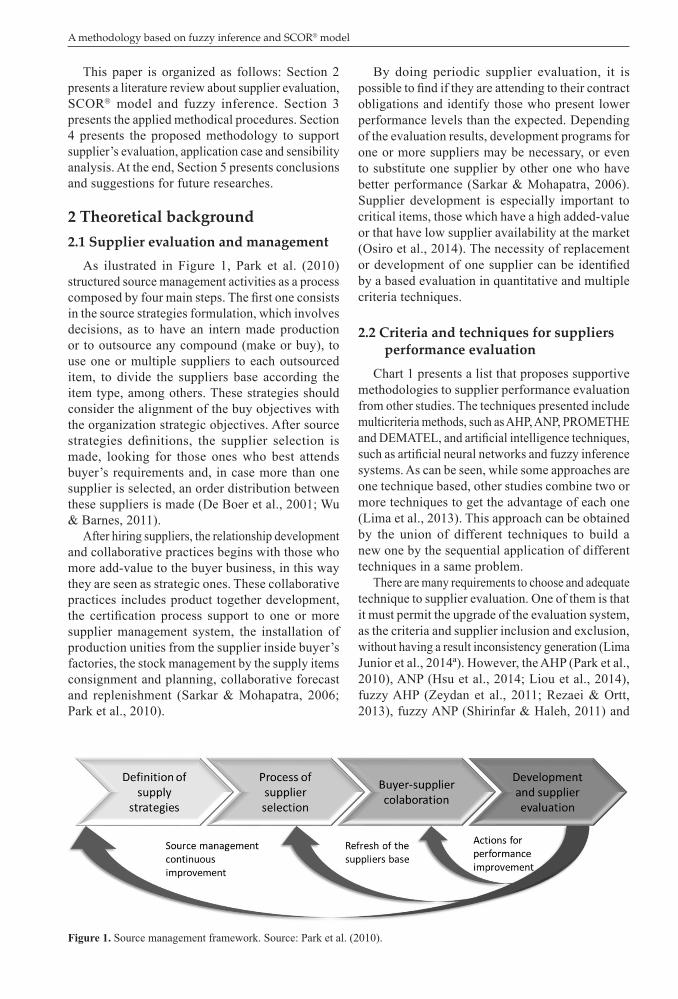
As ilustrated in Figure 1, Park et al. (2010) structured source management activities as a process composed by four main steps. The first one consists in the source strategies formulation, which involves decisions, as to have an intern made production or to outsource any compound (make or buy), to use one or multiple suppliers to each outsourced item, to divide the suppliers base according the item type, among others. These strategies should consider the alignment of the buy objectives with the organization strategic objectives. After source strategies definitions, the supplier selection is made, looking for those ones who best attends buyer’s requirements and, in case more than one supplier is selected, an order distribution between these suppliers is made (De Boer et al., 2001; Wu & Barnes, 2011).
After hiring suppliers, the relationship development and collaborative practices begins with those who more add-value to the buyer business, in this way they are seen as strategic ones. These collaborative practices includes product together development, the certification process support to one or more supplier management system, the installation of production unities from the supplier inside buyer’s factories, the stock management by the supply items consignment and planning, collaborative forecast and replenishment (Sarkar & Mohapatra, 2006; Park et al., 2010).
By doing periodic supplier evaluation, it is possible to find if they are attending to their contract obligations and identify those who present lower performance levels than the expected. Depending of the evaluation results, development programs for one or more suppliers may be necessary, or even to substitute one supplier by other one who have better performance (Sarkar & Mohapatra, 2006). Supplier development is especially important to critical items, those which have a high added-value or that have low supplier availability at the market (Osiro et al., 2014). The necessity of replacement or development of one supplier can be identified by a based evaluation in quantitative and multiple criteria techniques.
2.2 Criteria and techniques for suppliers performance evaluation
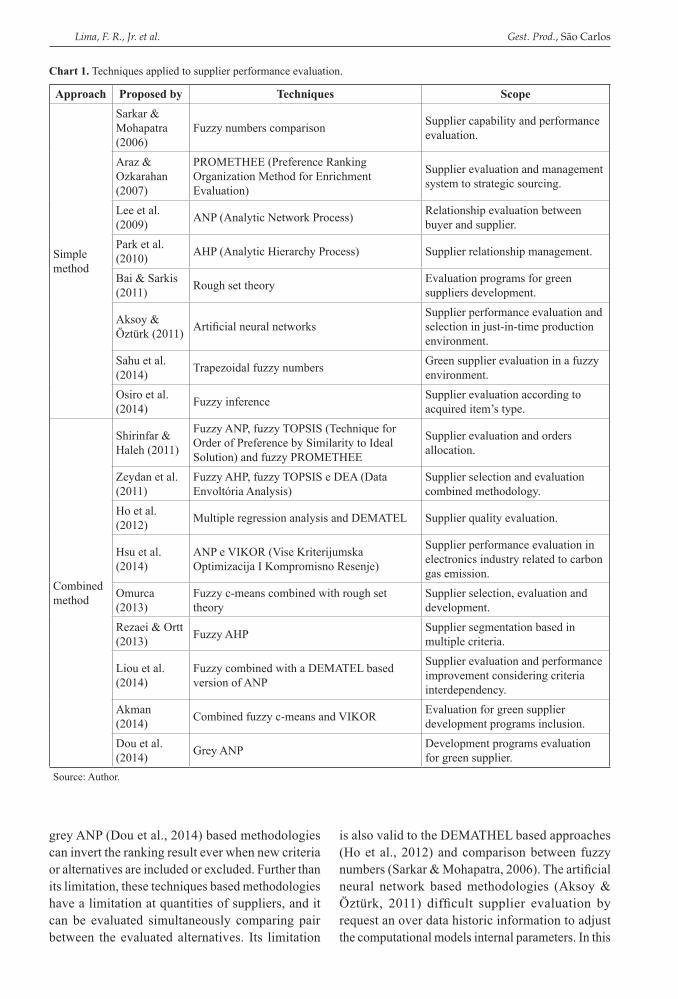
Chart 1 presents a list that proposes supportive methodologies to supplier performance evaluation from other studies. The techniques presented include multicriteria methods, such as AHP, ANP, PROMETHE and DEMATEL, and artificial intelligence techniques, such as artificial neural networks and fuzzy inference systems. As can be seen, while some approaches are one technique based, other studies combine two or more techniques to get the advantage of each one (Lima et al., 2013). This approach can be obtained by the union of different techniques to build a new one by the sequential application of different techniques in a same problem.
There are many requirements to choose and adequate technique to supplier evaluation. One of them is that it must permit the upgrade of the evaluation system, as the criteria and supplier inclusion and exclusion, without having a result inconsistency generation (Lima Junior et al., 2014ª). However, the AHP (Park et al., 2010), ANP (Hsu et al., 2014; Liou et al., 2014), fuzzy AHP (Zeydan et al., 2011; Rezaei & Ortt, 2013), fuzzy ANP (Shirinfar & Haleh, 2011) and
Figure 1. Source management framework. Source: Park et al. (2010).
Lima, F. R., Jr. et al.4 Gest. Prod., São Carlos
grey ANP (Dou et al., 2014) based methodologies can invert the ranking result ever when new criteria or alternatives are included or excluded. Further than its limitation, these techniques based methodologies have a limitation at quantities of suppliers, and it can be evaluated simultaneously comparing pair between the evaluated alternatives. Its limitation
is also valid to the DEMATHEL based approaches (Ho et al., 2012) and comparison between fuzzy numbers (Sarkar & Mohapatra, 2006). The artificial neural network based methodologies (Aksoy & Öztürk, 2011) difficult supplier evaluation by request an over data historic information to adjust the computational models internal parameters. In this
Chart 1. Techniques applied to supplier performance evaluation.
Approach Proposed by Techniques Scope
Simple method
Sarkar & Mohapatra (2006)
Fuzzy numbers comparison Supplier capability and performance evaluation.
Araz & Ozkarahan (2007)
PROMETHEE (Preference Ranking Organization Method for Enrichment Evaluation)
Supplier evaluation and management system to strategic sourcing.
Lee et al. (2009) ANP (Analytic Network Process) Relationship evaluation between
buyer and supplier.Park et al. (2010) AHP (Analytic Hierarchy Process) Supplier relationship management.
Bai & Sarkis (2011) Rough set theory Evaluation programs for green
suppliers development.
Aksoy & Öztürk (2011) Artificial neural networks
Supplier performance evaluation and selection in just-in-time production environment.
Sahu et al. (2014) Trapezoidal fuzzy numbers Green supplier evaluation in a fuzzy
environment.Osiro et al. (2014) Fuzzy inference Supplier evaluation according to
acquired item’s type.
Combined method
Shirinfar & Haleh (2011)
Fuzzy ANP, fuzzy TOPSIS (Technique for Order of Preference by Similarity to Ideal Solution) and fuzzy PROMETHEE
Supplier evaluation and orders allocation.
Zeydan et al. (2011)
Fuzzy AHP, fuzzy TOPSIS e DEA (Data Envoltória Analysis)
Supplier selection and evaluation combined methodology.
Ho et al. (2012) Multiple regression analysis and DEMATEL Supplier quality evaluation.
Hsu et al. (2014)
ANP e VIKOR (Vise Kriterijumska Optimizacija I Kompromisno Resenje)
Supplier performance evaluation in electronics industry related to carbon gas emission.
Omurca (2013)
Fuzzy c-means combined with rough set theory
Supplier selection, evaluation and development.
Rezaei & Ortt (2013) Fuzzy AHP Supplier segmentation based in
multiple criteria.
Liou et al. (2014)
Fuzzy combined with a DEMATEL based version of ANP
Supplier evaluation and performance improvement considering criteria interdependency.
Akman (2014) Combined fuzzy c-means and VIKOR Evaluation for green supplier
development programs inclusion.Dou et al. (2014) Grey ANP Development programs evaluation
for green supplier.Source: Author.
5A methodology based on fuzzy inference and SCOR® model
way, it had been verified that most part of literature approaches found to support supplier development is not entirely appropriated to this problem domain because the usage of inappropriate techniques.
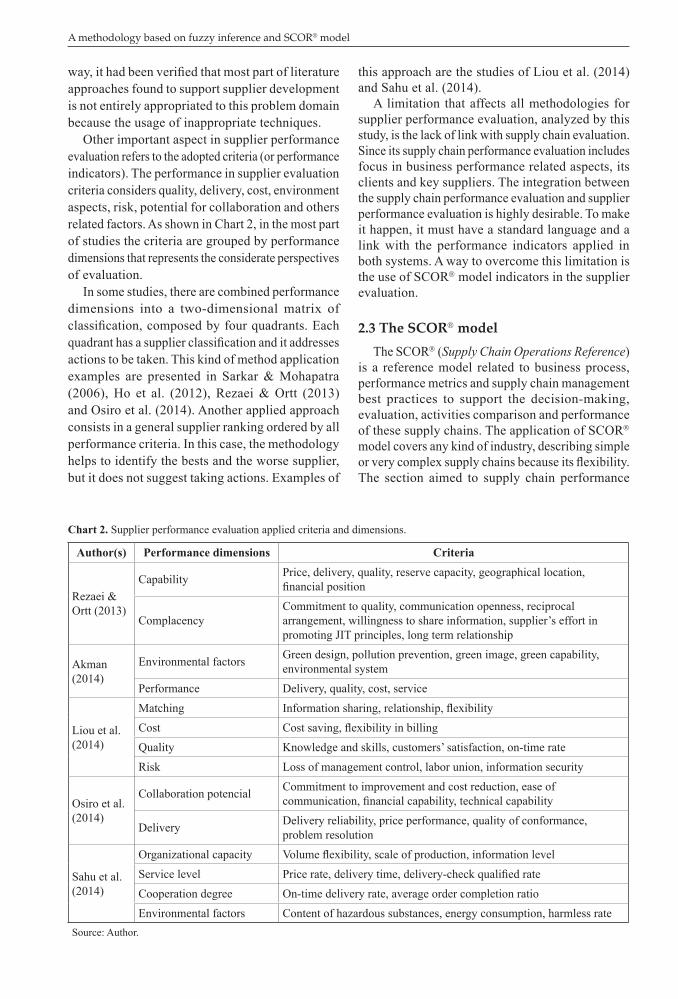
Other important aspect in supplier performance evaluation refers to the adopted criteria (or performance indicators). The performance in supplier evaluation criteria considers quality, delivery, cost, environment aspects, risk, potential for collaboration and others related factors. As shown in Chart 2, in the most part of studies the criteria are grouped by performance dimensions that represents the considerate perspectives of evaluation.
In some studies, there are combined performance dimensions into a two-dimensional matrix of classification, composed by four quadrants. Each quadrant has a supplier classification and it addresses actions to be taken. This kind of method application examples are presented in Sarkar & Mohapatra (2006), Ho et al. (2012), Rezaei & Ortt (2013) and Osiro et al. (2014). Another applied approach consists in a general supplier ranking ordered by all performance criteria. In this case, the methodology helps to identify the bests and the worse supplier, but it does not suggest taking actions. Examples of
this approach are the studies of Liou et al. (2014) and Sahu et al. (2014).
A limitation that affects all methodologies for supplier performance evaluation, analyzed by this study, is the lack of link with supply chain evaluation. Since its supply chain performance evaluation includes focus in business performance related aspects, its clients and key suppliers. The integration between the supply chain performance evaluation and supplier performance evaluation is highly desirable. To make it happen, it must have a standard language and a link with the performance indicators applied in both systems. A way to overcome this limitation is the use of SCOR model indicators in the supplier evaluation.
2.3 The SCOR modelThe SCOR (Supply Chain Operations Reference)
is a reference model related to business process, performance metrics and supply chain management best practices to support the decision-making, evaluation, activities comparison and performance of these supply chains. The application of SCOR model covers any kind of industry, describing simple or very complex supply chains because its flexibility. The section aimed to supply chain performance
Chart 2. Supplier performance evaluation applied criteria and dimensions.
Author(s) Performance dimensions Criteria
Rezaei & Ortt (2013)
Capability Price, delivery, quality, reserve capacity, geographical location, financial position
ComplacencyCommitment to quality, communication openness, reciprocal arrangement, willingness to share information, supplier’s effort in promoting JIT principles, long term relationship
Akman (2014)
Environmental factors Green design, pollution prevention, green image, green capability, environmental system
Performance Delivery, quality, cost, service
Liou et al. (2014)
Matching Information sharing, relationship, flexibilityCost Cost saving, flexibility in billingQuality Knowledge and skills, customers’ satisfaction, on-time rateRisk Loss of management control, labor union, information security
Osiro et al. (2014)
Collaboration potencial Commitment to improvement and cost reduction, ease of communication, financial capability, technical capability
Delivery Delivery reliability, price performance, quality of conformance, problem resolution
Sahu et al. (2014)
Organizational capacity Volume flexibility, scale of production, information levelService level Price rate, delivery time, delivery-check qualified rateCooperation degree On-time delivery rate, average order completion ratioEnvironmental factors Content of hazardous substances, energy consumption, harmless rate
Source: Author.
Lima, F. R., Jr. et al.6 Gest. Prod., São Carlos
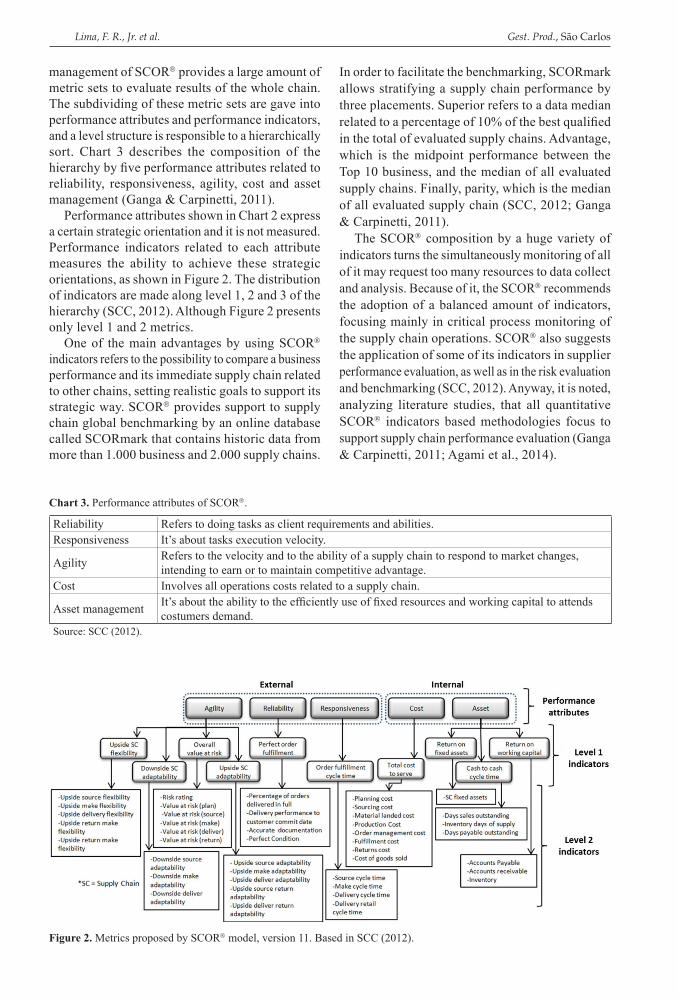
management of SCOR provides a large amount of metric sets to evaluate results of the whole chain. The subdividing of these metric sets are gave into performance attributes and performance indicators, and a level structure is responsible to a hierarchically sort. Chart 3 describes the composition of the hierarchy by five performance attributes related to reliability, responsiveness, agility, cost and asset management (Ganga & Carpinetti, 2011).
Performance attributes shown in Chart 2 express a certain strategic orientation and it is not measured. Performance indicators related to each attribute measures the ability to achieve these strategic orientations, as shown in Figure 2. The distribution of indicators are made along level 1, 2 and 3 of the hierarchy (SCC, 2012). Although Figure 2 presents only level 1 and 2 metrics.
One of the main advantages by using SCOR indicators refers to the possibility to compare a business performance and its immediate supply chain related to other chains, setting realistic goals to support its strategic way. SCOR provides support to supply chain global benchmarking by an online database called SCORmark that contains historic data from more than 1.000 business and 2.000 supply chains.
In order to facilitate the benchmarking, SCORmark allows stratifying a supply chain performance by three placements. Superior refers to a data median related to a percentage of 10% of the best qualified in the total of evaluated supply chains. Advantage, which is the midpoint performance between the Top 10 business, and the median of all evaluated supply chains. Finally, parity, which is the median of all evaluated supply chain (SCC, 2012; Ganga & Carpinetti, 2011).
The SCOR composition by a huge variety of indicators turns the simultaneously monitoring of all of it may request too many resources to data collect and analysis. Because of it, the SCOR recommends the adoption of a balanced amount of indicators, focusing mainly in critical process monitoring of the supply chain operations. SCOR also suggests the application of some of its indicators in supplier performance evaluation, as well as in the risk evaluation and benchmarking (SCC, 2012). Anyway, it is noted, analyzing literature studies, that all quantitative SCOR indicators based methodologies focus to support supply chain performance evaluation (Ganga & Carpinetti, 2011; Agami et al., 2014).
Figure 2. Metrics proposed by SCOR model, version 11. Based in SCC (2012).
Chart 3. Performance attributes of SCOR.
Reliability Refers to doing tasks as client requirements and abilities.Responsiveness It’s about tasks execution velocity.
Agility Refers to the velocity and to the ability of a supply chain to respond to market changes, intending to earn or to maintain competitive advantage.
Cost Involves all operations costs related to a supply chain.
Asset management It’s about the ability to the efficiently use of fixed resources and working capital to attends costumers demand.
Source: SCC (2012).
7A methodology based on fuzzy inference and SCOR® model
2.4 Fuzzy inference systems
2.4.1 Fuzzy set theory background
Fuzzy set theory adequation to the modeling of system which involves uncertainty and imprecision is mainly due the defining degree of inclusion logic (or pertinence) of elements in a fuzzy set. The fuzzy logic models a fuzzy set à by a pertinence function μA (x): X → [0.0, 1.0], to allow partial inclusion levels. That is, the oppose of classical set theory, where a set is defined by a characteristic function μA (x) : X → {0.0, 1.0}, the fuzzy set theory considerate values at continuous interval [0.0, 1.0] to μA (x), thus assuming the existence of intermediate levels between belonging values “false” (0.0) and “true” (1.0). This way, Equation 1 represents, each one of the elements value of x-axis representation inside fuzzy set domain à given by a crisp value (x) and a belonging degree μA (x) (Zimmermann, 1991, Pedrycz & Gomide, 2007).
( ){ }AÃ , / Xx x x= µ ∈ (1)
Fuzzy sets constitute fuzzy numbers and it attends the geometrical convexity and normality properties.
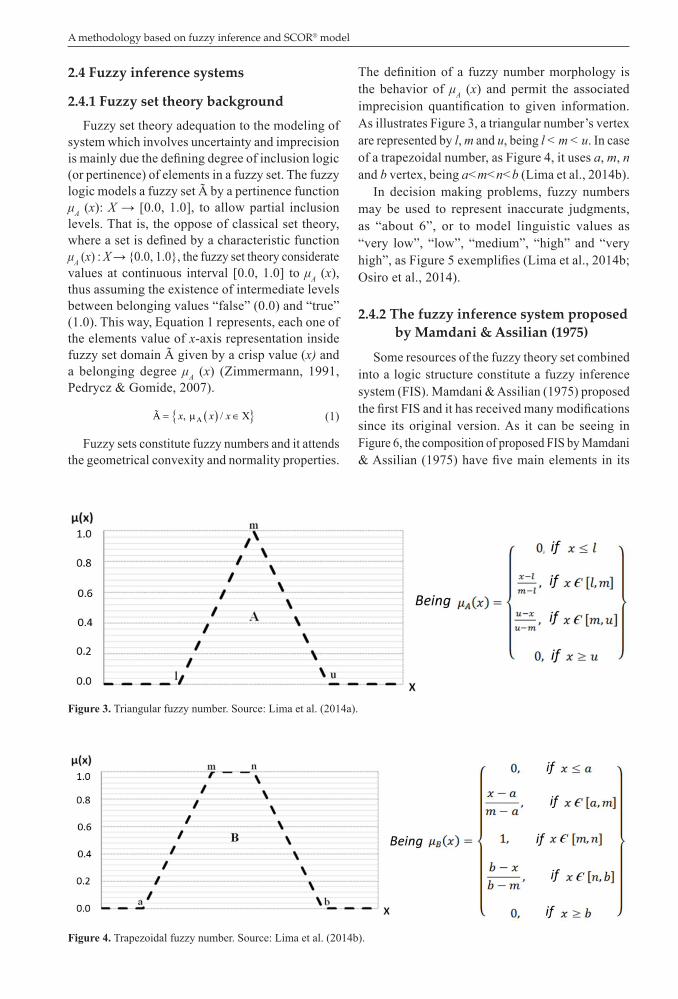
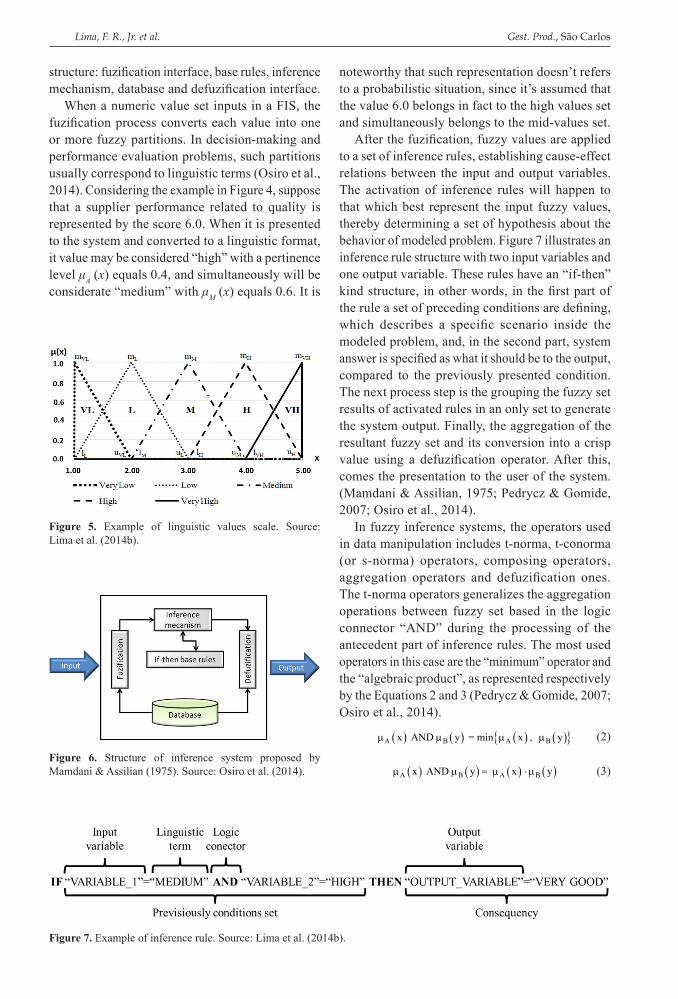
The definition of a fuzzy number morphology is the behavior of μA (x) and permit the associated imprecision quantification to given information. As illustrates Figure 3, a triangular number’s vertex are represented by l, m and u, being l < m < u. In case of a trapezoidal number, as Figure 4, it uses a, m, n and b vertex, being a<m<n<b (Lima et al., 2014b).
In decision making problems, fuzzy numbers may be used to represent inaccurate judgments, as “about 6”, or to model linguistic values as “very low”, “low”, “medium”, “high” and “very high”, as Figure 5 exemplifies (Lima et al., 2014b; Osiro et al., 2014).
2.4.2 The fuzzy inference system proposed by Mamdani & Assilian (1975)
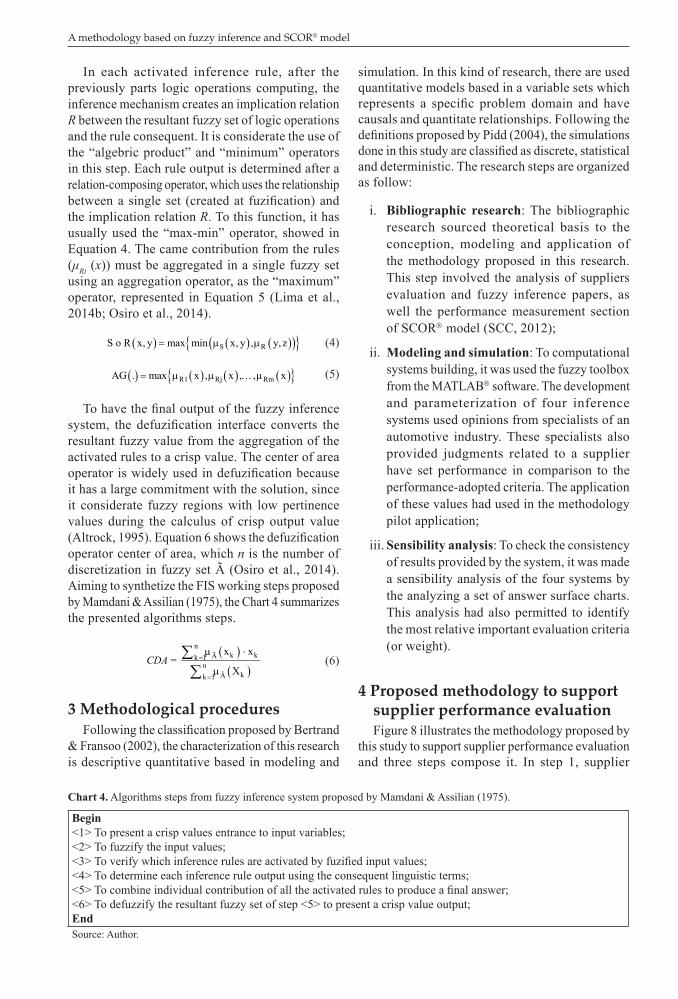
Some resources of the fuzzy theory set combined into a logic structure constitute a fuzzy inference system (FIS). Mamdani & Assilian (1975) proposed the first FIS and it has received many modifications since its original version. As it can be seeing in Figure 6, the composition of proposed FIS by Mamdani & Assilian (1975) have five main elements in its
Figure 4. Trapezoidal fuzzy number. Source: Lima et al. (2014b).
Figure 3. Triangular fuzzy number. Source: Lima et al. (2014a).
Lima, F. R., Jr. et al.8 Gest. Prod., São Carlos
structure: fuzification interface, base rules, inference mechanism, database and defuzification interface.
When a numeric value set inputs in a FIS, the fuzification process converts each value into one or more fuzzy partitions. In decision-making and performance evaluation problems, such partitions usually correspond to linguistic terms (Osiro et al., 2014). Considering the example in Figure 4, suppose that a supplier performance related to quality is represented by the score 6.0. When it is presented to the system and converted to a linguistic format, it value may be considered “high” with a pertinence level μA (x) equals 0.4, and simultaneously will be considerate “medium” with μM (x) equals 0.6. It is
noteworthy that such representation doesn’t refers to a probabilistic situation, since it’s assumed that the value 6.0 belongs in fact to the high values set and simultaneously belongs to the mid-values set.
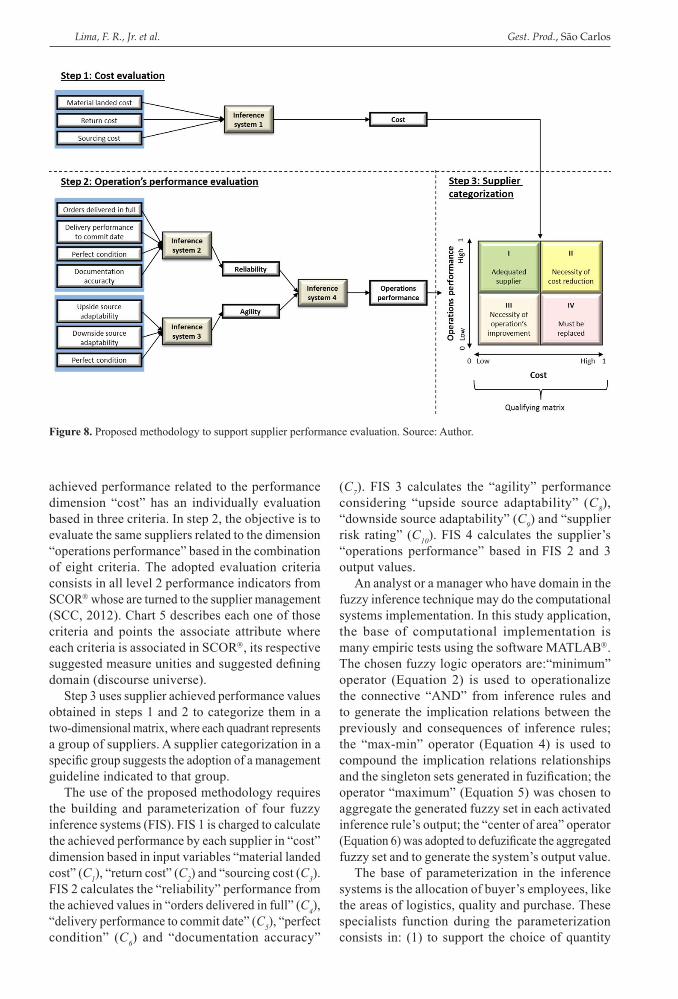
After the fuzification, fuzzy values are applied to a set of inference rules, establishing cause-effect relations between the input and output variables. The activation of inference rules will happen to that which best represent the input fuzzy values, thereby determining a set of hypothesis about the behavior of modeled problem. Figure 7 illustrates an inference rule structure with two input variables and one output variable. These rules have an “if-then” kind structure, in other words, in the first part of the rule a set of preceding conditions are defining, which describes a specific scenario inside the modeled problem, and, in the second part, system answer is specified as what it should be to the output, compared to the previously presented condition. The next process step is the grouping the fuzzy set results of activated rules in an only set to generate the system output. Finally, the aggregation of the resultant fuzzy set and its conversion into a crisp value using a defuzification operator. After this, comes the presentation to the user of the system. (Mamdani & Assilian, 1975; Pedrycz & Gomide, 2007; Osiro et al., 2014).
In fuzzy inference systems, the operators used in data manipulation includes t-norma, t-conorma (or s-norma) operators, composing operators, aggregation operators and defuzification ones. The t-norma operators generalizes the aggregation operations between fuzzy set based in the logic connector “AND” during the processing of the antecedent part of inference rules. The most used operators in this case are the “minimum” operator and the “algebraic product”, as represented respectively by the Equations 2 and 3 (Pedrycz & Gomide, 2007; Osiro et al., 2014).
( ) ( ) ( ) ( ){ }A B A Bx AND y = min x , yµ µ µ µ (2)
( ) ( ) ( ) ( )A B A Bx AND y x yµ µ = µ ⋅µ (3)
Figure 5. Example of linguistic values scale. Source: Lima et al. (2014b).
Figure 7. Example of inference rule. Source: Lima et al. (2014b).
Figure 6. Structure of inference system proposed by Mamdani & Assilian (1975). Source: Osiro et al. (2014).
9A methodology based on fuzzy inference and SCOR® model
In each activated inference rule, after the previously parts logic operations computing, the inference mechanism creates an implication relation R between the resultant fuzzy set of logic operations and the rule consequent. It is considerate the use of the “algebric product” and “minimum” operators in this step. Each rule output is determined after a relation-composing operator, which uses the relationship between a single set (created at fuzification) and the implication relation R. To this function, it has usually used the “max-min” operator, showed in Equation 4. The came contribution from the rules (μRi (x)) must be aggregated in a single fuzzy set using an aggregation operator, as the “maximum” operator, represented in Equation 5 (Lima et al., 2014b; Osiro et al., 2014).
( ) ( ) ( )( ){ }S RS o R x, y max min x, y , y, z= µ µ (4)
( ) ( ) ( ) ( ){ }R1 Rj RmAG . max x , x , , x= µ µ … µ (5)
To have the final output of the fuzzy inference system, the defuzification interface converts the resultant fuzzy value from the aggregation of the activated rules to a crisp value. The center of area operator is widely used in defuzification because it has a large commitment with the solution, since it considerate fuzzy regions with low pertinence values during the calculus of crisp output value (Altrock, 1995). Equation 6 shows the defuzification operator center of area, which n is the number of discretization in fuzzy set à (Osiro et al., 2014). Aiming to synthetize the FIS working steps proposed by Mamdani & Assilian (1975), the Chart 4 summarizes the presented algorithms steps.
( )( )
nk kÃk 1
nkÃk 1
x x =
X CDA =
=
µ ⋅
µ
∑∑
(6)
3 Methodological proceduresFollowing the classification proposed by Bertrand
& Fransoo (2002), the characterization of this research is descriptive quantitative based in modeling and
simulation. In this kind of research, there are used quantitative models based in a variable sets which represents a specific problem domain and have causals and quantitate relationships. Following the definitions proposed by Pidd (2004), the simulations done in this study are classified as discrete, statistical and deterministic. The research steps are organized as follow:
i. Bibliographic research: The bibliographic research sourced theoretical basis to the conception, modeling and application of the methodology proposed in this research. This step involved the analysis of suppliers evaluation and fuzzy inference papers, as well the performance measurement section of SCOR model (SCC, 2012);
ii. Modeling and simulation: To computational systems building, it was used the fuzzy toolbox from the MATLAB software. The development and parameterization of four inference systems used opinions from specialists of an automotive industry. These specialists also provided judgments related to a supplier have set performance in comparison to the performance-adopted criteria. The application of these values had used in the methodology pilot application;
iii. Sensibility analysis: To check the consistency of results provided by the system, it was made a sensibility analysis of the four systems by the analyzing a set of answer surface charts. This analysis had also permitted to identify the most relative important evaluation criteria (or weight).
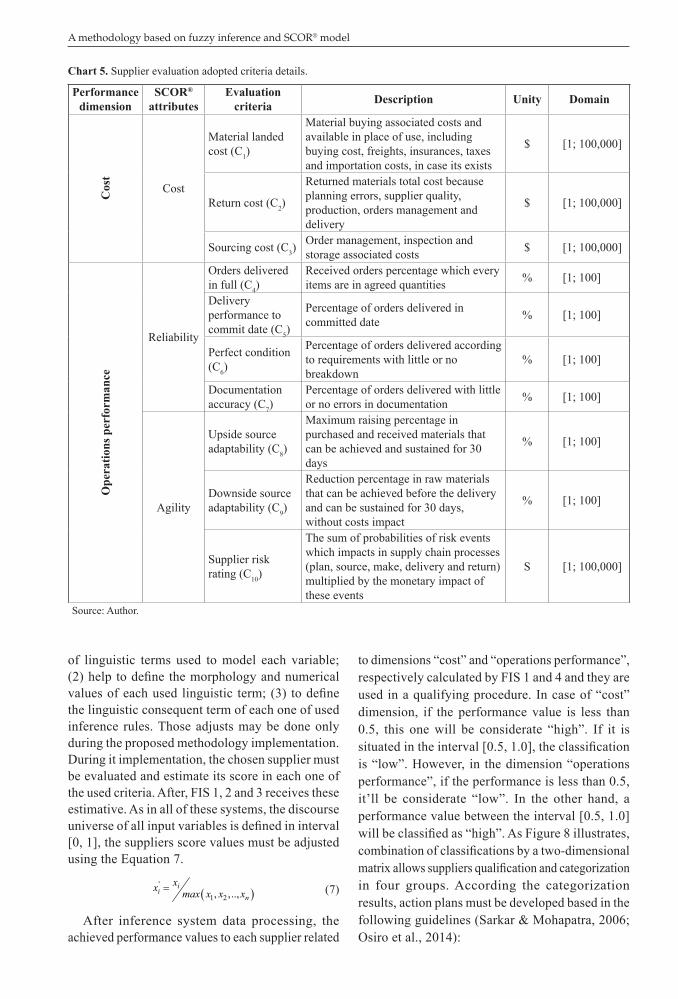
4 Proposed methodology to support supplier performance evaluationFigure 8 illustrates the methodology proposed by
this study to support supplier performance evaluation and three steps compose it. In step 1, supplier
Chart 4. Algorithms steps from fuzzy inference system proposed by Mamdani & Assilian (1975).
Begin<1> To present a crisp values entrance to input variables;<2> To fuzzify the input values;<3> To verify which inference rules are activated by fuzified input values;<4> To determine each inference rule output using the consequent linguistic terms;<5> To combine individual contribution of all the activated rules to produce a final answer;<6> To defuzzify the resultant fuzzy set of step <5> to present a crisp value output;EndSource: Author.
Lima, F. R., Jr. et al.10 Gest. Prod., São Carlos
achieved performance related to the performance dimension “cost” has an individually evaluation based in three criteria. In step 2, the objective is to evaluate the same suppliers related to the dimension “operations performance” based in the combination of eight criteria. The adopted evaluation criteria consists in all level 2 performance indicators from SCOR whose are turned to the supplier management (SCC, 2012). Chart 5 describes each one of those criteria and points the associate attribute where each criteria is associated in SCOR, its respective suggested measure unities and suggested defining domain (discourse universe).
Step 3 uses supplier achieved performance values obtained in steps 1 and 2 to categorize them in a two-dimensional matrix, where each quadrant represents a group of suppliers. A supplier categorization in a specific group suggests the adoption of a management guideline indicated to that group.
The use of the proposed methodology requires the building and parameterization of four fuzzy inference systems (FIS). FIS 1 is charged to calculate the achieved performance by each supplier in “cost” dimension based in input variables “material landed cost” (C1), “return cost” (C2) and “sourcing cost (C3). FIS 2 calculates the “reliability” performance from the achieved values in “orders delivered in full” (C4), “delivery performance to commit date” (C5), “perfect condition” (C6) and “documentation accuracy”
(C7). FIS 3 calculates the “agility” performance considering “upside source adaptability” (C8), “downside source adaptability” (C9) and “supplier risk rating” (C10). FIS 4 calculates the supplier’s “operations performance” based in FIS 2 and 3 output values.
An analyst or a manager who have domain in the fuzzy inference technique may do the computational systems implementation. In this study application, the base of computational implementation is many empiric tests using the software MATLAB. The chosen fuzzy logic operators are:“minimum” operator (Equation 2) is used to operationalize the connective “AND” from inference rules and to generate the implication relations between the previously and consequences of inference rules; the “max-min” operator (Equation 4) is used to compound the implication relations relationships and the singleton sets generated in fuzification; the operator “maximum” (Equation 5) was chosen to aggregate the generated fuzzy set in each activated inference rule’s output; the “center of area” operator (Equation 6) was adopted to defuzificate the aggregated fuzzy set and to generate the system’s output value.
The base of parameterization in the inference systems is the allocation of buyer’s employees, like the areas of logistics, quality and purchase. These specialists function during the parameterization consists in: (1) to support the choice of quantity
Figure 8. Proposed methodology to support supplier performance evaluation. Source: Author.
11A methodology based on fuzzy inference and SCOR® model
of linguistic terms used to model each variable; (2) help to define the morphology and numerical values of each used linguistic term; (3) to define the linguistic consequent term of each one of used inference rules. Those adjusts may be done only during the proposed methodology implementation. During it implementation, the chosen supplier must be evaluated and estimate its score in each one of the used criteria. After, FIS 1, 2 and 3 receives these estimative. As in all of these systems, the discourse universe of all input variables is defined in interval [0, 1], the suppliers score values must be adjusted using the Equation 7.
( )'
1 2, ,.., i
in
xx max x x x= (7)
After inference system data processing, the achieved performance values to each supplier related
to dimensions “cost” and “operations performance”, respectively calculated by FIS 1 and 4 and they are used in a qualifying procedure. In case of “cost” dimension, if the performance value is less than 0.5, this one will be considerate “high”. If it is situated in the interval [0.5, 1.0], the classification is “low”. However, in the dimension “operations performance”, if the performance is less than 0.5, it’ll be considerate “low”. In the other hand, a performance value between the interval [0.5, 1.0] will be classified as “high”. As Figure 8 illustrates, combination of classifications by a two-dimensional matrix allows suppliers qualification and categorization in four groups. According the categorization results, action plans must be developed based in the following guidelines (Sarkar & Mohapatra, 2006; Osiro et al., 2014):
Chart 5. Supplier evaluation adopted criteria details.
Performance dimension
SCOR® attributes
Evaluation criteria Description Unity Domain
Cos
t
Cost
Material landed cost (C1)
Material buying associated costs and available in place of use, including buying cost, freights, insurances, taxes and importation costs, in case its exists
$ [1; 100,000]
Return cost (C2)
Returned materials total cost because planning errors, supplier quality, production, orders management and delivery
$ [1; 100,000]
Sourcing cost (C3)Order management, inspection and storage associated costs $ [1; 100,000]
Ope
ratio
ns p
erfo
rman
ce
Reliability
Orders delivered in full (C4)
Received orders percentage which every items are in agreed quantities % [1; 100]
Delivery performance to commit date (C5)
Percentage of orders delivered in committed date % [1; 100]
Perfect condition (C6)
Percentage of orders delivered according to requirements with little or no breakdown
% [1; 100]
Documentation accuracy (C7)
Percentage of orders delivered with little or no errors in documentation % [1; 100]
Agility
Upside source adaptability (C8)
Maximum raising percentage in purchased and received materials that can be achieved and sustained for 30 days
% [1; 100]
Downside source adaptability (C9)
Reduction percentage in raw materials that can be achieved before the delivery and can be sustained for 30 days, without costs impact
% [1; 100]
Supplier risk rating (C10)
The sum of probabilities of risk events which impacts in supply chain processes(plan, source, make, delivery and return) multiplied by the monetary impact of these events
S [1; 100,000]
Source: Author.
Lima, F. R., Jr. et al.12 Gest. Prod., São Carlos
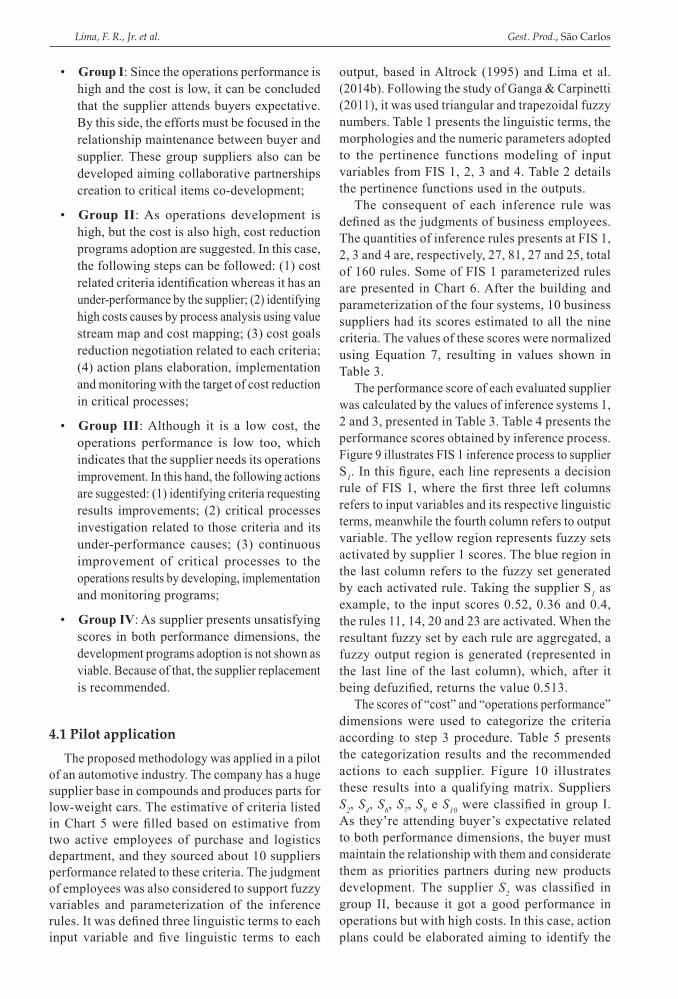
• Group I: Since the operations performance is high and the cost is low, it can be concluded that the supplier attends buyers expectative. By this side, the efforts must be focused in the relationship maintenance between buyer and supplier. These group suppliers also can be developed aiming collaborative partnerships creation to critical items co-development;
• Group II: As operations development is high, but the cost is also high, cost reduction programs adoption are suggested. In this case, the following steps can be followed: (1) cost related criteria identification whereas it has an under-performance by the supplier; (2) identifying high costs causes by process analysis using value stream map and cost mapping; (3) cost goals reduction negotiation related to each criteria; (4) action plans elaboration, implementation and monitoring with the target of cost reduction in critical processes;
• Group III: Although it is a low cost, the operations performance is low too, which indicates that the supplier needs its operations improvement. In this hand, the following actions are suggested: (1) identifying criteria requesting results improvements; (2) critical processes investigation related to those criteria and its under-performance causes; (3) continuous improvement of critical processes to the operations results by developing, implementation and monitoring programs;
• Group IV: As supplier presents unsatisfying scores in both performance dimensions, the development programs adoption is not shown as viable. Because of that, the supplier replacement is recommended.
4.1 Pilot application
The proposed methodology was applied in a pilot of an automotive industry. The company has a huge supplier base in compounds and produces parts for low-weight cars. The estimative of criteria listed in Chart 5 were filled based on estimative from two active employees of purchase and logistics department, and they sourced about 10 suppliers performance related to these criteria. The judgment of employees was also considered to support fuzzy variables and parameterization of the inference rules. It was defined three linguistic terms to each input variable and five linguistic terms to each
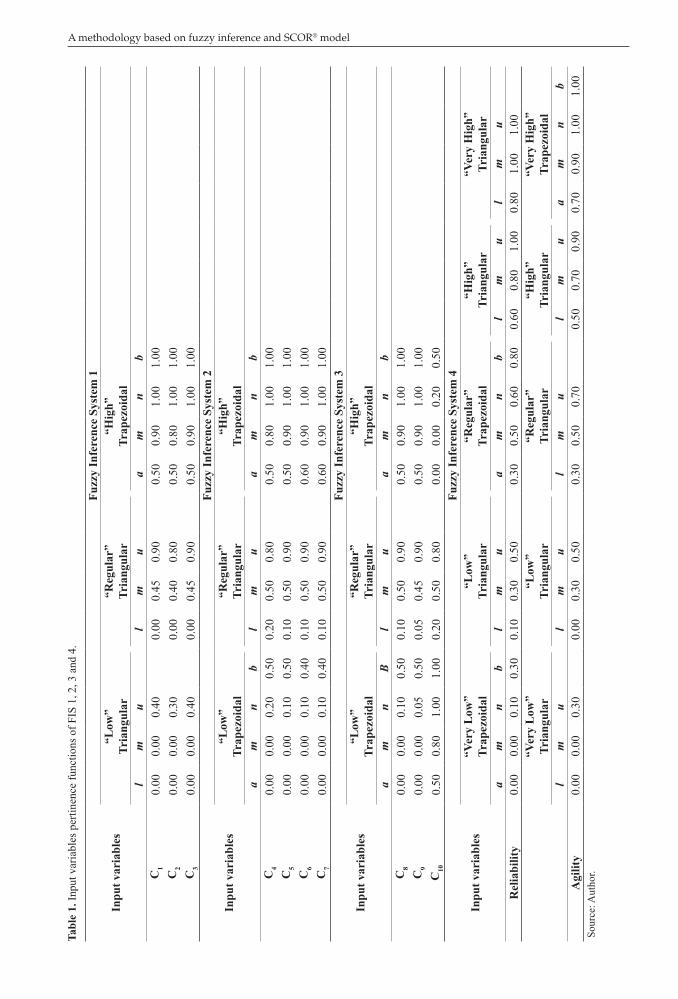
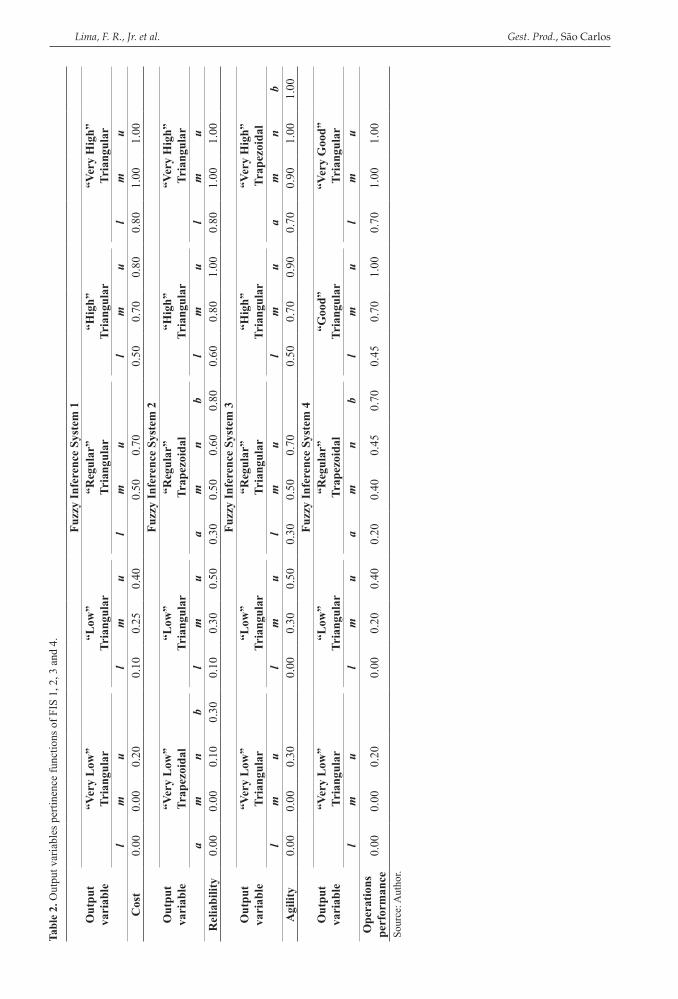
output, based in Altrock (1995) and Lima et al. (2014b). Following the study of Ganga & Carpinetti (2011), it was used triangular and trapezoidal fuzzy numbers. Table 1 presents the linguistic terms, the morphologies and the numeric parameters adopted to the pertinence functions modeling of input variables from FIS 1, 2, 3 and 4. Table 2 details the pertinence functions used in the outputs.
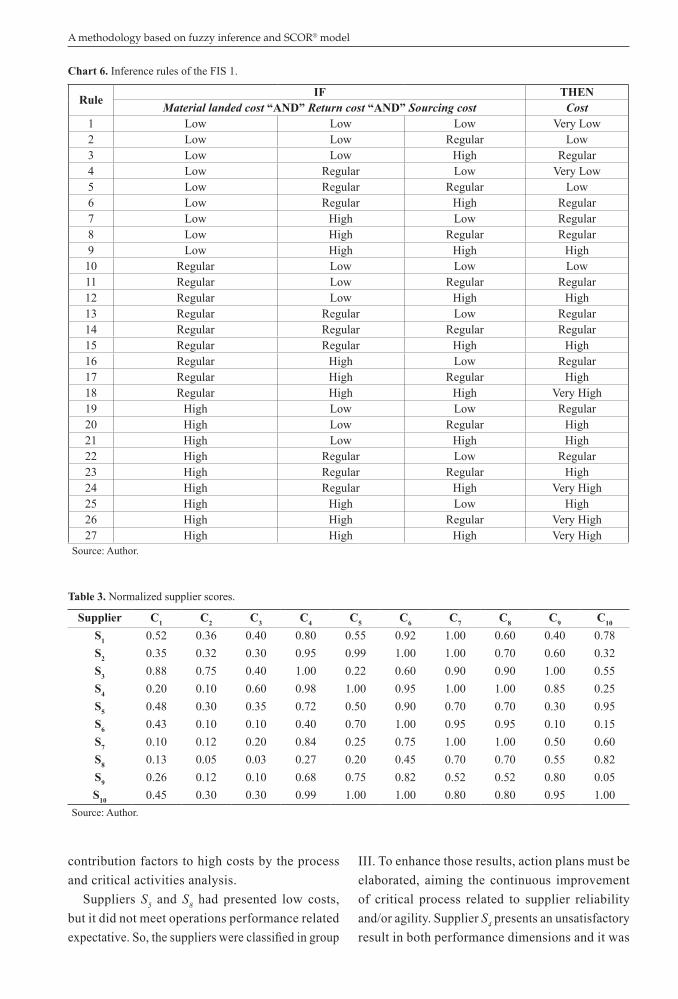
The consequent of each inference rule was defined as the judgments of business employees. The quantities of inference rules presents at FIS 1, 2, 3 and 4 are, respectively, 27, 81, 27 and 25, total of 160 rules. Some of FIS 1 parameterized rules are presented in Chart 6. After the building and parameterization of the four systems, 10 business suppliers had its scores estimated to all the nine criteria. The values of these scores were normalized using Equation 7, resulting in values shown in Table 3.
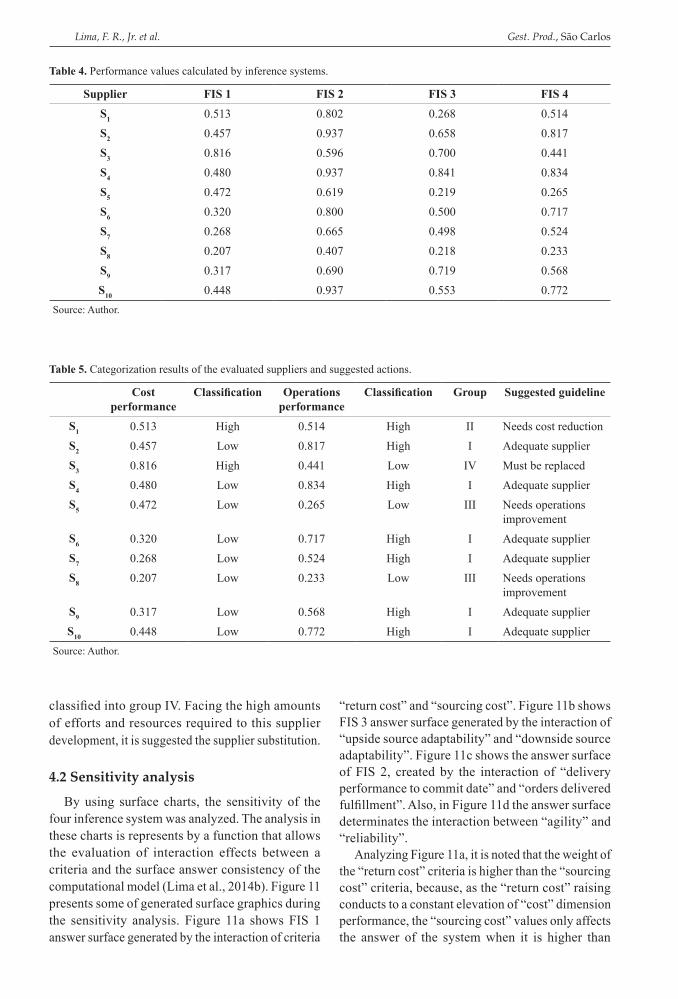
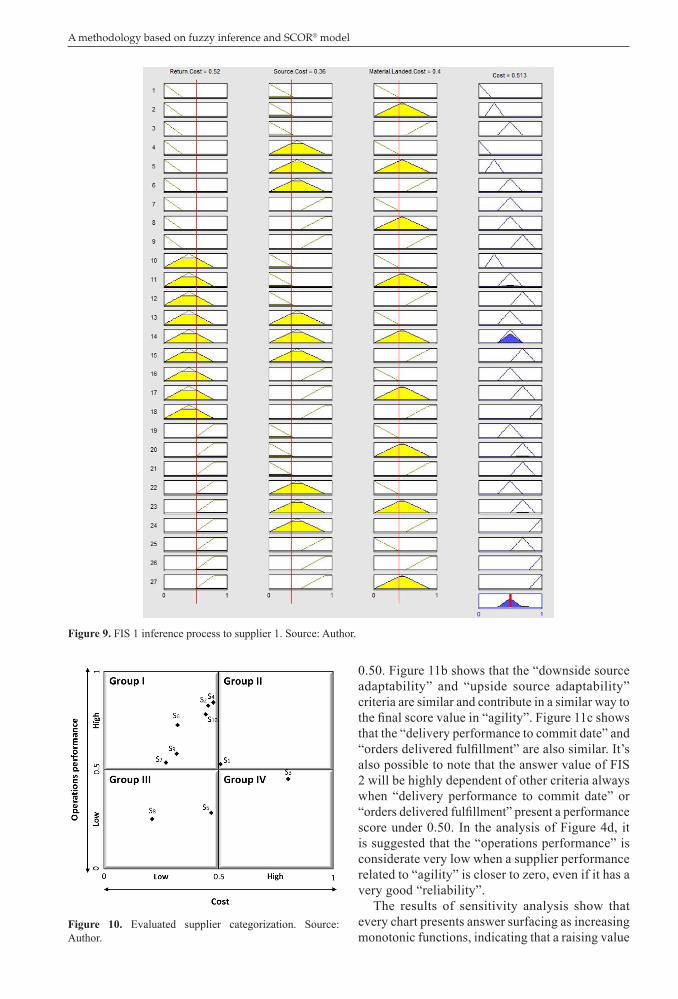
The performance score of each evaluated supplier was calculated by the values of inference systems 1, 2 and 3, presented in Table 3. Table 4 presents the performance scores obtained by inference process. Figure 9 illustrates FIS 1 inference process to supplier S1. In this figure, each line represents a decision rule of FIS 1, where the first three left columns refers to input variables and its respective linguistic terms, meanwhile the fourth column refers to output variable. The yellow region represents fuzzy sets activated by supplier 1 scores. The blue region in the last column refers to the fuzzy set generated by each activated rule. Taking the supplier S1 as example, to the input scores 0.52, 0.36 and 0.4, the rules 11, 14, 20 and 23 are activated. When the resultant fuzzy set by each rule are aggregated, a fuzzy output region is generated (represented in the last line of the last column), which, after it being defuzified, returns the value 0.513.
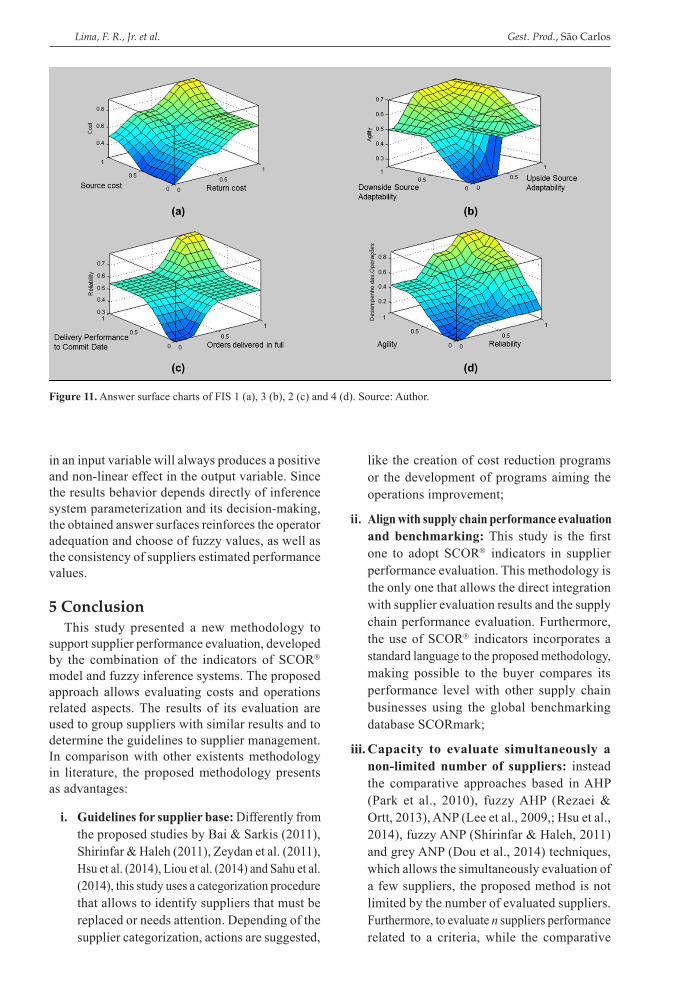
The scores of “cost” and “operations performance” dimensions were used to categorize the criteria according to step 3 procedure. Table 5 presents the categorization results and the recommended actions to each supplier. Figure 10 illustrates these results into a qualifying matrix. Suppliers S2, S4, S6, S7, S9 e S10 were classified in group I. As they’re attending buyer’s expectative related to both performance dimensions, the buyer must maintain the relationship with them and considerate them as priorities partners during new products development. The supplier S2 was classified in group II, because it got a good performance in operations but with high costs. In this case, action plans could be elaborated aiming to identify the
13A methodology based on fuzzy inference and SCOR® model
Tabl
e 1.
Inpu
t var
iabl
es p
ertin
ence
func
tions
of F
IS 1
, 2, 3
and
4.
Inpu
t var
iabl
es
Fuzz
y In
fere
nce
Syst
em 1
“Low
”Tr
iang
ular
“Reg
ular
”Tr
iang
ular
“Hig
h”Tr
apez
oida
ll
mu
lm
ua
mn
bC
10.
000.
000.
400.
000.
450.
900.
500.
901.
001.
00C
20.
000.
000.
300.
000.
400.
800.
500.
801.
001.
00C
30.
000.
000.
400.
000.
450.
900.
500.
901.
001.
00
Inpu
t var
iabl
es
Fuzz
y In
fere
nce
Syst
em 2
“Low
”Tr
apez
oida
l“R
egul
ar”
Tria
ngul
ar“H
igh”
Trap
ezoi
dal
am
nb
lm
ua
mn
bC
40.
000.
000.
200.
500.
200.
500.
800.
500.
801.
001.
00C
50.
000.
000.
100.
500.
100.
500.
900.
500.
901.
001.
00C
60.
000.
000.
100.
400.
100.
500.
900.
600.
901.
001.
00C
70.
000.
000.
100.
400.
100.
500.
900.
600.
901.
001.
00
Inpu
t var
iabl
es
Fuzz
y In
fere
nce
Syst
em 3
“Low
”Tr
apez
oida
l“R
egul
ar”
Tria
ngul
ar“H
igh”
Trap
ezoi
dal
am
nB
lm
ua
mn
bC
80.
000.
000.
100.
500.
100.
500.
900.
500.
901.
001.
00C
90.
000.
000.
050.
500.
050.
450.
900.
500.
901.
001.
00C
100.
500.
801.
001.
000.
200.
500.
800.
000.
000.
200.
50
Inpu
t var
iabl
es
Fuzz
y In
fere
nce
Syst
em 4
“Ver
y L
ow”
Trap
ezoi
dal
“Low
”Tr
iang
ular
“Reg
ular
”Tr
apez
oida
l“H
igh”
Tria
ngul
ar“V
ery
Hig
h”Tr
iang
ular
am
nb
lm
ua
mn
bl
mu
lm
uR
elia
bilit
y0.
000.
000.
100.
300.
100.
300.
500.
300.
500.
600.
800.
600.
801.
000.
801.
001.
00“V
ery
Low
”Tr
iang
ular
“Low
”Tr
iang
ular
“Reg
ular
”Tr
iang
ular
“Hig
h”Tr
iang
ular
“Ver
y H
igh”
Trap
ezoi
dal
lm
ul
mu
lm
ul
mu
am
nb
Agi
lity
0.00
0.00
0.30
0.00
0.30
0.50
0.30
0.50
0.70
0.50
0.70
0.90
0.70
0.90
1.00
1.00
Sour
ce: A
utho
r.
Lima, F. R., Jr. et al.14 Gest. Prod., São Carlos Ta
ble
2. O
utpu
t var
iabl
es p
ertin
ence
func
tions
of F
IS 1
, 2, 3
and
4.
Out
put
vari
able
Fuzz
y In
fere
nce
Syst
em 1
“Ver
y L
ow”
Tria
ngul
ar“L
ow”
Tria
ngul
ar“R
egul
ar”
Tria
ngul
ar“H
igh”
Tria
ngul
ar“V
ery
Hig
h”Tr
iang
ular
lm
ul
mu
lm
ul
mu
lm
uC
ost
0.00
0.00
0.20
0.10
0.25
0.40
0.50
0.70
0.50
0.70
0.80
0.80
1.00
1.00
Out
put
vari
able
Fuzz
y In
fere
nce
Syst
em 2
“Ver
y L
ow”
Trap
ezoi
dal
“Low
”Tr
iang
ular
“Reg
ular
”Tr
apez
oida
l“H
igh”
Tria
ngul
ar“V
ery
Hig
h”Tr
iang
ular
am
nb
lm
ua
mn
bl
mu
lm
uR
elia
bilit
y0.
000.
000.
100.
300.
100.
300.
500.
300.
500.
600.
800.
600.
801.
000.
801.
001.
00
Out
put
vari
able
Fuzz
y In
fere
nce
Syst
em 3
“Ver
y L
ow”
Tria
ngul
ar“L
ow”
Tria
ngul
ar“R
egul
ar”
Tria
ngul
ar“H
igh”
Tria
ngul
ar“V
ery
Hig
h”Tr
apez
oida
ll
mu
lm
ul
mu
lm
ua
mn
bA
gilit
y0.
000.
000.
300.
000.
300.
500.
300.
500.
700.
500.
700.
900.
700.
901.
001.
00
Out
put
vari
able
Fuzz
y In
fere
nce
Syst
em 4
“Ver
y L
ow”
Tria
ngul
ar“L
ow”
Tria
ngul
ar“R
egul
ar”
Trap
ezoi
dal
“Goo
d”Tr
iang
ular
“Ver
y G
ood”
Tria
ngul
arl
mu
lm
ua
mn
bl
mu
lm
uO
pera
tions
pe
rfor
man
ce0.
000.
000.
200.
000.
200.
400.
200.
400.
450.
700.
450.
701.
000.
701.
001.
00
Sour
ce: A
utho
r.
15A methodology based on fuzzy inference and SCOR® model
contribution factors to high costs by the process and critical activities analysis.
Suppliers S5 and S8 had presented low costs, but it did not meet operations performance related expectative. So, the suppliers were classified in group
III. To enhance those results, action plans must be elaborated, aiming the continuous improvement of critical process related to supplier reliability and/or agility. Supplier S4 presents an unsatisfactory result in both performance dimensions and it was
Chart 6. Inference rules of the FIS 1.
Rule IF THENMaterial landed cost “AND” Return cost “AND” Sourcing cost Cost
1 Low Low Low Very Low2 Low Low Regular Low3 Low Low High Regular4 Low Regular Low Very Low5 Low Regular Regular Low6 Low Regular High Regular7 Low High Low Regular8 Low High Regular Regular9 Low High High High
10 Regular Low Low Low11 Regular Low Regular Regular12 Regular Low High High13 Regular Regular Low Regular14 Regular Regular Regular Regular15 Regular Regular High High16 Regular High Low Regular17 Regular High Regular High18 Regular High High Very High19 High Low Low Regular20 High Low Regular High21 High Low High High22 High Regular Low Regular23 High Regular Regular High24 High Regular High Very High25 High High Low High26 High High Regular Very High27 High High High Very High
Source: Author.
Table 3. Normalized supplier scores.
Supplier C1 C2 C3 C4 C5 C6 C7 C8 C9 C10
S1 0.52 0.36 0.40 0.80 0.55 0.92 1.00 0.60 0.40 0.78S2 0.35 0.32 0.30 0.95 0.99 1.00 1.00 0.70 0.60 0.32S3 0.88 0.75 0.40 1.00 0.22 0.60 0.90 0.90 1.00 0.55S4 0.20 0.10 0.60 0.98 1.00 0.95 1.00 1.00 0.85 0.25S5 0.48 0.30 0.35 0.72 0.50 0.90 0.70 0.70 0.30 0.95S6 0.43 0.10 0.10 0.40 0.70 1.00 0.95 0.95 0.10 0.15S7 0.10 0.12 0.20 0.84 0.25 0.75 1.00 1.00 0.50 0.60S8 0.13 0.05 0.03 0.27 0.20 0.45 0.70 0.70 0.55 0.82S9 0.26 0.12 0.10 0.68 0.75 0.82 0.52 0.52 0.80 0.05S10 0.45 0.30 0.30 0.99 1.00 1.00 0.80 0.80 0.95 1.00
Source: Author.
Lima, F. R., Jr. et al.16 Gest. Prod., São Carlos
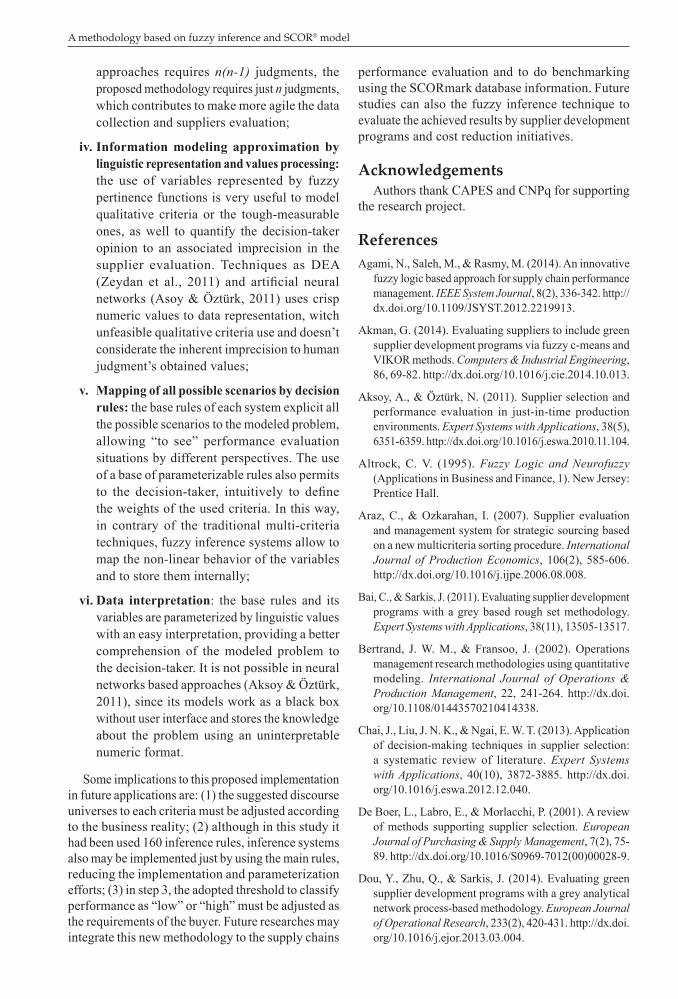
“return cost” and “sourcing cost”. Figure 11b shows FIS 3 answer surface generated by the interaction of “upside source adaptability” and “downside source adaptability”. Figure 11c shows the answer surface of FIS 2, created by the interaction of “delivery performance to commit date” and “orders delivered fulfillment”. Also, in Figure 11d the answer surface determinates the interaction between “agility” and “reliability”.
Analyzing Figure 11a, it is noted that the weight of the “return cost” criteria is higher than the “sourcing cost” criteria, because, as the “return cost” raising conducts to a constant elevation of “cost” dimension performance, the “sourcing cost” values only affects the answer of the system when it is higher than
classified into group IV. Facing the high amounts of efforts and resources required to this supplier development, it is suggested the supplier substitution.
4.2 Sensitivity analysis
By using surface charts, the sensitivity of the four inference system was analyzed. The analysis in these charts is represents by a function that allows the evaluation of interaction effects between a criteria and the surface answer consistency of the computational model (Lima et al., 2014b). Figure 11 presents some of generated surface graphics during the sensitivity analysis. Figure 11a shows FIS 1 answer surface generated by the interaction of criteria
Table 4. Performance values calculated by inference systems.
Supplier FIS 1 FIS 2 FIS 3 FIS 4S1 0.513 0.802 0.268 0.514S2 0.457 0.937 0.658 0.817S3 0.816 0.596 0.700 0.441S4 0.480 0.937 0.841 0.834S5 0.472 0.619 0.219 0.265S6 0.320 0.800 0.500 0.717S7 0.268 0.665 0.498 0.524S8 0.207 0.407 0.218 0.233S9 0.317 0.690 0.719 0.568S10 0.448 0.937 0.553 0.772
Source: Author.
Table 5. Categorization results of the evaluated suppliers and suggested actions.
Cost performance
Classification Operations performance
Classification Group Suggested guideline
S1 0.513 High 0.514 High II Needs cost reductionS2 0.457 Low 0.817 High I Adequate supplierS3 0.816 High 0.441 Low IV Must be replacedS4 0.480 Low 0.834 High I Adequate supplierS5 0.472 Low 0.265 Low III Needs operations
improvementS6 0.320 Low 0.717 High I Adequate supplierS7 0.268 Low 0.524 High I Adequate supplierS8 0.207 Low 0.233 Low III Needs operations
improvementS9 0.317 Low 0.568 High I Adequate supplierS10 0.448 Low 0.772 High I Adequate supplier
Source: Author.
17A methodology based on fuzzy inference and SCOR® model
Figure 9. FIS 1 inference process to supplier 1. Source: Author.
Figure 10. Evaluated supplier categorization. Source: Author.
0.50. Figure 11b shows that the “downside source adaptability” and “upside source adaptability” criteria are similar and contribute in a similar way to the final score value in “agility”. Figure 11c shows that the “delivery performance to commit date” and “orders delivered fulfillment” are also similar. It’s also possible to note that the answer value of FIS 2 will be highly dependent of other criteria always when “delivery performance to commit date” or “orders delivered fulfillment” present a performance score under 0.50. In the analysis of Figure 4d, it is suggested that the “operations performance” is considerate very low when a supplier performance related to “agility” is closer to zero, even if it has a very good “reliability”.
The results of sensitivity analysis show that every chart presents answer surfacing as increasing monotonic functions, indicating that a raising value
Lima, F. R., Jr. et al.18 Gest. Prod., São Carlos
like the creation of cost reduction programs or the development of programs aiming the operations improvement;
ii. Align with supply chain performance evaluation and benchmarking: This study is the first one to adopt SCOR indicators in supplier performance evaluation. This methodology is the only one that allows the direct integration with supplier evaluation results and the supply chain performance evaluation. Furthermore, the use of SCOR indicators incorporates a standard language to the proposed methodology, making possible to the buyer compares its performance level with other supply chain businesses using the global benchmarking database SCORmark;
iii. Capacity to evaluate simultaneously a non-limited number of suppliers: instead the comparative approaches based in AHP (Park et al., 2010), fuzzy AHP (Rezaei & Ortt, 2013), ANP (Lee et al., 2009,; Hsu et al., 2014), fuzzy ANP (Shirinfar & Haleh, 2011) and grey ANP (Dou et al., 2014) techniques, which allows the simultaneously evaluation of a few suppliers, the proposed method is not limited by the number of evaluated suppliers. Furthermore, to evaluate n suppliers performance related to a criteria, while the comparative
in an input variable will always produces a positive and non-linear effect in the output variable. Since the results behavior depends directly of inference system parameterization and its decision-making, the obtained answer surfaces reinforces the operator adequation and choose of fuzzy values, as well as the consistency of suppliers estimated performance values.
5 ConclusionThis study presented a new methodology to
support supplier performance evaluation, developed by the combination of the indicators of SCOR model and fuzzy inference systems. The proposed approach allows evaluating costs and operations related aspects. The results of its evaluation are used to group suppliers with similar results and to determine the guidelines to supplier management. In comparison with other existents methodology in literature, the proposed methodology presents as advantages:
i. Guidelines for supplier base: Differently from the proposed studies by Bai & Sarkis (2011), Shirinfar & Haleh (2011), Zeydan et al. (2011), Hsu et al. (2014), Liou et al. (2014) and Sahu et al. (2014), this study uses a categorization procedure that allows to identify suppliers that must be replaced or needs attention. Depending of the supplier categorization, actions are suggested,
Figure 11. Answer surface charts of FIS 1 (a), 3 (b), 2 (c) and 4 (d). Source: Author.
19A methodology based on fuzzy inference and SCOR® model
performance evaluation and to do benchmarking using the SCORmark database information. Future studies can also the fuzzy inference technique to evaluate the achieved results by supplier development programs and cost reduction initiatives.
AcknowledgementsAuthors thank CAPES and CNPq for supporting
the research project.
ReferencesAgami, N., Saleh, M., & Rasmy, M. (2014). An innovative
fuzzy logic based approach for supply chain performance management. IEEE System Journal, 8(2), 336-342. http://dx.doi.org/10.1109/JSYST.2012.2219913.
Akman, G. (2014). Evaluating suppliers to include green supplier development programs via fuzzy c-means and VIKOR methods. Computers & Industrial Engineering, 86, 69-82. http://dx.doi.org/10.1016/j.cie.2014.10.013.
Aksoy, A., & Öztürk, N. (2011). Supplier selection and performance evaluation in just-in-time production environments. Expert Systems with Applications, 38(5), 6351-6359. http://dx.doi.org/10.1016/j.eswa.2010.11.104.
Altrock, C. V. (1995). Fuzzy Logic and Neurofuzzy (Applications in Business and Finance, 1). New Jersey: Prentice Hall.
Araz, C., & Ozkarahan, I. (2007). Supplier evaluation and management system for strategic sourcing based on a new multicriteria sorting procedure. International Journal of Production Economics, 106(2), 585-606. http://dx.doi.org/10.1016/j.ijpe.2006.08.008.
Bai, C., & Sarkis, J. (2011). Evaluating supplier development programs with a grey based rough set methodology. Expert Systems with Applications, 38(11), 13505-13517.
Bertrand, J. W. M., & Fransoo, J. (2002). Operations management research methodologies using quantitative modeling. International Journal of Operations & Production Management, 22, 241-264. http://dx.doi.org/10.1108/01443570210414338.
Chai, J., Liu, J. N. K., & Ngai, E. W. T. (2013). Application of decision-making techniques in supplier selection: a systematic review of literature. Expert Systems with Applications, 40(10), 3872-3885. http://dx.doi.org/10.1016/j.eswa.2012.12.040.
De Boer, L., Labro, E., & Morlacchi, P. (2001). A review of methods supporting supplier selection. European Journal of Purchasing & Supply Management, 7(2), 75-89. http://dx.doi.org/10.1016/S0969-7012(00)00028-9.
Dou, Y., Zhu, Q., & Sarkis, J. (2014). Evaluating green supplier development programs with a grey analytical network process-based methodology. European Journal of Operational Research, 233(2), 420-431. http://dx.doi.org/10.1016/j.ejor.2013.03.004.
approaches requires n(n-1) judgments, the proposed methodology requires just n judgments, which contributes to make more agile the data collection and suppliers evaluation;
iv. Information modeling approximation by linguistic representation and values processing: the use of variables represented by fuzzy pertinence functions is very useful to model qualitative criteria or the tough-measurable ones, as well to quantify the decision-taker opinion to an associated imprecision in the supplier evaluation. Techniques as DEA (Zeydan et al., 2011) and artificial neural networks (Asoy & Öztürk, 2011) uses crisp numeric values to data representation, witch unfeasible qualitative criteria use and doesn’t considerate the inherent imprecision to human judgment’s obtained values;
v. Mapping of all possible scenarios by decision rules: the base rules of each system explicit all the possible scenarios to the modeled problem, allowing “to see” performance evaluation situations by different perspectives. The use of a base of parameterizable rules also permits to the decision-taker, intuitively to define the weights of the used criteria. In this way, in contrary of the traditional multi-criteria techniques, fuzzy inference systems allow to map the non-linear behavior of the variables and to store them internally;
vi. Data interpretation: the base rules and its variables are parameterized by linguistic values with an easy interpretation, providing a better comprehension of the modeled problem to the decision-taker. It is not possible in neural networks based approaches (Aksoy & Öztürk, 2011), since its models work as a black box without user interface and stores the knowledge about the problem using an uninterpretable numeric format.
Some implications to this proposed implementation in future applications are: (1) the suggested discourse universes to each criteria must be adjusted according to the business reality; (2) although in this study it had been used 160 inference rules, inference systems also may be implemented just by using the main rules, reducing the implementation and parameterization efforts; (3) in step 3, the adopted threshold to classify performance as “low” or “high” must be adjusted as the requirements of the buyer. Future researches may integrate this new methodology to the supply chains
Lima, F. R., Jr. et al.20 Gest. Prod., São Carlos
Omurca, S. I. (2013). An intelligent supplier evaluation, selection and development system. Applied Soft Computing, 13(1), 690-697. http://dx.doi.org/10.1016/j.asoc.2012.08.008.
Osiro, L., Lima, F. R., Jr., & Carpinetti, L. C. R. (2014). A fuzzy logic approach to supplier evaluation for development. International Journal of Production Economics, 153, 95-112. http://dx.doi.org/10.1016/j.ijpe.2014.02.009.
Park, J., Shin, D., Chang, T. W., & Park, J. (2010). An integrative framework for supplier relationship management. Industrial Management & Data Systems, 110(4), 495-515. http://dx.doi.org/10.1108/02635571011038990.
Pedrycz, W., & Gomide, F. (2007). Fuzzy systems engineering: towards human-centric computing. New York: IEEE Press.
Pidd, M. (2004). Computer simulation in management science (5. ed.). United Kingdom: Wiley & Sons.
Rezaei, J., & Ortt, R. (2013). Multi-criteria supplier segmentation using a fuzzy relations based AHP. European Journal of Operational Research, 225(1), 75-84. http://dx.doi.org/10.1016/j.ejor.2012.09.037.
Sahu, N. K., Datta, S., & Mahapatra, S. S. (2014). Green supplier appraisement in fuzzy environment. Benchmarking., Jr. International Journal, 21, 412-429.
Sarkar, A., & Mohapatra, P. K. J. (2006). Evaluation of supplier capability and performance: a method for supply base reduction. Journal of Purchasing and Supply Management, 12(3), 148-163. http://dx.doi.org/10.1016/j.pursup.2006.08.003.
Supply Chain Council – SCC. (2012). Supply Chain Operations Reference Model SCOR, version 11. United States of America.
Shirinfar, M., & Haleh, H. (2011). Supplier selection and evaluation by fuzzy multi-criteria decision making methodology. International Journal of Industrial Engineering & Production Research, 22(4), 271-280.
Wu, C., & Barnes, D. (2011). A literature review of decision-making models and approaches for partner selection in agile supply chains. Journal of Purchasing and Supply Management, 17(4), 256-274. http://dx.doi.org/10.1016/j.pursup.2011.09.002.
Zeydan, M., Çolpan, C., & Çobanoğlu, C. (2011). A combined methodology for supplier selection and performance evaluation. Expert Systems with Applications, 38(3), 2741-2751. http://dx.doi.org/10.1016/j.eswa.2010.08.064.
Zimmermann, H. J. (1991). Fuzzy set theory and its applications. Massachussets: Kluwer Academic.
Ganga, G. M. D., & Carpinetti, L. C. R. (2011). A fuzzy logic approach to supply chain performance management. International Journal of Production Economics, 132(1), 177-187. http://dx.doi.org/10.1016/j.ijpe.2011.06.011.
González, M. E., Quesada, G., & Monge, C. A. (2004). Determining the importance of supplier selection process in manufacturing: a case study. Journal of Physical Distribuition & Logistics Management, 34(6), 492-504. http://dx.doi.org/10.1108/09600030410548550.
Ho, L., Feng, S., Lee, Y., & Yen, T. (2012). Using modified IPA to evaluate supplier’s performance: multiple regression analysis and DEMATEL approach. Expert Systems with Applications, 39(8), 7102-7109. http://dx.doi.org/10.1016/j.eswa.2012.01.034.
Hsu, C. W., Kuo, R. J., & Chiou, C. Y. (2014). A multi-criteria decision making approach for evaluating carbon performance of suppliers in the electronics industry. International Journal of Environmental Science and Technology, 11(3), 775-784. http://dx.doi.org/10.1007/s13762-013-0265-5.
Lee, A. H. I., Chang, H.-J., & Lin, C.-Y. (2009). An evaluation model of buyer-supplier relationships in high-tech industry: the case of an electronic components manufacturer in Taiwan. Computers & Industrial Engineering, 57(4), 1417-1430. http://dx.doi.org/10.1016/j.cie.2009.07.012.
Lee, D. M., & Drake, P. (2010). A portfolio model for component purchasing strategy and the case study of two South Korean elevator manufacturers. International Journal of Production Research, 48(22), 6651-6682. http://dx.doi.org/10.1080/00207540902897780.
Lima, F. R., Jr., Osiro, L., & Carpinetti, L. C. R. (2013). Métodos de decisão multicritério para seleção de fornecedores: um panorama do estado da arte. Gestão & Produção, 20(4), 781-801. http://dx.doi.org/10.1590/S0104-530X2013005000005.
Lima, F. R., Jr., Osiro, L., & Carpinetti, L. C. R. (2014a). A comparison between Fuzzy AHP and Fuzzy TOPSIS methods to supplier selection. Applied Soft Computing, 21, 194-209. http://dx.doi.org/10.1016/j.asoc.2014.03.014.
Lima, F. R., Jr., Cervi, A. F. C. & Carpinetti, L. C. R. (2014b). Uma metodologia multicritério baseada em inferência fuzzy para classificação ABC de estoques. Pesquisa Operacional para o Desenvolvimento, 6(3), 343-366.
Liou, J. J. H., Chuang, Y., & Tzeng, G. (2014). A fuzzy integral-based model for supplier evaluation and improvement. Information Sciences, 266, 199-217. http://dx.doi.org/10.1016/j.ins.2013.09.025.
Mamdani, E. H., & Assilian, S. (1975). An experiment in linguistic synthesis with a fuzzy logic controller. International Journal of Man-Machine Studies, 7(1), 1-13. http://dx.doi.org/10.1016/S0020-7373(75)80002-2.