Embed Size (px)
Citation preview
A methodology forknowledge managementimplementation
Gavin P. Levett and
Marin D. Guenov
Introduction
The past several decades have witnessed
fundamental changes in the structure of
organisations which have led to massive
increases in productivity. The driving force
for many of these changes have come through
total quality management (TQM) and
business process re-engineering (BPR)
concepts. These philosophies precede
knowledge management (KM) as a concept
for gaining improvements in the company
knowledge base and are presently considered
as complementary to KM.
TQM fosters a stable, efficient and creative
working environment whereas BPR is aimed
at producing `̀ bottom line'' improvements,
thus creating a conflict between long-term
and short-term gains.
This research recognises that, in essence,
KM is the examination of mechanisms that
facilitate critical organisational processes, the
measurement of their performance and the
development of practical solutions that deliver
one or more KM objectives. The business
community has articulated the following core
KM objectives, through an analysis described
in KPMG (1999), as:. supporting innovation, the generation of
new ideas and the exploitation of the
organisation's thinking power;. capturing insight and experience to make
them available and usable when, where
and by whom required;. making it easy to find and reuse sources
of know-how and expertise, whether they
are recorded in a physical form or held in
someone's mind;. fostering collaboration, knowledge
sharing, continual learning and
improvement;. improving the quality of decision making
and other intelligent tasks;. understanding the value and contribution
of intellectual assets and increasing their
worth, effectiveness and exploitation.
This research work was directed towards
understanding how the automotive industry
could implement KM in order to realise some
or all of its benefits. The key facets of
competitive advantage in the automotive
The authors
Gavin P. Levett is an Engineering Doctorate Research
Engineer and Marin D. Guenov is a Senior Lecturer,
Computer Integrated Design Technology Group, both at
Cranfield College of Aeronautics, Cranfield University,
Cranfield, UK.
Keywords
Knowledge management, Implementation, Engineering,
Measurement, Motor industry
Abstract
This article describes research work which was directed
towards providing the automotive industry with a
practical methodology that translates the conceptual
ideas of knowledge management (KM) into a working
programme with defined objectives, using industry
terminology. The research also developed a supporting
analysis methodology that enables an effective analysis of
the influences on employee activities when creating and
sharing valuable corporate knowledge, that spans
technical and cultural boundaries. This happens through
identifying the factors that impact on defined KM metrics.
The analysis identifies the key influencing factors within a
working environment. The research benefits are felt when
the ground-level drivers of KM behaviour are improved
through links to an appropriate KM strategy. KM strategy
may emphasise organisational cultural changes or IT
changes or both in an endeavour to improve innovation,
reduce business costs and reduce time to market of new
products. An industrial case study was undertaken to
validate the research.
Electronic access
The current issue and full text archive of this journal is
available at
http://www.emerald-library.com
The authors are very grateful to the Cranfield
Impact Centre Ltd for their sponsorship of the
research and to the automotive manufacturer who
was involved in the case-study validation.
258
Journal of Knowledge Management
Volume 4 . Number 3 . 2000 . pp. 258±269
# MCB University Press . ISSN 1367-3270

industry lie in the continual improvement in
product innovation and the ability to bring
new products to the market quickly and at low
cost to the consumer.
Experience gained from studying
automotive product development
environments suggested that the industry
would benefit from KM; however, it was
found that few manufacturers had fully
embraced KM. The clues that lay behind the
apparent poor adoption rate of KM were that
the academic development of KM has not
stabilised and filtered into industry as
organisations usually implement well-
established practices. In addition, there was a
lack of examples describing practical KM
applications within the manufacturing
industry. Many companies simply did not
know how to apply KM because the theory
covers a broad spectrum of concepts that
describe how companies should create, share
and store valuable knowledge in its numerous
formats. This research uncovered a gulf in
academic research between the conceptual
frameworks of processes that must be
undertaken for KM and their practical
implementation within an organisation.
The objectives of this research work were
focused on providing the automotive industry
with a practical methodology which could be
used to translate the conceptual ideas of KM
into a working programme with defined
objectives, or deliverables, using terminology
that the industry could readily understand.
The research highlighted the requirement to
develop a supporting analysis methodology to
examine employee actions and behaviour in
regard to how they shared and created
knowledge. This would have the benefit of
identifying the main influences on existing
KM which could be improved through the
application of an appropriate KM strategy,
that may emphasise organisational cultural
changes or IT changes or both in an
endeavour to improve innovation, reduce cost
and reduce the product development
timescale.
KM is a relatively recent management
philosophy and because of the diversity within
organisational working environments and
KM requirements, there is no detailed model
for developing a particular KM strategy. The
work by Wiig (1998) offers a generic
conceptual model which provided a good
starting point for the development of a
practical KM programme.
Wiig (1998) offers a six-step procedure for
an initial KM introduction programme for an
organisation with limited experience in KM:
(1) Build management understanding and
commitment to pursue KM.
(2) Map perspectives of the knowledge
landscape.
(3) Plan the organisation KM priorities,
focus and strategy.
(4) Identify sought KM benefits.
(5) Adjust KM priorities.
(6) Create KM-related incentive
programmes.
Although the work by Wiig (1998) provides
useful starting points for implementing KM,
it is highly generic and cannot be followed to
the letter without putting the ideas into
context. The next section of this paper
describes how a practical implementation
programme was developed in order to supply
industry with the means to realise the benefits
of KM.
Proposed KM introduction programme
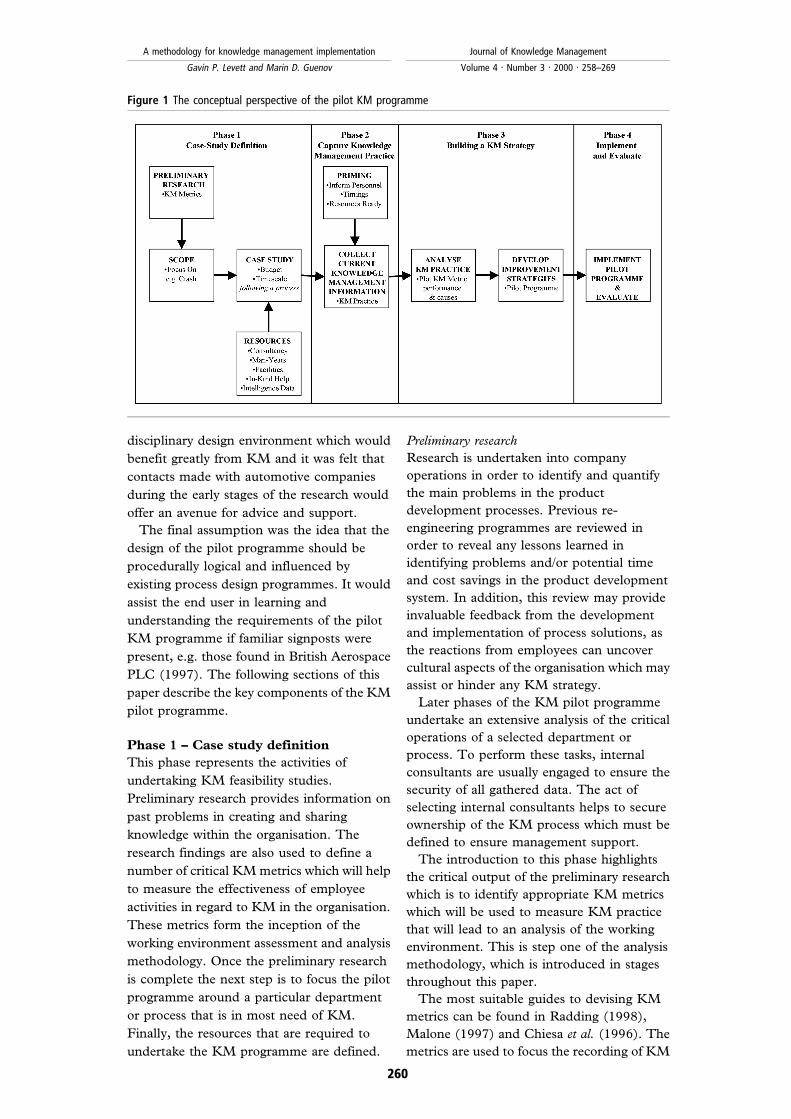
The KM pilot programme indicates the steps
that an automotive organisation must take in
order to achieve a practical and feasible KM
programme and is depicted in Figure 1.
The development of the pilot programme
was approached in the manner of assuming
that the company would have limited
experience of undertaking KM within an
organisation. This was the first major
assumption to be made as it provokes the
requirement for the pilot programme to cover
all aspects of undertaking a KM initiative
from preparation to implementation.
The second major assumption to be
established was the notion that an
organisation would require the pilot
programme to be initially implemented as an
experiment. Organisations, especially
automotive manufacturers, are inherently
cautious when approaching any new process
because of the large financial investment that
they usually require. Once the success of the
pilot can be demonstrated then organisations
may wish to expand the scope of application.
The third assumption to be established was
that the target organisation would be a
medium to large-sized automotive
manufacturing company. The premises at this
stage was that the user must have a multi-
259
A methodology for knowledge management implementation
Gavin P. Levett and Marin D. Guenov
Journal of Knowledge Management
Volume 4 . Number 3 . 2000 . 258±269
disciplinary design environment which would
benefit greatly from KM and it was felt that
contacts made with automotive companies
during the early stages of the research would
offer an avenue for advice and support.
The final assumption was the idea that the
design of the pilot programme should be
procedurally logical and influenced by
existing process design programmes. It would
assist the end user in learning and
understanding the requirements of the pilot
KM programme if familiar signposts were
present, e.g. those found in British Aerospace
PLC (1997). The following sections of this
paper describe the key components of the KM
pilot programme.
Phase 1 ± Case study definition
This phase represents the activities of
undertaking KM feasibility studies.
Preliminary research provides information on
past problems in creating and sharing
knowledge within the organisation. The
research findings are also used to define a
number of critical KM metrics which will help
to measure the effectiveness of employee
activities in regard to KM in the organisation.
These metrics form the inception of the
working environment assessment and analysis
methodology. Once the preliminary research
is complete the next step is to focus the pilot
programme around a particular department
or process that is in most need of KM.
Finally, the resources that are required to
undertake the KM programme are defined.
Preliminary research
Research is undertaken into company
operations in order to identify and quantify
the main problems in the product
development processes. Previous re-
engineering programmes are reviewed in
order to reveal any lessons learned in
identifying problems and/or potential time
and cost savings in the product development
system. In addition, this review may provide
invaluable feedback from the development
and implementation of process solutions, as
the reactions from employees can uncover
cultural aspects of the organisation which may
assist or hinder any KM strategy.
Later phases of the KM pilot programme
undertake an extensive analysis of the critical
operations of a selected department or
process. To perform these tasks, internal
consultants are usually engaged to ensure the
security of all gathered data. The act of
selecting internal consultants helps to secure
ownership of the KM process which must be
defined to ensure management support.
The introduction to this phase highlights
the critical output of the preliminary research
which is to identify appropriate KM metrics
which will be used to measure KM practice
that will lead to an analysis of the working
environment. This is step one of the analysis
methodology, which is introduced in stages
throughout this paper.
The most suitable guides to devising KM
metrics can be found in Radding (1998),
Malone (1997) and Chiesa et al. (1996). The
metrics are used to focus the recording of KM
Figure 1 The conceptual perspective of the pilot KM programme
260
A methodology for knowledge management implementation
Gavin P. Levett and Marin D. Guenov
Journal of Knowledge Management
Volume 4 . Number 3 . 2000 . 258±269
practice in key areas, and are used in the
analysis which is undertaken in the following
phase. This research has developed a template
which can be used as a guide so that relevant
measures appropriate to the organisation are
defined. In addition, accurate intelligence
data on competitors can reveal industry KM
initiatives and benchmarks which may
provoke metric development if the
organisation is striving to become an industry
leader in KM.
This research filtered the numerous
possible metrics down to the following list of
eight that are considered appropriate to the
automotive product development
environment (they are also generic enough to
cover a range of industries and companies):
Eight metrics for KM analysis
(1) Motivation (how well the employees are
motivated to work productively).
(2) Knowledge capture (the ability to capture
important knowledge).
(3) Stored knowledge (the usefulness of
captured knowledge in solving new
problems).
(4) Personnel training (the effectiveness of
employee learning mechanisms).
(5) Knowledge transfer (the effectiveness of
sharing important knowledge).
(6) Creative thinking (the ability of
employees to create new solutions).
(7) Knowledge identification (the
effectiveness of identifying knowledge).
(8) Knowledge access (the effectiveness of
accessing important knowledge).
These eight metrics cover a wide scope of KM
practice as the emphasis of the analysis
methodology is to show how it is possible to
measure many aspects of KM. These metrics
are not assumed to be totally independent. In
reality it may not be feasible to simultaneously
measure all of the above because of the time
overhead that would be required to monitor
every aspect of employee practice. It is
proposed that a practical number of metrics
would lie in the range of five to eight.
Following the definition of the KM metrics,
the next step is to design a means of collecting
the data. The analysis methodology requires
that each metric, which represents how well
the organisation is performing in a KM aspect,
is quantifiable for it to be a true measurement
technique. To collect the KM practice data ±
an activity that will be described in more detail
in phase 2 ± work tasks are observed and the
employees are questioned in order to obtain
the reasons behind their actions and practice.
For example, an employee may not be able to
gain access to particular expertise because the
colleague may work in another country with a
time-zone difference, thus making
communication difficult. This process reveals
organisational KM practice. The analysis
methodology not only identifies the
underlying causes of KM practice but must
also provide an indication of how the
environment could be changed to improve
KM practice.
To facilitate this process a questionnaire is
developed that the consultant uses to translate
employee KM practice into quantifiable
metric data. This necessitates each question
to capture important KM practice and to have
a range of possible answers. The answers are
then translated into numerical scores in the
range of 0 (irrelevant) and 1 (satisfactory/best
practice). In addition, the questionnaire must
capture the influencing factors which gave a
score, e.g. office location could be a factor
that affects knowledge sharing/transfer, and a
low score attributed to this factor could be the
result of inappropriate office location.
The questionnaire must enable the
employees to suggest how the influencing
factors could be improved (including the
addition of new factors) in order to increase
the metric score. For example, an employee
may wish to suggest how knowledge
identification, that is required during a
particular work task, could be improved.
There may also be potential task time and cost
changes that would result from improving a
factor which must also be recorded. The
questionnaire must also capture any instances
of changing a influencing factor having a
negative effect on metric performance.
Scope of the case study
In this sub-phase a case study is proposed that
focuses the KM pilot programme on a
particular department or process that is
considered to exhibit poor KM practice. The
preliminary research is reviewed to identify a
particular process, function or department
that has a critical influence in the
development programme.
Phase 2 - Capture KM practice
This phase represents the activities of
preparing the personnel who will be involved
in the KM programme and collecting the raw
261
A methodology for knowledge management implementation
Gavin P. Levett and Marin D. Guenov
Journal of Knowledge Management
Volume 4 . Number 3 . 2000 . 258±269
data and information concerning current KM
practice.
Collect current KM information
In this sub-phase the consultants interview
and observe the personnel involved in the case
study in order to collect information on how
they perform their respective roles within the
product development process. This procedure
gathers subjective data as the answers are
based on personal opinions and motivation.
KM practice is recorded by asking the
employees to review their work tasks and to
rate each appropriate KM metric, and to state
the factors that influenced all ratings. The
questionnaire is used to ask appropriate
questions to elicit this information. KM
practice is influenced by organisational
culture that affects personnel attitudes and
working patterns. The resulting KM data
depict a holistic view of the working
environment so that the main influences and
pressures on the employees can be linked to
how they create and share knowledge.
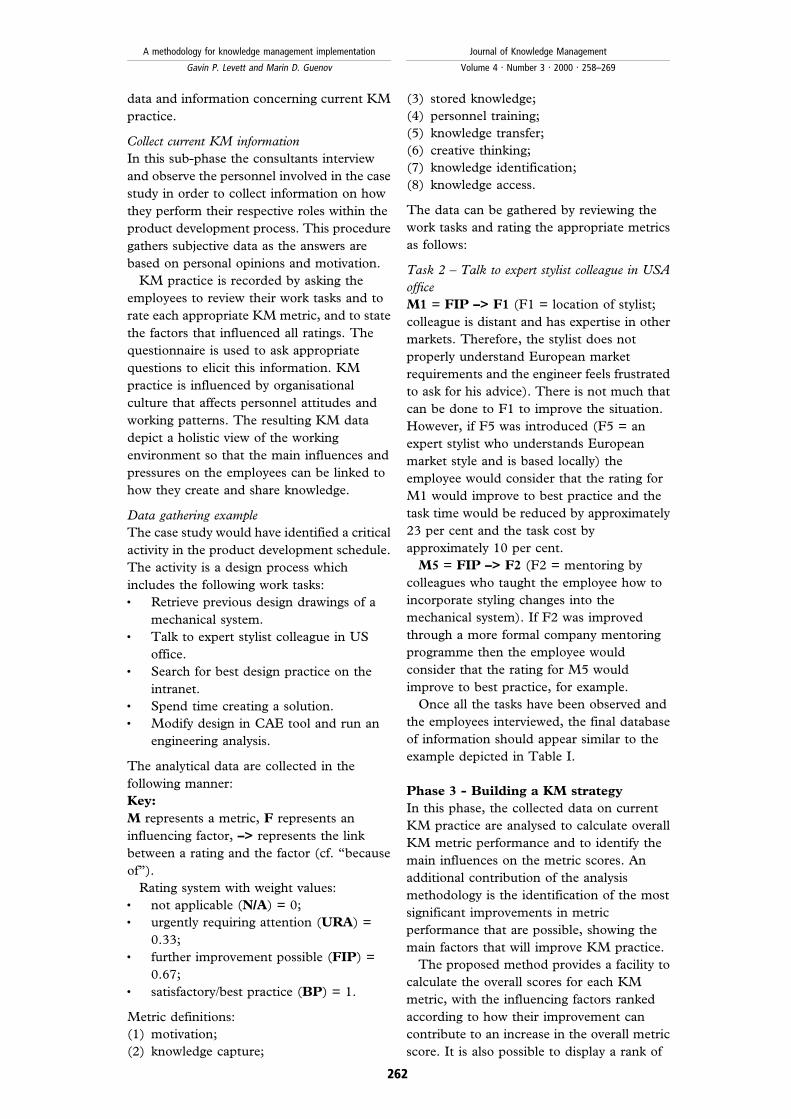
Data gathering example
The case study would have identified a critical
activity in the product development schedule.
The activity is a design process which
includes the following work tasks:. Retrieve previous design drawings of a
mechanical system.. Talk to expert stylist colleague in US
office.. Search for best design practice on the
intranet.. Spend time creating a solution.. Modify design in CAE tool and run an
engineering analysis.
The analytical data are collected in the
following manner:
Key:
M represents a metric, F represents an
influencing factor, ±> represents the link
between a rating and the factor (cf. `̀ because
of'').
Rating system with weight values:. not applicable (N/A) = 0;. urgently requiring attention (URA) =
0.33;. further improvement possible (FIP) =
0.67;. satisfactory/best practice (BP) = 1.
Metric definitions:
(1) motivation;
(2) knowledge capture;
(3) stored knowledge;
(4) personnel training;
(5) knowledge transfer;
(6) creative thinking;
(7) knowledge identification;
(8) knowledge access.
The data can be gathered by reviewing the
work tasks and rating the appropriate metrics
as follows:
Task 2 ± Talk to expert stylist colleague in USA
office
M1 = FIP ±> F1 (F1 = location of stylist;
colleague is distant and has expertise in other
markets. Therefore, the stylist does not
properly understand European market
requirements and the engineer feels frustrated
to ask for his advice). There is not much that
can be done to F1 to improve the situation.
However, if F5 was introduced (F5 = an
expert stylist who understands European
market style and is based locally) the
employee would consider that the rating for
M1 would improve to best practice and the
task time would be reduced by approximately
23 per cent and the task cost by
approximately 10 per cent.
M5 = FIP ±> F2 (F2 = mentoring by
colleagues who taught the employee how to
incorporate styling changes into the
mechanical system). If F2 was improved
through a more formal company mentoring
programme then the employee would
consider that the rating for M5 would
improve to best practice, for example.
Once all the tasks have been observed and
the employees interviewed, the final database
of information should appear similar to the
example depicted in Table I.
Phase 3 - Building a KM strategy
In this phase, the collected data on current
KM practice are analysed to calculate overall
KM metric performance and to identify the
main influences on the metric scores. An
additional contribution of the analysis
methodology is the identification of the most
significant improvements in metric
performance that are possible, showing the
main factors that will improve KM practice.
The proposed method provides a facility to
calculate the overall scores for each KM
metric, with the influencing factors ranked
according to how their improvement can
contribute to an increase in the overall metric
score. It is also possible to display a rank of
262
A methodology for knowledge management implementation
Gavin P. Levett and Marin D. Guenov
Journal of Knowledge Management
Volume 4 . Number 3 . 2000 . 258±269
the factors which have had the greatest
contribution to current performance, which is
essential in any analysis methodology. If a
factor is linked to more than one metric this
information is incorporated into the
calculations, as there may be knock-on effects
by changing a factor (as several metric scores
might be affected). Changes in task time and
task costs are also incorporated into the rank
of factors that will improve current metric
performance.
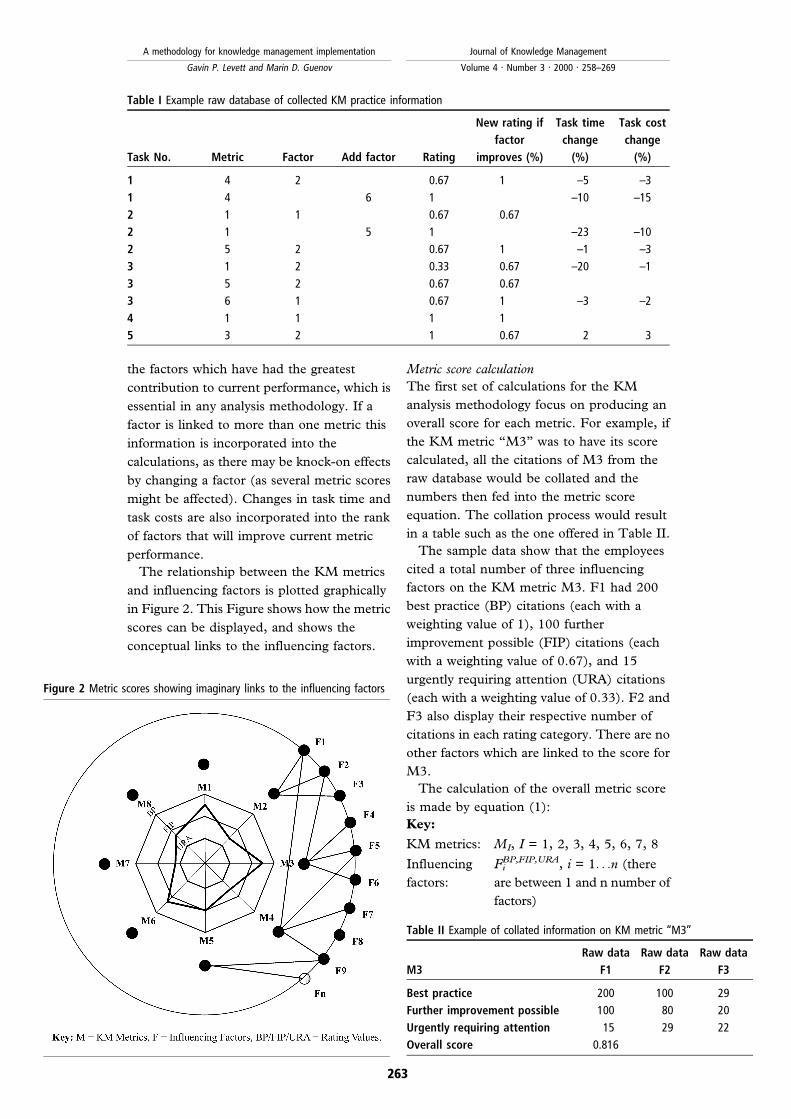
The relationship between the KM metrics
and influencing factors is plotted graphically
in Figure 2. This Figure shows how the metric
scores can be displayed, and shows the
conceptual links to the influencing factors.
Metric score calculation
The first set of calculations for the KM
analysis methodology focus on producing an
overall score for each metric. For example, if
the KM metric `̀ M3'' was to have its score
calculated, all the citations of M3 from the
raw database would be collated and the
numbers then fed into the metric score
equation. The collation process would result
in a table such as the one offered in Table II.
The sample data show that the employees
cited a total number of three influencing
factors on the KM metric M3. F1 had 200
best practice (BP) citations (each with a
weighting value of 1), 100 further
improvement possible (FIP) citations (each
with a weighting value of 0.67), and 15
urgently requiring attention (URA) citations
(each with a weighting value of 0.33). F2 and
F3 also display their respective number of
citations in each rating category. There are no
other factors which are linked to the score for
M3.
The calculation of the overall metric score
is made by equation (1):
Key:
KM metrics: MI, I = 1, 2, 3, 4, 5, 6, 7, 8
Influencing FiBP,FIP,URA, i = 1. . .n (there
factors: are between 1 and n number of
factors)
Table I Example raw database of collected KM practice information
Task No. Metric Factor Add factor Rating
New rating if
factor
improves (%)
Task time
change
(%)
Task cost
change
(%)
1 4 2 0.67 1 ±5 ±3
1 4 6 1 ±10 ±15
2 1 1 0.67 0.67
2 1 5 1 ±23 ±10
2 5 2 0.67 1 ±1 ±3
3 1 2 0.33 0.67 ±20 ±1
3 5 2 0.67 0.67
3 6 1 0.67 1 ±3 ±2
4 1 1 1 1
5 3 2 1 0.67 2 3
Figure 2 Metric scores showing imaginary links to the influencing factors
Table II Example of collated information on KM metric `̀ M3''
M3
Raw data
F1
Raw data
F2
Raw data
F3
Best practice 200 100 29
Further improvement possible 100 80 20
Urgently requiring attention 15 29 22
Overall score 0.816
263
A methodology for knowledge management implementation
Gavin P. Levett and Marin D. Guenov
Journal of Knowledge Management
Volume 4 . Number 3 . 2000 . 258±269
Fi (BPi, FIPi, URAi) = each
factor has three rating values
BPi = best practice rating for
factor i
FIPi = further improvement
possible rating for factor i
URAi = urgently requiring
attention rating for factor i
FiBP = citation of best practice
for factor i
FiFIP = citation of further
improvement possible for
factor i
FiURA = citation of urgently
requiring attention for factor i
SMI= score of the Ith KM
metric
SMI�X
MI
FBPi � 0:67
XMI
FFIPi � 0:33
XMI
FURAiX
MI
Fi
�1�
The overall metric score (using equation (1)
with data from Table II) is 0.816. If this figure
is compared against the weightings (BP = 1,
FIP = 0.67 and URA = 0.33), the score for
M3 lies between BP and FIP.
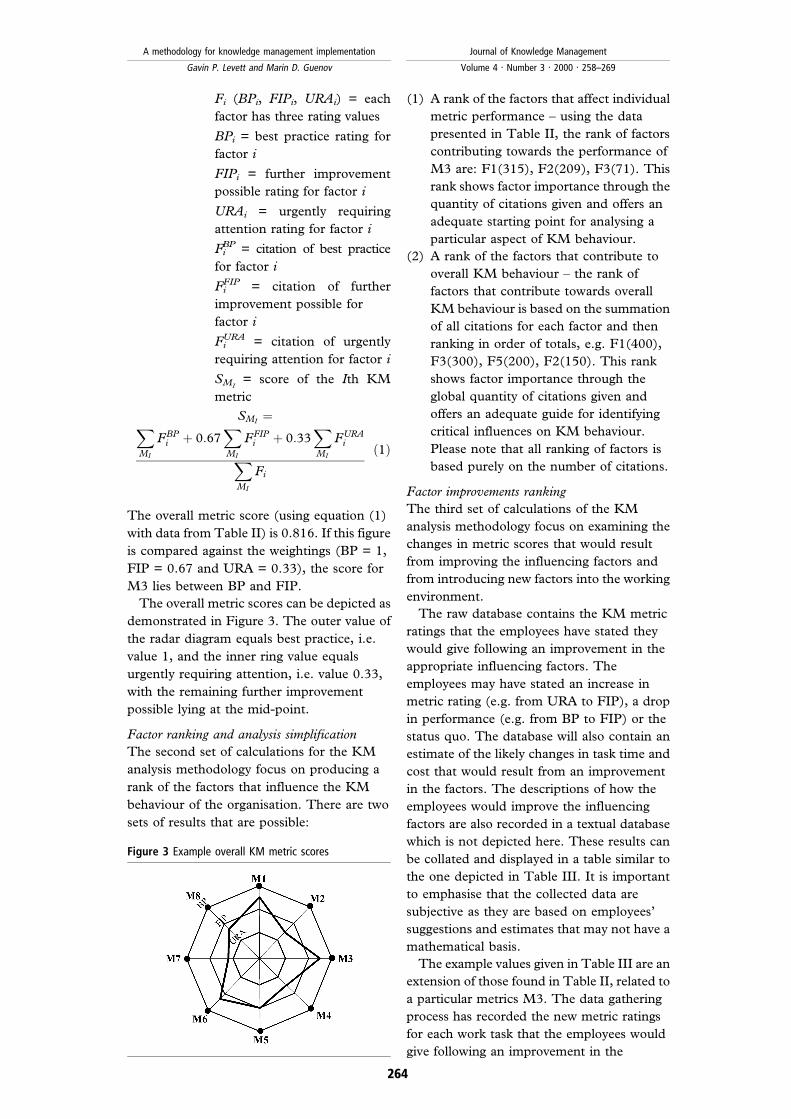
The overall metric scores can be depicted as
demonstrated in Figure 3. The outer value of
the radar diagram equals best practice, i.e.
value 1, and the inner ring value equals
urgently requiring attention, i.e. value 0.33,
with the remaining further improvement
possible lying at the mid-point.
Factor ranking and analysis simplification
The second set of calculations for the KM
analysis methodology focus on producing a
rank of the factors that influence the KM
behaviour of the organisation. There are two
sets of results that are possible:
(1) A rank of the factors that affect individual
metric performance ± using the data
presented in Table II, the rank of factors
contributing towards the performance of
M3 are: F1(315), F2(209), F3(71). This
rank shows factor importance through the
quantity of citations given and offers an
adequate starting point for analysing a
particular aspect of KM behaviour.
(2) A rank of the factors that contribute to
overall KM behaviour ± the rank of
factors that contribute towards overall
KM behaviour is based on the summation
of all citations for each factor and then
ranking in order of totals, e.g. F1(400),
F3(300), F5(200), F2(150). This rank
shows factor importance through the
global quantity of citations given and
offers an adequate guide for identifying
critical influences on KM behaviour.
Please note that all ranking of factors is
based purely on the number of citations.
Factor improvements ranking
The third set of calculations of the KM
analysis methodology focus on examining the
changes in metric scores that would result
from improving the influencing factors and
from introducing new factors into the working
environment.
The raw database contains the KM metric
ratings that the employees have stated they
would give following an improvement in the
appropriate influencing factors. The
employees may have stated an increase in
metric rating (e.g. from URA to FIP), a drop
in performance (e.g. from BP to FIP) or the
status quo. The database will also contain an
estimate of the likely changes in task time and
cost that would result from an improvement
in the factors. The descriptions of how the
employees would improve the influencing
factors are also recorded in a textual database
which is not depicted here. These results can
be collated and displayed in a table similar to
the one depicted in Table III. It is important
to emphasise that the collected data are
subjective as they are based on employees'
suggestions and estimates that may not have a
mathematical basis.
The example values given in Table III are an
extension of those found in Table II, related to
a particular metrics M3. The data gathering
process has recorded the new metric ratings
for each work task that the employees would
give following an improvement in the
Figure 3 Example overall KM metric scores
264
A methodology for knowledge management implementation
Gavin P. Levett and Marin D. Guenov
Journal of Knowledge Management
Volume 4 . Number 3 . 2000 . 258±269

influencing factors and/or the addition of new
factors that are not currently present. The
data changes column for factor F1 shows the
original number of citations in each rating
category, i.e. BP (200), FIP (100) and URA
(15), and against each citation index are three
other numbers, e.g. for BP there are 0-10 190.
The first figure indicates that out of 200
citations of BP none would be given a higher
rating following an improvement in factor F1
(since BP is the highest rating category this
figure will always be zero; however, the
method is the same for the other rating
categories). The second figure indicates that
ten citations of F1 would fall in rating to the
next category down (e.g. ten persons have
expressed that any improvement in F1 would
be detrimental) which is FIP. This analysis
assumes that any changes in rating values will
not exceed one category.
The final figure indicates the number of
citations of F1 that are unchanged following
an improvement of factor F1. The remaining
categories and factors have the changes
displayed in a similar manner.
The next set of figures, shown in the data
changes column for factor F1, are the final
results of re-calculating the citation numbers
for each rating category based on the changes
data described above. For example the figure
`̀ 220'' in the BP rating category is calculated
from a drop of ten citations to FIP and an
increase of 30 citations coming from the FIP
category. The figure `̀ 88'' in the FIP rating
category is calculated from a drop of two
citations to URA, an increase of ten from
URA and a fall of ten from BP. The figure `̀ 7''
in the URA rating category is calculated from
ten citations moving up to FIP and two
citations falling from FIP to URA. The new
citation indexes for the remaining influencing
factors are calculated in the same manner. It
is also assumed that any movements of
citations are limited to one value, e.g. a
citation from BP cannot drop to URA and
vice versa.
Once the new citation indexes are complete
the change to the overall metric scores can be
calculated. The important point to make clear
is that each factor is examined in isolation so
that the impact on the metric score can be
attributed to the improvement in one factor.
To perform this calculation, equation (1) is
invoked.
The calculation provides a new metric score
of 0.83. If this figure is compared against the
original score for M3 (shown in Table II as
0.816) it can be seen that there has been an
increase of 0.014 by improving factor F1
alone (all other factors' data remain
unchanged). The remaining factors have their
individual impact on the metric score
calculated in the same manner.
The final set of figures shown in the data
changes column for factor F1 are the results
from averaging the changes in work task time
and costs that were estimated if factor F1
were to be improved. These results are
calculated from all the data relating to factor
F1 and, therefore, span all the metrics. It was
not considered useful to calculate average task
time and cost changes relating to each
individual metric as there may be several
metrics that were used to measure each task.
A further sub-division of results would
complicate the analysis as the important issue
Table III Example results for ranking KM metric influencing factors
Data changes
M3 Improve F1 Improve F2 Improve F3 Add F4
BP 200 (0-10 190) 100 (0-3 97) 29 (0-1 28) 40
FIP 100 (+30 ±2 68) 80 (+30 ±5 45) 20 (+15 0 5) 10
URA 15 (+10 0 5) 29 (+9 0 20) 22 (+11 0 11) 2
New citation index
BP 220 127 43 40
FIP 88 57 17 10
URA 7 25 11 2
New metric score (%) 0.83 0.829 0.829 0.823
Score changes (%) 0.014 0.013 0.013 0.007
Overall task changes
Average time (%) ±3 ±6 ±2 ±15
Average cost (%) ±2 ±10 ±1 12
265
A methodology for knowledge management implementation
Gavin P. Levett and Marin D. Guenov
Journal of Knowledge Management
Volume 4 . Number 3 . 2000 . 258±269
for clarification is to produce an overall
ranking of the influencing factors on the
working environment and a ranking of the
most effective improvements.
Once all the factor improvement
calculations have been made then they can be
ranked. Using the figures provided in Table
III it can be seen that for the KM metric M3
(original score 0.816) the following rank of
factors can be made:
M3 improve = F1(0.015), F2(0.014),
F3(0.014), F4(0.008)
This rank is based on the amount of increase
in overall metric score and the figures in
brackets represent the individual contribution
of each factor to improving the metric score.
It is possible that the consultants may wish to
improve several factors in order to have a
significant increase in overall metric score and
this is examined in later phases.
Global factor ranking
This analysis has so far described the
methodology for analysing each metric score
in isolation and to produce a rank of the
factors that will have the greatest positive
increase in overall metric score. This
information is useful in its own right if the
consultant were concentrating on one
particular aspect of KM behaviour. However,
the conceptual diagram shown in Figure 2
indicates that some factors may be linked to
the performance of several metrics. If the
consultant were to sanction the improvement
of one factor it may have a knock-on effect on
the overall score of another metric, and may
be positive or negative. For example the
ranking for M3 may appear as follows:
M3 improve = F1(0.015), F2(0.014),
F3(0.014), F4(0.008), but for the KM
metric M4, its ranking may appear as: M4
improve = F2(0.01), F5(0.009), F1(-0.02)
This information shows that the employees
stated that if F1 were to be improved then the
performance of metric M4 would fall and was
calculated to get worse by 0.02. This
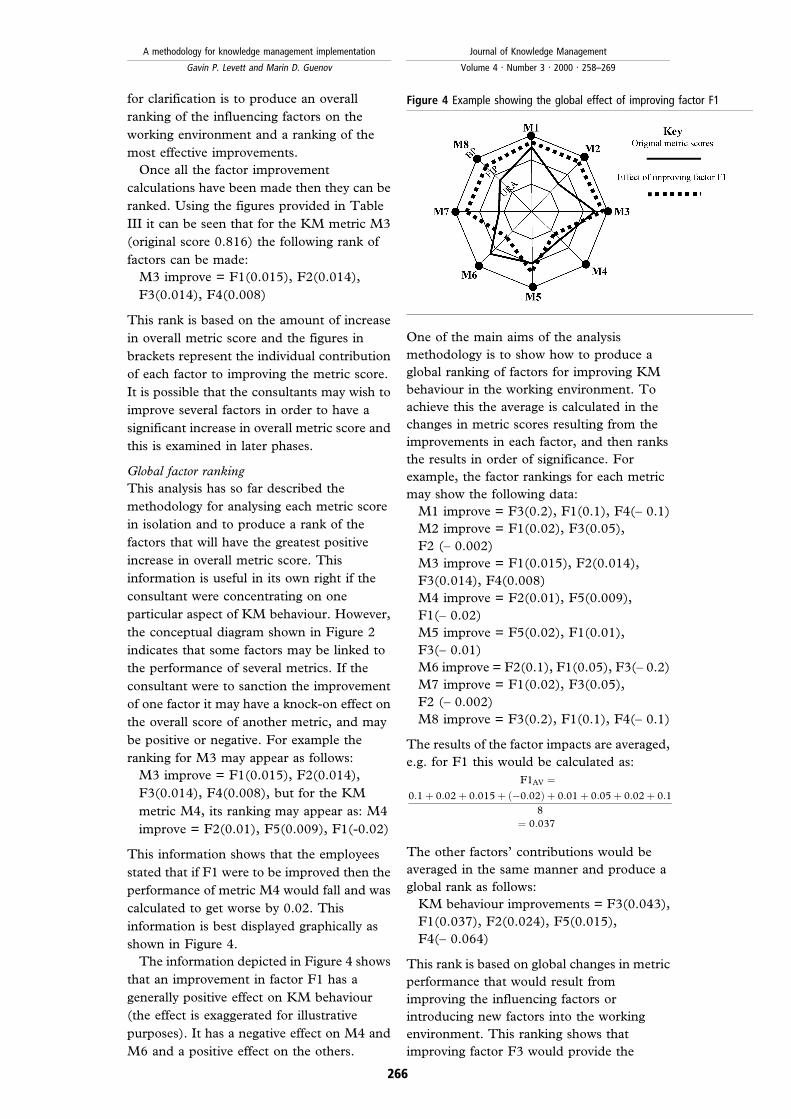
information is best displayed graphically as
shown in Figure 4.
The information depicted in Figure 4 shows
that an improvement in factor F1 has a
generally positive effect on KM behaviour
(the effect is exaggerated for illustrative
purposes). It has a negative effect on M4 and
M6 and a positive effect on the others.
One of the main aims of the analysis
methodology is to show how to produce a
global ranking of factors for improving KM
behaviour in the working environment. To
achieve this the average is calculated in the
changes in metric scores resulting from the
improvements in each factor, and then ranks
the results in order of significance. For
example, the factor rankings for each metric
may show the following data:
M1 improve = F3(0.2), F1(0.1), F4(± 0.1)
M2 improve = F1(0.02), F3(0.05),
F2 (± 0.002)
M3 improve = F1(0.015), F2(0.014),
F3(0.014), F4(0.008)
M4 improve = F2(0.01), F5(0.009),
F1(± 0.02)
M5 improve = F5(0.02), F1(0.01),
F3(± 0.01)
M6 improve = F2(0.1), F1(0.05), F3(± 0.2)
M7 improve = F1(0.02), F3(0.05),
F2 (± 0.002)
M8 improve = F3(0.2), F1(0.1), F4(± 0.1)
The results of the factor impacts are averaged,
e.g. for F1 this would be calculated as:
F1AV �0:1� 0:02� 0:015� �ÿ0:02� � 0:01� 0:05� 0:02� 0:1
8
� 0:037
The other factors' contributions would be
averaged in the same manner and produce a
global rank as follows:
KM behaviour improvements = F3(0.043),
F1(0.037), F2(0.024), F5(0.015),
F4(± 0.064)
This rank is based on global changes in metric
performance that would result from
improving the influencing factors or
introducing new factors into the working
environment. This ranking shows that
improving factor F3 would provide the
Figure 4 Example showing the global effect of improving factor F1
266
A methodology for knowledge management implementation
Gavin P. Levett and Marin D. Guenov
Journal of Knowledge Management
Volume 4 . Number 3 . 2000 . 258±269

greatest individual boost to metric
performance. The consultant may wish to
improve several factors to obtain large
improvements in global KM behaviour. It is
also possible to rank the factors based on
other criteria such as average task time and/or
cost improvements. For example, the data
provided in Table III show that the factors
could be ranked as follows:
Based on average task time changes:
F4(± 15 per cent), F2(± 6 per cent),
F1(± 3 per cent), F3(±2 per cent)
Based on average task cost changes:
F2(± 10 per cent), F1(± 2 per cent),
F3(± 1 per cent), F4(12 per cent)
This rank shows that factor F4 introduces a
conflict between task time and cost
improvements. It is the consultant's job to
decide the importance.
The remainder of this phase uses the KM
analysis as an input for the formation of
appropriate improvement strategies. The
design of any new KM strategy is dependent
on an accurate analysis of current KM
practice which reveals problems and the root
causes of those problems. The analysis
methodology is employed to provide this
information. Once new strategies have been
formulated, a cost-benefit analysis must be
undertaken with a return on investment
calculation being made (if possible). Once the
strategies have been approved by
management then a detailed implementation
plan can be devised and approved.
Phase 4 ± Implement and evaluate
This phase represents the comparison of pre-
pilot and post-pilot KM practice in order to
determine if the KM strategies have been
successful. If the pilot programme has been
successful then management may wish to
consider expanding the scope of the pilot into
other areas of the organisation which could
benefit from the implementation of KM.
Case study ± validating the pilot KM programme
and analysis methodology
The collaboration with an automotive
manufacturer, hereafter referred to as
`̀ Company A'', enabled the pilot programme
methodology and analysis theory to be tried
and tested in an environment for which they
were intended. The validation case study was
focused around a process which is used in the
preparation for a new assembly or system
design.
The constraints that were imposed meant
that during the data collection phase it was
not possible to interview the engineers;
therefore the project relied on data collected
solely from the questionnaire. It is proposed
that there should be interviews to back up the
questionnaire when the data are collected.
This would help to minimize data absence,
interpretation errors and would maximize
commitment to the project by individuals and
would provide more detailed responses.
Another constraint on the validation meant
that the latter aspects of phase 3 and the
whole of phase 4 could not be implemented.
These phases could be validated if a larger-
scale case study was undertaken. For
example, an entire department could be
analysed with an increased number of
metrics. A larger perspective would provide
more valuable information on which to base a
complete KM strategy.
The data collection questionnaire was
submitted to all engineers who had used the
case-study process. The total number of
returned questionnaires represented a 72 per
cent response rate. The large proportion of
returned questionnaires meant that the results
presented a realistic assessment of the
Company A process and how it facilitates KM
for the engineers that use it.
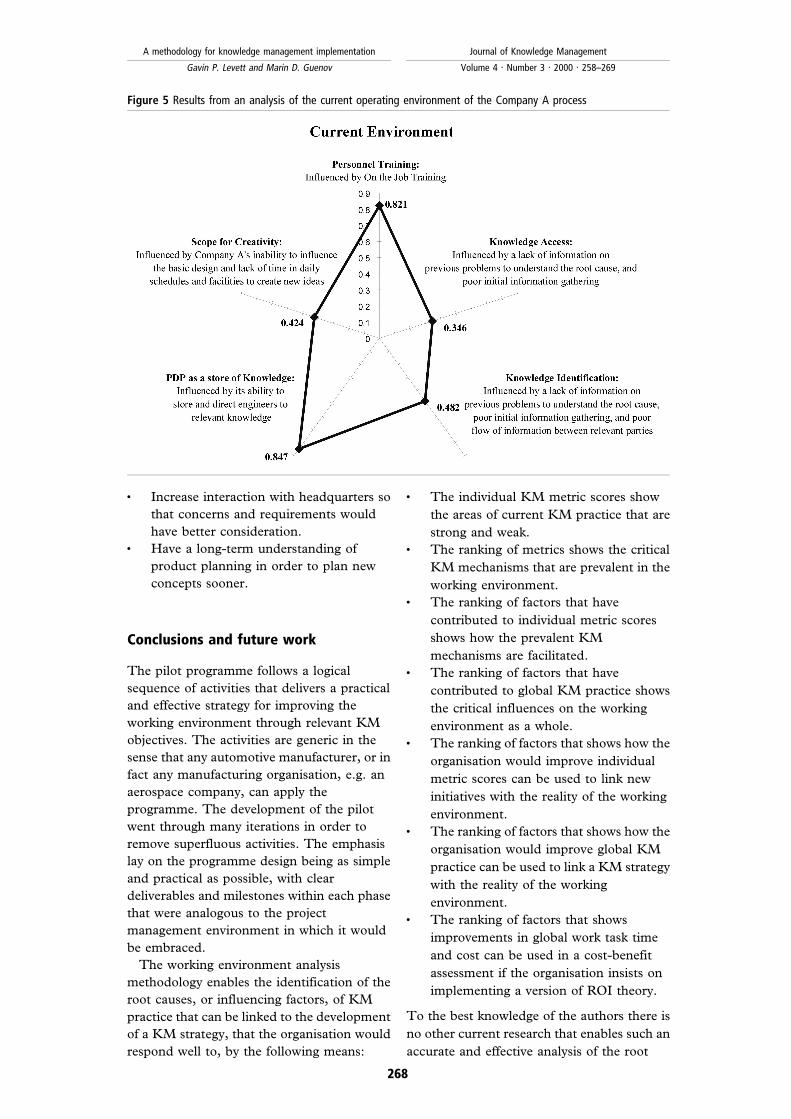
The data were collected and entered into
the analysis methodology which was followed
carefully as outlined in this paper. The results
from the analysis of the current environment
are displayed in Figure 5. The experience of
manually collecting and analysing the data led
to the proposal that a computer program
should be written that would improve data
collation and analysis for future projects.
The results were analysed and the following
recommendations were made:. Establish a database of past component
and process examples with problems
traced to the root causes.. Encourage on-the-job training as the best
method for learning the process.. Implement a series of presentations of
specific system requirements by managers
at the beginning of the process, especially
for unfamiliar engineers so that guidance
notes may be taken.. Improve the flow of information between
relevant parties, e.g. have earlier supplier
input into concept stage and identify the
responsibilities of the relevant parties.
267
A methodology for knowledge management implementation
Gavin P. Levett and Marin D. Guenov
Journal of Knowledge Management
Volume 4 . Number 3 . 2000 . 258±269
. Increase interaction with headquarters so
that concerns and requirements would
have better consideration.. Have a long-term understanding of
product planning in order to plan new
concepts sooner.
Conclusions and future work
The pilot programme follows a logical
sequence of activities that delivers a practical
and effective strategy for improving the
working environment through relevant KM
objectives. The activities are generic in the
sense that any automotive manufacturer, or in
fact any manufacturing organisation, e.g. an
aerospace company, can apply the
programme. The development of the pilot
went through many iterations in order to
remove superfluous activities. The emphasis
lay on the programme design being as simple
and practical as possible, with clear
deliverables and milestones within each phase
that were analogous to the project
management environment in which it would
be embraced.
The working environment analysis
methodology enables the identification of the
root causes, or influencing factors, of KM
practice that can be linked to the development
of a KM strategy, that the organisation would
respond well to, by the following means:
. The individual KM metric scores show
the areas of current KM practice that are
strong and weak.. The ranking of metrics shows the critical
KM mechanisms that are prevalent in the
working environment.. The ranking of factors that have
contributed to individual metric scores
shows how the prevalent KM
mechanisms are facilitated.. The ranking of factors that have
contributed to global KM practice shows
the critical influences on the working
environment as a whole.. The ranking of factors that shows how the
organisation would improve individual
metric scores can be used to link new
initiatives with the reality of the working
environment.. The ranking of factors that shows how the
organisation would improve global KM
practice can be used to link a KM strategy
with the reality of the working
environment.. The ranking of factors that shows
improvements in global work task time
and cost can be used in a cost-benefit
assessment if the organisation insists on
implementing a version of ROI theory.
To the best knowledge of the authors there is
no other current research that enables such an
accurate and effective analysis of the root
Figure 5 Results from an analysis of the current operating environment of the Company A process
268
A methodology for knowledge management implementation
Gavin P. Levett and Marin D. Guenov
Journal of Knowledge Management
Volume 4 . Number 3 . 2000 . 258±269
causes of KM behaviour. KM behaviour
spans across technical and cultural
boundaries and the analysis theory enables
such a crossing of boundaries to be made,
through the employees articulating what
factors influence the defined KM metrics.
These factors can have many representations,
e.g. a software system or the personnel reward
policy of the company. The analysis delivers a
list of the key factors within a working
environment, whatever they may be.
The future efforts of the research should
provide a facility for identifying any trade-offs
that may be required when introducing or
modifying factors. This would secure more
information on possible implementation
problems for a new KM strategy. This
absence of theory made the estimation of task
time and cost savings, from the introduction/
modification of influencing factors, difficult.
References
British Aerospace PLC (1997), Integrated ProductDevelopment: Process Summary, Military Aircraft &Aerostructures Technical Publications, Warton, UK.
Chiesa, V., Coughlan, P. and Voss, C.A. (1996),`̀ Development of a technical innovation audit'', TheJournal of Product Innovation Management, Vol. 13No. 2, pp. 105-36.
KPMG (1999), The Power of Knowledge ± A BusinessGuide to Knowledge Management, KPMGManagement Consulting (WWW document). http://www.kpmg.com (accessed 4 October 1999).
Malone, M.S. (1997), New Metrics for a New Age (WWWdocument), http:///www.forbes.com. (accessed 26July 1999).
Radding, A. (1998), Knowledge Management: Succeedingin the Information-based Global Economy, 1st ed.,Computer Technology Research Corp., Charleston,SC.
Wiig, K.M. (1998), `̀ Perspectives on introducing enterpriseknowledge management'', in Proceedings of the2nd International Conference on Practical Aspectsof Knowledge Management (PAKM98), Basel,Switzerland, 29-30 October.
Further reading
Beijerse, R.P. (1999), `̀ Questions in knowledgemanagement: defining and conceptualising aphenomenon'', Journal of Knowledge Management,Vol. 3 No. 2, pp. 94-109.
Chapman, C.B. and Pinfold, M. (1999), `̀ Designengineering ± a need to rethink the solution usingknowledge-based engineering'', Knowledge-basedSystems, Vol. 12, pp. 257-67.
Davenport, T.H. and Prusak, L. (1998), WorkingKnowledge: How Organisations Manage What TheyKnow, Harvard Business School Press, Boston, MA.
Delphi (1997), Delphi on Knowledge Management, TheDelphi Group, Inc., Boston, MA.
Hansen, M.T., Nohria, N. and Tierney, T. (1999), `̀ What'syour strategy for managing knowledge?'', HarvardBusiness Review, March-April, pp. 106-16.
Harvard (1999), `̀ Knowledge management ± return oninvestment'', Harvard Computing Group Report,Vol. 1 No. 2.
Levett, G.P. and Guenov, M.D. (1999), `̀ Genericmethodology for capturing crashworthinessexpertise'', in Automotive Mechatronics Design &Engineering, Proceedings of the 32nd InternationalSymposium on Automotive Technology andAutomation (32nd ISATA), Vienna, Austria,14-18 June.
Levett, G.P. and Vignjevic, R. (1997), `̀ Knowledge-basedsystem for crashworthiness design'', in: Road andVehicle Safety, Proceedings of the 30thInternational Symposium on Automotive Technologyand Automation (30th ISATA), Florence, Italy,16-19 June.
Malhotra, Y. (1998), `̀ Business process redesign: anoverview'', IEEE Engineering Management Review,Vol. 26 No. 3.
Nonaka, I. and Takeuchi, H. (1995), The Knowledge-creating Company, Oxford University Press, NewYork, NY.
Robbins, S.P. (1996), Organizational Behavior: Concepts,Controversies, Applications, 7th ed., Prentice-HallInternational, Inc., NJ.
Roepnack, A., Schindler, M. and Schwan, T. (1998),`̀ Concepts of the enterprise knowledge medium'', inProceedings of the 2nd International Conference onPractical Aspects of Knowledge Management(PAKM98), Basel, Switzerland, 29-30 October.
Scarbrough, H. (1996), Business Process Re-design: TheKnowledge Dimension (WWW document), http://bprc.warwick.ac.uk/rc-rep-8.html (accessed1 November 1999).
Scarbrough, H. and Swan, J. (1999), KnowledgeManagement and the Management FashionPerspective, a paper for the British Academy ofManagement Conference 1999 (WWW document),http://bprc.warwick.ac.uk/wp2.html (accessed1 November 1999).
Schein, E.H. (1999), Three Cultures of Management: TheKey to Organizational Learning in the 21st Century(WWW document), http://learning.mit.edu/res/wp/10011.html (accessed 26 July 1999).
Sveiby, K. (1997), The Balanced Score Card (BSC) and theIntangible Assets Monitor (WWW document), http://www.sveiby.com.au (accessed 2 February 2000).
van der Spek, R. and Spijkervet, A. (1997), KnowledgeManagement: Dealing Intelligently with Knowledge,IBIT nr.1, Kenniscentrum CIBIT, The Netherlands.
269
A methodology for knowledge management implementation
Gavin P. Levett and Marin D. Guenov
Journal of Knowledge Management
Volume 4 . Number 3 . 2000 . 258±269