Embed Size (px)
Citation preview
Journal of Computer and Communications, 2014, 2, 67-77 Published Online December 2014 in SciRes. http://www.scirp.org/journal/jcc http://dx.doi.org/10.4236/jcc.2014.214007
How to cite this paper: Partescano, E. (2014) A Model for Managing Geological and Geophysical Data in Eastern Sicily (Italy) and Possible Applications. Journal of Computer and Communications, 2, 67-77. http://dx.doi.org/10.4236/jcc.2014.214007
A Model for Managing Geological and Geophysical Data in Eastern Sicily (Italy) and Possible Applications Elena Partescano OGS (Istituto Nazionale di Oceanografia e di Geofisica Sperimentale), Sgonico (Trieste), Italy Email: [email protected] Received 14 October 2014; revised 10 November 2014; accepted 15 December 2014
Copyright © 2014 by author and Scientific Research Publishing Inc. This work is licensed under the Creative Commons Attribution International License (CC BY). http://creativecommons.org/licenses/by/4.0/
Abstract The main aim of this work is to describe in detail how to develop an instrument, with the goal of collecting and managing a great deal of both geological and geophysical data acquired using dif-ferent survey typologies in Eastern Sicily (Italy). The opportunity to manage different categories of data, at the same time, allows us to have a complete view of the complex area studied. This paper discusses a software package that has been designed to enhance the efficiency of applying a range of geological and geophysical data. More than 12000 records are archived: boreholes represent 81% of the data and 19% is geophysical data. In this paper it is illustrated how both kinds of data, thanks to the functionalities of the database and the possibility of connecting to a Geographical Information System (GIS), can be used in a variety of different geological studies. We present four studies where is relevant the use of the database, in detail, we show a morpho-structural study, an examination of the spectral analysis of the noise data, an update of the geological and geotechnical maps, and a classification of the areas on the basis of the distribution of the shear wave velocity in the firsts 30 meters (Vs30). They are just some examples of the potentialities of a relational data-base.
Keywords Relational Database, GIS, Morpho-Structural, Noise, Geological Map
1. Introduction To best understand a complex location such as the Sicilian area (Section 1), in the past several geological and geophysical studies were carried out.
E. Partescano
68
Nowadays, it is necessary in studying such a complex area as the one in this paper, not to acquire new infor-mation and data, but to find a tool to manage the range of different data acquired in the past.
The creation of a relational database is the basis of many studies. Indeed to develop, for example, a model of WebGis, it is necessary first of all to create a database to manage the geological data. So, that after identifying the structure and the features of the data, it becomes possible to standardize the data and to identify the best structure of the database, capable of managing the data [1] [2].
A relational database can be the basis of several studies: to investigate the geological hazard [3], to produce geological maps [4], and to investigate the hydrological processes [5]. All these are only a small part of the ap-plications of a database.
The possibility of managing different kinds of data (geological and geophysical) at the same time, gives us the chance to have a complete view of the complex area studied.
In this article we propose a model for simultaneously managing geological and geophysical data, using a Mi-crosoft® Access 2003 database and we will present some possible uses for this potent tool [6].
Geological and geophysical data can provide useful information about both surface and underground features of the Earth and different fields (environmental research, civil engineer, etc.) have used these kinds of data. In this study in particular, geological data are composed of borehole data, while the geophysical data collected consists in measurements about electric tomography, down-hole, noise data, seismic tomography and seismic traverse. An important feature of a database is the capacity to join vast amounts and diversity of data and on this occasion is the best solution for managing different kinds of geological data.
In this article, we describe a database whose structure was modeled around the data and the purpose of the re-search.
To create the relational database five steps were needed: the first step was the choice of the kind of database (relational or not); the second step was to join the tables (Section 2); the third step was to insert records (Section 3); the fourth step was to test the recovery operations using the query expressed in a language such as SQL (Structured Query Language) and the macro; the last step was to build an interface (Section 4) to extract and in-sert the data.
In addition, in this paper, we present four case examples of the use of this database (Section 5).
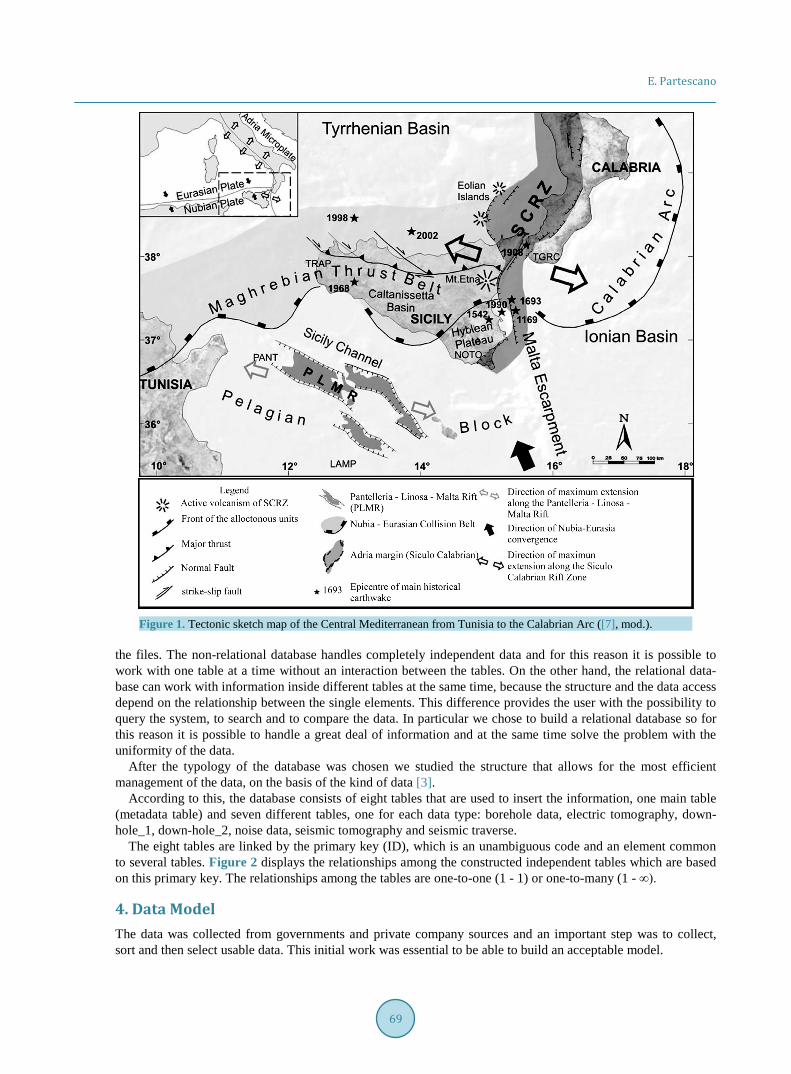
2. Geological Setting Sicily is located in the center of the Mediterranean Sea and its principal tectonic elements were generated from the convergence between Europe and Africa. This created a geologically and tectonically complex area (Figure 1).
Sicily is situated near the Nubia-Eurasia convergent boundary [8] [9], where the Neogene-Quaternary South- Eastern-verging Maghrebian Thrust Belt was created. The collision belt is confined, to the east, by the Siculo- Calabrian Rift Zone (SCRZ) [10] and it represents an incipient divergent margin. To the north, the collision belt is bordered by the Tyrrhenian Basin, which opens into the back-arc area of the belt.
In Eastern Sicily, the rift zone continues toward the Hyblean Plateau going through the Straits of Messina and the eastern flank of Mount Etna. The rift zone, in the Catania area, is composed of NNW trending oblique (dex-tral) extensional faults that are distributed from the eastern flank of Mt. Etna to the Ionian off-shore of the Hy-blean Plateau [11]-[13].
To the south of the collision belt the foreland domain is involved in a continental rifting (Pantelleria - Linosa - Malta Rift) [7].
3. Data and Database Structure Public and private agencies provided us with the data.
The original format of the data had different typologies, being either in paper or digital formats. All the data was georeferenced, standardized ad digitalized and after entered into the database. The database was built with Microsoft® Access 2003. Access is a widespread relational database manage-
ment system that integrates a fast search engine, is easily programmable, and facilitates the generation of user- friendly interfaces.
The first step of this job was to choose the typology of the database. The first classification of databases is into relational and non relational. The principal difference between these two typologies is inside the handling of
E. Partescano
69
Figure 1. Tectonic sketch map of the Central Mediterranean from Tunisia to the Calabrian Arc ([7], mod.).
the files. The non-relational database handles completely independent data and for this reason it is possible to work with one table at a time without an interaction between the tables. On the other hand, the relational data-base can work with information inside different tables at the same time, because the structure and the data access depend on the relationship between the single elements. This difference provides the user with the possibility to query the system, to search and to compare the data. In particular we chose to build a relational database so for this reason it is possible to handle a great deal of information and at the same time solve the problem with the uniformity of the data.
After the typology of the database was chosen we studied the structure that allows for the most efficient management of the data, on the basis of the kind of data [3].
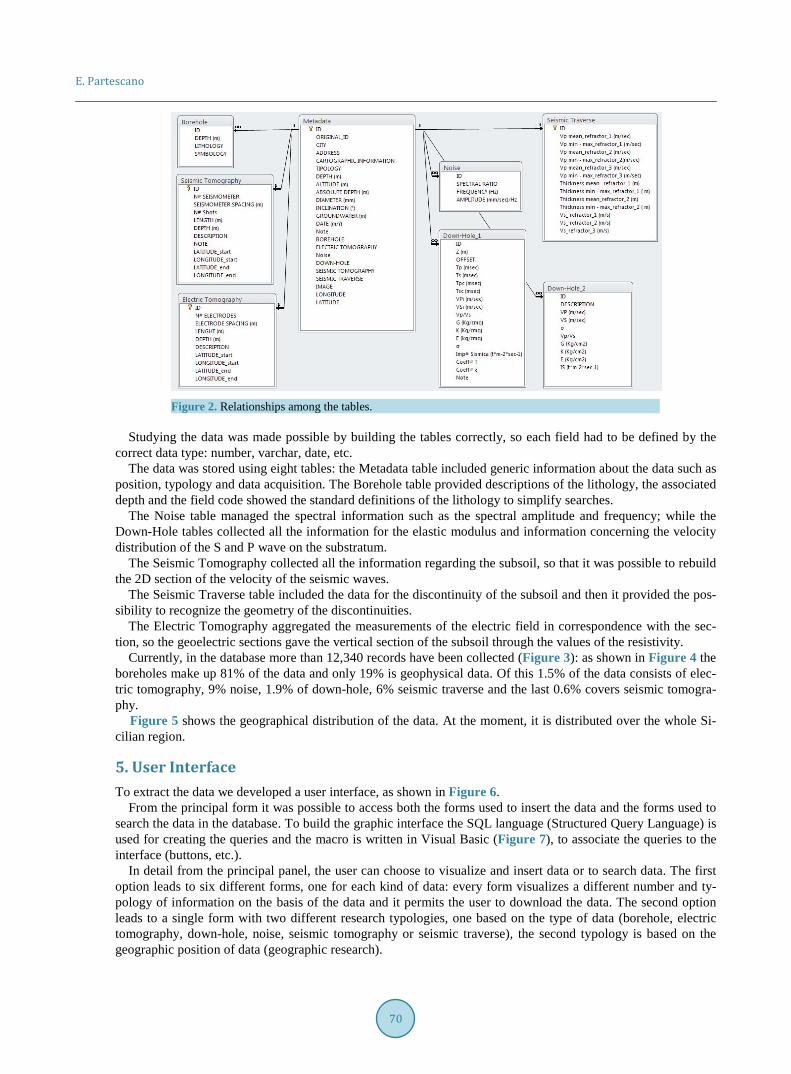
According to this, the database consists of eight tables that are used to insert the information, one main table (metadata table) and seven different tables, one for each data type: borehole data, electric tomography, down- hole_1, down-hole_2, noise data, seismic tomography and seismic traverse.
The eight tables are linked by the primary key (ID), which is an unambiguous code and an element common to several tables. Figure 2 displays the relationships among the constructed independent tables which are based on this primary key. The relationships among the tables are one-to-one (1 - 1) or one-to-many (1 - ∞).
4. Data Model The data was collected from governments and private company sources and an important step was to collect, sort and then select usable data. This initial work was essential to be able to build an acceptable model.
E. Partescano
70
Figure 2. Relationships among the tables.
Studying the data was made possible by building the tables correctly, so each field had to be defined by the
correct data type: number, varchar, date, etc. The data was stored using eight tables: the Metadata table included generic information about the data such as
position, typology and data acquisition. The Borehole table provided descriptions of the lithology, the associated depth and the field code showed the standard definitions of the lithology to simplify searches.
The Noise table managed the spectral information such as the spectral amplitude and frequency; while the Down-Hole tables collected all the information for the elastic modulus and information concerning the velocity distribution of the S and P wave on the substratum.
The Seismic Tomography collected all the information regarding the subsoil, so that it was possible to rebuild the 2D section of the velocity of the seismic waves.
The Seismic Traverse table included the data for the discontinuity of the subsoil and then it provided the pos-sibility to recognize the geometry of the discontinuities.
The Electric Tomography aggregated the measurements of the electric field in correspondence with the sec-tion, so the geoelectric sections gave the vertical section of the subsoil through the values of the resistivity.
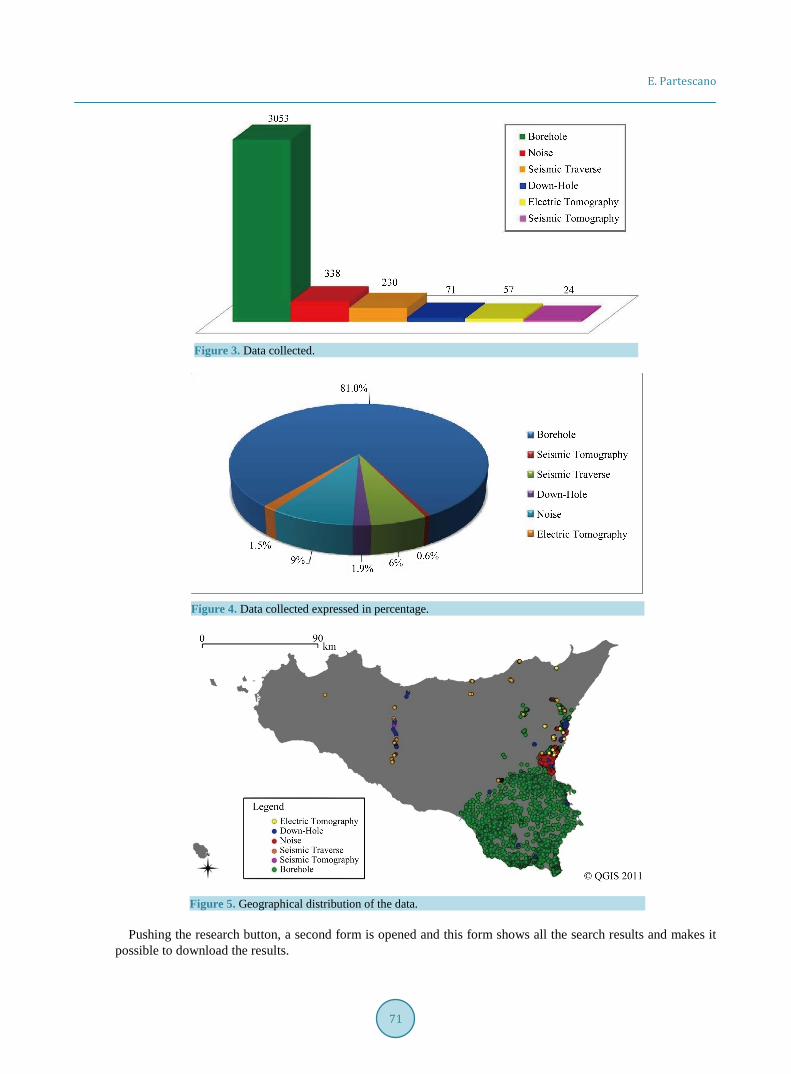
Currently, in the database more than 12,340 records have been collected (Figure 3): as shown in Figure 4 the boreholes make up 81% of the data and only 19% is geophysical data. Of this 1.5% of the data consists of elec-tric tomography, 9% noise, 1.9% of down-hole, 6% seismic traverse and the last 0.6% covers seismic tomogra-phy.
Figure 5 shows the geographical distribution of the data. At the moment, it is distributed over the whole Si-cilian region.
5. User Interface
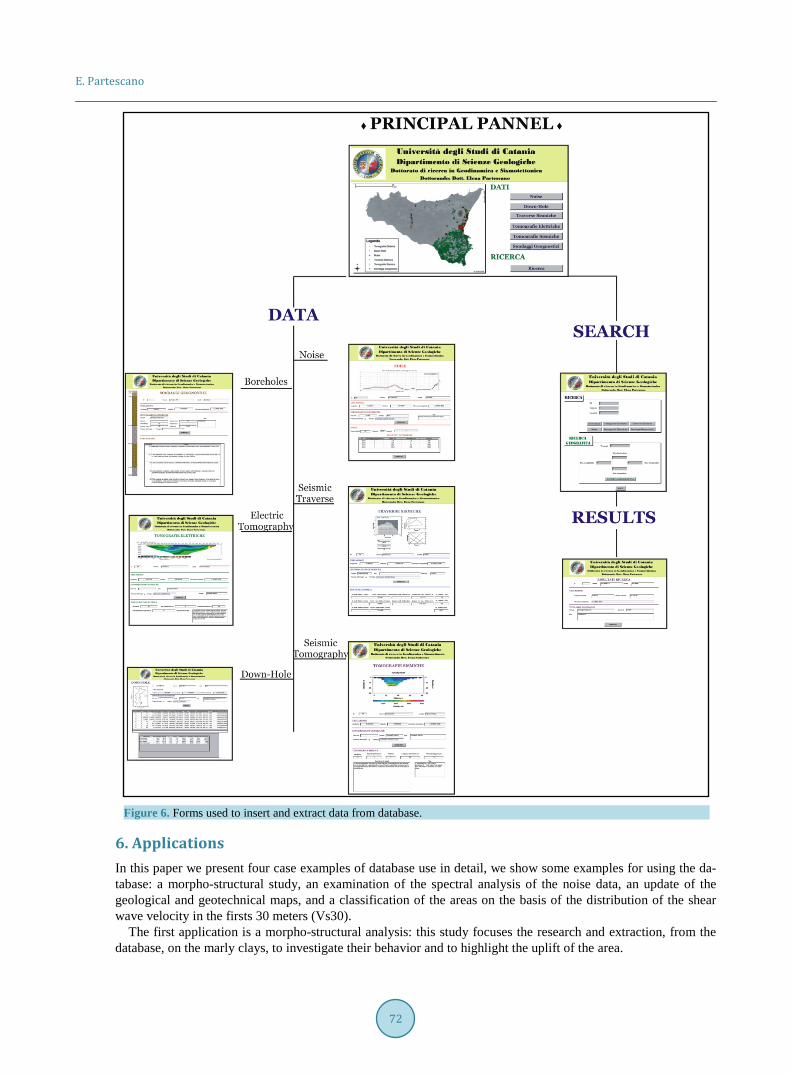
To extract the data we developed a user interface, as shown in Figure 6. From the principal form it was possible to access both the forms used to insert the data and the forms used to
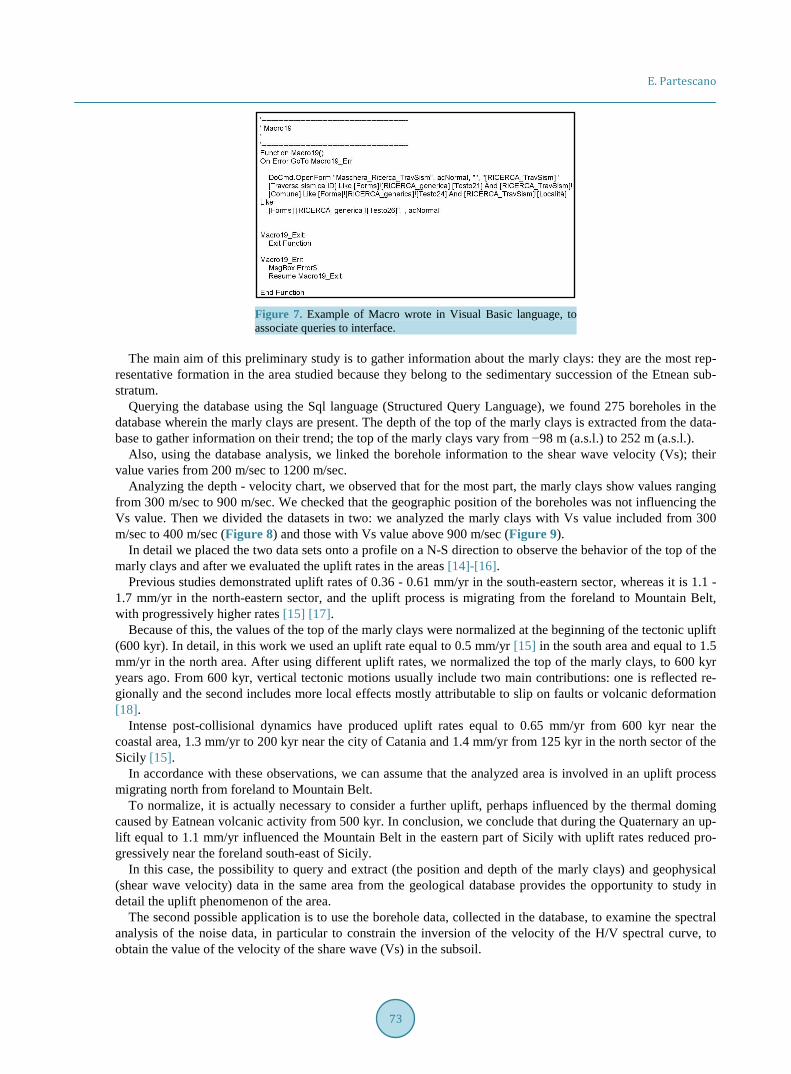
search the data in the database. To build the graphic interface the SQL language (Structured Query Language) is used for creating the queries and the macro is written in Visual Basic (Figure 7), to associate the queries to the interface (buttons, etc.).
In detail from the principal panel, the user can choose to visualize and insert data or to search data. The first option leads to six different forms, one for each kind of data: every form visualizes a different number and ty-pology of information on the basis of the data and it permits the user to download the data. The second option leads to a single form with two different research typologies, one based on the type of data (borehole, electric tomography, down-hole, noise, seismic tomography or seismic traverse), the second typology is based on the geographic position of data (geographic research).
E. Partescano
71
Figure 3. Data collected.
Figure 4. Data collected expressed in percentage.
Figure 5. Geographical distribution of the data.
Pushing the research button, a second form is opened and this form shows all the search results and makes it
possible to download the results.
E. Partescano
72
Figure 6. Forms used to insert and extract data from database.
6. Applications
In this paper we present four case examples of database use in detail, we show some examples for using the da-tabase: a morpho-structural study, an examination of the spectral analysis of the noise data, an update of the geological and geotechnical maps, and a classification of the areas on the basis of the distribution of the shear wave velocity in the firsts 30 meters (Vs30).
The first application is a morpho-structural analysis: this study focuses the research and extraction, from the database, on the marly clays, to investigate their behavior and to highlight the uplift of the area.
E. Partescano
73
Figure 7. Example of Macro wrote in Visual Basic language, to associate queries to interface.
The main aim of this preliminary study is to gather information about the marly clays: they are the most rep-
resentative formation in the area studied because they belong to the sedimentary succession of the Etnean sub-stratum.
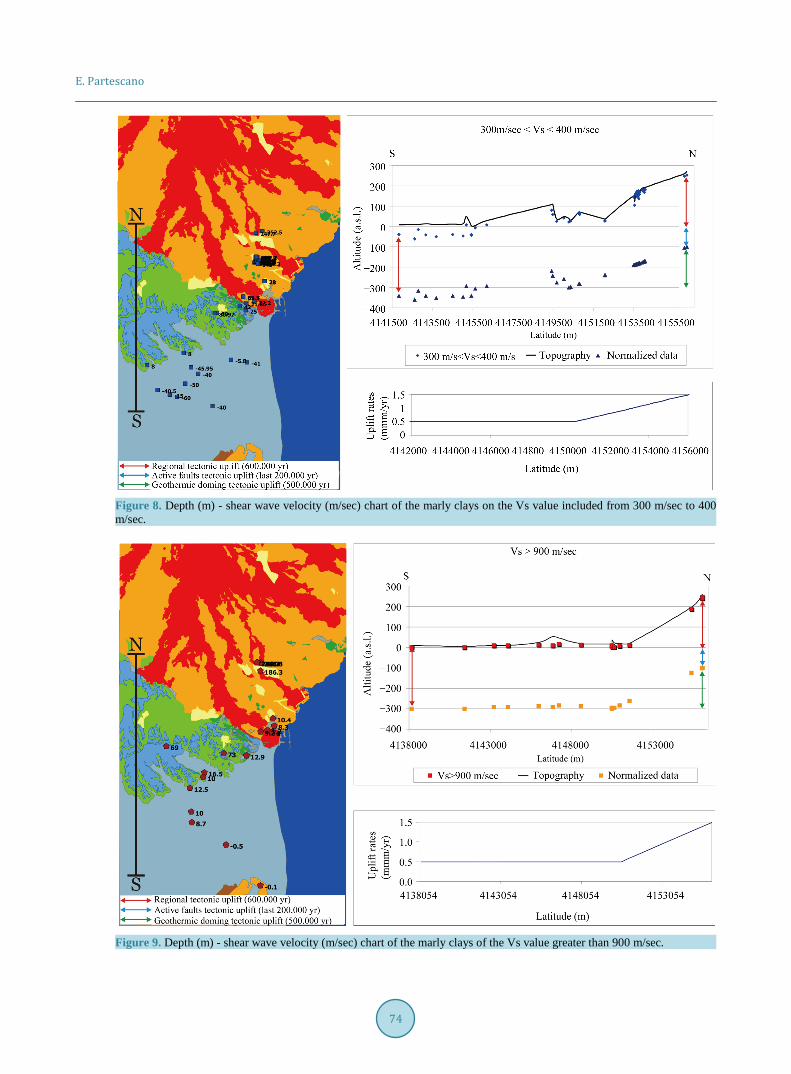
Querying the database using the Sql language (Structured Query Language), we found 275 boreholes in the database wherein the marly clays are present. The depth of the top of the marly clays is extracted from the data-base to gather information on their trend; the top of the marly clays vary from −98 m (a.s.l.) to 252 m (a.s.l.).
Also, using the database analysis, we linked the borehole information to the shear wave velocity (Vs); their value varies from 200 m/sec to 1200 m/sec.
Analyzing the depth - velocity chart, we observed that for the most part, the marly clays show values ranging from 300 m/sec to 900 m/sec. We checked that the geographic position of the boreholes was not influencing the Vs value. Then we divided the datasets in two: we analyzed the marly clays with Vs value included from 300 m/sec to 400 m/sec (Figure 8) and those with Vs value above 900 m/sec (Figure 9).
In detail we placed the two data sets onto a profile on a N-S direction to observe the behavior of the top of the marly clays and after we evaluated the uplift rates in the areas [14]-[16].
Previous studies demonstrated uplift rates of 0.36 - 0.61 mm/yr in the south-eastern sector, whereas it is 1.1 - 1.7 mm/yr in the north-eastern sector, and the uplift process is migrating from the foreland to Mountain Belt, with progressively higher rates [15] [17].
Because of this, the values of the top of the marly clays were normalized at the beginning of the tectonic uplift (600 kyr). In detail, in this work we used an uplift rate equal to 0.5 mm/yr [15] in the south area and equal to 1.5 mm/yr in the north area. After using different uplift rates, we normalized the top of the marly clays, to 600 kyr years ago. From 600 kyr, vertical tectonic motions usually include two main contributions: one is reflected re-gionally and the second includes more local effects mostly attributable to slip on faults or volcanic deformation [18].
Intense post-collisional dynamics have produced uplift rates equal to 0.65 mm/yr from 600 kyr near the coastal area, 1.3 mm/yr to 200 kyr near the city of Catania and 1.4 mm/yr from 125 kyr in the north sector of the Sicily [15].
In accordance with these observations, we can assume that the analyzed area is involved in an uplift process migrating north from foreland to Mountain Belt.
To normalize, it is actually necessary to consider a further uplift, perhaps influenced by the thermal doming caused by Eatnean volcanic activity from 500 kyr. In conclusion, we conclude that during the Quaternary an up-lift equal to 1.1 mm/yr influenced the Mountain Belt in the eastern part of Sicily with uplift rates reduced pro-gressively near the foreland south-east of Sicily.
In this case, the possibility to query and extract (the position and depth of the marly clays) and geophysical (shear wave velocity) data in the same area from the geological database provides the opportunity to study in detail the uplift phenomenon of the area.
The second possible application is to use the borehole data, collected in the database, to examine the spectral analysis of the noise data, in particular to constrain the inversion of the velocity of the H/V spectral curve, to obtain the value of the velocity of the share wave (Vs) in the subsoil.
E. Partescano
74
Figure 8. Depth (m) - shear wave velocity (m/sec) chart of the marly clays on the Vs value included from 300 m/sec to 400 m/sec.
Figure 9. Depth (m) - shear wave velocity (m/sec) chart of the marly clays of the Vs value greater than 900 m/sec.
E. Partescano
75
The technique used is an indirect, passive geophysical methodology for investigating the subsoil [19] [20], for this reason it needed to be calibrated using the stratigraphic information which came from the boreholes.
To start the inversion procedure, it is necessary to know the depth of one reflector, for this, we used the strati-graphic data inside the database.
It is important to know the depth of the first reflector and to recognize, on the H/V spectral curve, the corre-sponding frequency. Starting from this value it is possible to activate the inversion analysis. Using the inversion analysis of the spectra the value of the Vs in the substratum can be estimated. After, these values of Vs are loaded into the database and they would be used for future study.
This is a good example how geological data can be used to investigate the geophysical features of substratum and how a database, that relates different kind of data, could be useful.
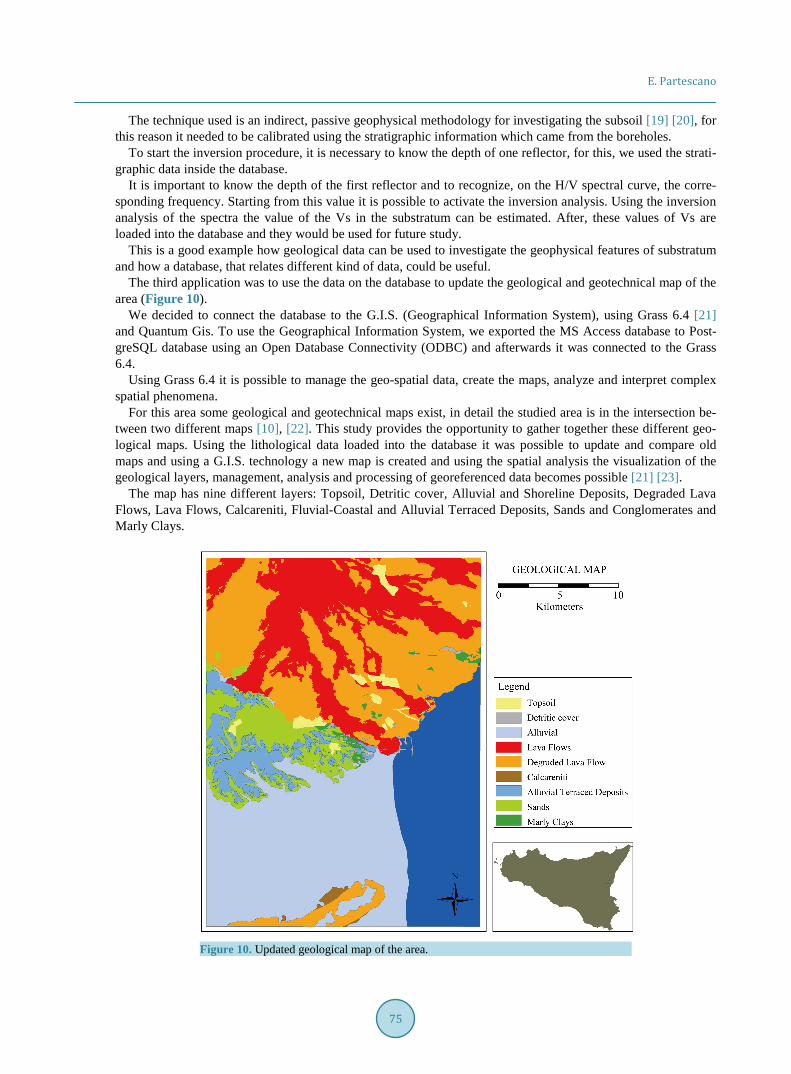
The third application was to use the data on the database to update the geological and geotechnical map of the area (Figure 10).
We decided to connect the database to the G.I.S. (Geographical Information System), using Grass 6.4 [21] and Quantum Gis. To use the Geographical Information System, we exported the MS Access database to Post-greSQL database using an Open Database Connectivity (ODBC) and afterwards it was connected to the Grass 6.4.
Using Grass 6.4 it is possible to manage the geo-spatial data, create the maps, analyze and interpret complex spatial phenomena.
For this area some geological and geotechnical maps exist, in detail the studied area is in the intersection be-tween two different maps [10], [22]. This study provides the opportunity to gather together these different geo-logical maps. Using the lithological data loaded into the database it was possible to update and compare old maps and using a G.I.S. technology a new map is created and using the spatial analysis the visualization of the geological layers, management, analysis and processing of georeferenced data becomes possible [21] [23].
The map has nine different layers: Topsoil, Detritic cover, Alluvial and Shoreline Deposits, Degraded Lava Flows, Lava Flows, Calcareniti, Fluvial-Coastal and Alluvial Terraced Deposits, Sands and Conglomerates and Marly Clays.
Figure 10. Updated geological map of the area.
E. Partescano
76
The advantage of having a database gives us the opportunity to quickly query and extract all the information needed to create a new map.
The last application is to use the geophysical data to create an interpolated map of the Vs30 data to classify the area following the ministerial directives [24].
We used the values of the velocity of the share waves in the firsts 30 meters to calculate the value of Vs30. It is a parameter described and used in the Italian ministerial directives to define the different categories of the ground used as foundation.
Querying and extracting from the database, the interested values were used to calculate the Vs30 parameter and then the values were plotted onto a map where it became possible to see the distribution of the Vs30 value on the area. In detail, using the information contained in the database, it is possible to have a preliminary distri-bution of the Vs30; this information would be used in future studies.
7. Conclusions
Sicily is located in a complex geological area and a database can be an excellent tool for managing (download-ing and viewing) geological and geophysical data and the application of uses are multiple and in this work we decided to focus our attention on four of them.
A good advantage in these studies was connecting the database to a G.I.S. (Geographical Information System), using Grass 6.4.
The first application was the morpho-structural analyses in a particular area of the Sicily and focus, research and extraction on the marly clays from the database to study their behavior, to constrain the uplift of the area.
The second possible application was to use the borehole data, collected in the database, to examine the spec-tral analysis of the noise data, in particular to constrain the inversion of the velocity of the H/V spectral curve, to obtain the value of the Vs of the subsoil.
The third application was to use the data in the database to update the geological and geotechnical map of the area.
The last application was to use the geophysical data to create an interpolated map of the Vs30 data to classify the area following the ministerial directives.
In future, we hope to increase the amount of data loaded into the database and to extend the typology of data.
Acknowledgements The author is grateful to Professor S. Imposa, Professor G. De Guidi and Professor C. Monaco for comments and suggestions.
I would like to thank Catania University, the Genio Civile of Catania, the Comune of Trecastagni, the Provin-cia of Catania and Dr. A. Privitera, for data used in that research. This research was supported by grants from Catania University.
References [1] Chang, Y. and Park, H.D. (2004) Development of a Web-Based Geographic Information System for the Management
of Borehole and Geological Data. Computers & Geosciences, 30, 887-897. http://dx.doi.org/10.1016/j.cageo.2004.07.006
[2] Marsh, R. (2003) A Database of Archived Drilling Records of the Drill Cuttings Piles at the North West Hutton Oil Platform. Marine Pollution Bulletin, 46, 587-593. http://dx.doi.org/10.1016/S0025-326X(03)00041-9
[3] Alberico, I., Petrosino, P., Zeni, G., D’Andrea, F. and Lirer, L. (2005) GEOCITY: A Drill-Hole Database as a Tool to Assess Geological Hazard in Napoli Urban Area. Environmental Geology, 47, 751-762. http://dx.doi.org/10.1007/s00254-004-1199-5
[4] Laxton, J.L. and Becken, K. (1996) The Design and Implementation of a Spatial Database for the Production of Geo-logical Maps. Computers & Geosciences, 22, 723-733. http://dx.doi.org/10.1016/0098-3004(95)00128-X
[5] Hughes, D.A. and Forsyth, D.A. (2006) A Generic Database and Spatial Interface for the Application of Hydrological and Water Resource Models. Computers & Geosciences, 32, 1389-1402. http://dx.doi.org/10.1016/j.cageo.2005.12.013
[6] Partescano, E. (2012) Geodatabase: A Tool for Managing Geological and Geophysical Data. Rend. Online Soc. Geol. It., 21, 729-730
[7] Catalano, S., Romagnoli, G. and Tortorici, G. (2010) Kinematics and Dynamics of the Late Quaternary Rift-Flank De-
E. Partescano
77
formation in the Hyblean Plateau (SE Sicily). Tectonophysics, 486, 1-14. http://dx.doi.org/10.1016/j.tecto.2010.01.013 [8] Dewey, J.F., Helman, M.L., Turco, E., Hutton, D.H.W. and Knott, S.D. (1989) Kinematics of the Western Mediterra-
nean. Alpine Tectonics, Geological Society Special Publications, 45, 265-283. [9] Serpelloni, E., Vannucci, G., Pondrelli, S., Argnani, A., Casula, G., Anzidei, M., Baldi, P. and Gasperini, P. (2007)
Kinematics of the Western Africa-Eurasia Plates Boundary from Focal Mechanisms and GPS Data. Geophysical Jour-nal International, 169, 1180-1200. http://dx.doi.org/10.1111/j.1365-246X.2007.03367.x
[10] Monaco, C. and Tortorici, L. (2000) Active Faulting in the Calabrian Arc and Eastern Sicily. Journal of Geodynamics, 29, 407-424. http://dx.doi.org/10.1016/S0264-3707(99)00052-6
[11] Monaco, C., Catalano, S., De Guidi, G., Gresta, S., Langer, H. and Tortorici, L. (2000) The Geological Map of the Ur-ban Area of Catania (Eastern Sicily): Morphotectonic and Seismotectonic Implications. Memorie Società Geologica Italiana, 55, 425-438.
[12] Catalano, S. and De Guidi, G. (2003) Late Quaternary Uplift of Northeastern Sicily: Relation with the Active Normal Faulting Deformation. Journal of Geodynamics, 36, 445-467. http://dx.doi.org/10.1016/S0264-3707(02)00035-2
[13] Catalano, S., De Guidi, G., Romagnoli, G., Torrisi, S., Tortorici, G. and Tortorici, L. (2008) The Migration of Plate Boundaries in SE Sicily: Influence on the Large Scale Kinematic Model of the African Promontory in Southern Italy. Tectonophysics, 449, 41-62. http://dx.doi.org/10.1016/j.tecto.2007.12.003
[14] Di Stefano, A. and Branca, S. (2002) Long-Term Uplift Rate of the Etna Volcano Basement (Southern Italy) Based on Biochronological Data from Pleistocene Sediments. Terra Nova, 14, 61-68. http://dx.doi.org/10.1046/j.1365-3121.2002.00389.x
[15] Monaco, C., Bianca, M., Catalano, S., De Guidi, G. and Tortorici, L. (2002) Sudden Change in the Late Quaternary Tectonic Regime in Eastern Sicily: Evidences from Geological and Geomorphological Features. Bollettino Società Ge-ologica Italiana, 1, 901-913.
[16] Catalano, S., De Guidi, G., Tortorici, G. and Tortorici, L. (2003) Long-Term Behaviour of the Late Quaternary Normal Faults in the Straits of Messina Area (Calabrian Arc): Structural and Morphological Constraints. Quaternary Interna-tional, 102, 81-91. http://dx.doi.org/10.1016/S1040-6182(02)00091-5
[17] Monaco, C., Antonioli, F., De Guidi, G., Lambeck, K., Tortorici, L. and Verrubbi, V. (2004) Holocene Tectonic Uplift of the Catania Plain (Eastern Sicily). Quaternaria Nova, 8, 171-185. http://dx.doi.org/10.1016/j.tecto.2006.05.003
[18] Antonioli, F., Ferranti, L., Lambeck, K., Kershaw, S., Verrubbi, V. and Dai Pra, G. (2006) Late Pleistocene to Holo-cene Record of Changing Uplift Rates in Southern Calabria and Northeastern Sicily (Southern Italy, Central Mediter-ranean Sea). Tectonophysics, 422, 23-40.
[19] Castellaro, S., Mulargia, F. and Bianconi, L. (2005) Passive Seismic Stratigraphy: A New Efficient, Fast and Economic Technique. Geologia Tecnica e Ambiente, 3, 76-102.
[20] Castellaro, S. and Mulargia, F. (2009) VS30 Estimates Using Constrained H/V Measurements. Bulletin of the Seis-mological Society of America, 99, 761-773. http://dx.doi.org/10.1785/0120080179
[21] Neteler, M. and Mitasova, H. (2004) Open Source GIS: A Grass Gis Approach. Kluwer Academic Publishers, Boston, 424 p.
[22] Monaco, C., De Guidi, G., Catalano, S., Ferlito, C., Tortorici, G. and Tortorici, L. (2008) The Morphotectonic Map of Mt. Etna. Rendiconti Online Societa Geologica Italiana, 1, 217-218.
[23] Graci, G. and Sedazzari, M. (2008) GIS e Ambiente. Dario Flaccovio Editore, Palermo, 270 p. [24] Decreto Ministeriale del 14/01/2008. Norme Tecniche per le Costruzioni.


![Hydrocarbon Volumetric Analysis Using Seismic and …file.scirp.org/pdf/IJG20110200011_38259324.pdf · sary geological reinterpretation [1]. Among the informa-tion needed to estimate](https://img.pdfslide.net/doc/110x75/5b7a146e7f8b9aad4c8b4d9d/hydrocarbon-volumetric-analysis-using-seismic-and-filescirporgpdfijg20110200011.jpg)