Embed Size (px)
Citation preview
METHODOLOGY ARTICLE Open Access
A multivariate approach to the integration ofmulti-omics datasetsChen Meng1, Bernhard Kuster1,2, Aedín C Culhane3,4* and Amin Moghaddas Gholami1*
Abstract
Background: To leverage the potential of multi-omics studies, exploratory data analysis methods that providesystematic integration and comparison of multiple layers of omics information are required. We describe multipleco-inertia analysis (MCIA), an exploratory data analysis method that identifies co-relationships between multiple highdimensional datasets. Based on a covariance optimization criterion, MCIA simultaneously projects several datasetsinto the same dimensional space, transforming diverse sets of features onto the same scale, to extract the mostvariant from each dataset and facilitate biological interpretation and pathway analysis.
Results: We demonstrate integration of multiple layers of information using MCIA, applied to two typical “omics”research scenarios. The integration of transcriptome and proteome profiles of cells in the NCI-60 cancer cell linepanel revealed distinct, complementary features, which together increased the coverage and power of pathwayanalysis. Our analysis highlighted the importance of the leukemia extravasation signaling pathway in leukemia thatwas not highly ranked in the analysis of any individual dataset. Secondly, we compared transcriptome profiles ofhigh grade serous ovarian tumors that were obtained, on two different microarray platforms and next generationRNA-sequencing, to identify the most informative platform and extract robust biomarkers of molecular subtypes.We discovered that the variance of RNA-sequencing data processed using RPKM had greater variance than thatwith MapSplice and RSEM. We provided novel markers highly associated to tumor molecular subtype combinedfrom four data platforms. MCIA is implemented and available in the R/Bioconductor “omicade4” package.
Conclusion: We believe MCIA is an attractive method for data integration and visualization of several datasets ofmulti-omics features observed on the same set of individuals. The method is not dependent on feature annotation,and thus it can extract important features even when there are not present across all datasets. MCIA providessimple graphical representations for the identification of relationships between large datasets.
Keywords: Multivariate analysis, Multiple co-inertia, Data integration, Omic data, Visualization
BackgroundThere has been rapid progress in high-throughput tech-nologies and platforms to assay global mRNA, miRNA,methylation, proteins, and metabolite profiles of cells arereadily available. Advances in RNA-sequencing and massspectrometry (MS) based proteomics have dramaticallyimproved coverage and quality of genomic, transcrip-tomic and proteomic profiling [1-4]. Increasing numberof studies including The Cancer Genome Atlas (TCGA)
and ENCyclopedia of DNA Elements (ENCODE) pro-jects systematically profile large number of biologicalsamples resulting in multiple levels of quantitative infor-mation [5-8]. Recent advances of MS based proteomicsprovide a complementary approach to genomics andtranscriptomic technologies [3,4] and systematic analysescan now be carried out to identify and quantify the ma-jority of proteins expressed in human cells [9-12]. Thesedata yield unprecedented views of molecular buildingblocks and the machinery of cells. Interpreting theselarge-scale datasets to derive information about a bio-logical system represents a considerable challenge oftenfaced by investigators.Multiple omics data analysis can be broadly defined by
some common questions, which are dependent on the
* Correspondence: [email protected]; [email protected] of Biostatistics and Computational Biology, Dana-Farber CancerInstitute, Boston, MA 02215, USA1Chair of Proteomics and Bioanalytics, Technische Universität München,Freising, GermanyFull list of author information is available at the end of the article
© 2014 Meng et al.; licensee BioMed Central Ltd. This is an Open Access article distributed under the terms of the CreativeCommons Attribution License (http://creativecommons.org/licenses/by/2.0), which permits unrestricted use, distribution, andreproduction in any medium, provided the original work is properly credited. The Creative Commons Public DomainDedication waiver (http://creativecommons.org/publicdomain/zero/1.0/) applies to the data made available in this article,unless otherwise stated.
Meng et al. BMC Bioinformatics 2014, 15:162http://www.biomedcentral.com/1471-2105/15/162
data collected; multiple datasets measuring the samebiological molecules or multiple datasets each measuringdifferent biological molecules. In the first case, givenmultiple transcriptomics data from different microarrayor RNA-sequencing studies, the aim may be to discoverwhich platform is the most informative with highestquality data, identify robust biomarkers across datasetsor highlight platform specific discrepancies in measure-ments. In the second case, given multiple different datasuch as transcripts, proteins and metabolites, the object-ive may be to integrate and concatenate information toincrease the breath and coverage of available data in abiological network. In this case, specific platform dis-crepancies are less important and performance of dataintegration is more likely to be assessed using systembiology or pathway approaches.Nevertheless, both analyses face common challenges
associated with integrating data from disparate technolo-gies. Several meta-analysis studies map identifiers fromeach platform to a common set of identifiers to generatea single concatenated matrix for subsequent analysis[13,14]. However, this data simplification overlooks sev-eral fundamental platform and biological biases. Plat-forms are not universal and measure different molecules.Filtering genes to their intersection may considerablyreduce data coverage. In addition, the many-to-manymapping of gene identifiers from multiple platformscomplicates direct comparison of molecules across mul-tiple levels. Moreover, because correlations between dif-ferent platforms are probably lower than expected [15],it may not provide gains in data quality or study power.Such filtering may also introduce bias because platformdiscrepancies could reflect biological variation. For in-stance, poor correlation between a transcript and itstranslated protein may result from biological processessuch as microRNA post-transcriptional repression [16,17].Similarly, correlations between proteins and metabolitesof pathways can diverge if proteins are expressed in an in-active form, in which case its abundance may not repre-sent activity.Ordination methods, such as principal component
analysis (PCA), independent component analysis (ICA)and correspondence analysis (COA), are exploratorydata analysis approaches that have been applied toanalyze omics data including transcriptome and prote-ome studies [18-22]. Graphical representation of mea-surements (samples) and variables (genes, proteins) on alower dimensional space facilitates interpretation of glo-bal variance structure and identification of the most in-formative (or variant) features across datasets. Thesemethods permit visualization of data that have consider-able levels of noise and data where the number of vari-ables exceeds the number of measurements, which istypical in omics studies. However, these approaches do
not solve the problem of comparing many datasetssimultaneously.Studies have extended these approaches to couple two
datasets together [23]. One such approach is co-inertiaanalysis (CIA) [24]. CIA was originally applied to studyecological and environmental tables, where it wasemployed to link environmental variables with speciescharacteristics [25]. Culhane and colleagues introducedCIA in genomics, when they compared data from twomicroarray platforms [26]. An advantage of this methodis that it does not require the mapping or filtering ofgenes to a common set. The relationship between co-inertia analysis and related methods including Procrustesanalysis [24], canonical correlation analysis with ElasticNet penalization (CCA-EN) and sparse Partial LeastSquares (sPLS) have been described previously [27]. CIAand sPLS both maximize the covariance between eigen-vectors and are efficient in determining main individualeffects in paired dataset analysis. By contrast CCA-ENmaximizes the correlation between eigenvectors andtends to discover effects present in both datasets, butmay omit to discover strong individual effects. Variablesselected by CCA-EN and sPLS are highly similar butCIA selected marginally different marker genes that mayhave some redundancy [27]. A noteworthy advantage ofCIA is that it can be coupled with several dimension re-duction approaches, including PCA or correspondenceanalysis, such that it can accommodate both discretecount data (e.g. somatic mutation) and continuous data[26]. These approaches are performed on each datasetseparately and can be integrated using CIA [24]. How-ever, all above methods including CIA are limited to theanalysis of two datasets, limiting their application inmodern multi-omics studies. Several approaches havebeen proposed for integrating more than two datasets,such as consensus PCA (CPCA) [28], regularized gener-alized canonical correlation analysis (RGCCA) [29],sparse generalized canonical correlation analysis (SGCCA)[30] and penalized canonical correlation analysis (PCCA)[31]. SGCCA and PCCA originally focus on the feature se-lection from multiple datasets, but also can be used formultiple table integration problem.Here, we describe another method, multiple co-inertia
analysis (MCIA), for the analysis of more than twoomics datasets, extending its application in the field ofenvironmental science and, recently, phylogenetics [32].MCIA is related to consensus PCA (CPCA) which bothmaximize the square covariance between eigenvectorsand are subject to similar constraints [28]. CPCA is lesssensitive to multi-collinearity within each dataset thangeneralized canonical correlation analysis [28]. We illus-trate the application of MCIA using two different ex-amples, and show that integrated analysis is moreinsightful than analysis of the individual datasets. First,
Meng et al. BMC Bioinformatics 2014, 15:162 Page 2 of 13http://www.biomedcentral.com/1471-2105/15/162
we demonstrated the power of MCIA via applying it tothe integration and comparison of multi-omics data in-dependent of data annotation. We employed MCIA toidentify common relationships among multiple gene andprotein expression data of the NCI-60 cancer cell linepanel of the National Cancer Institute [8,11,33]. The in-tegrated analysis revealed that cell lines are clustered ac-cording to anatomical tissue source and showed asignificant degree of correlation between transcript andprotein expression. Second, we assessed the concordancein gene expression data obtained from microarray andnext generation RNA-sequencing of 266 samples of highgrade serous ovarian cancer. MCIA integrated ovariancancer gene expression data from different sources whichcaptured distinct subsets of the transcriptome (<47% ofgenes were present on all four platforms) to reveal a set ofbiomarkers that were consistently highly ranked by allfour platforms and were biologically relevant to ovariancancer. To enable community access to MCIA, we imple-mented the method into the R-Bioconductor (omicade4)package as an easy-to-use tool for bioinformaticians andbiologists.
MethodsMathematical basis of MCIAA typical omics dataset is a matrix where the number offeatures exceeds the number of measurements (rows andcolumns of the matrix, respectively). MCIA requires aset of tables where either features or measurements arematched and have equal weights. MCIA is performed ina two-step process. First a one table ordination method,such as PCA, COA or non-symmetric correspondenceanalysis (NSC) [34] is applied on each dataset separately,which transforms data into comparable lower dimen-sional spaces.In our analysis, given an omics data table M = [mij]
with 1 ≤ i ≤ n and 1 ≤ j ≤ q, where M is a (n x q) matrix, iindicates row index and j for column index. We denotethe row and column sums of M as mi+ and m+j respect-ively, and m++ as the grand total. The relative contribu-tion or weight of row i to the total variation in the dataset is denoted ri and calculated as ri = mi+/m++ while therelative contribution of column j is denoted as cj = m+j/m++. Similarly, the contribution of each individualelement of M to the total variation pij can be calculatedas pij = mij/m++. We then derive a new matrix X with thevalues defined above as
xij ¼pijri−cj ð1Þ
where xij is the centered row profile, i.e. the relativeabundance of selected variable to the measurement’sweight.
The second step in MCIA is a generalization of CIA[26]. It solves the problem of simultaneous analysis of aset of statistical triplet (Xk, Qk, D) where k = 1, …, k,…,K and Xk is a set of transformed matrices. Qk is a qk ×qk matrix with rij in diagonal elements, indicating thehyperspace of features metrics. D is an n × n matrixwhich is an identity matrix indicating equal weightacross all columns in all tables. MCIA maximizes thesum of the squared covariance between scores of eachtable with synthetic axes ν, that is:
f u1;…;uk;…;uK; vð Þ ¼XK
k¼1
wkcov2 XkQkuk; vð Þ ð2Þ
where cov2 stands for the square of covariance of quan-tities inside parenthesis and ωk is the weight of eachtable. The v represents the reference structure or syn-thetic center and uk are auxiliary axes. The score of eachindividual table would then be XkQkuk. In contrast withother ordination methods, MCIA finds solutions (uk andv) sequentially. Multiple matrices Xk can be weightedand concatenated to a single matrix X = [ω1
1/2X1 |…| ωK1/2
XK]. Similarly, a single feature metric Q could beconcatenated as Q = [Q1|…|Qk].The first order solutionsof u1
1 to uk1 and v1 are given by the first principal compo-
nent of the following eigen-system:
wXQXTDv ¼ λv ð3Þthen the normalized auxiliary axis uk
1 are
u1k ¼ XT
KDv1=jjXTKDv1jjQk
k ¼ 1;…;Kð Þ ð4ÞWhere ||•|| is the norm in the Qk metric. The subse-
quent solutions are found with residual matrices fromthe calculation of the first order solution with the con-straint that the remaining order axes are orthogonal withthe previous sets, namely:
vjTDvs ¼ 0 and ujTk Qku
sk ¼ 0 1≤ j < sð Þ ð5Þ
The residual matrices used by second order solution isdeflated as
X1 order2ð Þ ¼ X1‐X1P1k ð6Þ
where the projection matrix Pk1 is
P1k ¼ u1
k u1kQku
1Tk
� �‐1u1kQk ð7Þ
The superscript T and −1 stand for matrix transpos-ition and matrix inversion respectively. Therefore, theformula (6) removes the dimension that is spanned byvector uk
1 (k = 1, …, K) to get a residual matrix, whichis passed to the SVD to find the second order solution.These steps are repeated until the desired number ofaxes (principal components, dimensions) is generated.
Meng et al. BMC Bioinformatics 2014, 15:162 Page 3 of 13http://www.biomedcentral.com/1471-2105/15/162
As a result, MCIA provides a simultaneous ordination ofcolumns (measurements) and rows (features) of multipletables within the same hyperspace, with features or mea-surements sharing similar trends will be closely pro-jected. The detailed description of MCIA and the proofthat these axes are maximally co-variant are given inChessel and Hanafi [26,35].
DatasetsWe analyzed publicly available sets of data from two stud-ies: (i) transcriptomic [8,33,36] and proteomic [11] data-sets of the NCI-60 cancer cell line panel, the latter onegenerated in our group, and (ii) an ovarian cancer datasetgenerated as part of the TCGA project [37]. In each study,there are multiple datasets measuring molecules (mRNAor proteins) from the same samples (cell lines or tumors).
NCI-60 dataThe NCI-60 panel is a collection of 59 cancer cell linesof leukemia, lymphomas, melanomas and carcinomas ofovarian, renal, breast, prostate, colon, lung and centralnervous system (CNS) origin. The NCI-60 transcriptomedata were downloaded from Cellminer [38] and were ob-tained on four different platforms; Affymetrix HG-U133plus 2.0, HG-U133, HG-U95 and Agilent GE 4x44K[39]. Affymetrix data were normalized using GC robustmultichip averaging GCRMA; [39] and Agilent datawere log transformed as obtained from the Cellminer.Although data filtering is not required to performMCIA, to facilitate data interpretation, microarray datawere filtered to exclude probes that do not map to an of-ficial HUGO gene symbol. The probe with highest aver-age value was retained when multiple probes mapped tothe same gene. Filtering produced datasets of 11,051;8,803; 9,044 and 10,382 genes on Agilent, HG-U95, HG-U133 and HG-U133 plus 2.0 platforms respectively. Thelung cancer cell line NCI-H23 was excluded since its ex-pression profile was not available on the HG-U133 plat-form. A Venn diagram representing the overlappinggenes in the processed data for each platform is pro-vided in Additional file 1: Figure S1.The proteome profiles of cell lines were produced
from a conventional GeLC-MS/MS approach and label-free quantification, as described in [11]. The internationalprotein index (IPI) identifiers were mapped to official genesymbol to facilitate subsequent pathway interpretation.Data were log transformed (base 10) and no filtering oradditional normalization were performed. This datasetrepresents 7,150 protein expressions across 58 cell line inNCI-60 panel.
Ovarian cancer datasetsGene expression of tumors from ovarian cancer patientswere profiled using two microarray platforms (Agilent
customized platform G4502A and Affymetrix GeneChipHG U133 plus 2.0) and RNA-sequencing on IlluminaHiSeq platform. Data were downloaded from the NCI-TCGA data portal 07/08/2013; [370]. Patient samples(266 out of 489) that were present in all four datasetswere included in the analysis. The Agilent and Affyme-trix data were normalized and summarized by lowessand robust multichip averaging (RMA), respectively [40].The transcript expression levels of the Illumina RNA-sequencing data were determined using two differentpre-processing pipelines (RPKM and RSEM) denoted asRNASeq and RNASeqV2, respectively. Normalizationand quantification of RNASeq followed the RPKMmethod [41] whereas the alignment and gene expressionquantification in RNAseqV2 were obtained by MapS-plice and RSEM [42,43]. In RNASeq and RNASeqV2;20,657 and 20,135 genes were detected (before filtering).These data were filtered to exclude genes with morethan 15 missing values. Only genes mapped to an officialgene symbol were retained. For the features mapped tothe same gene symbol, the one with the largest averageexpression value was kept. Remaining missing valueswere replaced with a positive value far smaller than thelowest expression value in each dataset (10−15 in RNA-Seq and 10−10 in RNASeqV2) and then, the expressionvalues were log transformed (base 10). After filtering,the Agilent, Affymetrix, RNASeq and RNASeqV2 data-sets contained 17,814; 12,042; 16,769 and 15,840 geneexpression measurements respectively. The Venn dia-gram representing the overlap of genes in these datasetsis shown in Additional file 1: Figure S2.
Results and discussionIntegrated analysis of the NCI-60 cell line transcriptomeand proteomeThe NCI-60 panel, a collection of 59 cancer cell linesderived from nine different tissues (brain, blood andbone marrow, breast, colon, kidney, lung, ovary, prostateand skin) has been extensively used in in vitro high-throughput drug screen assays. They have been molecu-larly profiled using comparative genomic hybridizationarray [44], karyotype analysis [45], DNA mutationalanalysis [46,47], transcripts expression array [33,48], mi-croarrays for microRNA expression [8] and protein ex-pression [11].MCIA was applied as an exploratory analysis of four
transcriptomic studies (Agilent n = 11,051; HGU95 n =8,803; HGU133 n = 9,044 and HGU133 plus 2.0 n = 10,382)and one proteomic study (GeLC-MS/MS; n = 7,150) ofthe 58 cell lines. Figure 1A shows the projection of celllines onto the first two principal components (PCs) ofMCIA. Similar to the visualization employed in CIA [26],the datasets are transformed into the same projection.The coordinates of the five measurements for each cell
Meng et al. BMC Bioinformatics 2014, 15:162 Page 4 of 13http://www.biomedcentral.com/1471-2105/15/162
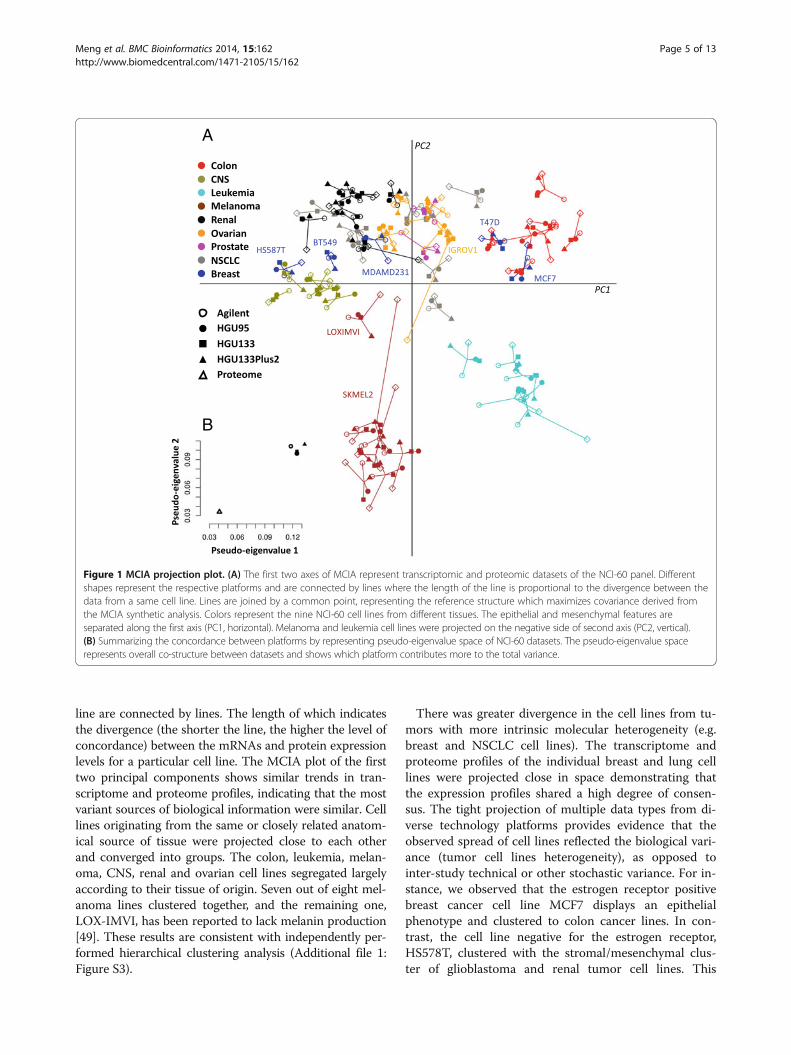
line are connected by lines. The length of which indicatesthe divergence (the shorter the line, the higher the level ofconcordance) between the mRNAs and protein expressionlevels for a particular cell line. The MCIA plot of the firsttwo principal components shows similar trends in tran-scriptome and proteome profiles, indicating that the mostvariant sources of biological information were similar. Celllines originating from the same or closely related anatom-ical source of tissue were projected close to each otherand converged into groups. The colon, leukemia, melan-oma, CNS, renal and ovarian cell lines segregated largelyaccording to their tissue of origin. Seven out of eight mel-anoma lines clustered together, and the remaining one,LOX-IMVI, has been reported to lack melanin production[49]. These results are consistent with independently per-formed hierarchical clustering analysis (Additional file 1:Figure S3).
There was greater divergence in the cell lines from tu-mors with more intrinsic molecular heterogeneity (e.g.breast and NSCLC cell lines). The transcriptome andproteome profiles of the individual breast and lung celllines were projected close in space demonstrating thatthe expression profiles shared a high degree of consen-sus. The tight projection of multiple data types from di-verse technology platforms provides evidence that theobserved spread of cell lines reflected the biological vari-ance (tumor cell lines heterogeneity), as opposed tointer-study technical or other stochastic variance. For in-stance, we observed that the estrogen receptor positivebreast cancer cell line MCF7 displays an epithelialphenotype and clustered to colon cancer lines. In con-trast, the cell line negative for the estrogen receptor,HS578T, clustered with the stromal/mesenchymal clus-ter of glioblastoma and renal tumor cell lines. This
A
B
Figure 1 MCIA projection plot. (A) The first two axes of MCIA represent transcriptomic and proteomic datasets of the NCI-60 panel. Differentshapes represent the respective platforms and are connected by lines where the length of the line is proportional to the divergence between thedata from a same cell line. Lines are joined by a common point, representing the reference structure which maximizes covariance derived fromthe MCIA synthetic analysis. Colors represent the nine NCI-60 cell lines from different tissues. The epithelial and mesenchymal features areseparated along the first axis (PC1, horizontal). Melanoma and leukemia cell lines were projected on the negative side of second axis (PC2, vertical).(B) Summarizing the concordance between platforms by representing pseudo-eigenvalue space of NCI-60 datasets. The pseudo-eigenvalue spacerepresents overall co-structure between datasets and shows which platform contributes more to the total variance.
Meng et al. BMC Bioinformatics 2014, 15:162 Page 5 of 13http://www.biomedcentral.com/1471-2105/15/162
suggests that HS578T exhibits more invasive mesenchy-mal features compared to T47D and MCF7.
Overall co-structure comparison using MCIAEach PC has an associated eigenvalue which representsthe amount of variability contained in that PC. The firstthree PCs of the MCIA accounted for 17.4%, 14.2% and9.7% of variance respectively (each eigenvalue divided bythe sum of all eigenvalues; Additional file 1: Figure S4).The observation that the first two PCs capture less thana third of the structure in the datasets (Figure 1A) re-flects the complexity inherent in cell lines of 58 tumorsfrom nine different organs. In order to identify thecontribution of each dataset to the total variance, that is,to what extent each dataset deviates or agrees withwhat the majority of datasets support, we extracted theMCIA pseudo-eigenvalues. Figure 1B shows the pseudo-eigenvalues associated with the first two principal compo-nents of each dataset. Comparison within microarray datarevealed that Affymetrix HGU133 Plus 2.0 accounts forthe highest variance on axis 1 and 2, possibly because thisplatform contains informative features, or features that arepoorly detected or absent on other platforms. We ob-served that the similarity within transcriptome datasets isgreater than the similarity between transcriptome andproteome data, which is consistent with the results shownby Figure 1A.One of the most attractive features of MCIA is that it
can be used to highlight lack or presence of co-structurebetween datasets, thus it allows selection of the stron-gest features from each dataset for subsequent analysis.For instance, we observed in particular, large variationbetween the protein and transcript expression patternsof two cell lines, melanoma SKMEL2 and ovarianIGROV1. The proteome coordinates of SKMEL2 wereclose to the origin and far from the transcriptomic datathat was projected on the negative end of PC2 with theother melanoma cell line data. The poor informationcontent in proteome data of the SKMEL2 cell line couldreflect the lack of expression of melanin related geneson protein level. Similarly, the incongruence of theproteome and transcriptome data of the ovarian cell lineIGROV1 may be due to expression of less epithelialmarkers that projected on the positive direction of axis 2.To characterize the overall correlation between each
pair of high dimensional data we calculated the pair-wise RV coefficient, a multivariate generalization of thesquared Pearson correlation coefficient [50]. For eachpair of datasets, the RV-coefficient is calculated as thetotal co-inertia (sum of eigenvalues of co-inertia, i.e.sum of eigenvalues of the product of two cross productmatrices) divided by the square root of the product ofthe squared total inertia (sum of the eigenvalues) fromthe individual analysis. As the co-structure between two
datasets increases, the RV score move towards to 1. Azero RV score indicates no similarity. The overall simi-larity in structure between microarray data was higherthan the similarity between microarray and proteomicsdata; average RV coefficient > 0.9 and 0.76 respectively(Additional file 1: Figure S5).When MCIA was performed on the same transcrip-
tome data and the subset of proteome data that werequantified in all 58 cell lines (n = 524 proteins, no miss-ing values), the filtered proteome data had a higherconsensus to the co-structure and increased pseudo-eigenvalues (Additional file 1: Figure S6).
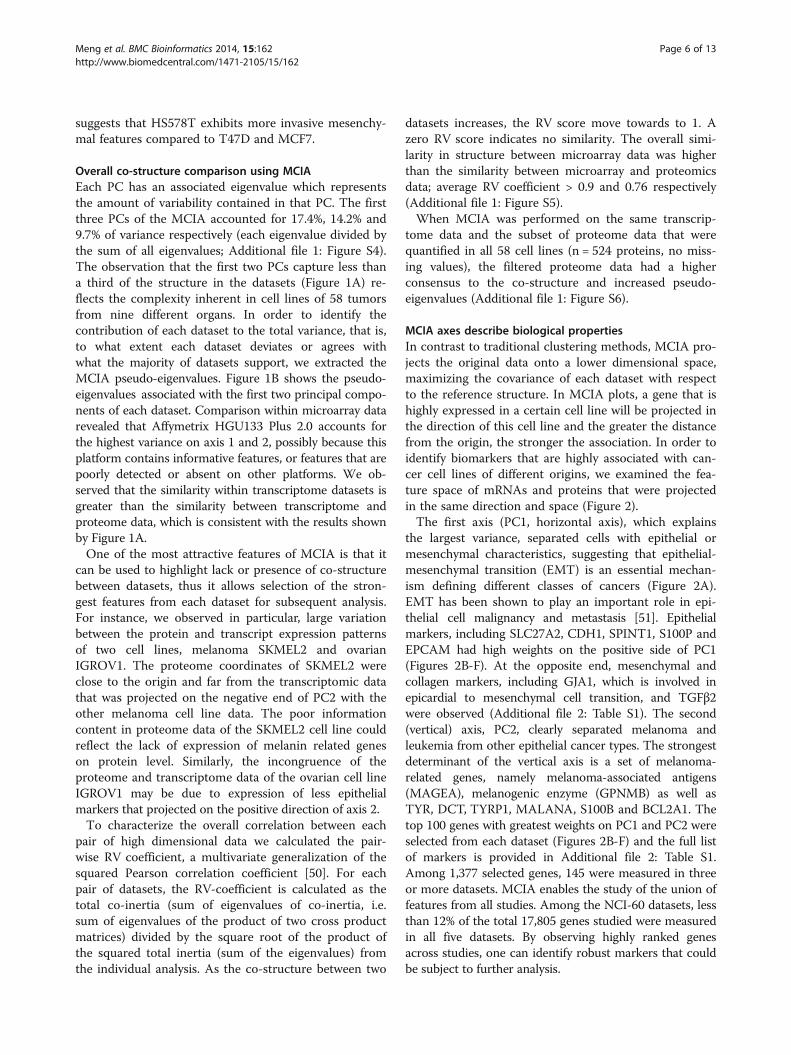
MCIA axes describe biological propertiesIn contrast to traditional clustering methods, MCIA pro-jects the original data onto a lower dimensional space,maximizing the covariance of each dataset with respectto the reference structure. In MCIA plots, a gene that ishighly expressed in a certain cell line will be projected inthe direction of this cell line and the greater the distancefrom the origin, the stronger the association. In order toidentify biomarkers that are highly associated with can-cer cell lines of different origins, we examined the fea-ture space of mRNAs and proteins that were projectedin the same direction and space (Figure 2).The first axis (PC1, horizontal axis), which explains
the largest variance, separated cells with epithelial ormesenchymal characteristics, suggesting that epithelial-mesenchymal transition (EMT) is an essential mechan-ism defining different classes of cancers (Figure 2A).EMT has been shown to play an important role in epi-thelial cell malignancy and metastasis [51]. Epithelialmarkers, including SLC27A2, CDH1, SPINT1, S100P andEPCAM had high weights on the positive side of PC1(Figures 2B-F). At the opposite end, mesenchymal andcollagen markers, including GJA1, which is involved inepicardial to mesenchymal cell transition, and TGFβ2were observed (Additional file 2: Table S1). The second(vertical) axis, PC2, clearly separated melanoma andleukemia from other epithelial cancer types. The strongestdeterminant of the vertical axis is a set of melanoma-related genes, namely melanoma-associated antigens(MAGEA), melanogenic enzyme (GPNMB) as well asTYR, DCT, TYRP1, MALANA, S100B and BCL2A1. Thetop 100 genes with greatest weights on PC1 and PC2 wereselected from each dataset (Figures 2B-F) and the full listof markers is provided in Additional file 2: Table S1.Among 1,377 selected genes, 145 were measured in threeor more datasets. MCIA enables the study of the union offeatures from all studies. Among the NCI-60 datasets, lessthan 12% of the total 17,805 genes studied were measuredin all five datasets. By observing highly ranked genesacross studies, one can identify robust markers that couldbe subject to further analysis.
Meng et al. BMC Bioinformatics 2014, 15:162 Page 6 of 13http://www.biomedcentral.com/1471-2105/15/162
Integration of proteomics and transcriptomicscomplements the biological informationTo further evaluate the biological significance of the fea-tures selected by MCIA, we employed Ingenuity PathwayAnalysis (IPA: http://www.ingenuity.com) to discover sig-nificant canonical pathways which discriminate differentcell lines (Figure 3). In MCIA plots, samples and featuresare projected onto the same space. The genes with stron-gest association to a cell line are those projected in thesame direction and have the highest weights (greater dis-tance from the origin). As features have been transformedon the same scale, the union of features from each individ-ual dataset can be easily extracted and concatenated toprovide greater coverage in pathway analysis. Featuresstrongly associated to each tissue type from both tran-scriptome and proteome datasets can be concatenatedand mapped to signaling pathways. There is no require-ment to extract equal numbers of features from each datatype. For example we observed that features strongly asso-ciated with leukemia related features tended to beenriched in the proteins (Figure 3A). The most extremefeatures associated with the leukemia cell lines were
selected from all platforms using their coordinates andwere subjected to the functional and pathway analysis.The full list of features, the coordinate feature selectioncriteria and their functional and pathway analysis are pro-vided in Additional file 3: Tables S2 and Additional file 4:Table S3.Complementary information can be obtained by inte-
grating data from different platforms and data typeswhich increases the genome coverage and power of sub-sequent pathway analysis. While numerous genes wereover-expressed in both the transcriptome and proteomedata, some (HCLS1, PECAM and two integrins, ITGAL,ITGB2) were identified exclusively in the proteome data-set (Figure 3A). We observed that leukocyte related bio-logical functions, such as activation of mononuclearleukocyte, mobilization of Ca2+ and activation of lympho-cyte were most strongly associated with the leukemia celllines (Additional file 3: Table S2). Enrichment analysissuggested that the most significantly enriched pathwaysare, leukemia extravasation signaling pathway (p = 1.04−11;Figure 3B), which is responsible for leukocyte migrationand related to metastasis in leukemia cell lines [52], T cell
AGR2CDH1
EPCAMS100P
SPINT1TACSTD2
COL8A1EDIL3GJA1
IGFBP7LOXCDCP1EGFR
BCL2A1
SLC27A2
CNRIP1
DKK3SPARC
KRT19
GPM6B
GPNMB
MAGEA1
TRPV2
GAS7RAB38
CTGF
SLC16A6 GYPC
GAL
ALPK2
GPM6BBCL2A1
AGR2
CDH1
EPCAM
S100P
SPINT1
CNRIP1
COL8A1EDIL3
GJA1
IGFBP7
LAYNLOX
SPARC
SPOCK1
CDCP1EGFR KRT19
KRT7
MAL2MALL
TACSTD2
GPNMB LEF1MAGEA1
TRPV2
MYB
GAS7
GALCTGF
COL8A1
RAB38 SLC16A6
GYPC
SLC27A2 SPOCK1
EGFR
AGR2
CDH1
EPCAM
S100P
SLC27A2
SPINT1
ALPK2
CNRIP1
COL8A1
EDIL3GJA1
IGFBP7
LAYNLOX
SPARC
CDCP1
KRT19
KRT7
MAL2
MALL
TACSTD2
BCL2A1
GPM6B
GPNMB
LEF1
MAGEA1
TRPV2
MYB
DKK3
CTGF
AGR2
CDH1
EPCAM
S100P
SLC27A2
SPINT1
ALPK2
CNRIP1
COL8A1
EDIL3 GJA1
IGFBP7
LAYN
LOX
SPARC
SPOCK1CDCP1
EGFR
KRT19
KRT7 MAL2MALL
TACSTD2
BCL2A1
GPM6B
GPNMB
LEF1
MAGEA1
TRPV2RAB38
MYB
GAS7
GYPC
SLC16A6
AGR2
CDH1
EPCAM
S100P
SLC27A2SPINT1ALPK2
CNRIP1
COL8A1EDIL3
GJA1
IGFBP7
LAYNLOX
SPARC
CDCP1
KRT19
KRT7
MAL2
MALL TACSTD2
BCL2A1
GPM6B
GPNMB
LEF1
MAGEA1
TRPV2
SPOCK1
EGFR
MYB
RAB38GYPC
SLC16A6
GALCTGF
DKK3
colon
leukemiamelanoma
CNS
breast
prostateovarianrenal
NSCLC
Affy_HGU133Plus2 ProteomeAffy_HGU133
Agilent Affy_HGU95
PC2
PC1
PC2
PC1
PC1 PC1 PC1
PC1
PC2
PC2 PC2 PC2
Figure 2 Detecting robust markers defining major trends using MCIA. (A) Shows the projection of the respective cell lines from the NCI-60.Colors represent tissue types as in Figure 1. (B-E) represent the coordinates of genes in transcriptomic data and (F) shows proteins fromproteomics dataset. The top genes/proteins at the end of each MCIA axes are labeled in red, indicating that those features were presented in atleast four platforms and located at the same direction from the origin.
Meng et al. BMC Bioinformatics 2014, 15:162 Page 7 of 13http://www.biomedcentral.com/1471-2105/15/162
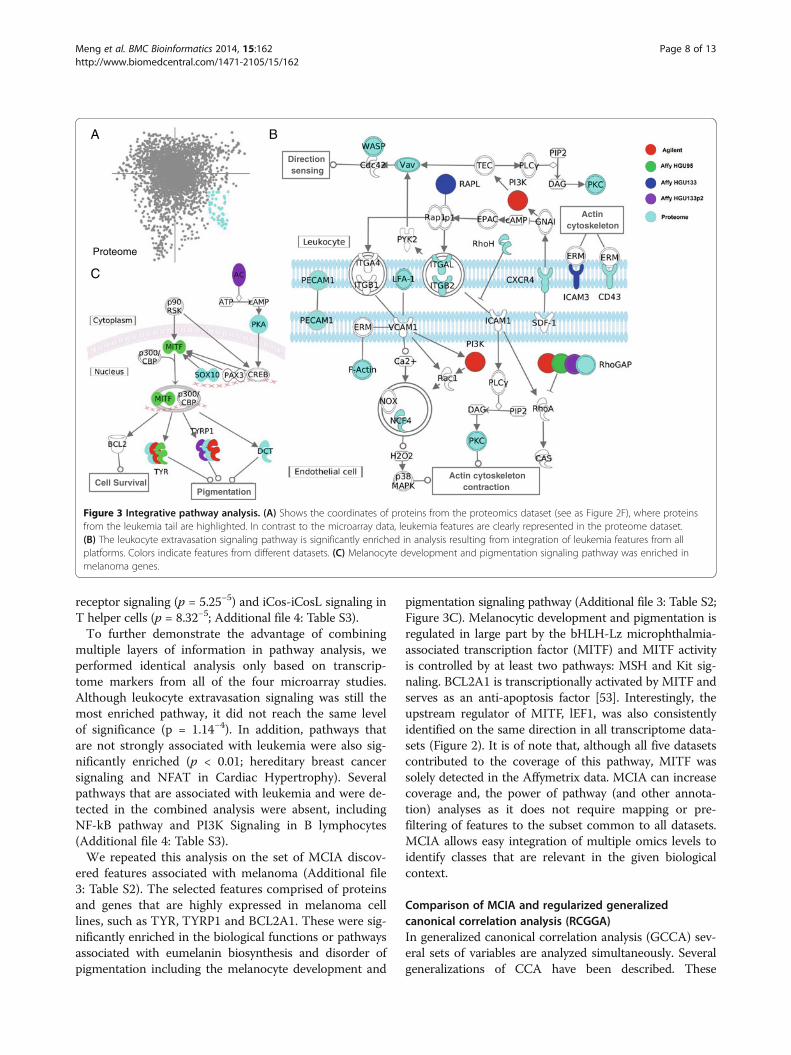
receptor signaling (p = 5.25−5) and iCos-iCosL signaling inT helper cells (p = 8.32−5; Additional file 4: Table S3).To further demonstrate the advantage of combining
multiple layers of information in pathway analysis, weperformed identical analysis only based on transcrip-tome markers from all of the four microarray studies.Although leukocyte extravasation signaling was still themost enriched pathway, it did not reach the same levelof significance (p = 1.14−4). In addition, pathways thatare not strongly associated with leukemia were also sig-nificantly enriched (p < 0.01; hereditary breast cancersignaling and NFAT in Cardiac Hypertrophy). Severalpathways that are associated with leukemia and were de-tected in the combined analysis were absent, includingNF-kB pathway and PI3K Signaling in B lymphocytes(Additional file 4: Table S3).We repeated this analysis on the set of MCIA discov-
ered features associated with melanoma (Additional file3: Table S2). The selected features comprised of proteinsand genes that are highly expressed in melanoma celllines, such as TYR, TYRP1 and BCL2A1. These were sig-nificantly enriched in the biological functions or pathwaysassociated with eumelanin biosynthesis and disorder ofpigmentation including the melanocyte development and
pigmentation signaling pathway (Additional file 3: Table S2;Figure 3C). Melanocytic development and pigmentation isregulated in large part by the bHLH-Lz microphthalmia-associated transcription factor (MITF) and MITF activityis controlled by at least two pathways: MSH and Kit sig-naling. BCL2A1 is transcriptionally activated by MITF andserves as an anti-apoptosis factor [53]. Interestingly, theupstream regulator of MITF, lEF1, was also consistentlyidentified on the same direction in all transcriptome data-sets (Figure 2). It is of note that, although all five datasetscontributed to the coverage of this pathway, MITF wassolely detected in the Affymetrix data. MCIA can increasecoverage and, the power of pathway (and other annota-tion) analyses as it does not require mapping or pre-filtering of features to the subset common to all datasets.MCIA allows easy integration of multiple omics levels toidentify classes that are relevant in the given biologicalcontext.
Comparison of MCIA and regularized generalizedcanonical correlation analysis (RCGGA)In generalized canonical correlation analysis (GCCA) sev-eral sets of variables are analyzed simultaneously. Severalgeneralizations of CCA have been described. These
A B
C
Direction sensing
Actin cytoskeleton
Proteome
Actin cytoskeleton contractionCell Survival
Pigmentation
Figure 3 Integrative pathway analysis. (A) Shows the coordinates of proteins from the proteomics dataset (see as Figure 2F), where proteinsfrom the leukemia tail are highlighted. In contrast to the microarray data, leukemia features are clearly represented in the proteome dataset.(B) The leukocyte extravasation signaling pathway is significantly enriched in analysis resulting from integration of leukemia features from allplatforms. Colors indicate features from different datasets. (C) Melanocyte development and pigmentation signaling pathway was enriched inmelanoma genes.
Meng et al. BMC Bioinformatics 2014, 15:162 Page 8 of 13http://www.biomedcentral.com/1471-2105/15/162
employ different methods, including sum of correlations(SUMCOR), sum of squared correlations (SSQCOR) andsum of absolute value correlations (SABSCOR) [29]. Re-cently Tenenhaus and coworkers introduced regularizedgeneralized canonical correlation analysis (RGCCA) togeneralize RCCA to multi-block data analysis of datawhere the number of variables exceed the number of cases[29]. We compare MCIA to several RGCCA methods thatare defined by different shrinkage parameters and opti-mization criteria (Additional file 1: Figure S7-S9).First, we compared three different optimization criteria
in RGCCA, namely SUMCOR, SABSCOR, SSQCORwith MCIA. As depicted in Additional file 1: Figure S7,the SUMCOR method and MCIA algorithm consistentlyreturn similar results with positively correlated axes(Additional file 1: Figure S7). Also the identified compo-nents from the SABSCOR and SSQCOR methods are al-ways highly correlated to the MCIA results, but it isimportant to note that the correlation could be eitherpositive or negative. This is inconvenient for the com-parison and integration of multiple omics datasets, asthe components from one dataset might be inverted inanother dataset.By tuning the shrinkage parameter т, which can range
from 0 to 1, RGCCA balances optimizing the intra-tableand inter-table covariance. Additional file 1: Figure S8and S9 show that the identified components are nearlyidentical across datasets for т = 0. The smaller theshrinkage parameter т, the higher is the correlation be-tween neighboring components from different datasets.But the variance of each individual dataset is less wellexplained by the components. In contrast, the results ofRGCCA with a shrinkage parameter of т = 1 are verysimilar to MCIA results. In this case, RGCCA gives pri-ority to finding a component that explains its own blockwell [29]. Similarly, MCIA maximizes the variancewithin each table and the covariance of components ofeach table with a consensus reference structure througha synthetic analysis. It is important to note that in omicsdata analyses, the number of features is generally muchlarger than the number of observations. Therefore, a lowт should be avoided as it results in overfitting of the dataand apparently perfect correlations, which rarely repre-sent meaningful information.
Integrated analysis of microarray and RNA-sequencingovarian cancer datasetsIn the ovarian cancer datasets, MCIA was applied toseveral microarray and RNA-seq gene expression data-sets; Agilent, Affymetrix, RNASeq, RNASeqV2 whichcontained 17,814, 12,042, 16,769, and 15,840 genes re-spectively. In the MCIA space, the first PC (horizontalaxis) accounted for 19.6% of the total variance and thesecond PC (vertical axis) accounted for 10.6% of variance
(Additional file 1: Figure S10). In comparison to micro-array data, RNA sequencing data typically contains manymissing values. These are generated when multiple experi-ments are combined. We excluded genes (rows) with highnumber of missing values. After filtering genes with morethan 15 missing values in RNA-seq data, the four datasetscontributed similarly to the total variance (Figure 4 andAdditional file 1: Figure S11). Among the two RNA-seqdatasets, RNASeq consistently tended to be more variantthan RNASeqV2 on PC1-5 (Additional file 1: Figure S12).RNASeq and RNASeqV2 were generated from the sameIllumina RNA-sequencing data but using two differentpre-processing approaches. MCIA results indicated thatnormalization and quantification with the RPKM method(RNASeq) outperforms MapSplice and RSEM (RNA-SeqV2). The informativeness or variance in RNA sequen-cing data tended to be sensitive to pre-processing andfiltering algorithms which is expected given that methodsfor processing these data are still emerging. In addition,Affymetrix profiles were generally more variant than Agi-lent as indicated by greater pseudo-eigenvalues on PC1-3.When the microarray and RNASeq data were compared,we detected several outlier genes that were highly varianton PC1 and PC2 on RNASeq but absent on the micro-array platforms. These include CDHR4 and HESRGwhich are highly expressed by the differentiated subtype(Figure 4) [54].
MCIA identified ovarian subtypesWe applied MCIA to compare the consistency and dis-crepancy in gene expression profiles of ovarian cancertumors obtained by RNA-sequencing and Affymetrixand Agilent microarray technologies (Figure 4A). Theresults revealed high overall similarity in structure be-tween the four datasets and three platforms.Recent microarray gene expression profiling studies
have reported four subtypes of ovarian cancer (prolifera-tive, immunoreactive, mesenchymal and differentiated)[37,55]. These HGS-OvCa subtypes can be clearly distin-guished along the first two MCIA axes (Figure 4A). Thefirst axis generally separated samples with immunoreac-tive versus proliferative characteristics. Whereas the sec-ond axis distinguished tumors with a mesenchymalsubtype which show a short survival time [56] from thedifferentiated ovarian cancer samples. Consistent withother studies, MCIA identified large overlap between thefour subtypes, indicating that most samples exhibitedfeatures of multiple subtype signatures [56]. In order tofind whether this classification correlates with clinicalfactors, we compared the first two PCs with clinical re-cords provided from the TCGA data portal and theVerhaak study [56]. This comparison revealed that ageat diagnosis was significantly negatively correlated withPC1 and positively correlated PC2 (Pearson correlation
Meng et al. BMC Bioinformatics 2014, 15:162 Page 9 of 13http://www.biomedcentral.com/1471-2105/15/162
p = 1.29−3 and p = 3.56−4 respectively), suggesting thatdifferentiated and immunoreactive patients tend topresent at younger age. The percentage of stromal cellsis positively correlated with PC2 (Pearson correlation p =1.79−3), which is in consensus with the mesenchymal sub-type having greater percentage of stromal cells [56]. Otherclinical factors, such as somatic mutation, drug treatmentand tumor stages did not significantly correlate with eitheraxis.
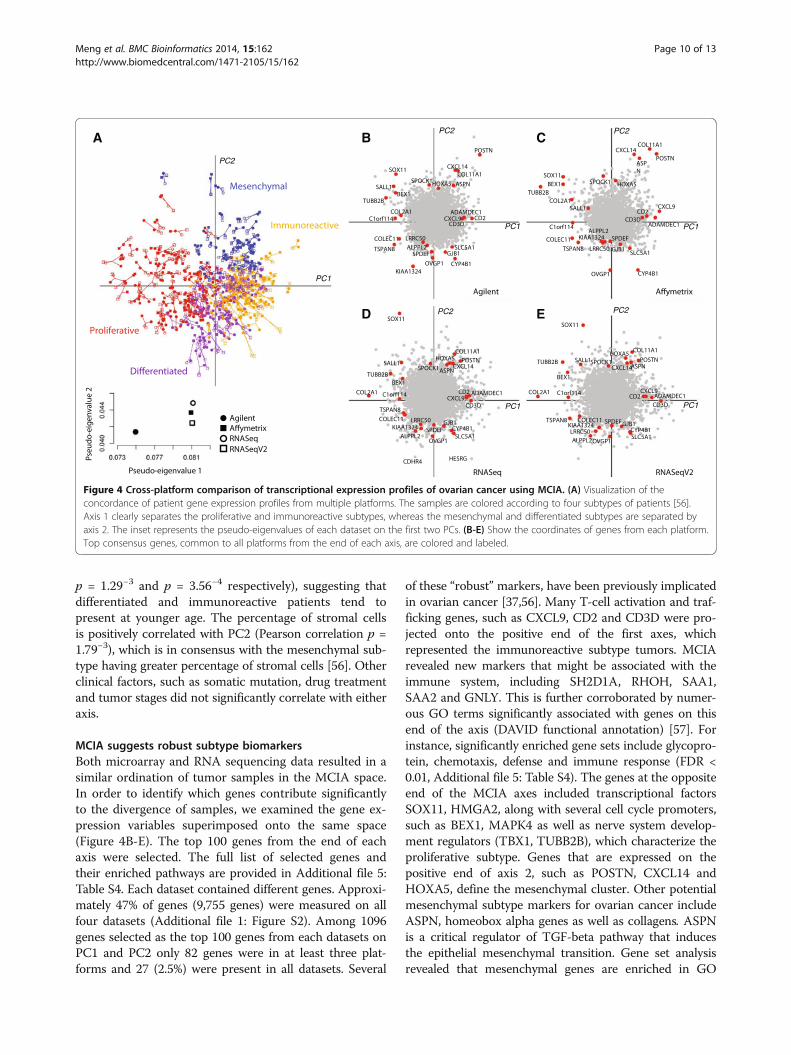
MCIA suggests robust subtype biomarkersBoth microarray and RNA sequencing data resulted in asimilar ordination of tumor samples in the MCIA space.In order to identify which genes contribute significantlyto the divergence of samples, we examined the gene ex-pression variables superimposed onto the same space(Figure 4B-E). The top 100 genes from the end of eachaxis were selected. The full list of selected genes andtheir enriched pathways are provided in Additional file 5:Table S4. Each dataset contained different genes. Approxi-mately 47% of genes (9,755 genes) were measured on allfour datasets (Additional file 1: Figure S2). Among 1096genes selected as the top 100 genes from each datasets onPC1 and PC2 only 82 genes were in at least three plat-forms and 27 (2.5%) were present in all datasets. Several
of these “robust” markers, have been previously implicatedin ovarian cancer [37,56]. Many T-cell activation and traf-ficking genes, such as CXCL9, CD2 and CD3D were pro-jected onto the positive end of the first axes, whichrepresented the immunoreactive subtype tumors. MCIArevealed new markers that might be associated with theimmune system, including SH2D1A, RHOH, SAA1,SAA2 and GNLY. This is further corroborated by numer-ous GO terms significantly associated with genes on thisend of the axis (DAVID functional annotation) [57]. Forinstance, significantly enriched gene sets include glycopro-tein, chemotaxis, defense and immune response (FDR <0.01, Additional file 5: Table S4). The genes at the oppositeend of the MCIA axes included transcriptional factorsSOX11, HMGA2, along with several cell cycle promoters,such as BEX1, MAPK4 as well as nerve system develop-ment regulators (TBX1, TUBB2B), which characterize theproliferative subtype. Genes that are expressed on thepositive end of axis 2, such as POSTN, CXCL14 andHOXA5, define the mesenchymal cluster. Other potentialmesenchymal subtype markers for ovarian cancer includeASPN, homeobox alpha genes as well as collagens. ASPNis a critical regulator of TGF-beta pathway that inducesthe epithelial mesenchymal transition. Gene set analysisrevealed that mesenchymal genes are enriched in GO
A B C
D E
PC1
PC2
PC2
PC1
PC2
PC1
PC2
PC2
PC1
PC1
Figure 4 Cross-platform comparison of transcriptional expression profiles of ovarian cancer using MCIA. (A) Visualization of theconcordance of patient gene expression profiles from multiple platforms. The samples are colored according to four subtypes of patients [56].Axis 1 clearly separates the proliferative and immunoreactive subtypes, whereas the mesenchymal and differentiated subtypes are separated byaxis 2. The inset represents the pseudo-eigenvalues of each dataset on the first two PCs. (B-E) Show the coordinates of genes from each platform.Top consensus genes, common to all platforms from the end of each axis, are colored and labeled.
Meng et al. BMC Bioinformatics 2014, 15:162 Page 10 of 13http://www.biomedcentral.com/1471-2105/15/162
terms including cell adhesion, skeletal system develop-ment, collagen and ECM receptor interaction pathway(Additional file 5: Table S4).The robust markers at the differentiated end include ovi-
ductal glycoprotein 1 (OVGP1/MUC9), SPDEF, KIAA1324,GJB1 and ALPPL2, some of which have already been re-ported as ovarian biomarkers. For instance, OVGP1 hasbeen suggested as a possible serum marker for the detec-tion of low grade ovarian cancer [58]. Although theTCGA dataset is all high grade serous ovarian cancer, inour analysis, it was highly expressed in differentiated sub-type. Human SPDEF protein plays a significant role intumorigenesis in multiple cancers, including ovarian can-cer and has been reported to suppress prostate tumormetastasis. A recent study on prostate cancer demon-strated that SPDEF suppresses cancer metastasis throughdown-regulation of matrix metalloproteinase 9 and 13(MMP9, MMP13), which are required for the invasivephenotype of cells [59]. Our analysis implied that SPDEFand matrix metalloproteinase plays a similar role in thedevelopment of ovarian cancer. In addition, it has beenshown that, in a mouse model, POSTN down-regulatesALPP mRNA [60]. POSTN and ALPPL2 were projectedonto the diametral ends of axes 2, which implies that thesame mechanism of regulation exists in ovarian cancerand can be exploited to distinguish subtypes. Interest-ingly, the DAVID gene set analysis of markers for the dif-ferentiated phenotype did not reveal as strong gene setenrichments as described for the other subtypes (lowestFDR = 0.0022 vs. 10−47 to 10−9; Additional file 5: Table S4)indicating that this subtype exhibits considerably higherdegree of heterogeneity.
ConclusionIn the present study, we described multiple co-inertiaanalysis (MCIA), an exploratory data analysis methodthat can identify co-relationships between multiple highdimensional datasets. MCIA projects multiple sets offeatures onto the same dimensional space and provides asimple graphical representation for the efficient identifi-cation of concordance between datasets. The sets of fea-tures may have none or few features in common. Bytransforming multiple sources of data onto the samescale, the most variant features are transformed ontothe same scale. This allows one to extract and easilycombine sets of omic features (genes, proteins, etc.) forgreater power in subsequent pathway analysis. MCIAprovides a consensus reference structure of datasets,revealing similar trends among multiple tables. Com-pared to RGCCA, we found that MCIA is most similarto the SUMCOR version of RGCCA with т = 1 inpractice.Our integrative analysis of NCI-60 cell line panel indi-
cated that, although both transcriptome and proteome
cell lines were clustered according to their lineage, theyprovides complementary information. We demonstratedthat integrated analysis of gene and protein expressiondata increases the power of pathway analysis and yieldsmore information than an analysis of gene expressionalone. MCIA highly ranked the leukemia extravasationsignaling pathway. This pathway was overrepresentedwith features that were predominantly from the proteo-mics data and were enriched in biological functions of“activation of mononuclear leukocyte and lymphocyte”.MCIA of high grade serous ovarian cancer revealed fourpreviously described subtypes of ovarian cancer and pro-vided novel subtype markers. An advantage of MCIA isthat it couples multiple set of features measured on thesame set of samples. Since it does not rely on feature an-notation, it is not limited by the immaturity of annota-tions. There is no prerequisite to filter or map features(genes) to a common set thereby considerably increasinggenome coverage.In a study that compares CIA with other sparse mul-
tiple table analysis methods (sPLS and CCA-EN), LeCaoet al. suggested that CIA may result in redundancy whenit is used for feature selection since it does not include abuilt-in procedure for variable selection [27]. Similarly,MCIA does not impose any sparsity in the result, soMCIA selects much more features than methods intro-ducing the Lasso penalty, such as SGCCA [30] or PCCA[31]. Hence, the interpretation of MCIA selected fea-tures would have to be coupled with other methods,such as enrichment analysis, in order to reveal func-tional insights. We also note that the MCIA algorithmfinds solutions in a sequential manner and each order ofcomponents requires a singular value decomposition(SVD) for a large dataset. The computationally intensityof the algorithm increases with sample size as morecomponents are retained. For instance, the CPU time ofanalysis of the NCI-60 data with 5 kept principal com-ponents was around 68 seconds on Intel Xeon 1596MHz using one thread of a Linux server.In conclusion, we believe MCIA is a useful method for
integration of multiple omics datasets where the same tis-sue or cell lines have been assayed multiple times. MCIAis available to the community via an R-Bioconductor(“omicade4”) package which includes documentation anda vignette.
Availability of supporting dataThe microarray data of NCI-60 cell lines are availablethrough CELLMINER (http://discover.nci.nih.gov/cellminer/home.do). The NCI-60 proteomic data can bedownloaded from http://wzw.tum.de/proteomics/NCI60/as well as from https://www.proteomicsdb.org. The ovar-ian cancer data are available through the TCGA downloadportal (https://tcga-data.nci.nih.gov/tcga/tcgaHome2.jsp).
Meng et al. BMC Bioinformatics 2014, 15:162 Page 11 of 13http://www.biomedcentral.com/1471-2105/15/162
Additional files
Additional file 1: Supplementary information. Figures S1–S12.
Additional file 2: Table S1. Full list of biological markers highlyweighted on each MCIA axis of the NCI-60 data.
Additional file 3: Table S2. Full list of Leukemia and Melanomamarkers (including the corresponding selection criteria) and the IPAfunctional analysis.
Additional file 4: Table S3. Pathway analysis of leukemia markers.
Additional file 5: Table S4. Functional analysis of the ovarian subtypemarkers.
AbbreviationsCCA: Canonical correlation analysis; CCA-EN: Canonical correlation analysiswith elastic net penalty; CIA: Co-inertia analysis; CNS: Central nervous system;COA: Correspondence analysis; CPCA: Consensus principal componentanalysis; EMT: epithelial-mesenchymal transition; ENCODE: The encyclopediaof DNA elements; GCCA: Generalized canonical correlation analysis;gcRMA: GC robust multichip averaging; GeLC-MS/MS: In-gel digestion andliquid chromatography tandem mass spectrometry; HGS-OvCa: High gradeserous ovarian cancer; ICA: Independent component analysis; IPA: Ingenuitypathways analysis; IPI: International protein index; MCIA: Multiple co-inertiaanalysis; MS: Mass spectrometry; NCI: The national cancer institute; NSC: Non-symmetric correspondence analysis; NSCLC: Non-small-cell lung carcinoma;PAGE: Polyacrylamide gel electrophoresis; PC: Principal component;PCA: Principal component analysis; PCCA: Penalized canonical correlationanalysis; RGCCA: Regularized generalized canonical correlation analysis;RMA: Robust multichip averaging; RNASeq: RNA sequencing; RPKM: Readsper kilo base per million; RSEM: RNA-Seq by Expectation Maximization;SVD: Singular value decomposition; SGCCA: Sparse generalized canonicalcorrelation analysis; sPLS: Sparse partial least square; TCGA: The cancergenome atlas.
Competing interestsThe authors declare that they have no competing interests.
Authors’ contributionCM carried out the analysis as a PhD student in the group of BK and wrotethe manuscript. BK provided input regarding the interpretation of the results.AC and AMG made numerous important intellectual contributions, providedinput for both the design of the study and drafting of the manuscript. AMGdesigned and supervised the study and wrote the manuscript. All authorsread and approved the manuscript.
AcknowledgementsThe authors gratefully acknowledge Hannes Hahne and Mathias Wilhelm ofTUM and Curtis Huttenhower of Harvard School of Public Health for criticalreading of the manuscript. Funding for this work was provided by Dana-Farber Cancer Institute Women’s Cancers Program, the Claudia Adams Barrfoundation and the National Cancer Institute at the National Institutes ofHealth [grant numbers 1RC4CA156551-01, 1U19CA148065].
Author details1Chair of Proteomics and Bioanalytics, Technische Universität München,Freising, Germany. 2Center for Integrated Protein Science Munich, Freising,Germany. 3Department of Biostatistics and Computational Biology,Dana-Farber Cancer Institute, Boston, MA 02215, USA. 4Department ofBiostatistics, Harvard School of Public Health, Boston, MA 02215, USA.
Received: 22 January 2014 Accepted: 14 May 2014Published: 29 May 2014
References1. Wang Z, Gerstein M, Snyder M: RNA-Seq: a revolutionary tool for
transcriptomics. Nat Rev Genet 2009, 10(1):57–63.2. Ozsolak F, Milos P: RNA sequencing: advances, challenges and
opportunities. Nat Rev Genet 2011, 12(2):87–98.3. Mallick P, Kuster B: Proteomics: a pragmatic perspective. Nat Biotechnol
2010, 28(7):695–709.
4. Aebersold R, Mann M: Mass spectrometry-based proteomics. Nature 2003,422(6928):198–207.
5. Cancer Genome Atlas N: Comprehensive molecular portraits of humanbreast tumours. Nature 2012, 490(7418):61–70.
6. Cancer Genome Atlas Research N: Comprehensive genomiccharacterization defines human glioblastoma genes and core pathways.Nature 2008, 455(7216):1061–1068.
7. Rosenbloom K, Dreszer T, Long J, Malladi V, Sloan C, Raney B, Cline M,Karolchik D, Barber G, Clawson H, Diekhans M, Fujita P, Goldman M, GravellR, Harte R, Hinrichs A, Kirkup V, Kuhn R, Learned K, Maddren M, Meyer L,Pohl A, Rhead B, Wong M, Zweig A, Haussler D, Kent W: ENCODE whole-genome data in the UCSC genome browser: update 2012. Nucleic AcidsRes 2012, 40(Database issue):7.
8. Liu H, D'Andrade P, Fulmer-Smentek S, Lorenzi P, Kohn K, Weinstein J,Pommier Y, Reinhold W:mRNA and microRNA expression profiles of theNCI-60 integrated with drug activities. Mol Cancer Ther 2010, 9(5):1080–1091.
9. Beck M, Schmidt A, Malmstroem J, Claassen M, Ori A, Szymborska A, HerzogF, Rinner O, Ellenberg J, Aebersold R: The quantitative proteome of ahuman cell line. Mol Syst Biol 2011, 7:549.
10. Nagaraj N, Wisniewski JR, Geiger T, Cox J, Kircher M, Kelso J, Paabo S, MannM: Deep proteome and transcriptome mapping of a human cancer cellline. Mol Syst Biol 2011, 7:548.
11. Moghaddas Gholami A, Hahne H, Wu Z, Auer FJ, Meng C, Wilhelm M, KusterB: Global proteome analysis of the NCI-60 cell line panel. Cell Rep 2013,4(3):609–620.
12. Geiger T, Wehner A, Schaab C, Cox J, Mann M: Comparative proteomicanalysis of eleven common cell lines reveals ubiquitous but varyingexpression of most proteins. Mol Cell Proteomics 2012, 11(3):M111 014050.
13. Shen K, Tseng G: Meta-analysis for pathway enrichment analysis whencombining multiple genomic studies. Bioinformatics 2010, 26(10):1316–1323.
14. Tyekucheva S, Marchionni L, Karchin R, Parmigiani G: Integrating diversegenomic data using gene sets. Genome Biol 2011, 12(10):R105.
15. Kuo WP, Jenssen TK, Butte AJ, Ohno-Machado L, Kohane IS: Analysis ofmatched mRNA measurements from two different microarray technologies.Bioinformatics 2002, 18(3):405–412.
16. Ebert M, Sharp P: Roles for microRNAs in conferring robustness tobiological processes. Cell 2012, 149(3):515–524.
17. As F, An C, Higgins D: A multivariate analysis approach to the integrationof proteomic and gene expression data. Proteomics 2007, 7(13):2162–2171.
18. Raychaudhuri S, Stuart J, Altman R: Principal components analysis tosummarize microarray experiments: application to sporulation timeseries. Pac Symp Biocomput 2000, 455–466. Available online: http://www.ncbi.nlm.nih.gov/pmc/articles/PMC2669932/.
19. Yeung K, Ruzzo W: Principal component analysis for clustering geneexpression data. Bioinformatics 2001, 17(9):763–774.
20. Fellenberg K, Hauser N, Brors B, Neutzner A, Hoheisel J, Vingron M:Correspondence analysis applied to microarray data. Proc Natl Acad Sci U S A2001, 98(19):10781–10786.
21. Fagan A, Culhane AC, Higgins DG: A multivariate analysis approach to theintegration of proteomic and gene expression data. Proteomics 2007,7(13):2162–2171.
22. Yao F, Coquery J, Le Cao KA: Independent principal component analysisfor biologically meaningful dimension reduction of large biological datasets. BMC Bioinformatics 2012, 13:24.
23. Sheng J, Deng H-W, Calhoun V, Wang Y-P: Integrated analysis of geneexpression and copy number data on gene shaving using independentcomponent analysis. IEEE/ACM Trans Comput Biol Bioinform 2011, 8(6):12.
24. Dray S, Chessel D, Thioulouse J: Co-inertia analysis and the linking ofecological data tables. Ecology 2003, 84(11):11.
25. Dolédec S, Chessel D: Co-inertia analysis: an alternative method forstudying species–environment relationships. Freshwater Biology 1994,31(3):277–294.
26. Culhane A, Perrière G, Higgins D: Cross-platform comparison andvisualisation of gene expression data using co-inertia analysis. BMCBioinformatics 2003, 4:59.
27. Le Cao KA, Martin PG, Robert-Granie C, Besse P: Sparse canonical methodsfor biological data integration: application to a cross-platform study.BMC Bioinformatics 2009, 10:34.
28. Hanafi M, Kohler A, Qannari E-M: Connections between multiple co-inertiaanalysis and consensus principal component analysis. Chemometrics andintelligent laboratory systems 2011, 106:4.
Meng et al. BMC Bioinformatics 2014, 15:162 Page 12 of 13http://www.biomedcentral.com/1471-2105/15/162
29. Tenenhaus A, Tenenhaus M: Regularized generalized canonical correlationanalysis. Psychometrika 2011, 76(2):28.
30. Tenenhaus A, Philippe C, Guillemot V, Le Cao KA, Grill J, Frouin V: Variableselection for generalized canonical correlation analysis. Biostatistics 2014,doi:10.1093/biostatistics/kxu001.
31. Witten DM, Tibshirani R, Hastie T: A penalized matrix decomposition, withapplications to sparse principal components and canonical correlationanalysis. Biostatistics 2009, 10(3):515–534.
32. de Vienne D, Ollier S, Aguileta G: Phylo-MCOA: a fast and efficient methodto detect outlier genes and species in phylogenomics using multiple co-inertia analysis. Mol Biol Evol 2012, 29(6):1587–1598.
33. Shankavaram UT, Reinhold WC, Nishizuka S, Major S, Morita D, Chary KK,Reimers MA, Scherf U, Kahn A, Dolginow D, Cossman J, Kaldjian EP,Scudiero DA, Petricoin E, Liotta L, Lee JK, Weinstein JN: Transcript andprotein expression profiles of the NCI-60 cancer cell panel: an integromicmicroarray study. Mol Cancer Ther 2007, 6(3):820–832.
34. Kroonenberg PM, R L: Nonsymmetric correspondence analysis: a tool foranalysing contingency tables with a dependence structure. MultivariateBehavioral Research 1999, 34(3):367–396.
35. Chessel D, Hanafi M: Analysis of the co-inertia of K tables Analyses de laco-inertie de K nuages de points. Revue de statistique appliquée 1996,44(2):35–66.
36. Pfister TD, Reinhold WC, Agama K, Gupta S, Khin SA, Kinders RJ, ParchmentRE, Tomaszewski JE, Doroshow JH, Pommier Y: Topoisomerase I levels inthe NCI-60 cancer cell line panel determined by validated ELISA andmicroarray analysis and correlation with indenoisoquinoline sensitivity.Mol Cancer Ther 2009, 8(7):1878–1884.
37. Cancer Genome Atlas Research N: Integrated genomic analyses of ovariancarcinoma. Nature 2011, 474(7353):609–615.
38. Shankavaram UT, Varma S, Kane D, Sunshine M, Chary KK, Reinhold WC,Pommier Y, Weinstein JN: Cell Miner: a relational database and query toolfor the NCI-60 cancer cell lines. BMC Genomics 2009, 10:277.
39. Wu Z, Irizarry RA, Gentleman R, Murillo FM, Spencer F: A model basedbackground adjustment for oligonucleotide expression arrays. J Am StatAssoc 2004, 99:909–917.
40. Bolstad BM, Irizarry RA, Astrand M, Speed TP: A comparison ofnormalization methods for high density oligonucleotide array databased on variance and bias. Bioinformatics 2003, 19(2):185–193.
41. Mortazavi A, Williams BA, McCue K, Schaeffer L, Wold B: Mapping andquantifying mammalian transcriptomes by RNA-Seq. Nat Methods 2008,5(7):621–628.
42. Li B, Dewey C: RSEM: accurate transcript quantification from RNA-Seqdata with or without a reference genome. BMC Bioinformatics 2011,12:323.
43. Wang K, Singh D, Zeng Z, Coleman S, Huang Y, Savich G, He X, Mieczkowski P,Grimm S, Perou C, MacLeod JN, Chiang DY, Prins JF, Liu J: MapSplice: accuratemapping of RNA-seq reads for splice junction discovery. Nucleic Acids Res2010, 38(18):e178. doi: 10.1093/nar/gkq622.
44. Bussey KJ, Chin K, Lababidi S, Reimers M, Reinhold WC, Kuo WL, Gwadry F,Ajay, Kouros-Mehr H, Fridlyand J, Jain A, Collins C, Nishizuka S, Tonon G,Roschke A, Gehlhaus K, Kirsch I, Scudiero DA, Gray JW, Weinstein JN:Integrating data on DNA copy number with gene expression levels anddrug sensitivities in the NCI-60 cell line panel. Mol Cancer Ther 2006,5(4):853–867.
45. Roschke AV, Tonon G, Gehlhaus KS, McTyre N, Bussey KJ, Lababidi S,Scudiero DA, Weinstein JN, Kirsch IR: Karyotypic complexity of the NCI-60drug-screening panel. Cancer Res 2003, 63(24):8634–8647.
46. Abaan OD, Polley EC, Davis SR, Zhu YJ, Bilke S, Walker RL, Pineda M, GindinY, Jiang Y, Reinhold WC, Holbeck SL, Simon RM, Doroshow JH, Pommier Y,Meltzer PS: The exomes of the NCI-60 panel: a genomic resource forcancer biology and systems pharmacology. Cancer Res 2013,73(14):4372–4382.
47. Ikediobi ON, Davies H, Bignell G, Edkins S, Stevens C, O'Meara S, Santarius T,Avis T, Barthorpe S, Brackenbury L, Buck G, Butler A, Clements J, Cole J,Dicks E, Forbes S, Gray K, Halliday K, Harrison R, Hills K, Hinton J, Hunter C,Jenkinson A, Jones D, Kosmidou V, Lugg R, Menzies A, Mironenko T, ParkerA, Perry J, et al: Mutation analysis of 24 known cancer genes in the NCI-60cell line set. Mol Cancer Ther 2006, 5(11):2606–2612.
48. Scherf U, Ross DT, Waltham M, Smith LH, Lee JK, Tanabe L, Kohn KW,Reinhold WC, Myers TG, Andrews DT, Scudiero DA, Eisen MB, Sausville EA,Pommier Y, Botstein D, Brown PO, Weinstein JN: A gene expression
database for the molecular pharmacology of cancer. Nat Genet 2000,24(3):236–244.
49. Stinson SF, Alley MC, Kopp WC, Fiebig HH, Mullendore LA, Pittman AF,Kenney S, Keller J, Boyd MR: Morphological and immunocytochemicalcharacteristics of human tumor cell lines for use in a disease-orientedanticancer drug screen. Anticancer Res 1992, 12(4):1035–1053.
50. Robert P, Escoufier Y: A unified tool for linear multivariate statisticalmethods: The RV-coefficient. Applied statistics 1976, 25(3):8.
51. Imamura T, Hikita A, Inoue Y: The roles of TGF-beta signaling in carcino-genesis and breast cancer metastasis. Breast Cancer 2012, 19(2):118–124.
52. Springer TA: Traffic signals on endothelium for lymphocyte recirculationand leukocyte emigration. Annu Rev Physiol 1995, 57:827–872.
53. Wu Z, Moghaddas Gholami A, Kuster B: Systematic identification of theHSP90 candidate regulated proteome. Mol Cell Proteomics 2012,11(6):M111 016675.
54. Virant-Klun I, Stimpfel M, Cvjeticanin B, Vrtacnik-Bokal E, Skutella T: SmallSSEA-4-positive cells from human ovarian cell cultures: related toembryonic stem cells and germinal lineage? J Ovarian Res 2013, 6(1):24.
55. Tothill RW, Tinker AV, George J, Brown R, Fox SB, Lade S, Johnson DS, TrivettMK, Etemadmoghadam D, Locandro B, Traficante N, Fereday S, Hung JA,Chiew YE, Haviv I, Gertig D, DeFazio A, Bowtell DD, Australian OvarianCancer Study Group: Novel molecular subtypes of serous andendometrioid ovarian cancer linked to clinical outcome. Clin Cancer Res2008, 14(16):5198–5208.
56. Verhaak RG, Tamayo P, Yang JY, Hubbard D, Zhang H, Creighton CJ, FeredayS, Lawrence M, Carter SL, Mermel CH, Kostic AD, Etemadmoghadam D,Saksena G, Cibulskis K, Duraisamy S, Levanon K, Sougnez C, Tsherniak A,Gomez S, Onofrio R, Gabriel S, Chin L, Zhang N, Spellman PT, Zhang Y,Akbani R, Hoadley KA, Kahn A, Kobel M, Huntsman D, Soslow RA, et al:Prognostically relevant gene signatures of high-grade serous ovariancarcinoma. J Clin Invest 2013, 123(1):517–525.
57. da Huang W, Sherman BT, Lempicki RA: Systematic and integrativeanalysis of large gene lists using DAVID bioinformatics resources. NatProtoc 2009, 4(1):44–57.
58. Maines-Bandiera S, Woo MM, Borugian M, Molday LL, Hii T, Gilks B, LeungPC, Molday RS, Auersperg N: Oviductal glycoprotein (OVGP1, MUC9): adifferentiation-based mucin present in serum of women with ovariancancer. Int J Gynecol Cancer 2010, 20(1):16–22.
59. Steffan JJ, Koul S, Meacham RB, Koul HK: The transcription factor SPDEFsuppresses prostate tumor metastasis. J Biol Chem 2012,287(35):29968–29978.
60. Bonnet N, Conway SJ, Ferrari SL: Regulation of beta catenin signaling andparathyroid hormone anabolic effects in bone by the matricellularprotein periostin. Proc Natl Acad Sci U S A 2012, 109(37):15048–15053.
doi:10.1186/1471-2105-15-162Cite this article as: Meng et al.: A multivariate approach to theintegration of multi-omics datasets. BMC Bioinformatics 2014 15:162.
Submit your next manuscript to BioMed Centraland take full advantage of:
• Convenient online submission
• Thorough peer review
• No space constraints or color figure charges
• Immediate publication on acceptance
• Inclusion in PubMed, CAS, Scopus and Google Scholar
• Research which is freely available for redistribution
Submit your manuscript at www.biomedcentral.com/submit
Meng et al. BMC Bioinformatics 2014, 15:162 Page 13 of 13http://www.biomedcentral.com/1471-2105/15/162


![DIABLO – an integrative, multi-omics, multivariate method ... · by inputting pathway-based module matrices [11] instead of omics matrices. We demonstrate the ability of DIABLO](https://img.pdfslide.net/doc/110x75/5f5040893690d41a36069e23/diablo-a-an-integrative-multi-omics-multivariate-method-by-inputting-pathway-based.jpg)