Embed Size (px)
Citation preview

A Multivariate Biomarker for
Parkinson’s DiseaseM. Coakley, G. Crocetti, P. Dressner, W. Kellum, T. Lamin
The Michael L. Gargano 12th Annual Research Day Friday, May 2nd, 2014
Introduction
› Genomic Analysis for the selection of genes associated with Parkinson’s Disease (PD)
› Adoption of Multivariate Techniques
› Comparison between several classification algorithms
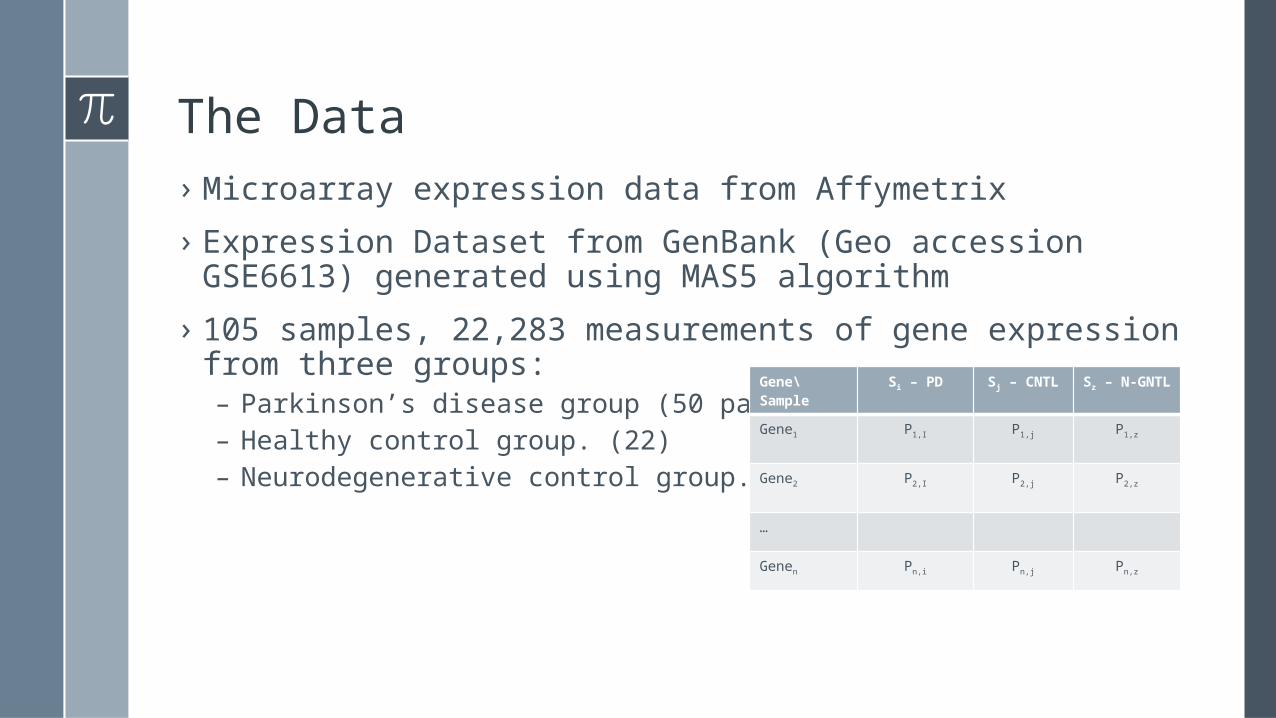
The Data› Microarray expression data from Affymetrix
› Expression Dataset from GenBank (Geo accession GSE6613) generated using MAS5 algorithm
› 105 samples, 22,283 measurements of gene expression from three groups:– Parkinson’s disease group (50 patients)– Healthy control group. (22)– Neurodegenerative control group. (33)
Gene\Sample
Si – PD Sj – CNTL Sz – N-GNTL
Gene1 P1,I P1,j P1,z
Gene2 P2,I P2,j P2,z
…
Genen Pn,i Pn,j Pn,z
Data Preparation
› Filtering: removed noise in probesets (measurement) using “Filtering by Present calls” with threshold of 25%: only maintain genes expressed in 25% of the sample.
› After the filtering the number of probeset dropped from 23,283 to 8,100.
Normality Assumption & Normalization
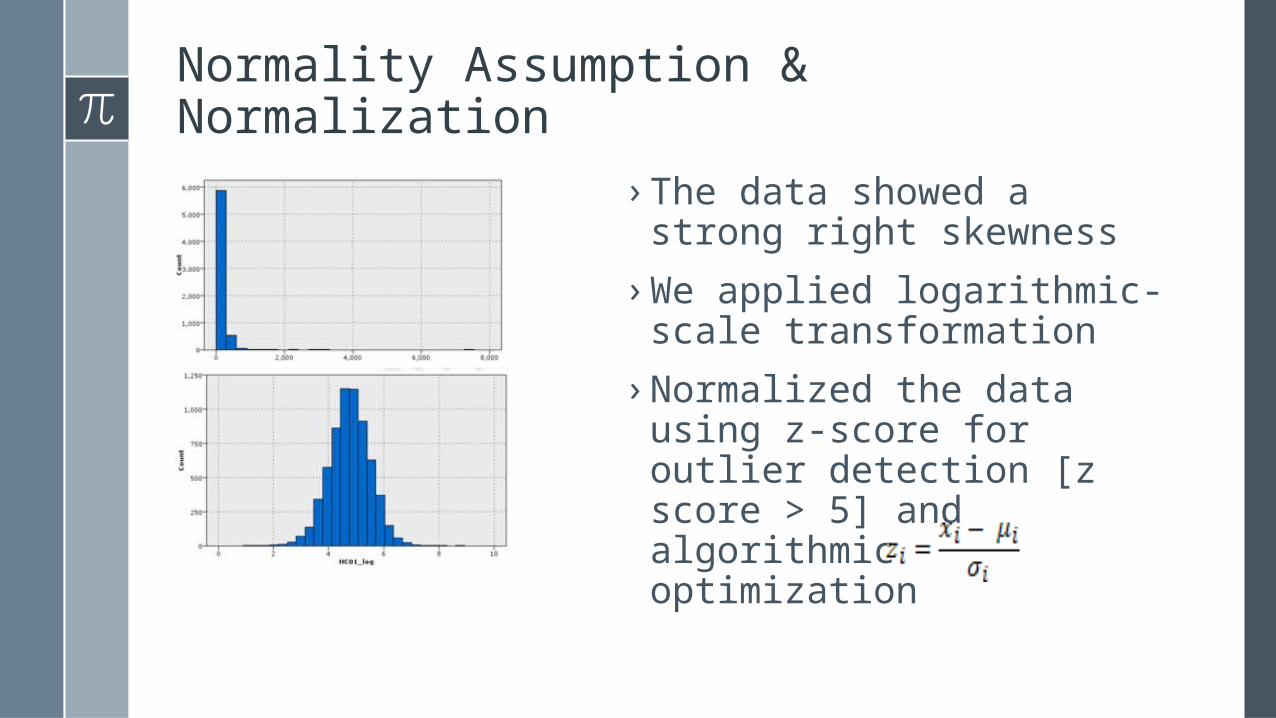
› The data showed a strong right skewness
› We applied logarithmic-scale transformation
› Normalized the data using z-score for outlier detection [z score > 5] and algorithmic optimization
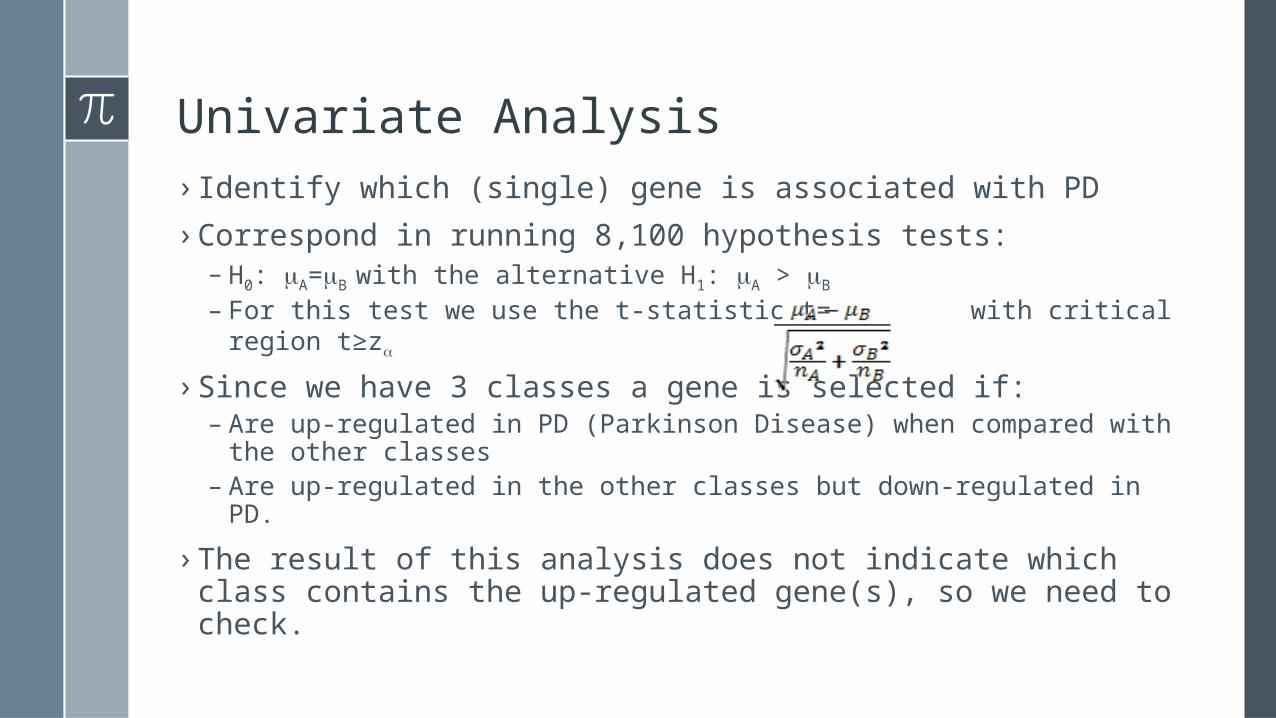
Univariate Analysis› Identify which (single) gene is associated with PD
› Correspond in running 8,100 hypothesis tests:– H0: mA=mB with the alternative H1: mA > mB
– For this test we use the t-statistic t= with critical region t≥za
› Since we have 3 classes a gene is selected if:– Are up-regulated in PD (Parkinson Disease) when compared with
the other classes– Are up-regulated in the other classes but down-regulated in PD.
› The result of this analysis does not indicate which class contains the up-regulated gene(s), so we need to check.
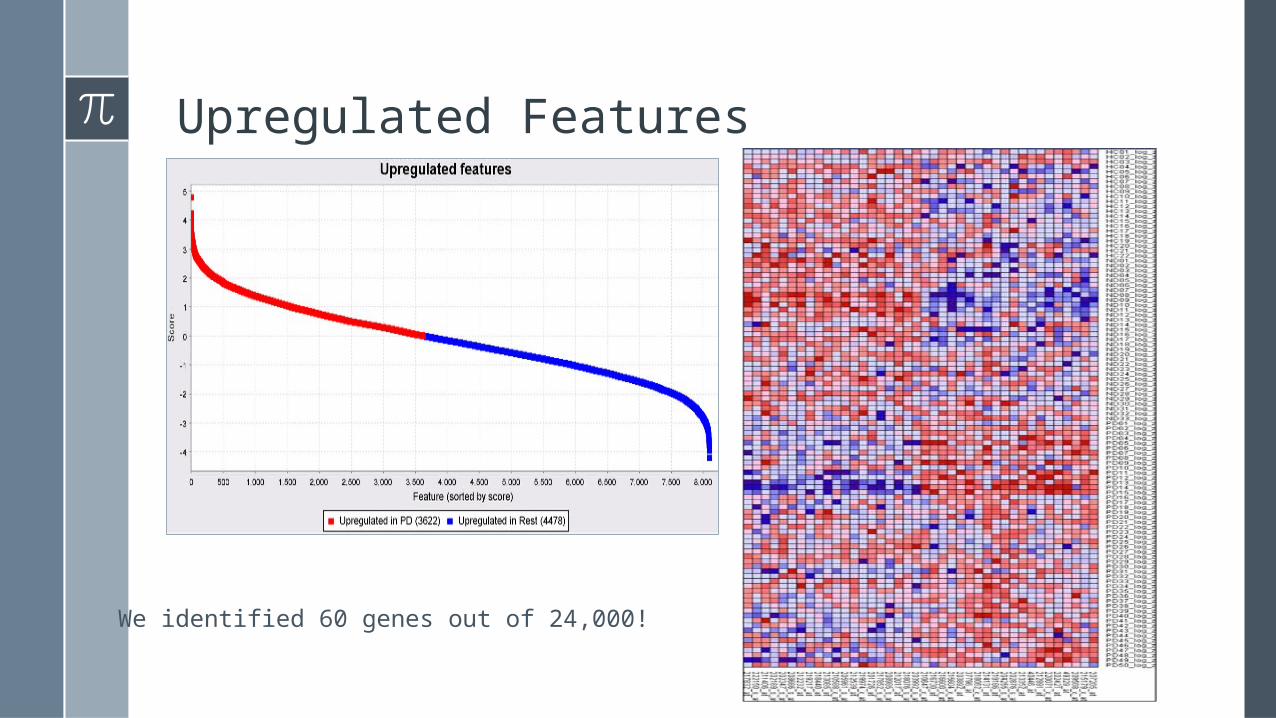
Upregulated Features
We identified 60 genes out of 24,000!
Problems of Univariate Analysis in Genomics
› In array-based differential expression analysis the problem is to generate a list of genes that are differentially expressed, as meaningful and complete as possible.
› Let’s have 1,000 genes. We test each with a t-test with a significance level of 0.05: we might expect 40 genes to be differentially expressed. Of the remaining 960 non-differentially expressed genes we can expect 5% errors, or .05 x 960 = 48 false positives
› There are more false positives than truly differentially expressed genes: this is called multiple hypothesis testing problem
Univariate Vs Multivariate› In Univariate analysis we are considering the effect of
each gene, individually, against the target (PD)
› The effect of a disease is rarely the result of a single gene.
› Even if good univariate leads are found (the 60 genes) this rarely turns into the identification of useful pathways.
› We don’t have information on any group of genes that, together, might be involved in the development of PD
› Multivariate approaches tests for group of variables that, simultaneously, explain the particular output.
› Multivariate theory is much more complex.
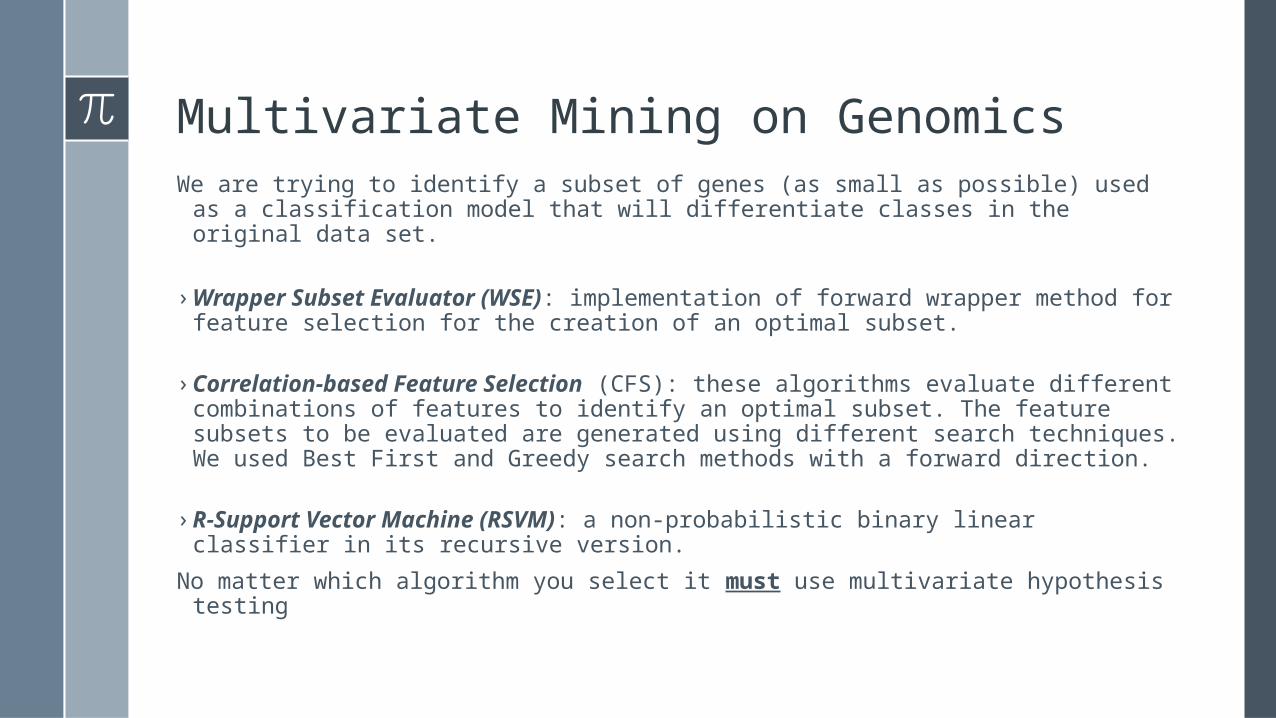
Multivariate Mining on GenomicsWe are trying to identify a subset of genes (as small as possible) used as a
classification model that will differentiate classes in the original data set.
› Wrapper Subset Evaluator (WSE): implementation of forward wrapper method for feature selection for the creation of an optimal subset.
› Correlation-based Feature Selection (CFS): these algorithms evaluate different combinations of features to identify an optimal subset. The feature subsets to be evaluated are generated using different search techniques. We used Best First and Greedy search methods with a forward direction.
› R-Support Vector Machine (RSVM): a non-probabilistic binary linear classifier in its recursive version.
No matter which algorithm you select it must use multivariate hypothesis testing
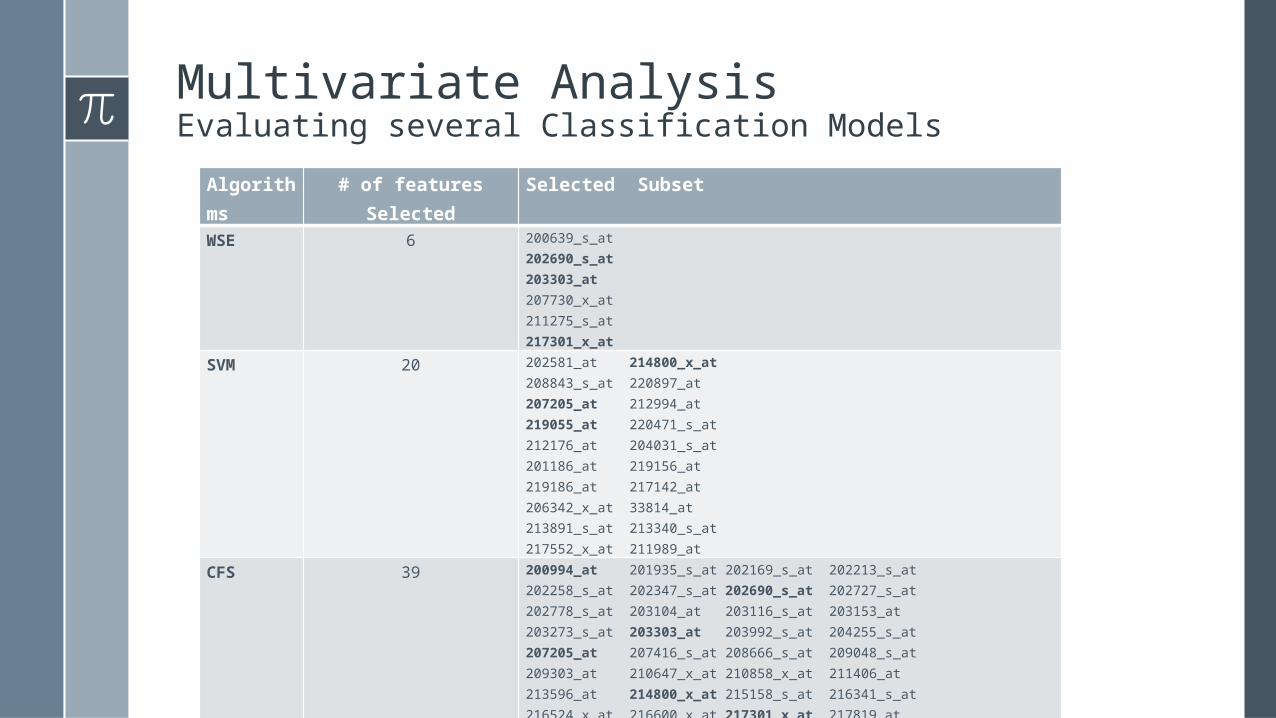
Multivariate AnalysisEvaluating several Classification Models
Algorithms # of features Selected Selected Subset
WSE 6 200639_s_at202690_s_at203303_at207730_x_at211275_s_at217301_x_at
SVM 20 202581_at 214800_x_at208843_s_at 220897_at207205_at 212994_at219055_at 220471_s_at212176_at 204031_s_at201186_at 219156_at219186_at 217142_at206342_x_at 33814_at213891_s_at 213340_s_at217552_x_at 211989_at
CFS 39 200994_at 201935_s_at 202169_s_at 202213_s_at202258_s_at 202347_s_at 202690_s_at 202727_s_at202778_s_at 203104_at 203116_s_at 203153_at203273_s_at 203303_at 203992_s_at 204255_s_at207205_at 207416_s_at 208666_s_at 209048_s_at209303_at 210647_x_at 210858_x_at 211406_at213596_at 214800_x_at 215158_s_at 216341_s_at216524_x_at 216600_x_at 217301_x_at 217819_at217922_at 218236_s_at 218680_x_at 219055_at220529_at 221192_x_at AFFX-HSAC07/X00351_M_at
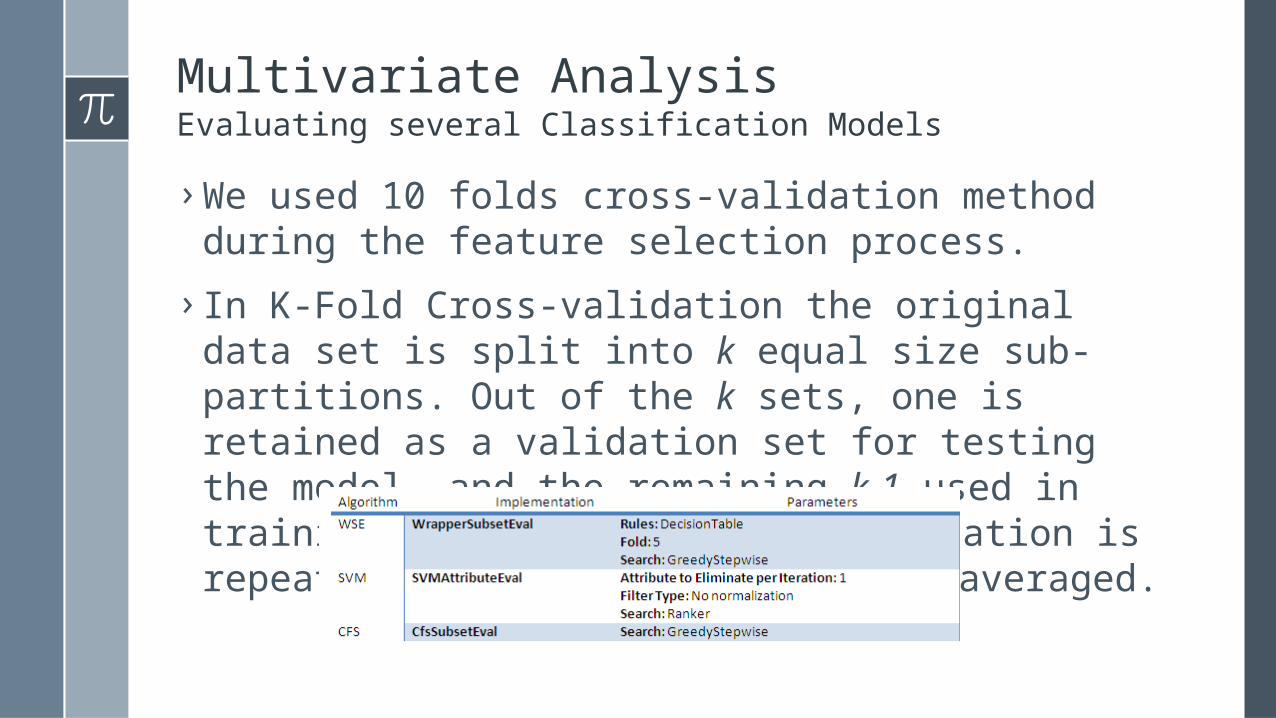
Multivariate AnalysisEvaluating several Classification Models
› We used 10 folds cross-validation method during the feature selection process.
› In K-Fold Cross-validation the original data set is split into k equal size sub-partitions. Out of the k sets, one is retained as a validation set for testing the model, and the remaining k-1 used in training the data. The cross-validation is repeated k times, and the results averaged.
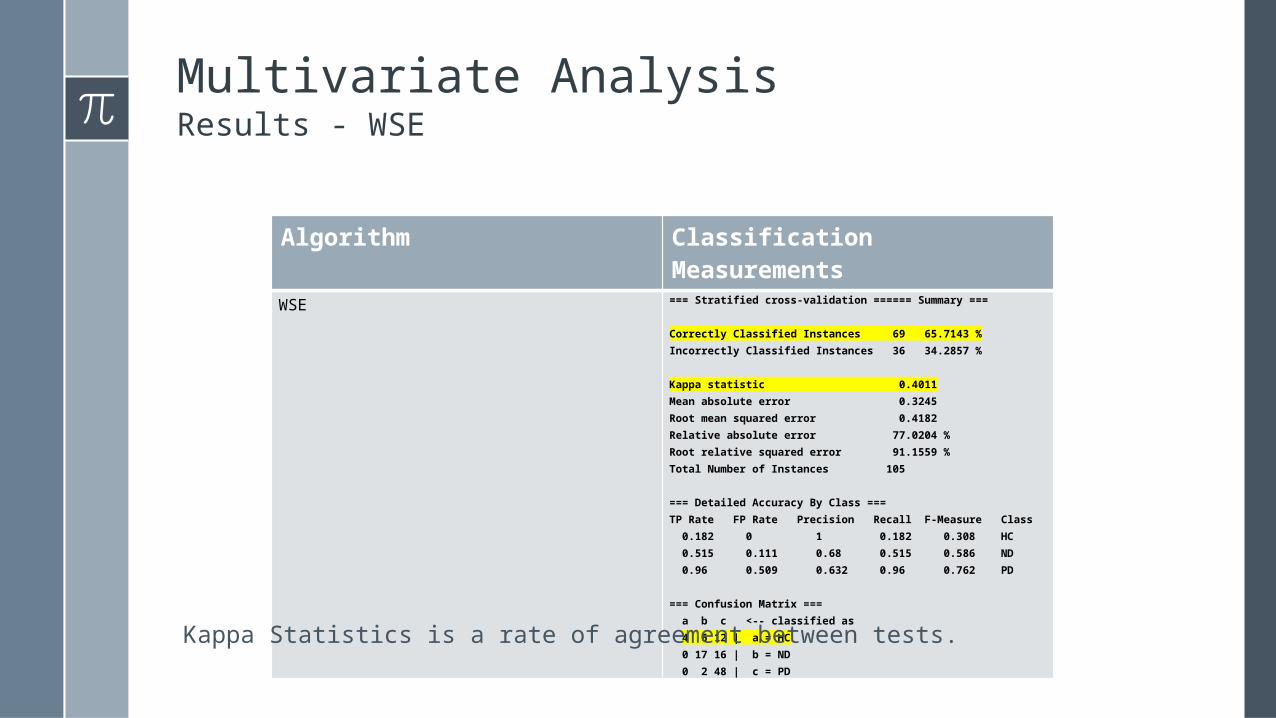
Multivariate AnalysisResults - WSE
Algorithm Classification Measurements
WSE === Stratified cross-validation ====== Summary ===
Correctly Classified Instances 69 65.7143 %Incorrectly Classified Instances 36 34.2857 %
Kappa statistic 0.4011Mean absolute error 0.3245Root mean squared error 0.4182Relative absolute error 77.0204 %Root relative squared error 91.1559 %Total Number of Instances 105
=== Detailed Accuracy By Class ===TP Rate FP Rate Precision Recall F-Measure Class 0.182 0 1 0.182 0.308 HC 0.515 0.111 0.68 0.515 0.586 ND 0.96 0.509 0.632 0.96 0.762 PD
=== Confusion Matrix === a b c <-- classified as 4 6 12 | a = HC 0 17 16 | b = ND 0 2 48 | c = PD
Kappa Statistics is a rate of agreement between tests.
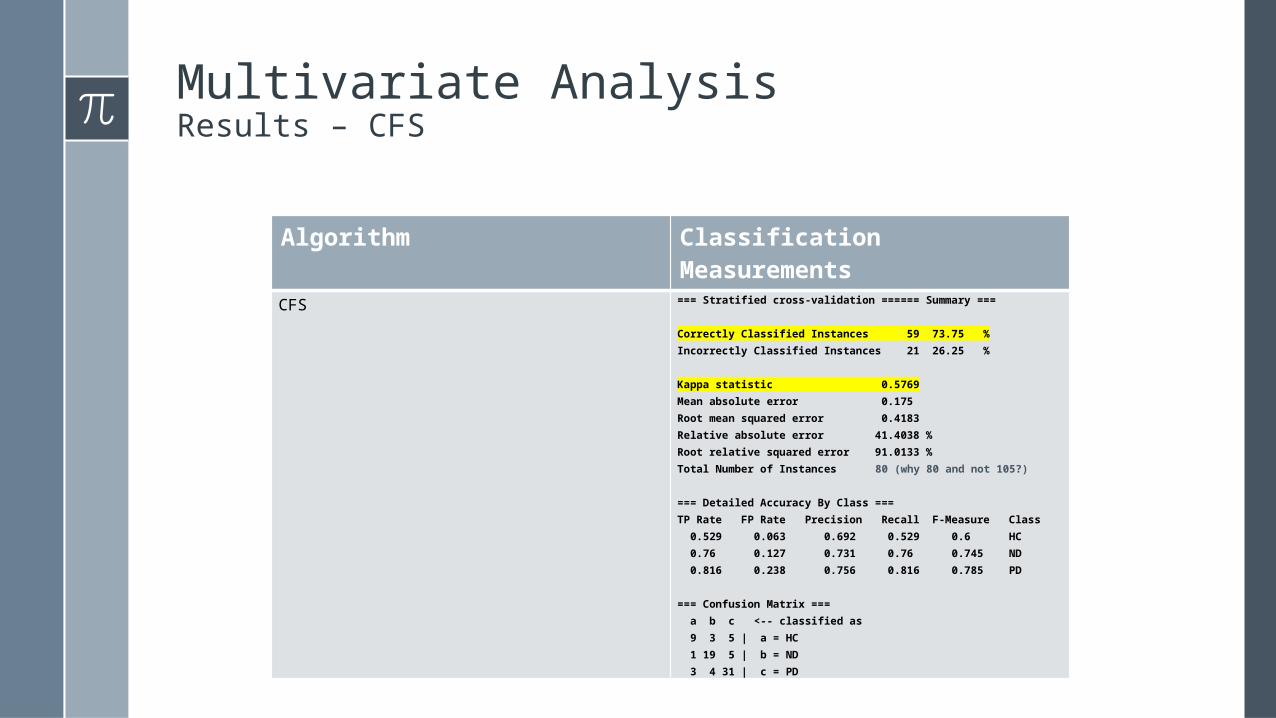
Multivariate AnalysisResults – CFS
Algorithm Classification Measurements
CFS === Stratified cross-validation ====== Summary ===
Correctly Classified Instances 59 73.75 %Incorrectly Classified Instances 21 26.25 %
Kappa statistic 0.5769Mean absolute error 0.175 Root mean squared error 0.4183Relative absolute error 41.4038 %Root relative squared error 91.0133 %Total Number of Instances 80 (why 80 and not 105?)
=== Detailed Accuracy By Class ===TP Rate FP Rate Precision Recall F-Measure Class 0.529 0.063 0.692 0.529 0.6 HC 0.76 0.127 0.731 0.76 0.745 ND 0.816 0.238 0.756 0.816 0.785 PD
=== Confusion Matrix === a b c <-- classified as 9 3 5 | a = HC 1 19 5 | b = ND 3 4 31 | c = PD
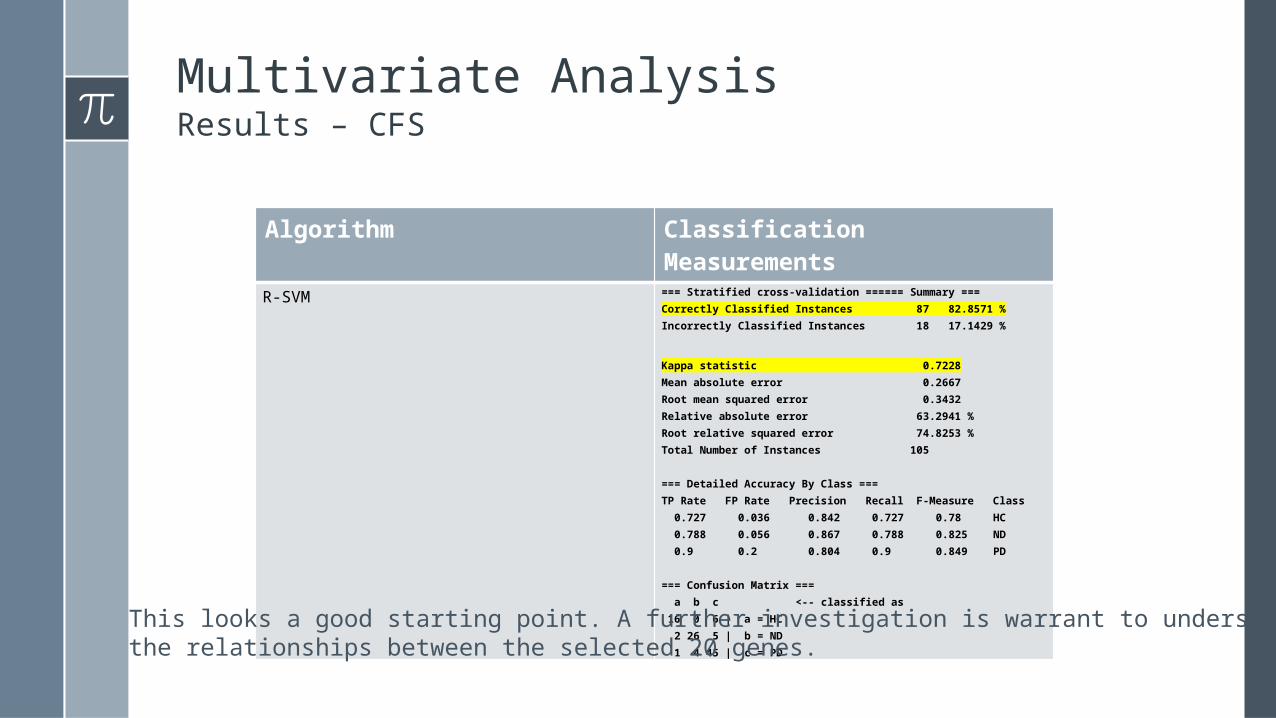
Multivariate AnalysisResults – CFS
Algorithm Classification Measurements
R-SVM === Stratified cross-validation ====== Summary ===Correctly Classified Instances 87 82.8571 %Incorrectly Classified Instances 18 17.1429 %
Kappa statistic 0.7228Mean absolute error 0.2667Root mean squared error 0.3432Relative absolute error 63.2941 %Root relative squared error 74.8253 %Total Number of Instances 105
=== Detailed Accuracy By Class ===TP Rate FP Rate Precision Recall F-Measure Class 0.727 0.036 0.842 0.727 0.78 HC 0.788 0.056 0.867 0.788 0.825 ND 0.9 0.2 0.804 0.9 0.849 PD
=== Confusion Matrix === a b c <-- classified as 16 0 6 | a = HC 2 26 5 | b = ND 1 4 45 | c = PD
This looks a good starting point. A further investigation is warrant to understandthe relationships between the selected 20 genes.
Conclusions
› Multivariate models are a necessary tools in genomic studies.
› Among the algorithms tested in this study, RSVM clearly came out as an effective model to adopt in biomarker discovery, with the important ability of successfully discriminate between PD and other neurodegenerative diseases.
› This research cannot stop here, and the natural next step is to look for the biological interpretation of this result.

Thank you