Embed Size (px)
Citation preview
Proceedings of the 15th IBPSA ConferenceSan Francisco, CA, USA, Aug. 7-9, 2017
389https://doi.org/10.26868/25222708.2017.103
A New Framework for Residential Daylight Performance Evaluation
Timur Dogan, Ye Chan Park
[email protected], [email protected] Environmental Systems Lab, Cornell, Ithaca, New York, USA
Abstract Current climate-based daylighting metrics have limited applicability for residential use cases and fail to highlight relevant aspects of natural light in residential spaces, such as diurnal and seasonal availability of daylight and access to direct sunlight. This paper proposes a new climate-based, annual evaluation framework that quantifies daylight autonomy and access to direct light in diurnal and seasonal bins for temperate and cold climates. Spatial maps, as well as apartment scores, can be computed. Rigorous testing at various architectural scales highlights the usefulness and sensitivity of the introduced framework.
Introduction Daylight is a valuable natural resource that has been linked to quality of space (Corrodi & Spechtenhauser, 2008) (Rockcastle & Andersen, 2013) (Gherri, 2015), occupant health and well-being (Webb, 2006) (Lockley, 2009), and energy conservation by offsetting electric lighting and its impact on heating and cooling loads (Li & Lam, 2000) (Athienitis & Tzempelikos, 2002) (Franzetti, Fraisse, & Achard, 2004) (Sabry, Sherif, Gadelhak, & Aly, 2014) (Altan, Mohelnikova, & Hofman, 2015). Furthermore, daylighting is an essential connector between the interior and exterior of a space and provides “psychological and physiological benefits not obtainable with electric lighting or windowless buildings” (Aghemo & Pellegrino, 1997) (Robbins, 1986) (Tregenza & Wilson, 2013). Consequently, researchers consider daylighting at various scales, ranging from daylight-enhancing façade components (Raphael, 2011) (Dogan & Stec, 2016) to urban studies (Compagnon, 2004) (Strømann-Andersen & Sattrup, 2011) (Dogan, Reinhart, & Michalatos, 2012), and have developed a variety of Daylight Performance Metrics (DPMs) that aim to quantify the different aspects of natural light (Reinhart, Mardaljevic, & Rogers, 2006). However, a search through the literature reveals that much of current daylighting research is primarily focused on office spaces, whereas residential architecture is rarely considered. A keyword search across academic search engines reveals that out of 6865 publications, 65% focus on office spaces while only 35% focus on residential architecture. When narrowed down to climate-based metrics (535 papers), the divide between office and residential spaces increases to 73% versus 27%.
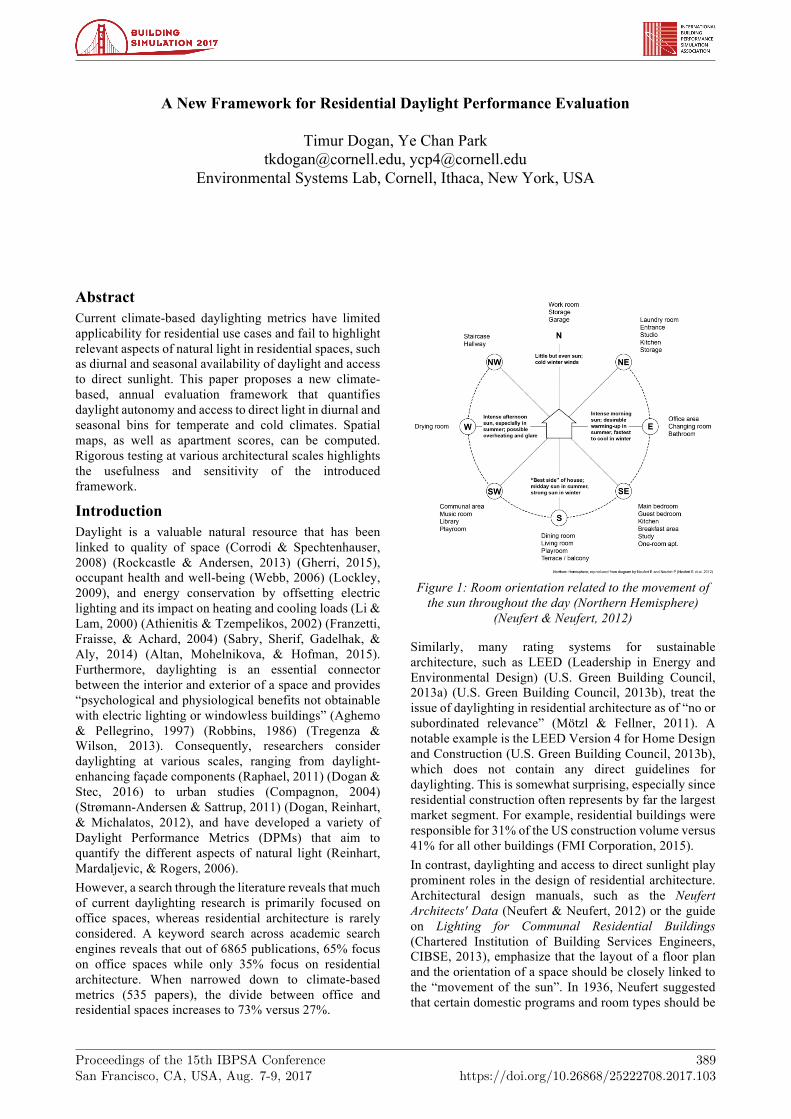
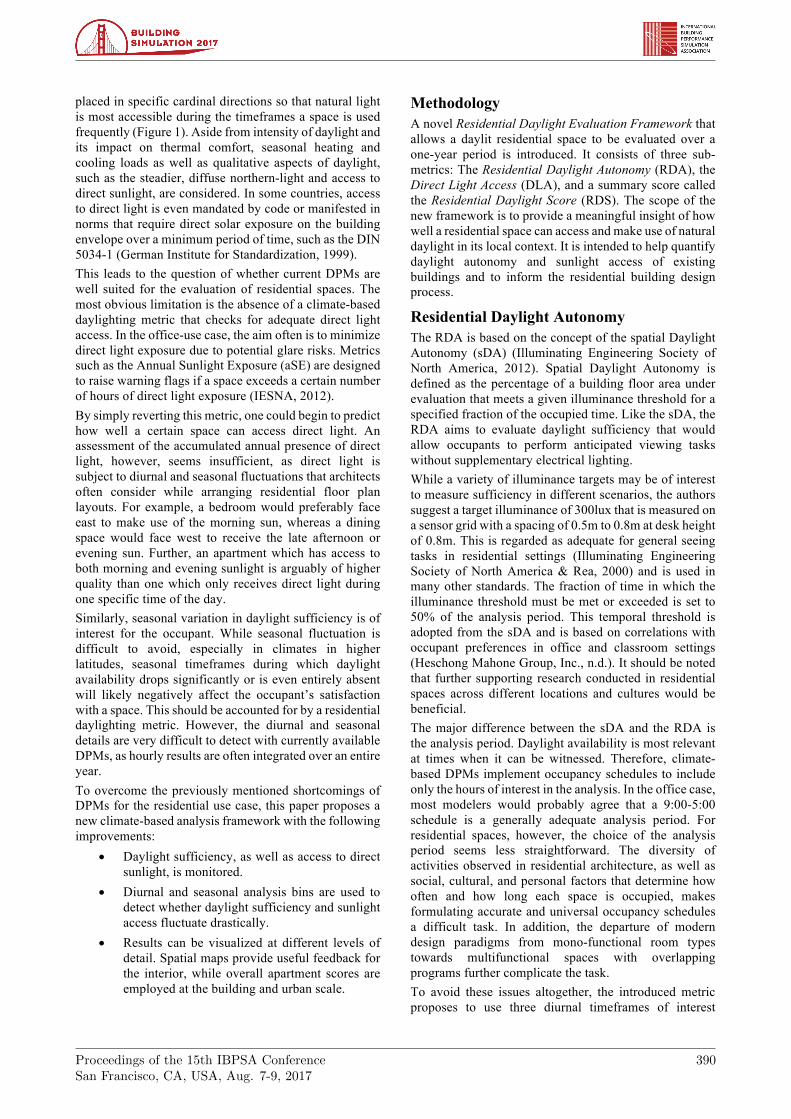
Figure 1: Room orientation related to the movement of
the sun throughout the day (Northern Hemisphere) (Neufert & Neufert, 2012)
Similarly, many rating systems for sustainable architecture, such as LEED (Leadership in Energy and Environmental Design) (U.S. Green Building Council, 2013a) (U.S. Green Building Council, 2013b), treat the issue of daylighting in residential architecture as of “no or subordinated relevance” (Mötzl & Fellner, 2011). A notable example is the LEED Version 4 for Home Design and Construction (U.S. Green Building Council, 2013b), which does not contain any direct guidelines for daylighting. This is somewhat surprising, especially since residential construction often represents by far the largest market segment. For example, residential buildings were responsible for 31% of the US construction volume versus 41% for all other buildings (FMI Corporation, 2015). In contrast, daylighting and access to direct sunlight play prominent roles in the design of residential architecture. Architectural design manuals, such as the Neufert Architects' Data (Neufert & Neufert, 2012) or the guide on Lighting for Communal Residential Buildings (Chartered Institution of Building Services Engineers, CIBSE, 2013), emphasize that the layout of a floor plan and the orientation of a space should be closely linked to the “movement of the sun”. In 1936, Neufert suggested that certain domestic programs and room types should be
Proceedings of the 15th IBPSA ConferenceSan Francisco, CA, USA, Aug. 7-9, 2017
390
placed in specific cardinal directions so that natural light is most accessible during the timeframes a space is used frequently (Figure 1). Aside from intensity of daylight and its impact on thermal comfort, seasonal heating and cooling loads as well as qualitative aspects of daylight, such as the steadier, diffuse northern-light and access to direct sunlight, are considered. In some countries, access to direct light is even mandated by code or manifested in norms that require direct solar exposure on the building envelope over a minimum period of time, such as the DIN 5034-1 (German Institute for Standardization, 1999). This leads to the question of whether current DPMs are well suited for the evaluation of residential spaces. The most obvious limitation is the absence of a climate-based daylighting metric that checks for adequate direct light access. In the office-use case, the aim often is to minimize direct light exposure due to potential glare risks. Metrics such as the Annual Sunlight Exposure (aSE) are designed to raise warning flags if a space exceeds a certain number of hours of direct light exposure (IESNA, 2012). By simply reverting this metric, one could begin to predict how well a certain space can access direct light. An assessment of the accumulated annual presence of direct light, however, seems insufficient, as direct light is subject to diurnal and seasonal fluctuations that architects often consider while arranging residential floor plan layouts. For example, a bedroom would preferably face east to make use of the morning sun, whereas a dining space would face west to receive the late afternoon or evening sun. Further, an apartment which has access to both morning and evening sunlight is arguably of higher quality than one which only receives direct light during one specific time of the day. Similarly, seasonal variation in daylight sufficiency is of interest for the occupant. While seasonal fluctuation is difficult to avoid, especially in climates in higher latitudes, seasonal timeframes during which daylight availability drops significantly or is even entirely absent will likely negatively affect the occupant’s satisfaction with a space. This should be accounted for by a residential daylighting metric. However, the diurnal and seasonal details are very difficult to detect with currently available DPMs, as hourly results are often integrated over an entire year. To overcome the previously mentioned shortcomings of DPMs for the residential use case, this paper proposes a new climate-based analysis framework with the following improvements:
• Daylight sufficiency, as well as access to direct sunlight, is monitored.
• Diurnal and seasonal analysis bins are used to detect whether daylight sufficiency and sunlight access fluctuate drastically.
• Results can be visualized at different levels of detail. Spatial maps provide useful feedback for the interior, while overall apartment scores are employed at the building and urban scale.
Methodology A novel Residential Daylight Evaluation Framework that allows a daylit residential space to be evaluated over a one-year period is introduced. It consists of three sub-metrics: The Residential Daylight Autonomy (RDA), the Direct Light Access (DLA), and a summary score called the Residential Daylight Score (RDS). The scope of the new framework is to provide a meaningful insight of how well a residential space can access and make use of natural daylight in its local context. It is intended to help quantify daylight autonomy and sunlight access of existing buildings and to inform the residential building design process.
Residential Daylight Autonomy The RDA is based on the concept of the spatial Daylight Autonomy (sDA) (Illuminating Engineering Society of North America, 2012). Spatial Daylight Autonomy is defined as the percentage of a building floor area under evaluation that meets a given illuminance threshold for a specified fraction of the occupied time. Like the sDA, the RDA aims to evaluate daylight sufficiency that would allow occupants to perform anticipated viewing tasks without supplementary electrical lighting. While a variety of illuminance targets may be of interest to measure sufficiency in different scenarios, the authors suggest a target illuminance of 300lux that is measured on a sensor grid with a spacing of 0.5m to 0.8m at desk height of 0.8m. This is regarded as adequate for general seeing tasks in residential settings (Illuminating Engineering Society of North America & Rea, 2000) and is used in many other standards. The fraction of time in which the illuminance threshold must be met or exceeded is set to 50% of the analysis period. This temporal threshold is adopted from the sDA and is based on correlations with occupant preferences in office and classroom settings (Heschong Mahone Group, Inc., n.d.). It should be noted that further supporting research conducted in residential spaces across different locations and cultures would be beneficial. The major difference between the sDA and the RDA is the analysis period. Daylight availability is most relevant at times when it can be witnessed. Therefore, climate-based DPMs implement occupancy schedules to include only the hours of interest in the analysis. In the office case, most modelers would probably agree that a 9:00-5:00 schedule is a generally adequate analysis period. For residential spaces, however, the choice of the analysis period seems less straightforward. The diversity of activities observed in residential architecture, as well as social, cultural, and personal factors that determine how often and how long each space is occupied, makes formulating accurate and universal occupancy schedules a difficult task. In addition, the departure of modern design paradigms from mono-functional room types towards multifunctional spaces with overlapping programs further complicate the task. To avoid these issues altogether, the introduced metric proposes to use three diurnal timeframes of interest
Proceedings of the 15th IBPSA ConferenceSan Francisco, CA, USA, Aug. 7-9, 2017
391
(Morning, Noon, Evening) between sunrise and sunset (Table 1). The motivation behind excluding all hours during which the sun is below the horizon is to focus the analysis on building-specific performance implications and to exclude potential location- and climate-specific disadvantages. Based on these timeframes, three diurnal analysis bins are set up. To detect significant seasonal fluctuations, these three bins are further subdivided into Spring, Summer, Fall and Winter timeframes, resulting in a total of 12 analysis bins (Table 1). The seasonal timeframes are collections of three months which center around the equinoxes and the solstices.
Table 1: Diurnal and seasonal analysis timeframes that produce the 12 proposed analysis bins
Morning Noon Evening Sunrise-11 11-15 15-Sunset
Spring Summer Fall Winter Feb/07-May/06
May/07-Aug/06
Aug/07-Nov/06
Nov/07-Feb/06
As a result, the RDA yields the percentage of floor area that is daylit for each analysis bin. At the sensor level, one can determine if the sensor is daylit in the morning, noon,
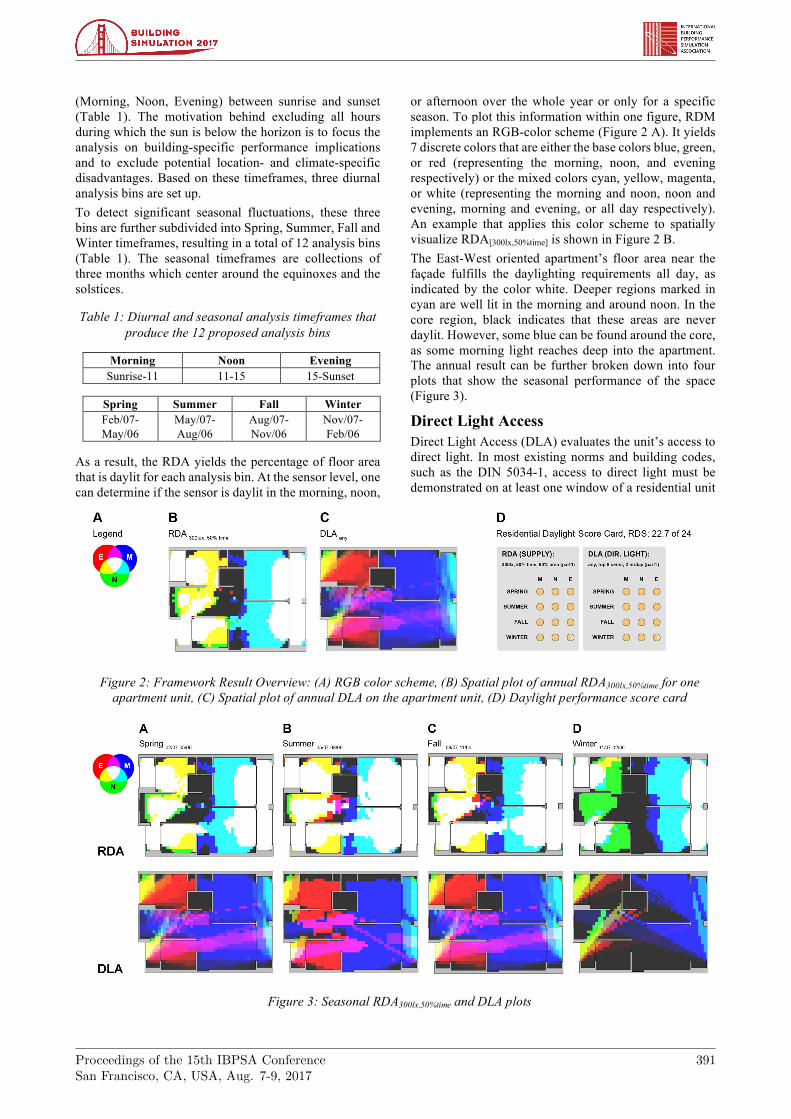
or afternoon over the whole year or only for a specific season. To plot this information within one figure, RDM implements an RGB-color scheme (Figure 2 A). It yields 7 discrete colors that are either the base colors blue, green, or red (representing the morning, noon, and evening respectively) or the mixed colors cyan, yellow, magenta, or white (representing the morning and noon, noon and evening, morning and evening, or all day respectively). An example that applies this color scheme to spatially visualize RDA[300lx,50%time] is shown in Figure 2 B. The East-West oriented apartment’s floor area near the façade fulfills the daylighting requirements all day, as indicated by the color white. Deeper regions marked in cyan are well lit in the morning and around noon. In the core region, black indicates that these areas are never daylit. However, some blue can be found around the core, as some morning light reaches deep into the apartment. The annual result can be further broken down into four plots that show the seasonal performance of the space (Figure 3).
Direct Light Access Direct Light Access (DLA) evaluates the unit’s access to direct light. In most existing norms and building codes, such as the DIN 5034-1, access to direct light must be demonstrated on at least one window of a residential unit
Figure 2: Framework Result Overview: (A) RGB color scheme, (B) Spatial plot of annual RDA300lx,50%time for one
apartment unit, (C) Spatial plot of annual DLA on the apartment unit, (D) Daylight performance score card
Figure 3: Seasonal RDA300lx,50%time and DLA plots
Proceedings of the 15th IBPSA ConferenceSan Francisco, CA, USA, Aug. 7-9, 2017
392
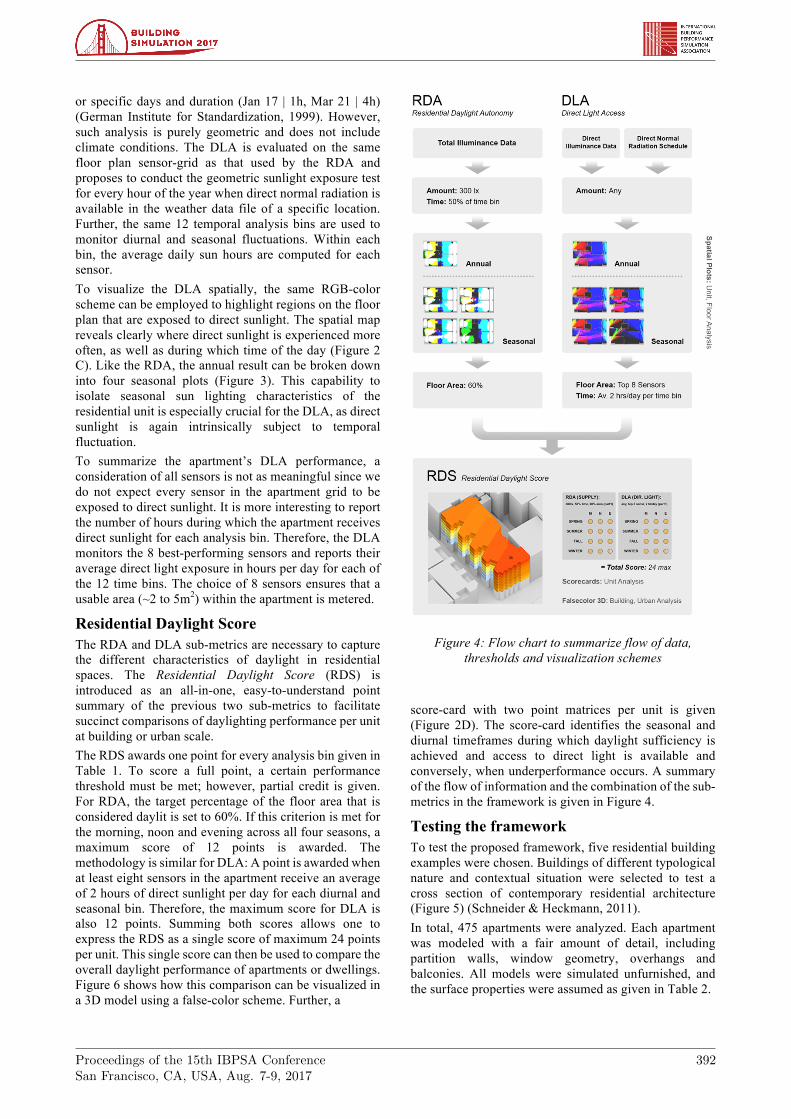
or specific days and duration (Jan 17 | 1h, Mar 21 | 4h) (German Institute for Standardization, 1999). However, such analysis is purely geometric and does not include climate conditions. The DLA is evaluated on the same floor plan sensor-grid as that used by the RDA and proposes to conduct the geometric sunlight exposure test for every hour of the year when direct normal radiation is available in the weather data file of a specific location. Further, the same 12 temporal analysis bins are used to monitor diurnal and seasonal fluctuations. Within each bin, the average daily sun hours are computed for each sensor. To visualize the DLA spatially, the same RGB-color scheme can be employed to highlight regions on the floor plan that are exposed to direct sunlight. The spatial map reveals clearly where direct sunlight is experienced more often, as well as during which time of the day (Figure 2 C). Like the RDA, the annual result can be broken down into four seasonal plots (Figure 3). This capability to isolate seasonal sun lighting characteristics of the residential unit is especially crucial for the DLA, as direct sunlight is again intrinsically subject to temporal fluctuation. To summarize the apartment’s DLA performance, a consideration of all sensors is not as meaningful since we do not expect every sensor in the apartment grid to be exposed to direct sunlight. It is more interesting to report the number of hours during which the apartment receives direct sunlight for each analysis bin. Therefore, the DLA monitors the 8 best-performing sensors and reports their average direct light exposure in hours per day for each of the 12 time bins. The choice of 8 sensors ensures that a usable area (~2 to 5m2) within the apartment is metered.
Residential Daylight Score The RDA and DLA sub-metrics are necessary to capture the different characteristics of daylight in residential spaces. The Residential Daylight Score (RDS) is introduced as an all-in-one, easy-to-understand point summary of the previous two sub-metrics to facilitate succinct comparisons of daylighting performance per unit at building or urban scale. The RDS awards one point for every analysis bin given in Table 1. To score a full point, a certain performance threshold must be met; however, partial credit is given. For RDA, the target percentage of the floor area that is considered daylit is set to 60%. If this criterion is met for the morning, noon and evening across all four seasons, a maximum score of 12 points is awarded. The methodology is similar for DLA: A point is awarded when at least eight sensors in the apartment receive an average of 2 hours of direct sunlight per day for each diurnal and seasonal bin. Therefore, the maximum score for DLA is also 12 points. Summing both scores allows one to express the RDS as a single score of maximum 24 points per unit. This single score can then be used to compare the overall daylight performance of apartments or dwellings. Figure 6 shows how this comparison can be visualized in a 3D model using a false-color scheme. Further, a
Figure 4: Flow chart to summarize flow of data, thresholds and visualization schemes
score-card with two point matrices per unit is given (Figure 2D). The score-card identifies the seasonal and diurnal timeframes during which daylight sufficiency is achieved and access to direct light is available and conversely, when underperformance occurs. A summary of the flow of information and the combination of the sub-metrics in the framework is given in Figure 4.
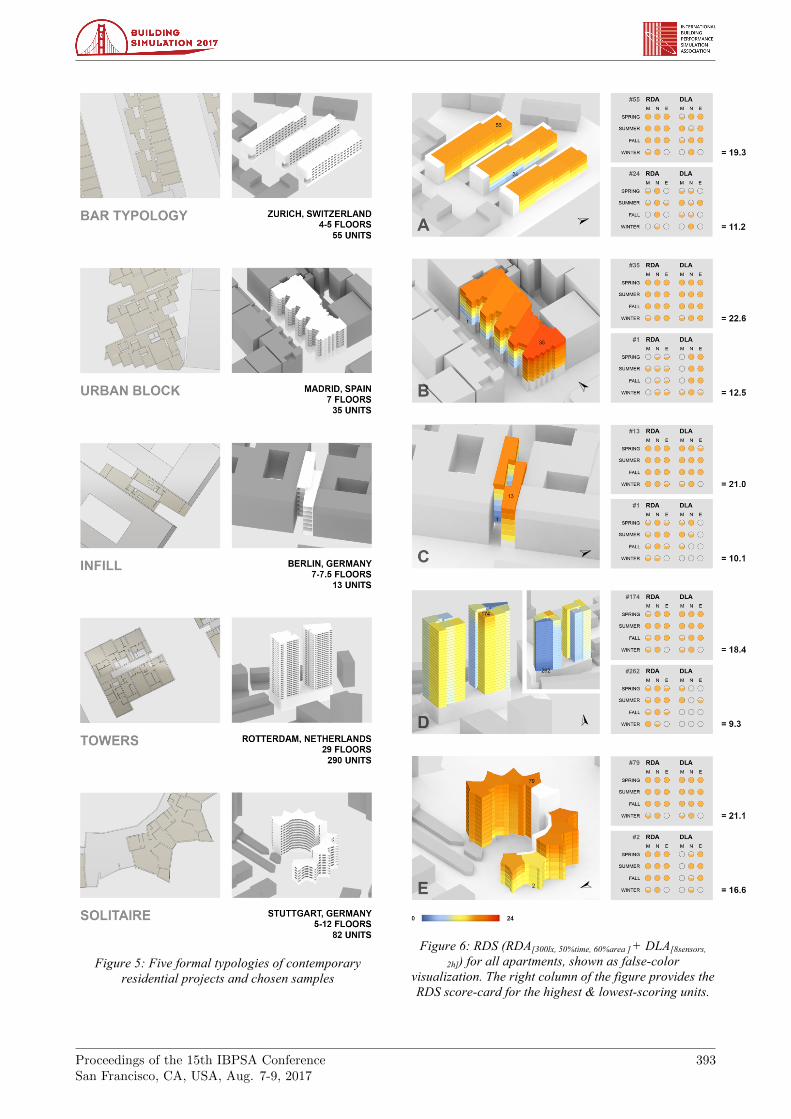
Testing the framework To test the proposed framework, five residential building examples were chosen. Buildings of different typological nature and contextual situation were selected to test a cross section of contemporary residential architecture (Figure 5) (Schneider & Heckmann, 2011). In total, 475 apartments were analyzed. Each apartment was modeled with a fair amount of detail, including partition walls, window geometry, overhangs and balconies. All models were simulated unfurnished, and the surface properties were assumed as given in Table 2.
Proceedings of the 15th IBPSA ConferenceSan Francisco, CA, USA, Aug. 7-9, 2017
393
Figure 5: Five formal typologies of contemporary
residential projects and chosen samples
Figure 6: RDS (RDA[300lx, 50%time, 60%area ] + DLA[8sensors,
2h]) for all apartments, shown as false-color visualization. The right column of the figure provides the RDS score-card for the highest & lowest-scoring units.
Proceedings of the 15th IBPSA ConferenceSan Francisco, CA, USA, Aug. 7-9, 2017
394
The apartment buildings were modeled in Rhino and then linked into Grasshopper. Simulations were conducted with DIVA (DIVA, 2016) and RADIANCE (Ward, 2016) in order to generate climate-specific, hourly illuminance data for each sensor and unit. This hourly illuminance data was post-processed with a custom script to compute the RDEF indices. The simulation parameters were kept consistent across all example buildings and are provided in Table 3.
Table 2: Surface reflectance and window transmittance
Material Reflectance / Transmittance Ceiling 70% Floor 20% Interior Wall 70% White Exterior Wall 70% Brick Exterior Wall 10-20% Window (single-pane) 88% Other facades 35% Outside ground 20%
Table 3: Radiance parameters:
aa .15 ab 5 ad 2048 ar 512 as 1024
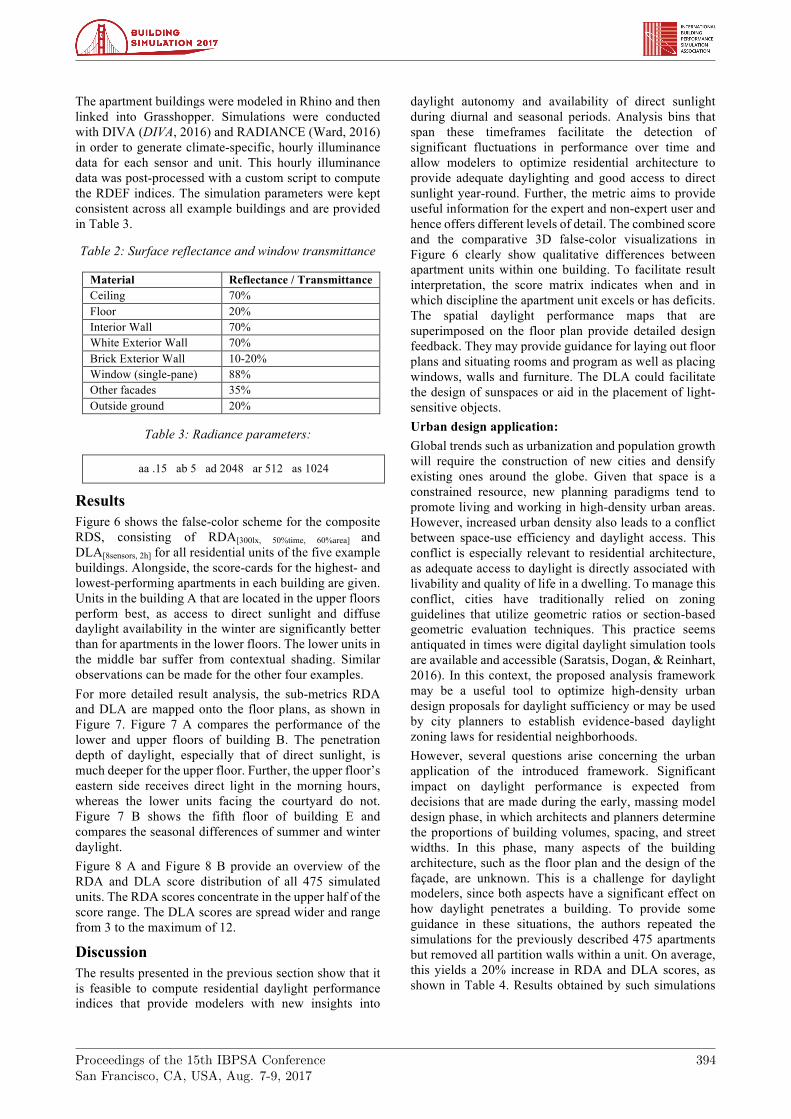
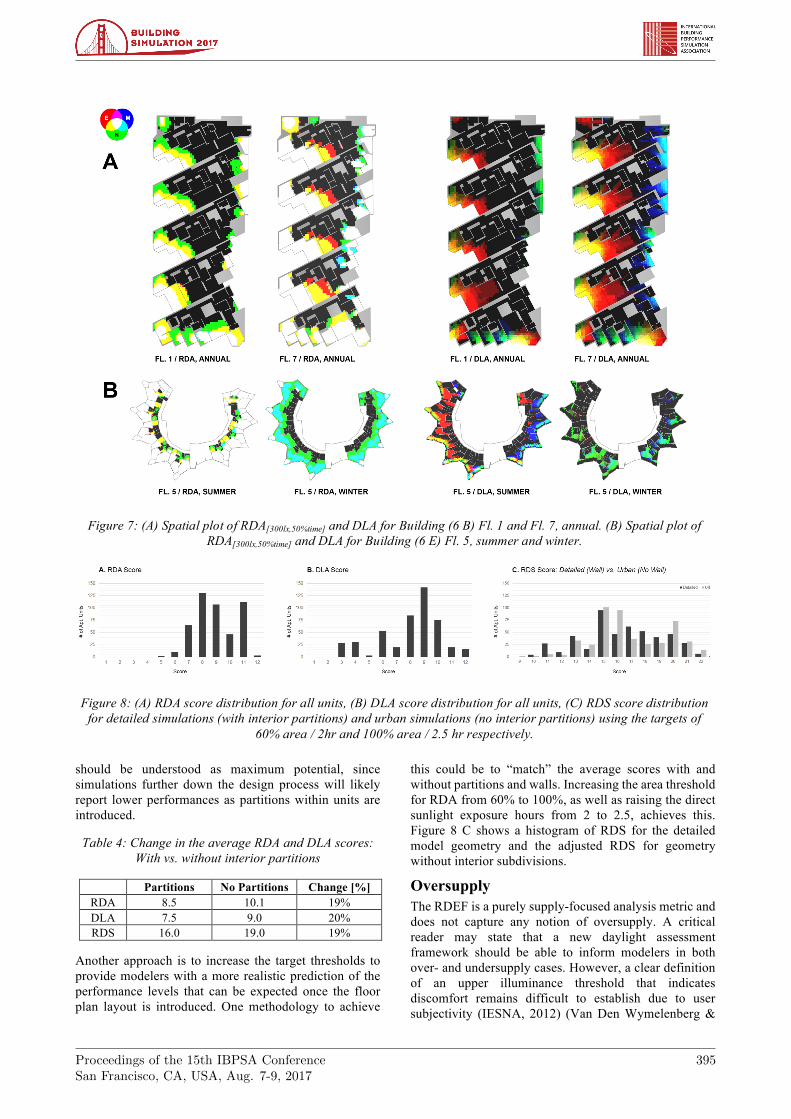
Results Figure 6 shows the false-color scheme for the composite RDS, consisting of RDA[300lx, 50%time, 60%area] and DLA[8sensors, 2h] for all residential units of the five example buildings. Alongside, the score-cards for the highest- and lowest-performing apartments in each building are given. Units in the building A that are located in the upper floors perform best, as access to direct sunlight and diffuse daylight availability in the winter are significantly better than for apartments in the lower floors. The lower units in the middle bar suffer from contextual shading. Similar observations can be made for the other four examples. For more detailed result analysis, the sub-metrics RDA and DLA are mapped onto the floor plans, as shown in Figure 7. Figure 7 A compares the performance of the lower and upper floors of building B. The penetration depth of daylight, especially that of direct sunlight, is much deeper for the upper floor. Further, the upper floor’s eastern side receives direct light in the morning hours, whereas the lower units facing the courtyard do not. Figure 7 B shows the fifth floor of building E and compares the seasonal differences of summer and winter daylight. Figure 8 A and Figure 8 B provide an overview of the RDA and DLA score distribution of all 475 simulated units. The RDA scores concentrate in the upper half of the score range. The DLA scores are spread wider and range from 3 to the maximum of 12.
Discussion The results presented in the previous section show that it is feasible to compute residential daylight performance indices that provide modelers with new insights into
daylight autonomy and availability of direct sunlight during diurnal and seasonal periods. Analysis bins that span these timeframes facilitate the detection of significant fluctuations in performance over time and allow modelers to optimize residential architecture to provide adequate daylighting and good access to direct sunlight year-round. Further, the metric aims to provide useful information for the expert and non-expert user and hence offers different levels of detail. The combined score and the comparative 3D false-color visualizations in Figure 6 clearly show qualitative differences between apartment units within one building. To facilitate result interpretation, the score matrix indicates when and in which discipline the apartment unit excels or has deficits. The spatial daylight performance maps that are superimposed on the floor plan provide detailed design feedback. They may provide guidance for laying out floor plans and situating rooms and program as well as placing windows, walls and furniture. The DLA could facilitate the design of sunspaces or aid in the placement of light-sensitive objects. Urban design application: Global trends such as urbanization and population growth will require the construction of new cities and densify existing ones around the globe. Given that space is a constrained resource, new planning paradigms tend to promote living and working in high-density urban areas. However, increased urban density also leads to a conflict between space-use efficiency and daylight access. This conflict is especially relevant to residential architecture, as adequate access to daylight is directly associated with livability and quality of life in a dwelling. To manage this conflict, cities have traditionally relied on zoning guidelines that utilize geometric ratios or section-based geometric evaluation techniques. This practice seems antiquated in times were digital daylight simulation tools are available and accessible (Saratsis, Dogan, & Reinhart, 2016). In this context, the proposed analysis framework may be a useful tool to optimize high-density urban design proposals for daylight sufficiency or may be used by city planners to establish evidence-based daylight zoning laws for residential neighborhoods. However, several questions arise concerning the urban application of the introduced framework. Significant impact on daylight performance is expected from decisions that are made during the early, massing model design phase, in which architects and planners determine the proportions of building volumes, spacing, and street widths. In this phase, many aspects of the building architecture, such as the floor plan and the design of the façade, are unknown. This is a challenge for daylight modelers, since both aspects have a significant effect on how daylight penetrates a building. To provide some guidance in these situations, the authors repeated the simulations for the previously described 475 apartments but removed all partition walls within a unit. On average, this yields a 20% increase in RDA and DLA scores, as shown in Table 4. Results obtained by such simulations
Proceedings of the 15th IBPSA ConferenceSan Francisco, CA, USA, Aug. 7-9, 2017
395
should be understood as maximum potential, since simulations further down the design process will likely report lower performances as partitions within units are introduced.
Table 4: Change in the average RDA and DLA scores: With vs. without interior partitions
Partitions No Partitions Change [%] RDA 8.5 10.1 19% DLA 7.5 9.0 20% RDS 16.0 19.0 19%
Another approach is to increase the target thresholds to provide modelers with a more realistic prediction of the performance levels that can be expected once the floor plan layout is introduced. One methodology to achieve
this could be to “match” the average scores with and without partitions and walls. Increasing the area threshold for RDA from 60% to 100%, as well as raising the direct sunlight exposure hours from 2 to 2.5, achieves this. Figure 8 C shows a histogram of RDS for the detailed model geometry and the adjusted RDS for geometry without interior subdivisions.
Oversupply The RDEF is a purely supply-focused analysis metric and does not capture any notion of oversupply. A critical reader may state that a new daylight assessment framework should be able to inform modelers in both over- and undersupply cases. However, a clear definition of an upper illuminance threshold that indicates discomfort remains difficult to establish due to user subjectivity (IESNA, 2012) (Van Den Wymelenberg &
Figure 7: (A) Spatial plot of RDA[300lx,50%time] and DLA for Building (6 B) Fl. 1 and Fl. 7, annual. (B) Spatial plot of RDA[300lx,50%time] and DLA for Building (6 E) Fl. 5, summer and winter.
Figure 8: (A) RDA score distribution for all units, (B) DLA score distribution for all units, (C) RDS score distribution for detailed simulations (with interior partitions) and urban simulations (no interior partitions) using the targets of
60% area / 2hr and 100% area / 2.5 hr respectively.
Proceedings of the 15th IBPSA ConferenceSan Francisco, CA, USA, Aug. 7-9, 2017
396
Inanici, 2009). Hence, there is “considerable uncertainty” regarding upper thresholds for “both non-domestic and residential buildings” (Mardaljevic, Andersen, Roy, & Christoffersen, 2011) Additionally, it is assumed that daylight oversupply can be mitigated at the façade level with simple measures such as blinds, curtains or shutters, whereas daylight undersupply due to morphological properties of a design cannot be overcome once a design is built. This assumption, however, leads to the question of whether it is appropriate for certain climates to place such a strong emphasis on the availability of direct light. The current test cases are predominantly located in cold or temperate European sites. In such climates, it is safe to assume that most people would perceive access to direct light as a desirable amenity. In hot and arid climates, where people tend to favor protection from the sun, it might not be justified to optimize dwellings for direct solar access and thereby expose the public outdoor areas, such as streets and alleys, which would otherwise be shaded by buildings. In such climates, different targets need to be defined, and further research should be conducted to determine them.
Conclusion This paper introduced a new daylighting analysis framework for residential architecture. It captures relevant residential daylighting aspects, such as diurnal and seasonal availability, as well as access to direct light; furthermore, it offers a performance score that allows modelers to compare performance across multiple apartments. The framework provides several levels of detail that range from a simple score for performance comparison to spatial plots that allow modelers to understand and optimize the daylighting characteristics of a space.
Acknowledgement The authors would like to thank the Cornell University David R. Atkinson Center for a Sustainable Future for funding this research as well as NVIDIA for supporting the project with a hardware grant.
References Aghemo, C., & Pellegrino, A. (1997). Indoor daylighting:
assessment of the performances of different window options. In Proceedings of the Clima 2000 Conference (Vol. 30). Napoli. Retrieved from http://www.inive.org/members_area/medias/ pdf/inive/clima2000/1997/p100.pdf
Altan, H., Mohelnikova, J., & Hofman, P. (2015). 6th International Building Physics Conference, IBPC 2015Thermal and Daylight Evaluation of Building Zones. Energy Procedia, 78, 2784–2789. https://doi.org/10.1016/j.egypro.2015.11.626
Athienitis, A. K., & Tzempelikos, A. (2002). A methodology for simulation of daylight room illuminance distribution and light dimming for a room with a controlled shading device. Solar Energy,
72(4), 271–281. https://doi.org/10.1016/ S0038-092X(02)00016-6
Barnaby, C. S., & Crawley, D. B. (2011). Weather data for building performance simulation. Building Performance Simulation for Design and Operation, 37–55.
Chartered Institution of Building Services Engineers, CIBSE. (2013). Lighting for Communal Residential Buildings - LG9.
Compagnon, R. (2004). Solar and daylight availability in the urban fabric. Energy and Buildings, 36(4), 321–328.
Corrodi, M., & Spechtenhauser, K. (2008). Illuminating: Natural Light in Residential Architecture. Basel : London: Birkhäuser GmbH.
DIVA. (2016). (Version 4). Solemma LLC. Retrieved from http://solemma.net
Dogan, T., Reinhart, C., & Michalatos, P. (2012). Urban daylight simulation: Calculating the daylit area of urban designs. Proceedings of SimBuild. Retrieved from https://stuff.mit.edu/afs/sipb/user/mkgray/bar/afs/athena/dept/cron/project/sustainabledesignlab/publications/SimBuild2012_UrbanDaylightSimulation.pdf
Dogan, T., & Stec, P. (2016). Prototyping a façade-mounted, dynamic, dual-axis daylight redirection system. Lighting Research and Technology.
FMI Corporation. (2015). U.S. Markets Construction Overview 2016. FMI Corporation.
Franzetti, C., Fraisse, G., & Achard, G. (2004). Influence of the coupling between daylight and artificial lighting on thermal loads in office buildings. Energy and Buildings, 36(2), 117–126. https://doi.org/ 10.1016/j.enbuild.2003.10.005
German Institute for Standardization, DIN. (1999). DIN 5034-1 Daylight in interiors - Part 1: general requirements.
Gherri, B. (2015). Assessment of Daylight Performance in Buildings: Methods and Design Strategies. WIT Press.
Heschong Mahone Group, Inc. (n.d.). DAYLIGHT METRICS PIER Daylighting Plus Research Program. Heschong Mahone Group, Inc.
Illuminating Engineering Society of North America, IESNA. (2012). LM-83-12 IES Spatial Daylight Autonomy (sDA) and Annual Sunlight Exposure (ASE). New York, NY, USA: IESNA Lighting Measurement.
Illuminating Engineering Society of North America, IESNA & Rea, M. S. (Eds.). (2000). IESNA Lighting Handbook (9 edition). Illuminating Engineering.
Li, D. H. W., & Lam, J. C. (2000). Measurements of solar radiation and illuminance on vertical surfaces and daylighting implications. Renewable Energy, 20(4),
Proceedings of the 15th IBPSA ConferenceSan Francisco, CA, USA, Aug. 7-9, 2017
397
389–404. https://doi.org/10.1016/S0960-1481(99)00126-3
Lockley, S. W. (2009). Circadian Rhythms: Influence of Light in Humans A2 - Squire, Larry R. In Encyclopedia of Neuroscience (pp. 971–988). Oxford: Academic Press. Retrieved from http:// www.sciencedirect.com/science/article/pii/B9780080450469016193
Mardaljevic, J., Andersen, M., Roy, N., & Christoffersen, J. (2011). Daylighting metrics for residential buildings. In Proceedings of the 27th Session of the CIE. Retrieved from http:// infoscience.epfl.ch/record/166212
Mötzl, H., & Fellner, M. (2011). Environmental and health related criteria for buildings. Austrian Institute for Healthy and Ecological Building, by Request from ANEC-Raising Standards for Consumers, Wien. Retrieved from http:// www.ibo.at/documents/EnvironmentalCriteriaBuilding_IBOforANEC_31march2011_000.pdf
Neufert, E., & Neufert, P. (2012). Neufert Architects’ Data, Fourth Edition (4 edition). Chichester, West Sussex, UK ; Ames, Iowa: Wiley-Blackwell.
Raphael, B. (2011). Active control of daylighting features in buildings. Computer-Aided Civil and Infrastructure Engineering, 26(5), 393–405.
Reinhart, C. F., Mardaljevic, J., & Rogers, Z. (2006). Dynamic daylight performance metrics for sustainable building design. Leukos, 3(1), 7–31.
Robbins, C. L. (1986). Daylighting: design and analysis. New York: Van Nostrand Reinhold Company.
Rockcastle, S., & Andersen, M. (2013). Celebrating contrast and daylight variability in contemporary architectural design: A typological approach. Proceedings to LUX EUROPA, Krakow, Poland. Retrieved from http://infoscience.epfl.ch/record/ 186396/files/LUX%20EUROPA%202013_Rockcastle%20%20Andersen_FINAL.pdf
Sabry, H., Sherif, A., Gadelhak, M., & Aly, M. (2014). Balancing the daylighting and energy performance of solar screens in residential desert buildings: Examination of screen axial rotation and opening aspect ratio. Solar Energy, 103, 364–377. https://doi.org/10.1016/j.solener.2014.02.025
Saratsis, E., Dogan, T., & Reinhart, C. F. (2016). Simulation-based daylighting analysis procedure for developing urban zoning rules. Building Research & Information, 0(0), 1–14. https://doi.org/10.1080/ 09613218.2016.1159850
Schneider F, & Heckmann O (2011). Floor Plan Manual (4 Revised and Extended Edition). Birkhauser.
Strømann-Andersen, J., & Sattrup, P. A. (2011). The urban canyon and building energy use: Urban density versus daylight and passive solar gains. Energy and Buildings, 43(8).
Tregenza, P., & Wilson, M. (2013). Daylighting: Architecture and Lighting Design (1 edition). Routledge.
U.S. Green Building Council. (2013a). LEED v4 for Building Design and Construction.
U.S. Green Building Council. (2013b). LEED v4 for Homes Design and Construction.
Van Den Wymelenberg, K., & Inanici, M. (2009). A study of luminance distribution patterns and occupant preference in daylit offices. Proceedings of the Passive and Low Energy Architecture PLEA. Retrieved from http://faculty.washington.edu/ inanici/Publications/Luminance_Preference_03062009.pdf
Ward, G. (2016). Radiance (Version 5). Retrieved from https://www.radiance-online.org/
Webb, A. R. (2006). Considerations for lighting in the built environment: Non-visual effects of light. Energy and Buildings, 38(7), 721–727.