Embed Size (px)
Citation preview
A New Model Law for A New Model Law for Vital StatisticsVital Statistics
National Center for Health Statistics
Division of Vital Statistics
Model law revisionModel law revision
Model State Vital Statistics Act and Regulations:
• Provides detailed guidance to States that are considering revision of their own State vital statistics laws and regulations.
• Promotes uniformity among states in definitions, registration practices, disclosure and issuance procedures, and in the many other functions that comprise a state system of vital statistics.
• Initially established in 1907, has been revised in 1941, 1959, 1977, 1992
http://www.cdc.gov/nchs/nvss/model_law_revision.htm
Why update?Why update?
• Security
• Electronic environment
• Assisted reproduction
• Confidentiality and disclosure
• Establishing new records of live birth
• Same-sex marriage
• COOP (Continuity of Operations Planning)
Model law revision work groupModel law revision work group
Chairperson• Alvin T. Onaka, Ph.D., Hawaii Department of Health
Members
• Catherine Molchan Donald, Alabama Department of Public Health
• Karen R. Hampton, J.D., Oregon Department of Human Services
• Ronald Hyman, Colorado Department of Public Health and Environment
• Wilfredo Lopez, J.D., General Counsel Emeritus, New York City Department of Health and Mental Hygiene
• Patricia W. Potrzebowski, Ph.D., Formerly, Pennsylvania Department of Health; Executive Director, NAPHSIS
• Steven Schwartz, Ph.D., New York City Department of Health and Mental Hygiene
• Linette T. Scott, M.D., M.P.H., California Department of Public Health
Model law revision work groupModel law revision work group
Centers for Disease Control and Prevention National Center for Health Statistics, Division of Vital Statistics, Registration Methods Staff
• Judy M. Barnes
• Julia L. Kowaleski
• George C. Tolson
• Dewey LaRochelle
Centers for Disease Control and Prevention
• Deborah Tress, J.D.Office of General Counsel
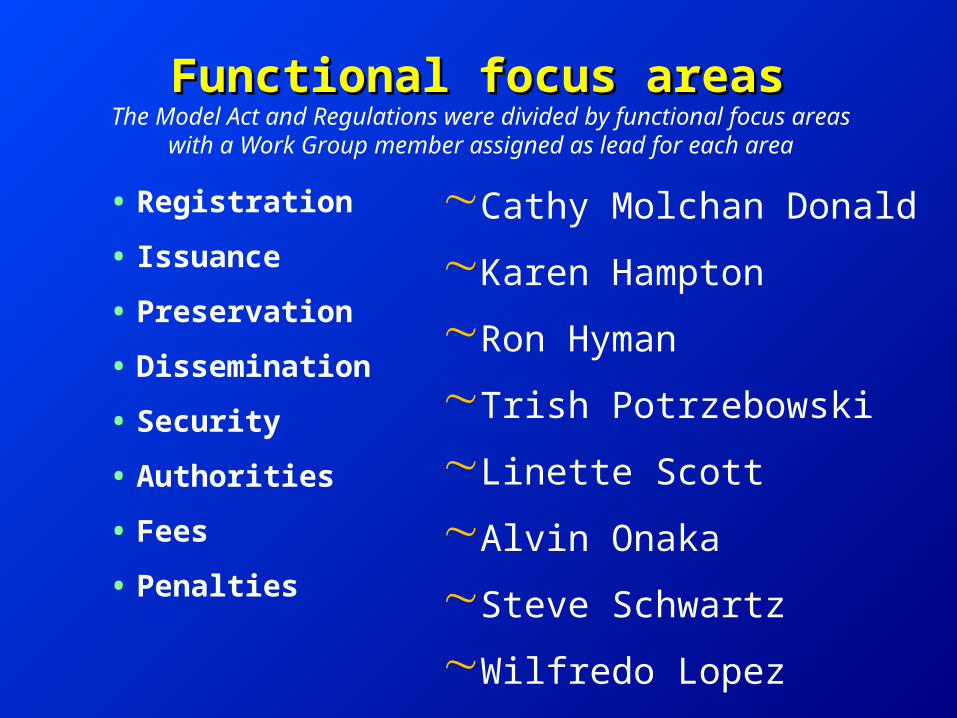
Functional focus areasFunctional focus areas
• Registration
• Issuance
• Preservation
• Dissemination
• Security
• Authorities
• Fees
• Penalties
Cathy Molchan Donald
Karen Hampton
Ron Hyman
Trish Potrzebowski
Linette Scott
Alvin Onaka
Steve Schwartz
Wilfredo Lopez
The Model Act and Regulations were divided by functional focus areas with a Work Group member assigned as lead for
each area
ObjectivesObjectives
• Implementation of revised Model Law and Regulations in jurisdictions
• Improved uniformity of process
• Use as a resource to support justifications for actions in the jurisdictions regarding the vital records system
Legislative researchLegislative research
• Assisted reproductive technology
• Adoption laws
• Electronic records and signatures
• Aspect of breach of confidentiality
• Same-sex parentage
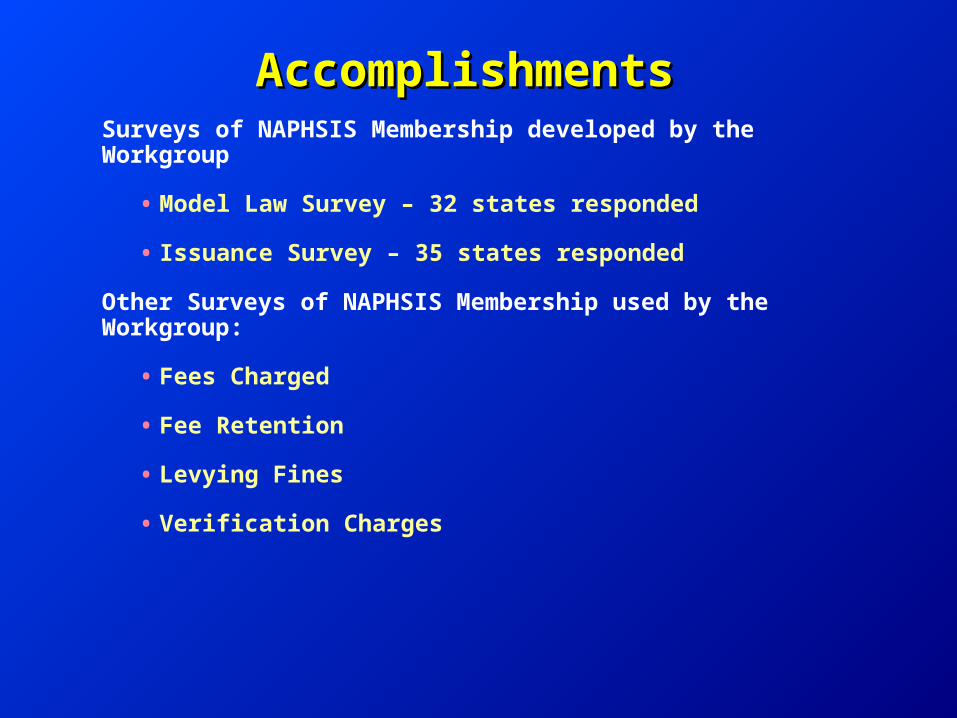
Accomplishments Accomplishments Surveys of NAPHSIS Membership developed by the Workgroup
• Model Law Survey – 32 states responded
• Issuance Survey – 35 states responded
Other Surveys of NAPHSIS Membership used by the Workgroup:
• Fees Charged
• Fee Retention
• Levying Fines
• Verification Charges
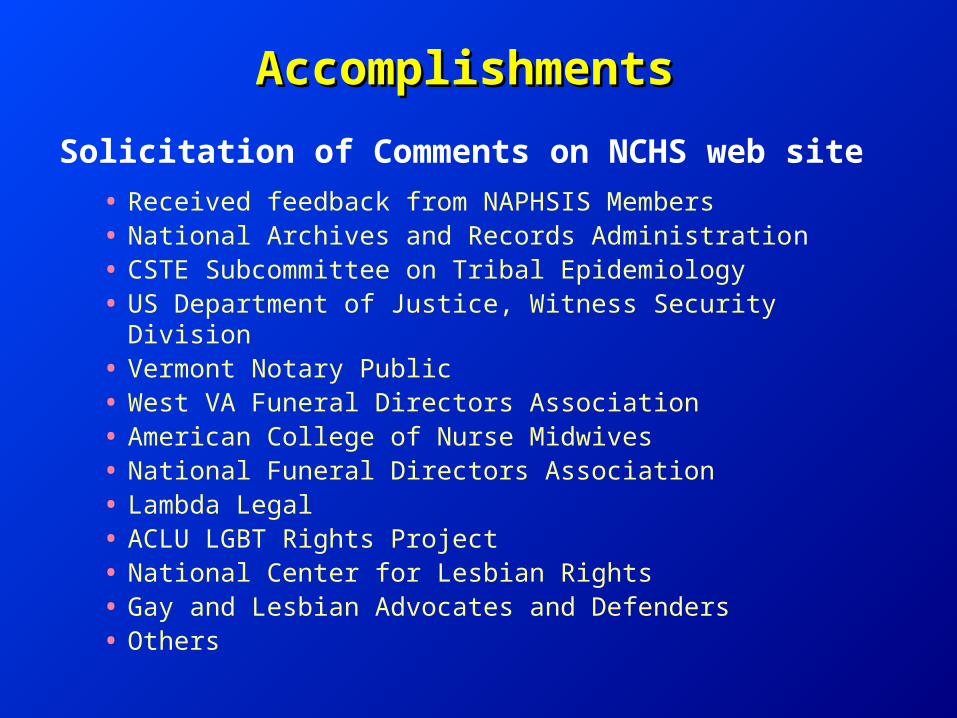
Accomplishments Accomplishments
Solicitation of Comments on NCHS web site
• Received feedback from NAPHSIS Members• National Archives and Records Administration• CSTE Subcommittee on Tribal Epidemiology• US Department of Justice, Witness Security Division• Vermont Notary Public• West VA Funeral Directors Association• American College of Nurse Midwives• National Funeral Directors Association• Lambda Legal• ACLU LGBT Rights Project• National Center for Lesbian Rights• Gay and Lesbian Advocates and Defenders• Others

Accomplishments Accomplishments
2009/2010 NAPHSIS/VSCP Joint Meetings
• Presentations
• Roundtables
• Town Hall
Workgroup Meetings began in 2009
• April, July, September, November 2009
• January, April , July, September, November 2010
• March, May 2011

Accomplishments Accomplishments
October/November 2010 Workgroup Webinars
•Total of 8
•December 23, 2010 – Draft Model Law sent to NAPHSIS Membership

Accomplishments Accomplishments
January Webinars with NAPHSIS–Purpose
•Provided background on development process for Draft Model Law & Regulations
•Provided overview of changes
•Answered clarifying questions
Comments on draft were due from NAPHSIS Members February 11, 2011
Statistical Uses of Vital Records Statistical Uses of Vital Records DataData
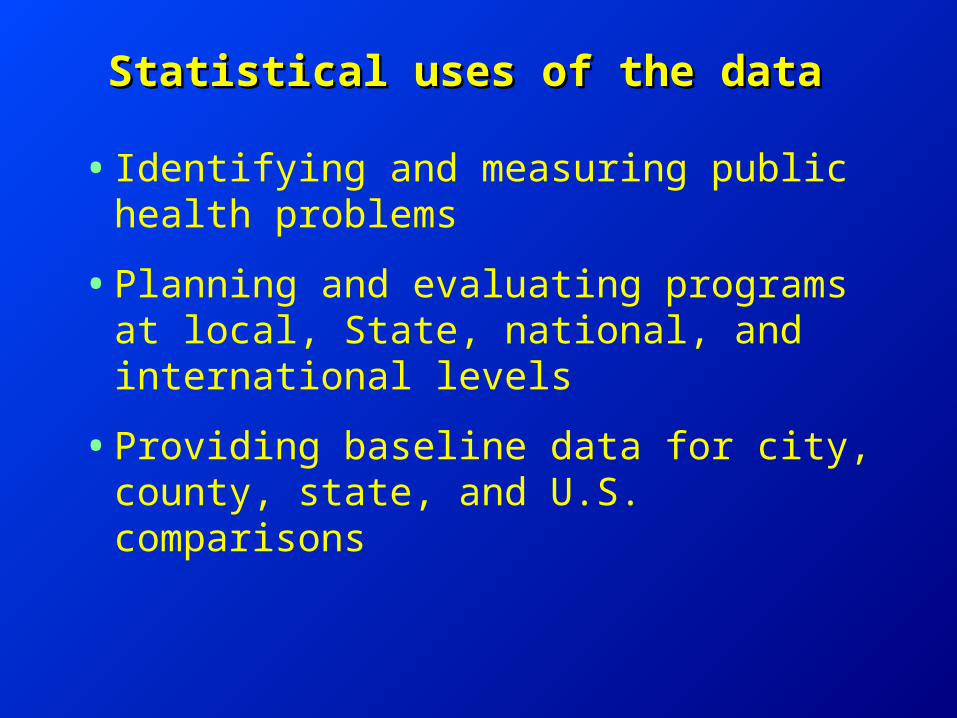
• Identifying and measuring public health problems
•Planning and evaluating programs at local, State, national, and international levels
•Providing baseline data for city, county, state, and U.S. comparisons
Statistical uses of the data Statistical uses of the data
Uses of natality dataUses of natality data
Population composition and growth
•Estimate size of population and project increases and decreases
•Influence on economic and social institutions (schools, labor market, commercial uses)
•Life expectancy
•Teenage birth rates
•Births to unmarried mothers
Uses of natality data Uses of natality data
•Adverse birth outcomes
•Low birth weight babies
•Racial differentials
•Multiple births
Uses of natality data Uses of natality data
Natality data used to:Natality data used to:
•Determine need for birthing centers and hospitals
•Target prenatal care to certain populations
•Develop educational programs
•Add warning labels to certain products
• Infant mortality
•Teenage suicide
•Deaths due to violence
•Motor vehicle mortality
•Maternal mortality
Uses of mortality dataUses of mortality data
Mortality data used for:Mortality data used for:
•Allocation of health facilities
•Epidemiological research
•Discovery of emerging problems
Latest available NCHS dataLatest available NCHS data
•Final Birth–2008
•Preliminary Birth–2009
•Final Death–2008
•Preliminary Death-2009
0
520
1040
1560
2080
2600
1900 1910 1920 1930 1940 1950 1960 1970 1980 1990 20000
20
40
60
80
Ag
e in
ye
ars
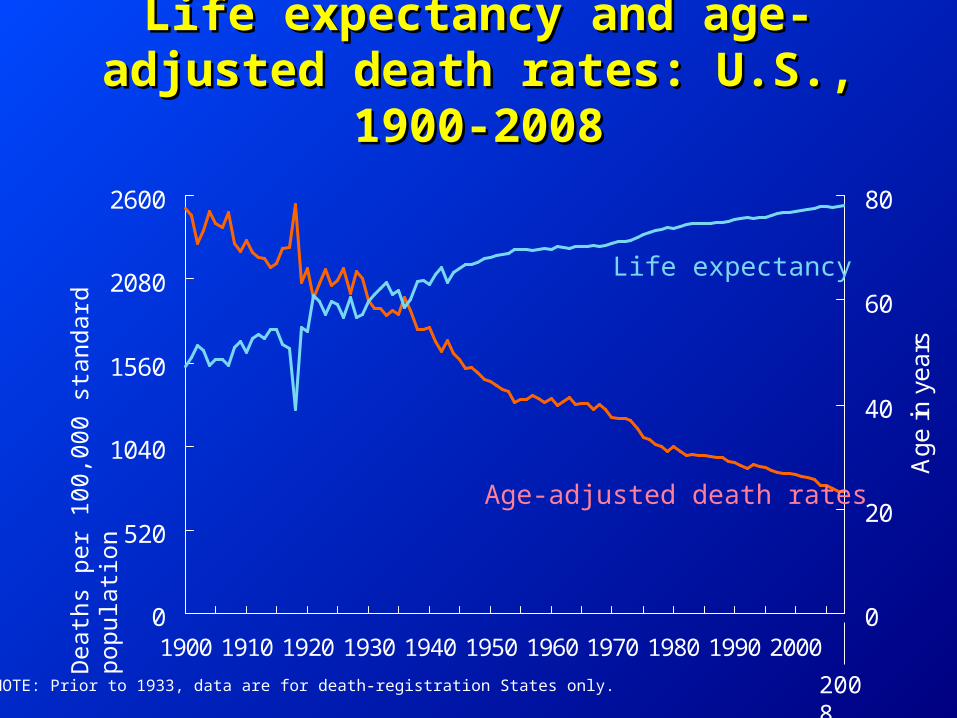
NOTE: Prior to 1933, data are for death-registration States only.
Death
s p
er
100,0
00 s
tan
dard
popula
tion
2008
Life expectancy and age-Life expectancy and age-adjusted death rates: U.S., adjusted death rates: U.S.,
1900-20081900-2008
Life expectancy
Age-adjusted death rates
0
20
40
60
80
100
120
140
160
180
200
0
1
2
3
4
5
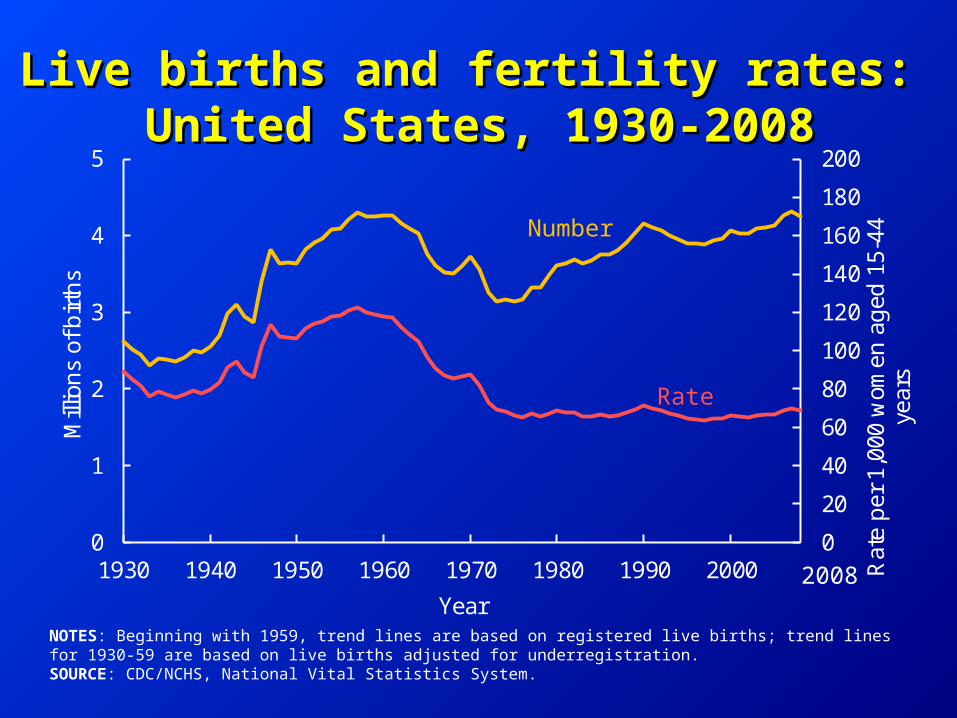
1930 1940 1950 1960 1970 1980 1990 2000 Rat
e p
er 1
,000
wom
en a
ged
15-
44
year
s
Mill
ion
s of
birt
hs
YearNOTES: Beginning with 1959, trend lines are based on registered live births; trend lines for 1930-59 are based on live births adjusted for underregistration.SOURCE: CDC/NCHS, National Vital Statistics System.
2008
Live births and fertility rates: Live births and fertility rates: United States, 1930-2008United States, 1930-2008
Number
Rate
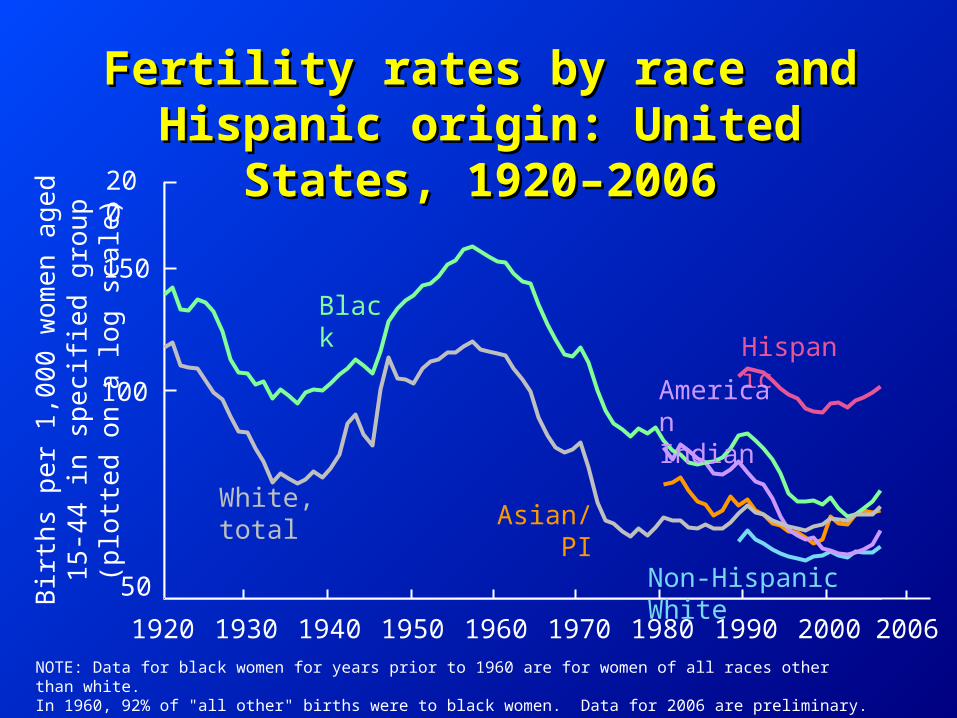
Fertility rates by race and Fertility rates by race and Hispanic origin: United States, Hispanic origin: United States,
1920–20061920–2006
1920
1930
1940
1950
1960
1970
1980
1990
2000
50
Hispanic
Black
White, total
Non-Hispanic White
Asian/PI
NOTE: Data for black women for years prior to 1960 are for women of all races other than white. In 1960, 92% of "all other" births were to black women. Data for 2006 are preliminary.
100
150
200
Bir
ths
per
1,0
00
wom
en
ag
ed
15
-44
in
sp
eci
fied
gro
up
(p
lott
ed
on
a log
sc
ale
)
2006
AmericanIndian
0
10
20
30
40
50
60
1940 1950 1960 1970 1980 1990 2000 2009
Per
cent
unm
arrie
d
0
250
500
750
1000
1250
1500
1750
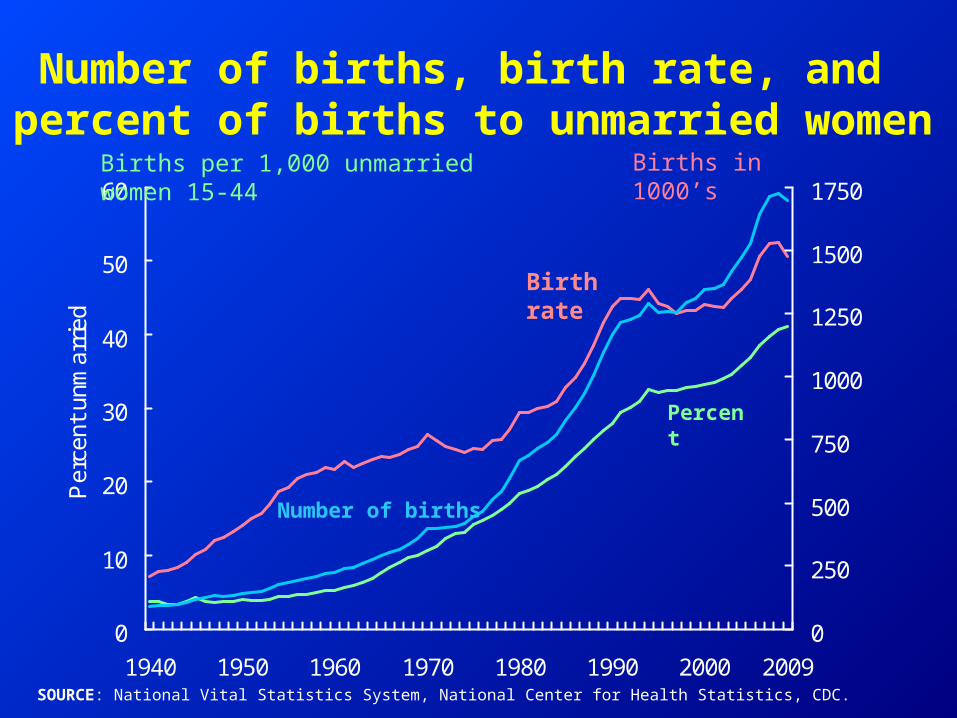
Number of births
Birth rate
Percent
Number of births, birth rate, and percent of births to unmarried women
Births per 1,000 unmarried women 15-44
Births in 1000’s
SOURCE: National Vital Statistics System, National Center for Health Statistics, CDC.
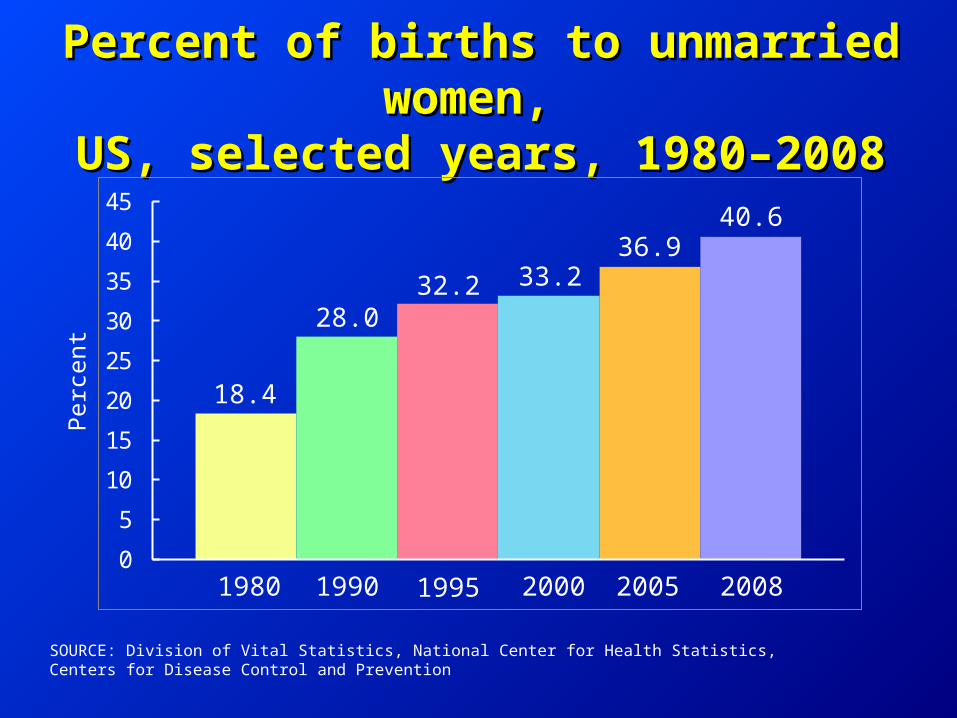
Percent of births to unmarried Percent of births to unmarried women, women,
US, selected years, 1980–2008US, selected years, 1980–2008
0
5
10
15
20
25
30
35
40
45
SOURCE: Division of Vital Statistics, National Center for Health Statistics,Centers for Disease Control and Prevention
1980 1990 1995 2000 2005 2008
18.4
32.2 33.236.9
40.6
28.0
Perc
ent
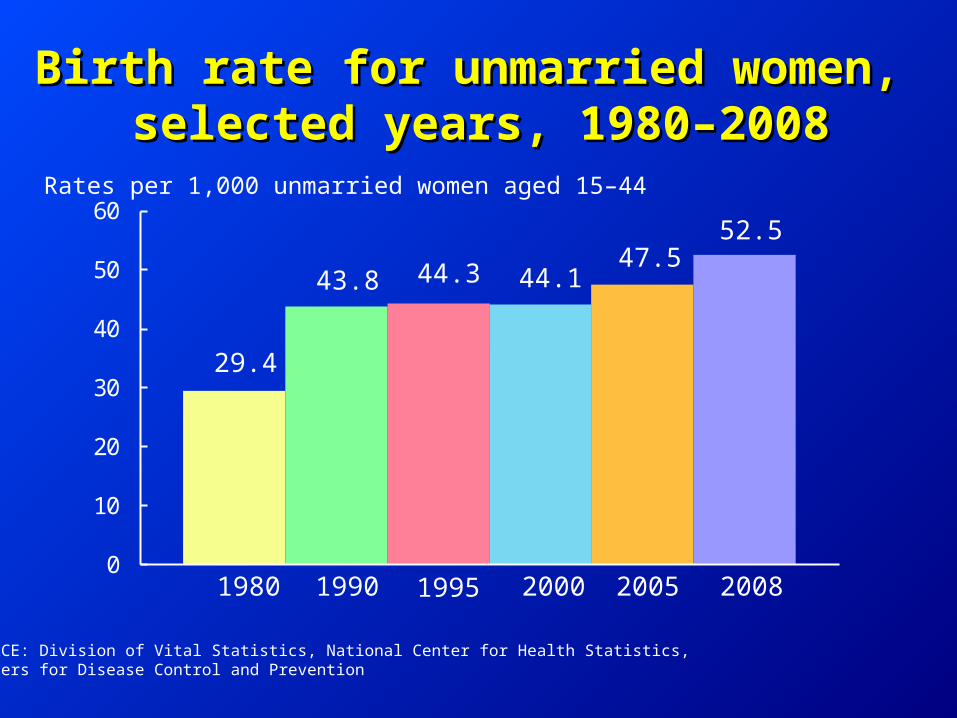
Birth rate for unmarried women, Birth rate for unmarried women, selected years, 1980–2008selected years, 1980–2008
0
10
20
30
40
50
60
SOURCE: Division of Vital Statistics, National Center for Health Statistics,Centers for Disease Control and Prevention
1980 1990 1995 2000 2005 2008
29.4
44.3 44.147.5
52.5
43.8
Rates per 1,000 unmarried women aged 15–44
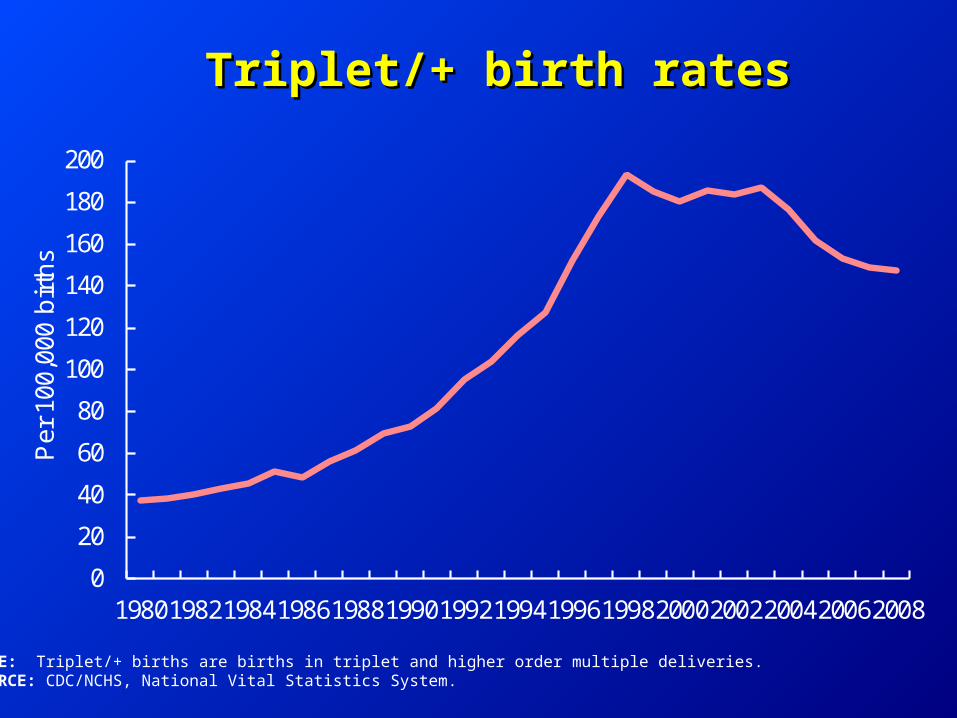
Triplet/+ birth ratesTriplet/+ birth rates
0
20
40
60
80
100
120
140
160
180
200
198019821984198619881990199219941996199820002002200420062008
Per
100
,000
birt
hs
NOTE: Triplet/+ births are births in triplet and higher order multiple deliveries.SOURCE: CDC/NCHS, National Vital Statistics System.
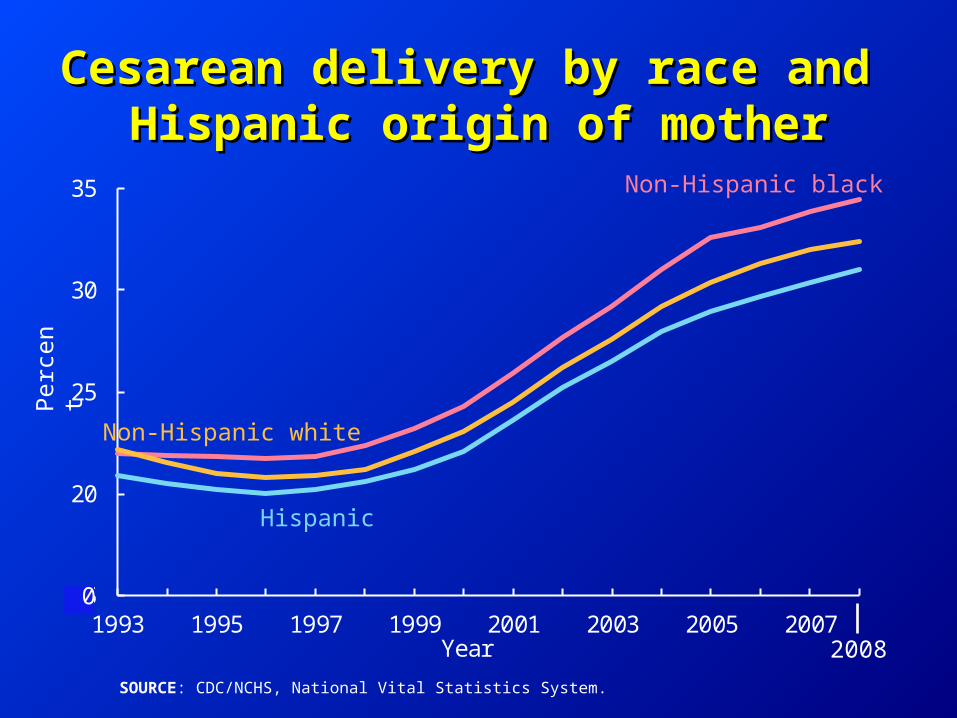
Cesarean delivery by race and Cesarean delivery by race and Hispanic origin of motherHispanic origin of mother
15
20
25
30
35
1993 1995 1997 1999 2001 2003 2005 2007Year
SOURCE: CDC/NCHS, National Vital Statistics System.
Per
cent
Hispanic
Non-Hispanic black
Non-Hispanic white
0
2008
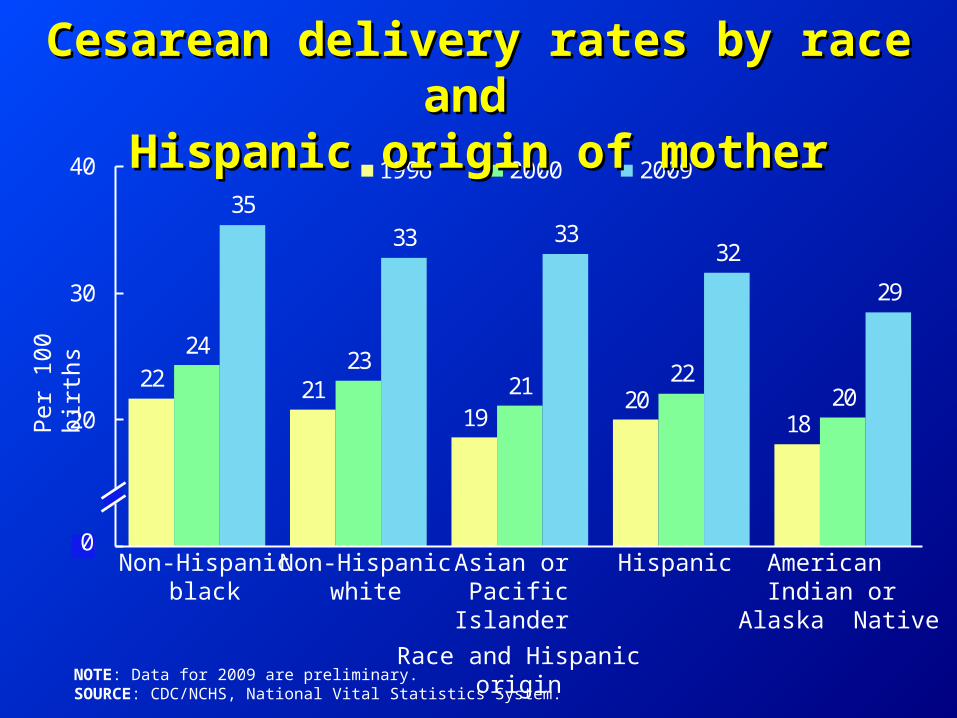
22 2119
2018
2423
21 2220
3533 33
32
29
10
20
30
40 1996 2000 2009
Per
100
birt
hs
NOTE: Data for 2009 are preliminary.SOURCE: CDC/NCHS, National Vital Statistics System.
Race and Hispanic origin
Non-Hispanic black
Hispanic American Indian or
Alaska Native
Asian or Pacific
Islander
Non-Hispanic white
Cesarean delivery rates by race Cesarean delivery rates by race and and
Hispanic origin of motherHispanic origin of mother
0
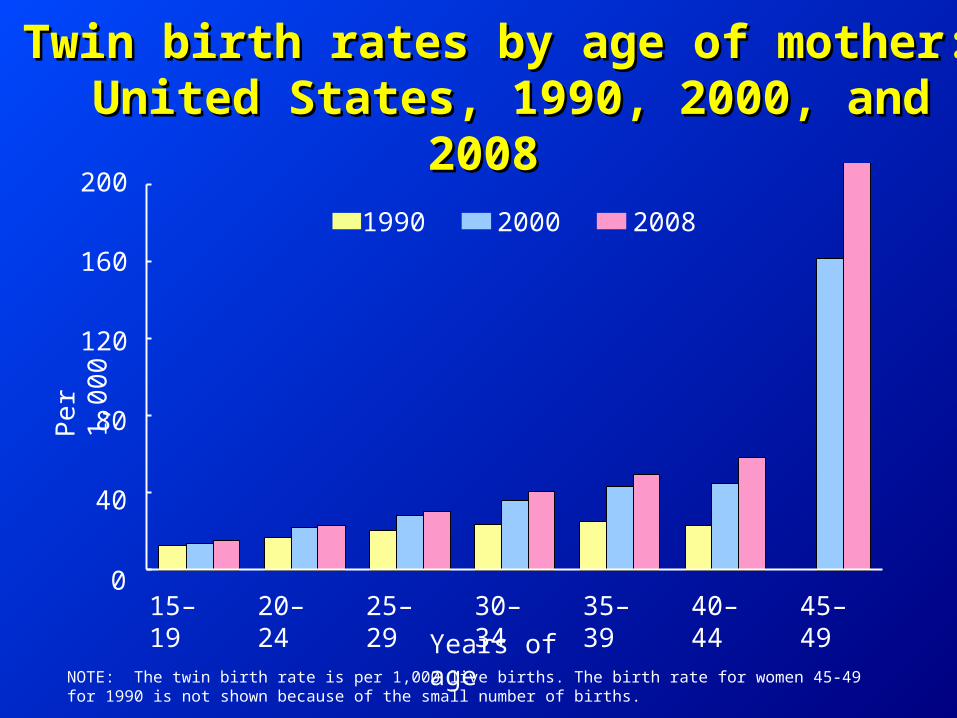
Twin birth rates by age of mother:Twin birth rates by age of mother: United States, 1990, 2000, and 2008 United States, 1990, 2000, and 2008
Per
1,0
00
NOTE: The twin birth rate is per 1,000 live births. The birth rate for women 45-49 for 1990 is not shown because of the small number of births.
Years of age
0
40
80
120
160
200
15–19
20–24
25–29
30–34
35–39
40–44
45–49
1990 2000 2008
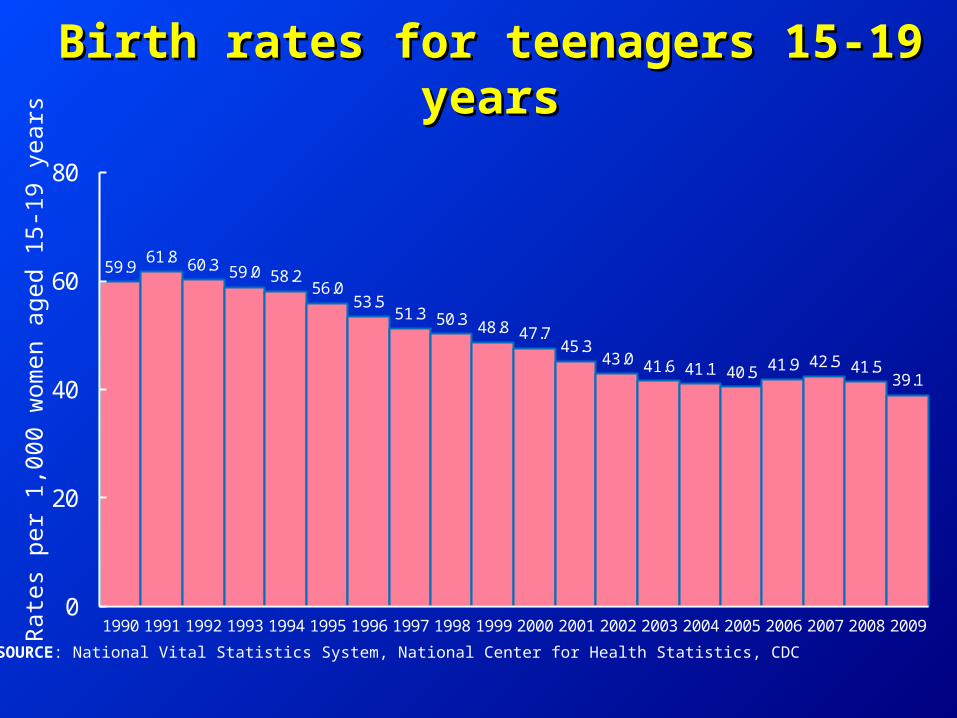
Birth rates for teenagers 15-19 Birth rates for teenagers 15-19 yearsyears
59.961.8 60.3 59.0 58.2
56.053.5
51.3 50.3 48.8 47.745.3
43.0 41.6 41.1 40.5 41.9 42.5 41.539.1
0
20
40
60
80
1990 1991 1992 1993 1994 1995 1996 1997 1998 1999 2000 2001 2002 2003 2004 2005 2006 2007 2008 2009
SOURCE: National Vital Statistics System, National Center for Health Statistics, CDC
Rat
es p
er 1
,000
wom
en a
ged
15-1
9 ye
ars
MT
WY
ID
WA
OR
NV
UT
CA
AZ
ND
SD
NE
CO
NM
TX
OK
KS
AR
LA
MO
IA
MN
WI
IL IN
KY
TN
MS AL GA
FL
SC
NC
VAWV
OH
MI
NY
PA
MDDE
NJ
CT RI
MA
ME
VTNH
AK
HI
DC
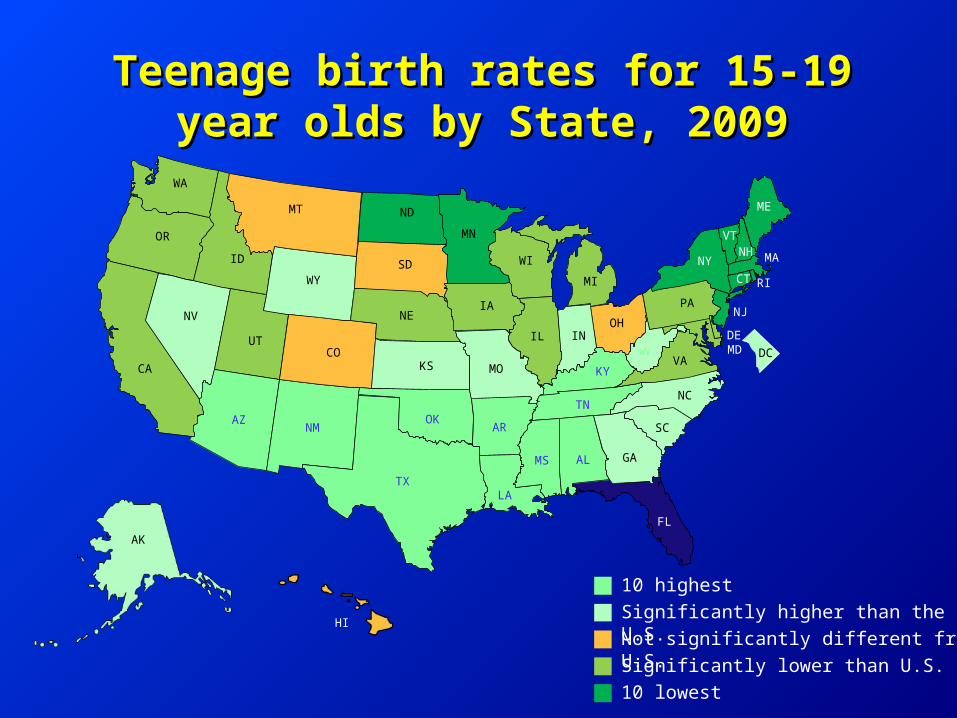
Teenage birth rates for 15-19 Teenage birth rates for 15-19 year olds by State, 2009year olds by State, 2009
Significantly higher than the U.S.10 highest
Not significantly different from U.S.Significantly lower than U.S.10 lowest
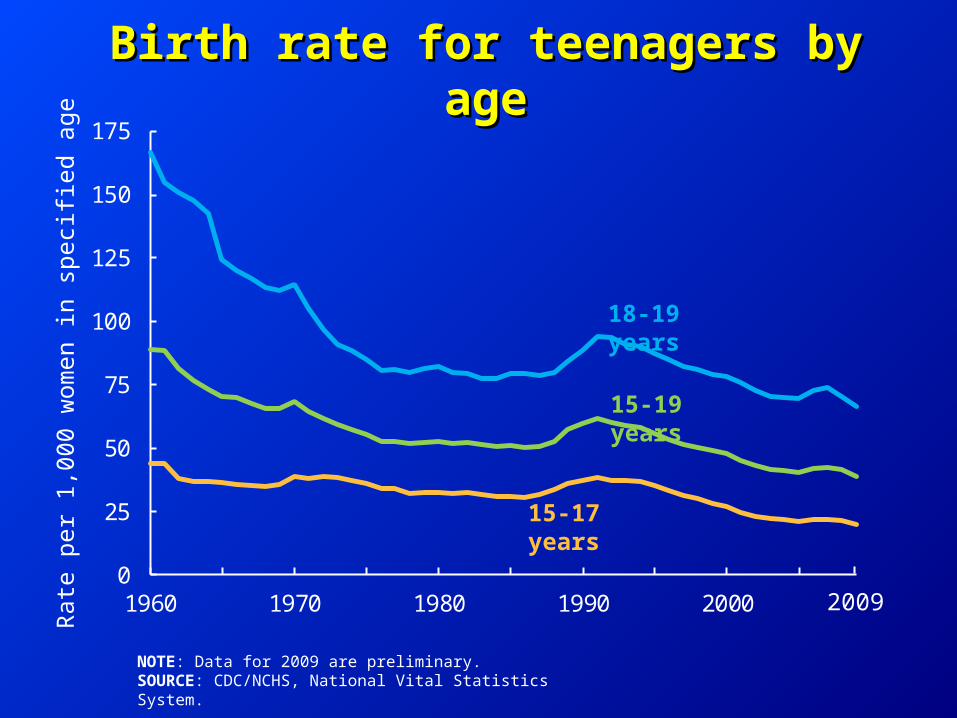
0
25
50
75
100
125
150
175
1960 1970 1980 1990 2000
NOTE: Data for 2009 are preliminary.SOURCE: CDC/NCHS, National Vital Statistics System.
18-19 years
15-19 years
15-17 years
2009
Birth rate for teenagers by Birth rate for teenagers by ageage
Rat
e pe
r 1,
000
wom
en in
spe
cifie
d ag
e
0
20
40
60
80
100
120
140
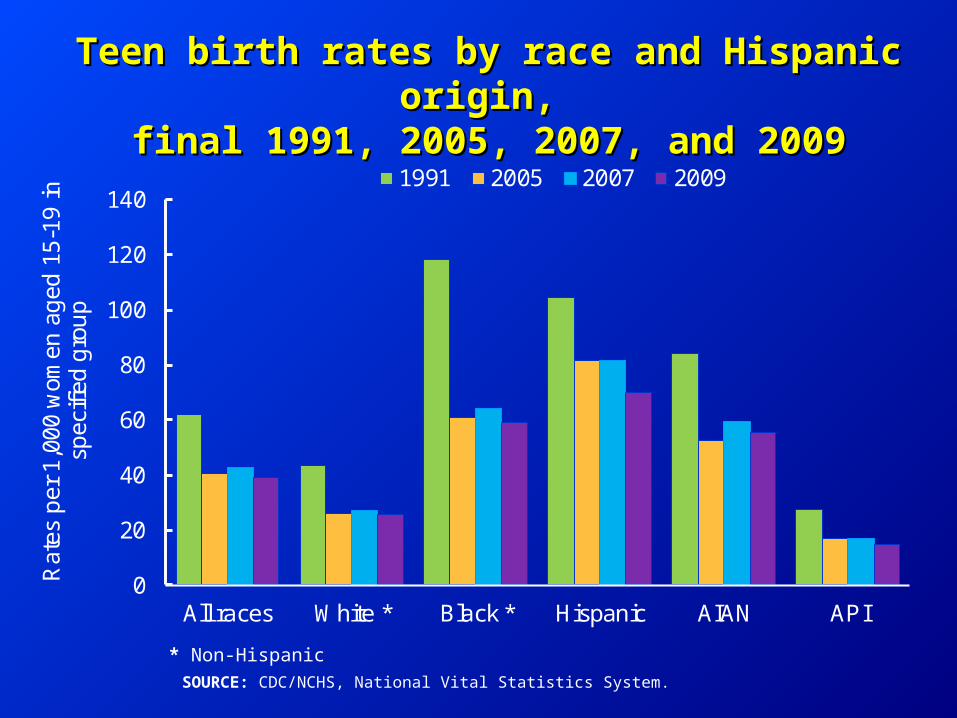
All races White * Black * Hispanic AIAN API
Rat
es p
er 1
,000
wom
en a
ged
15-
19 in
sp
ecifi
ed g
rou
p
1991 2005 2007 2009
* Non-HispanicSOURCE: CDC/NCHS, National Vital Statistics System.
Teen birth rates by race and Hispanic origin, Teen birth rates by race and Hispanic origin, final 1991, 2005, 2007, and 2009final 1991, 2005, 2007, and 2009
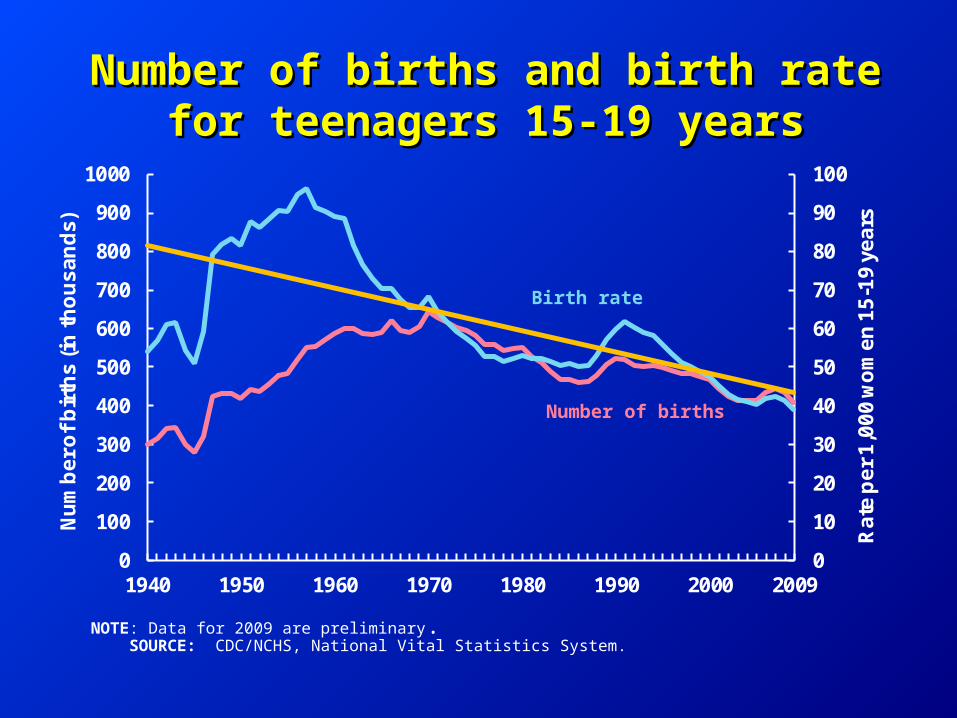
Number of births and birth rate Number of births and birth rate for teenagers 15-19 yearsfor teenagers 15-19 years
0
10
20
30
40
50
60
70
80
90
100
0
100
200
300
400
500
600
700
800
900
1000
1940 1950 1960 1970 1980 1990 2000 2009
Ra
te p
er
1,0
00
wo
me
n 1
5-1
9 y
ea
rs
Nu
mb
er
of
bir
ths
(in
th
ou
sa
nd
s)
SOURCE: CDC/NCHS, National Vital Statistics System.
Number of births
Birth rate
NOTE: Data for 2009 are preliminary.
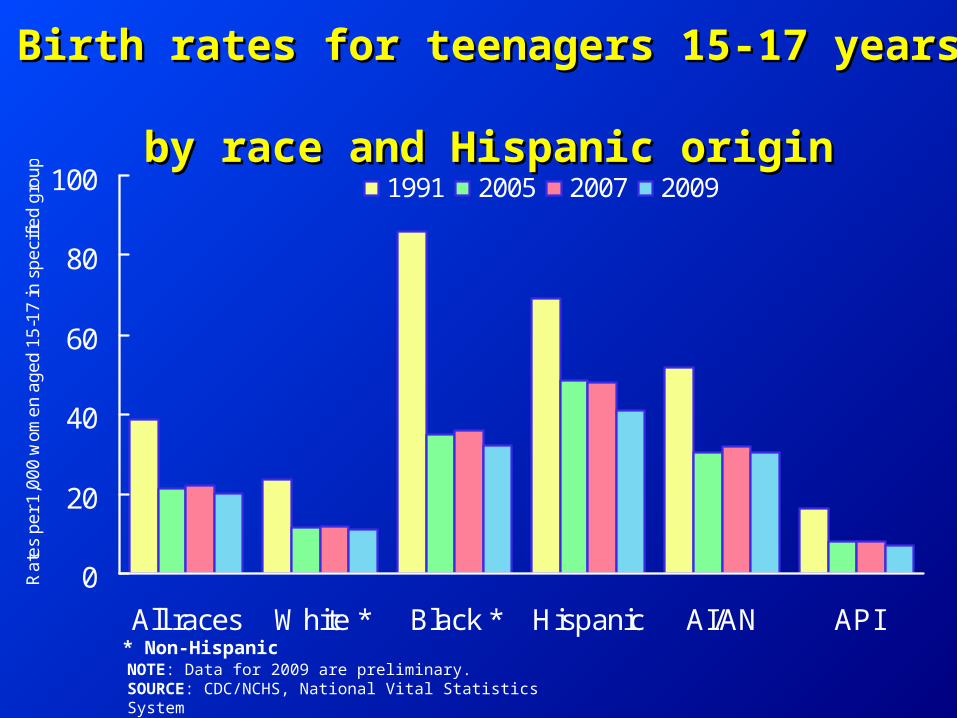
Birth rates for teenagers 15-17 years Birth rates for teenagers 15-17 years by race and Hispanic originby race and Hispanic origin
0
20
40
60
80
100
All races White * Black * Hispanic AI/AN API
Ra
tes
pe
r 1
,00
0 w
om
en
ag
ed
15
-17
in s
pe
cifie
d g
rou
p
1991 2005 2007 2009
* Non-HispanicNOTE: Data for 2009 are preliminary.SOURCE: CDC/NCHS, National Vital Statistics System
MT
WY
ID
WA
OR
NV
UT
CA
AZ
ND
SD
NE
CO
NM
TX
OK
KS
AR
LA
MO
IA
MN
WI
IL IN
KY
TN
MS AL GA
FL
SC
NC
VAWV
OH
MI
NY
PA
MDDE
NJ
CT RI
MA
ME
VTNH
AK
HI
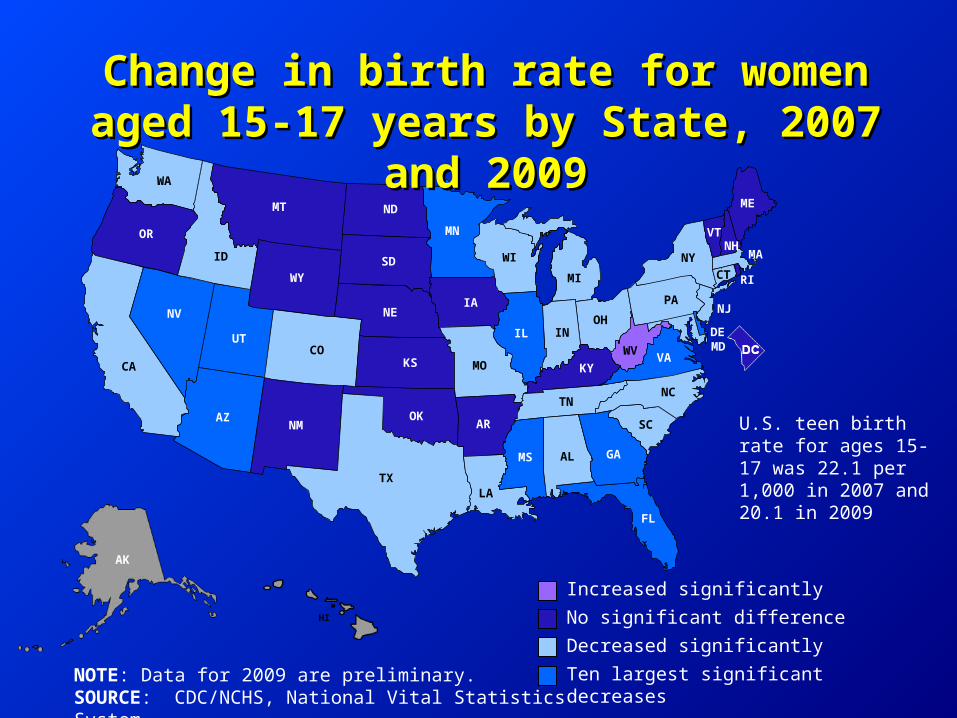
Change in birth rate for women Change in birth rate for women aged 15-17 years by State, 2007 aged 15-17 years by State, 2007
and 2009and 2009
Decreased significantly
Ten largest significant decreases
No significant difference
Increased significantly
NOTE: Data for 2009 are preliminary.SOURCE: CDC/NCHS, National Vital Statistics System.
U.S. teen birth rate for ages 15-17 was 22.1 per 1,000 in 2007 and 20.1 in 2009
MT
WY
ID
WA
OR
NV
UT
CA
AZ
ND
SD
NE
CO
NM
TX
OK
KS
AR
LA
MO
IA
MN
WI
IL IN
KY
TN
MS AL GA
FL
SC
NC
VAWV
OH
MI
NY
PA
MDDE
NJ
CTRI
MA
ME
VTNH
AK
HI
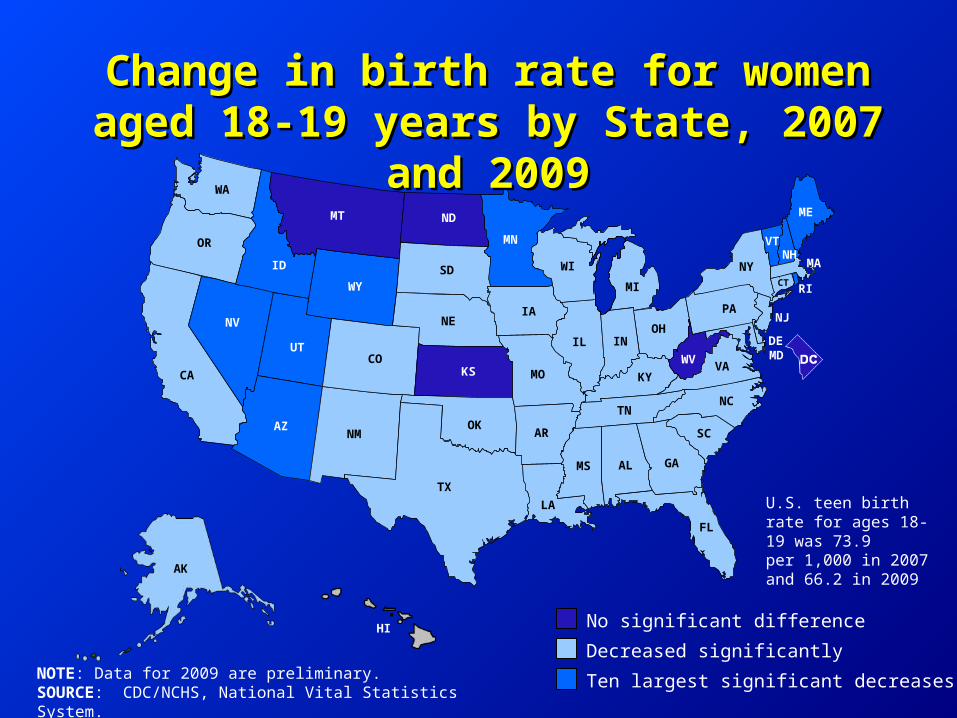
Change in birth rate for women Change in birth rate for women aged 18-19 years by State, 2007 aged 18-19 years by State, 2007
and 2009and 2009
Decreased significantly
Ten largest significant decreases
No significant difference
NOTE: Data for 2009 are preliminary.SOURCE: CDC/NCHS, National Vital Statistics System.
U.S. teen birth rate for ages 18-19 was 73.9 per 1,000 in 2007 and 66.2 in 2009
5
6
7
8
9
10
11
12
13
14
1981 1985 1990 1995 2000 2006 2009
Per
cen
t
Year
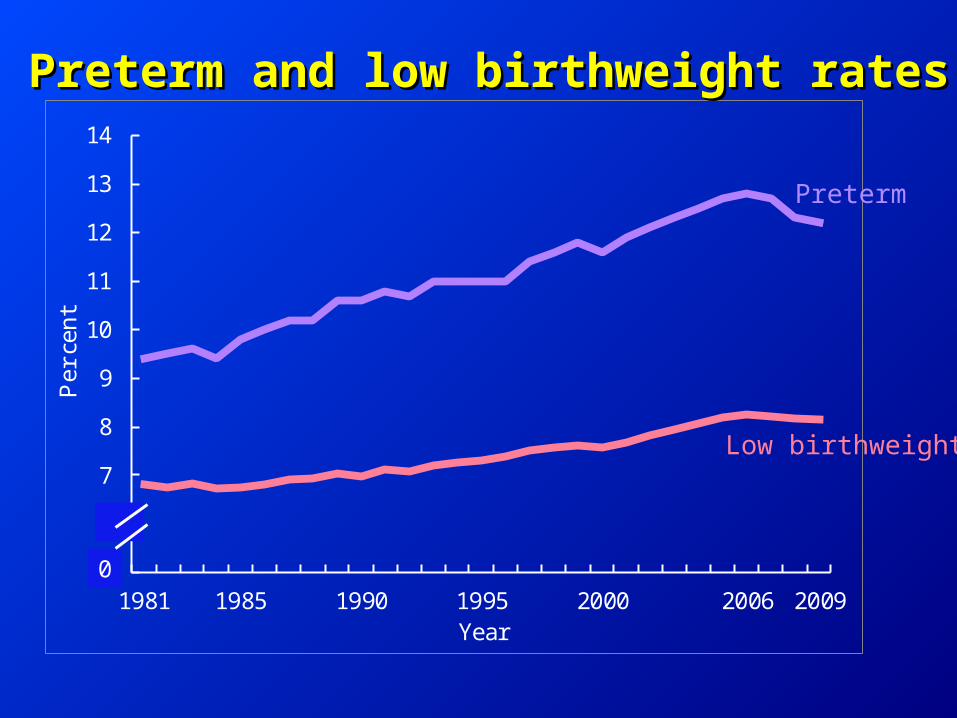
Preterm and low birthweight ratesPreterm and low birthweight rates
Preterm
Low birthweight
0
0
100
200
300
400
500
600
1900 1910 1920 1930 1940 1950 1960 1970 1980 1990 2000 2008
Rat
e per
100,0
00 s
tandar
d p
opula
tion
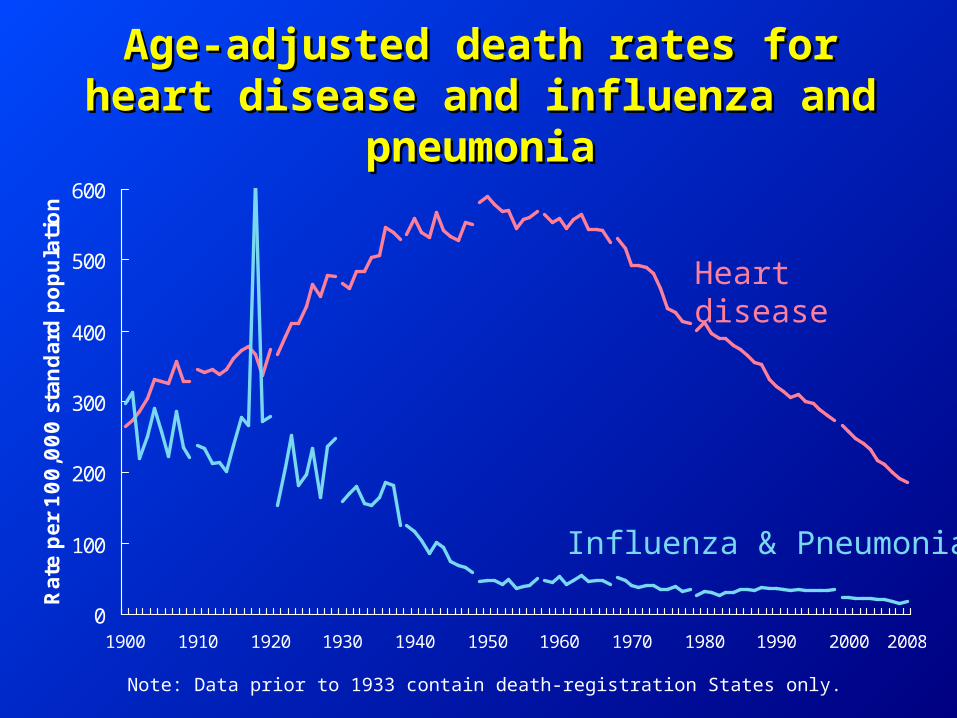
Note: Data prior to 1933 contain death-registration States only.
Heart disease
Influenza & Pneumonia
Age-adjusted death rates for heart Age-adjusted death rates for heart disease and influenza and disease and influenza and
pneumoniapneumonia
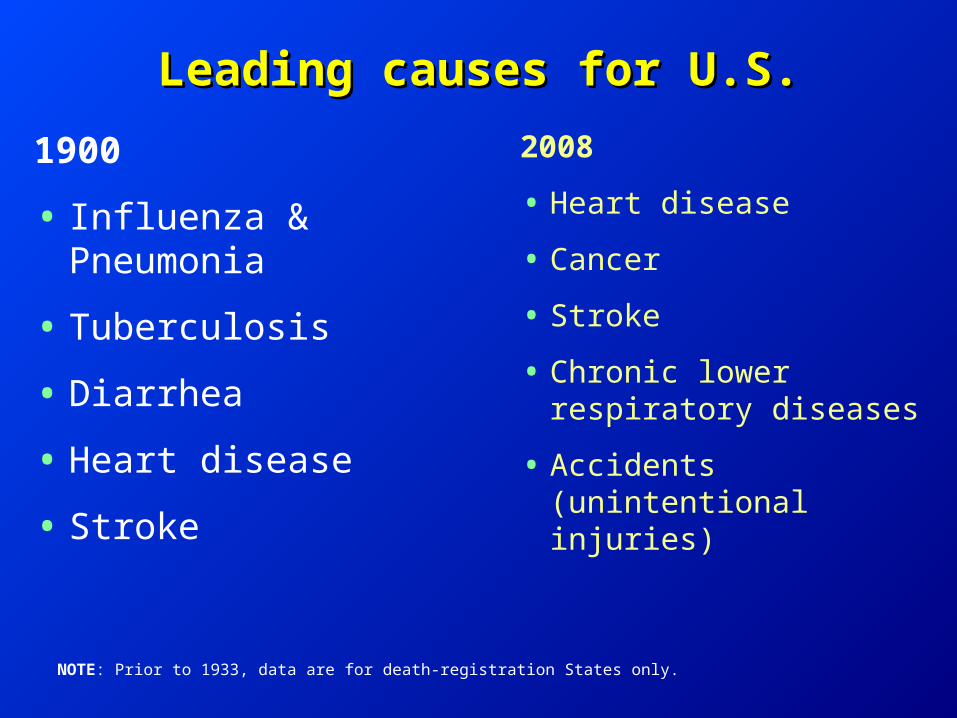
Leading causes for U.S.Leading causes for U.S.
1900
• Influenza & Pneumonia
• Tuberculosis
• Diarrhea
• Heart disease
• Stroke
2008
• Heart disease
• Cancer
• Stroke
• Chronic lower respiratory diseases
• Accidents (unintentional injuries)
NOTE: Prior to 1933, data are for death-registration States only.
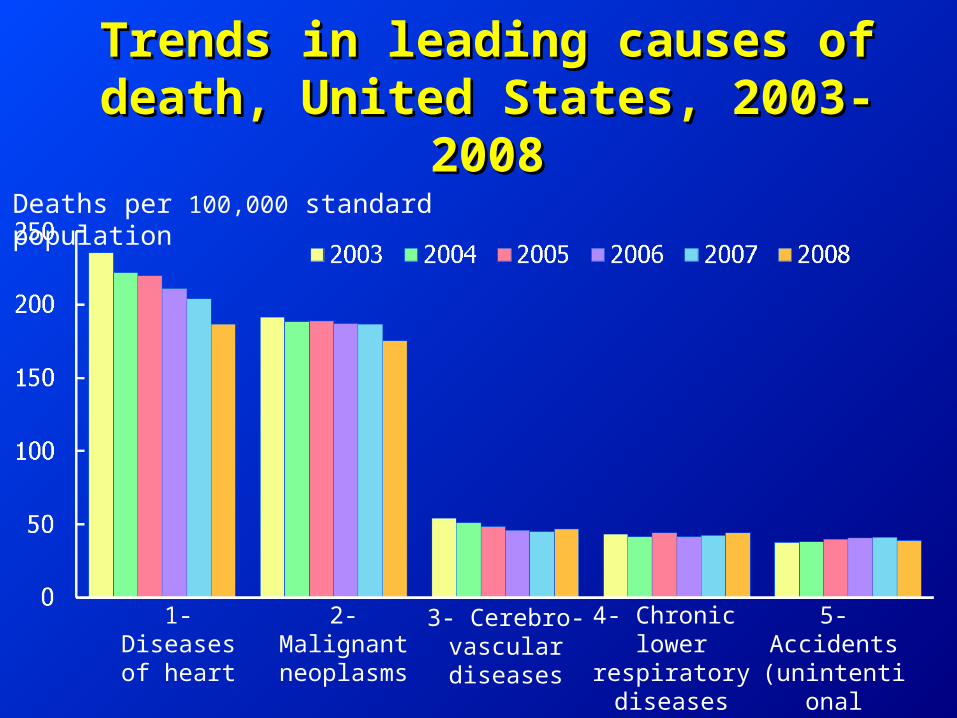
Deaths per 100,000 standard population
1- Diseasesof heart
2- Malignant neoplasms
3- Cerebro-vascular diseases
4- Chronic lower
respiratory diseases
5- Accidents (unintentional
injuries)
Trends in leading causes of Trends in leading causes of death, United States, 2003-death, United States, 2003-
20082008
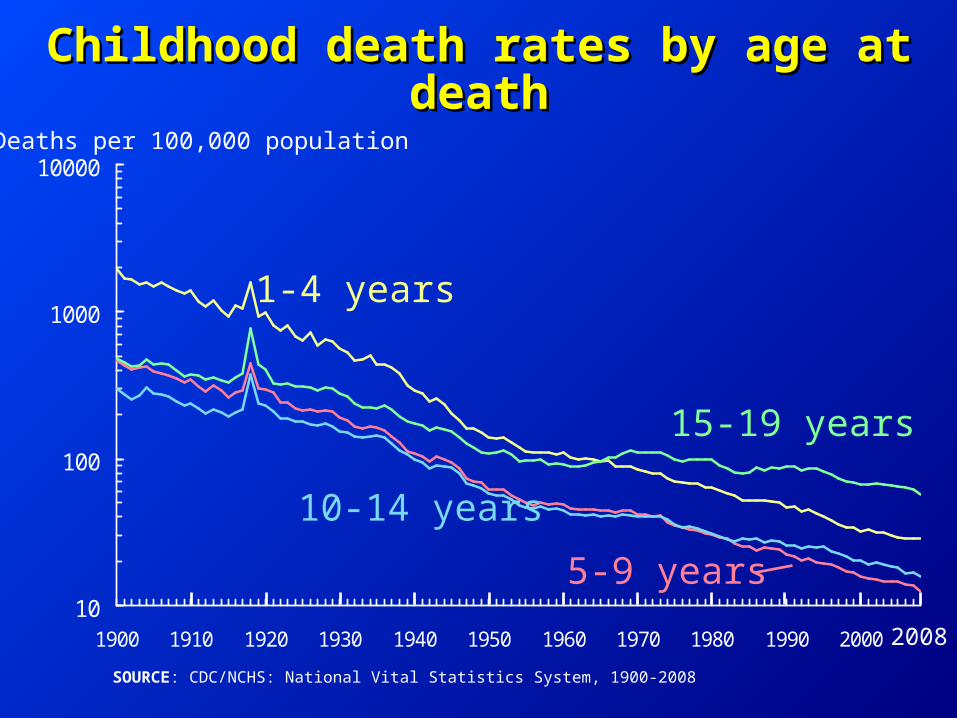
10
100
1000
10000
1900 1910 1920 1930 1940 1950 1960 1970 1980 1990 2000
2008
10-14 years
15-19 years
1-4 years
5-9 years
Childhood death rates by age at Childhood death rates by age at deathdeath
Deaths per 100,000 population
SOURCE: CDC/NCHS: National Vital Statistics System, 1900-2008
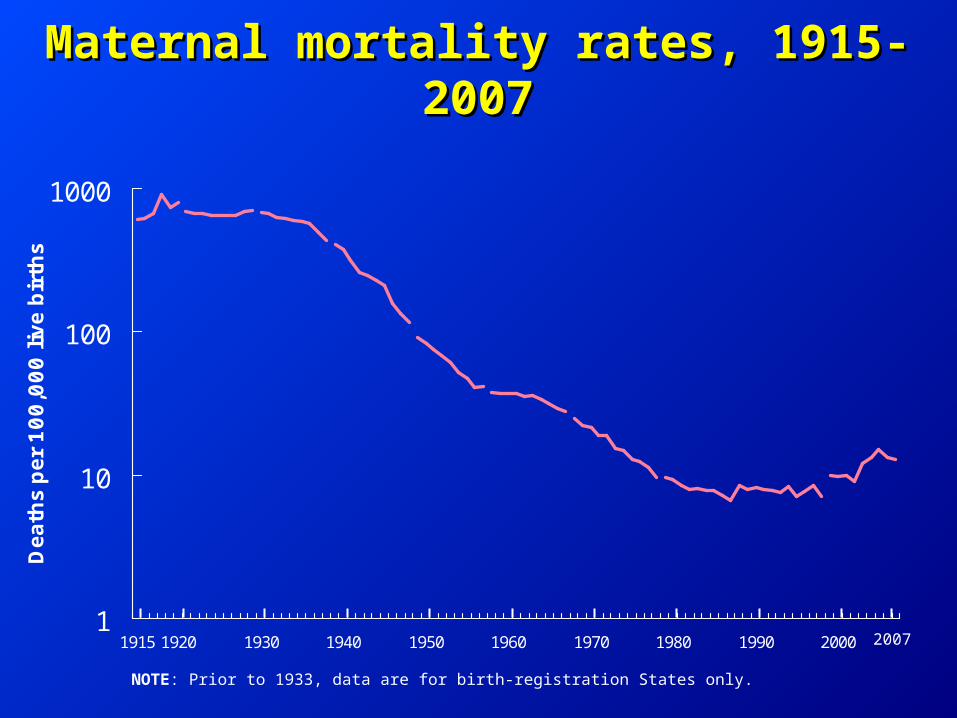
Maternal mortality rates, 1915-Maternal mortality rates, 1915-20072007
1
10
100
1000
1915 1920 1930 1940 1950 1960 1970 1980 1990 2000
Dea
ths
per
100,0
00 liv
e bir
ths
NOTE: Prior to 1933, data are for birth-registration States only.
2007
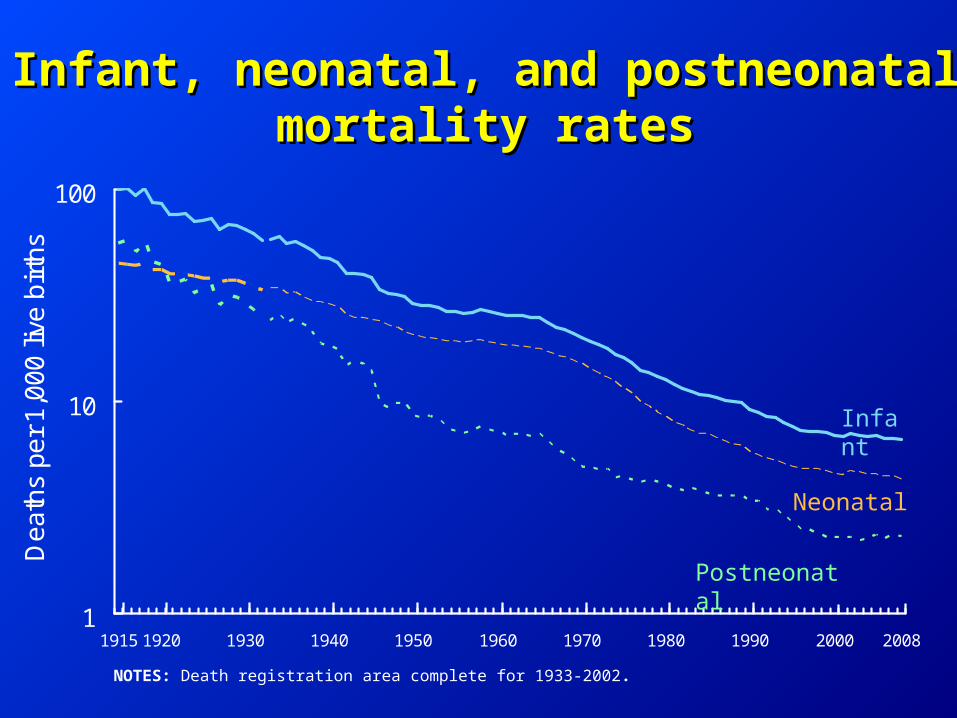
1
10
100
1915 1920 1930 1940 1950 1960 1970 1980 1990 2000 2008
De
ath
s pe
r 1
,00
0 liv
e b
irth
s
Infant
Neonatal
Postneonatal
NOTES: Death registration area complete for 1933-2002.
Infant, neonatal, and postneonatal Infant, neonatal, and postneonatal mortality ratesmortality rates

www.cdc.gov/nchs/www.cdc.gov/nchs/nvss.htmnvss.htm
Vital Statistics Vital Statistics
•Core of our health data system
•Base for public health, social science, economic planning and program development
•Monitor key indicators of health world-wide and at the local, state and national level
•Track progress to goals
• Identify disparities
•Alert to emerging problems

Need for complete and Need for complete and accurate informationaccurate information
Every certificate is important!