Embed Size (px)
Citation preview

A Novel Birefrigent Photonic Crystal FiberSurface Plasmon Resonance BiosensorVolume 6, Number 4, August 2014
R. OtupiriE. K. AkowuahS. Haxha, Senior Member, IEEEH. AdemgilF. AbdelMalekA. Aggoun
DOI: 10.1109/JPHOT.2014.23357161943-0655 Ó 2014 IEEE
A Novel Birefrigent Photonic Crystal FiberSurface Plasmon Resonance Biosensor
R. Otupiri,1 E. K. Akowuah,2 S. Haxha,3,5 Senior Member, IEEE,H. Ademgil,4 F. AbdelMalek,3 and A. Aggoun5
1Department of Electrical & Electronic Eng., Kwame Nkrumah University of Science and Technology,Kumansi 00233, Ghana,
2Department of Computer Eng., Kwame Nkrumah University of Science and Technology,Kumansi 00233, Ghana,
3School of Electronics and Digital Arts, University of Kent, Kent CT2 7NJ, U.K.4Department of Electronics, European University of Lefke, Lefke Mersin 10, Turkey5Department of Computer Science and Technologies, University of Bedfordshire,
Bedfordshire LU1 3JU, U.K.
DOI: 10.1109/JPHOT.2014.23357161943-0655 Ó 2014 IEEE. Translations and content mining are permitted for academic research only.
Personal use is also permitted, but republication/redistribution requires IEEE permission.See http://www.ieee.org/publications_standards/publications/rights/index.html for more information.
Manuscript received May 29, 2014; revised June 25, 2014; accepted June 26, 2014. Date of publi-cation July 8, 2014; date of current version July 14, 2014. Corresponding author: S. Haxha (e-mail:[email protected]).
Abstract: A numerical analysis of a novel birefringent photonic crystal fiber (PCF) biosen-sor constructed on the surface plasmon resonance (SPR) model is presented in this pa-per. This biosensor configuration utilizes circular air holes to introduce birefringence intothe structure. This PCF biosensor model shows promise in the area of multiple detectionusing HEx
11 and HEy11 modes to sense more than one analyte. A numerical study of the bio-
sensor is performed in two interrogation modes: amplitude and wavelength. Sensor reso-lution values with spectral interrogation yielded 5� 10�5 RIU (refractive index units) forHEx
11 modes and 6� 10�5 RIU for HEy11 modes, whereas 3� 10�5 RIU for HEx
11 modesand 4� 10�5 RIU for HEy
11 modes are demonstrated for the amplitude interrogation.
Index Terms: Surface plasmon, photonic crystal fiber, biosensor, fiber optic sensors.
1. IntroductionIn recent years, surface plasmon resonance (SPR) sensing has been accepted to be a robustand effective method of direct sensing [1]. Presently, SPR based sensing technique is by far themost advanced form of real time label free sensing. It has been used extensively in the study ofbiomolecular interactions (BIA) and in the recognition of target analytes, both chemical and bio-logical [1]–[3]. It is has therefore found several applications in the areas of food safety, biochem-ical technology, medicine, and other daily-life applications [4].
Many present day SPR biosensors on the market are based on the traditional prism-coupledconfiguration. The largesize and the existence of several optical and mechanical componentsmake optimization and commercial production of prism based sensors on a large scale difficult[5]. In addition, they cannot easily be miniaturized or incorporated into other systems [6], [7], re-sulting in the need to develop compact, robust and highly sensitive SPR biosensors that can beused for measurements outside a laboratory [2], [3], [7]–[10].
In recent times, various compact structures allowing coupling of optical waveguide modesand surface plasmon waveshave been reported: metallized single-mode, lapped D-shaped fiber
Vol. 6, No. 4, August 2014 6801711
IEEE Photonics Journal Birefrigent PCF SPR Biosensor
sensors, polarization maintaining, metallized tapered fibers [13]–[15], and, recently, PCF em-ploying elliptical air holes with metallic slots [16]. Fiber optic SPR biosensors are compact, offermultiplexing, remote sensing and device miniaturization [14]–[16]. These designs are focusedon the coupling of a leaky fundamental mode to the surface plasmon polaritons (SPP), whichare surface electromagnetic excitation on the metal layer in the micro-structure [17].
PCFs, also known as holey fibers, are fabricated from a sole substrate such as glass with aneven distribution oftiny holes along the fiber length [18]. The introduction of PCFs has opened upnew possibilities, some of which are light guidance through vacuum, unusual dispersion proper-ties, high confinement of light and tunable non-linear effects [19], [20]. Such unique characteris-tics of PCFs have sparked growing interest intheir use in fields such as high power applications,signal processing, and sensing. As a result, various types of SPR based microstructured opticalfiber (MOF) sensors and photonic bandgap SPR sensors have been proposed [22]–[25].
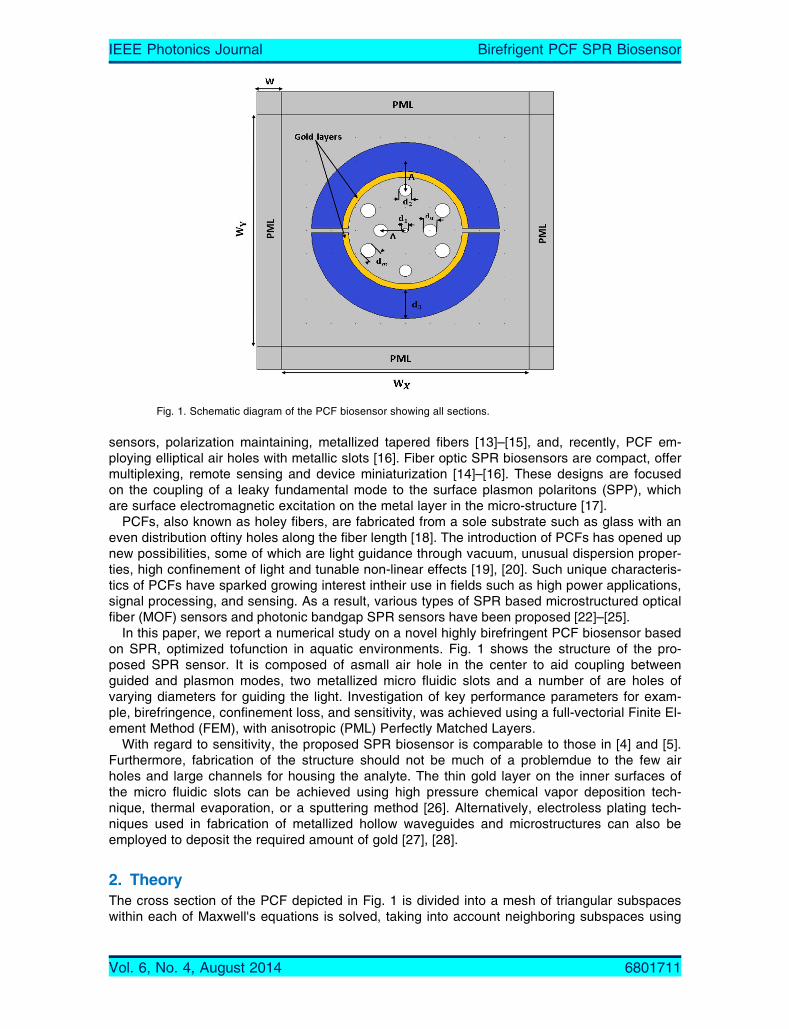
In this paper, we report a numerical study on a novel highly birefringent PCF biosensor basedon SPR, optimized tofunction in aquatic environments. Fig. 1 shows the structure of the pro-posed SPR sensor. It is composed of asmall air hole in the center to aid coupling betweenguided and plasmon modes, two metallized micro fluidic slots and a number of are holes ofvarying diameters for guiding the light. Investigation of key performance parameters for exam-ple, birefringence, confinement loss, and sensitivity, was achieved using a full-vectorial Finite El-ement Method (FEM), with anisotropic (PML) Perfectly Matched Layers.
With regard to sensitivity, the proposed SPR biosensor is comparable to those in [4] and [5].Furthermore, fabrication of the structure should not be much of a problemdue to the few airholes and large channels for housing the analyte. The thin gold layer on the inner surfaces ofthe micro fluidic slots can be achieved using high pressure chemical vapor deposition tech-nique, thermal evaporation, or a sputtering method [26]. Alternatively, electroless plating tech-niques used in fabrication of metallized hollow waveguides and microstructures can also beemployed to deposit the required amount of gold [27], [28].
2. TheoryThe cross section of the PCF depicted in Fig. 1 is divided into a mesh of triangular subspaceswithin each of Maxwell's equations is solved, taking into account neighboring subspaces using
Fig. 1. Schematic diagram of the PCF biosensor showing all sections.
Vol. 6, No. 4, August 2014 6801711
IEEE Photonics Journal Birefrigent PCF SPR Biosensor

FEM. Triangular subspaces represent circular structures better than any other, hence the rea-son for their use in this case [20], [29], [30]. The following is the vectorial wave equation derivedfrom Maxwell's equations [20], [22]–[30]:
r� ½s��1r� E� �
� k20n2½�E ¼ 0 (1)
where [s] represents the PML 3� 3 matrix, ½s��1 is the inverse of [s] matrix, k0ð¼ 2�=�Þ is thewave number in vacuum, E is the electric field vector, n is the refractive index of the domainand � represents the operating wavelength, and the propagating constant � is
� ¼ neffk0 (2)
where neff is the effective index of the mode. If � ¼ �0, the wavelength in a vacuum, then
� ¼ 2��0
neff ¼ 2��0n
¼ 2��eff
(3)
where �eff ¼ �0=neff is the z-directional component of the wavelength in the medium, and � (thepropagation constant) is the phase rotation per unitdistance. The effective index neff is the ratioof a wavelength in a given medium to that in a vacuum or as the ratio of a phase rotation in amedium to that in a vacuum.
The propagation constant of a surface plasmon wave (SPW) such a wave is defined as
�spw ¼ !
c
ffiffiffiffiffiffiffiffiffiffiffiffiffiffiffiffi"m"
"m þ "d
r(4)
where !, c, "m, and "d represent the angular frequency, the speed oflight in vacuum and the di-electric functions of the metal and dielectric, respectively [1].
In waveguides, coupling of the core mode to the plasmon mode at phase matching excitesthe SPW on the metal surface. Mathematically, the effective indices of the two modes at a givenwavelength of operation are equal [23].
Sensing the change in the confinement loss of the PCF when the core-guided mode iscoupled to the plasmon mode at the phase matching point is the underlying detection mecha-nism for most sensor designs. In the following equation, confinement loss calculations utilize theimaginary part of the complex refractive index neff [20]:
40�lnð10Þ� ImðneffÞ � 104 � 8:6860ImðneffÞ � 104 ½dB/cm�: (5)
3. Simulation and ResultsThe proposed PCF biosensor, as illustrated in Fig. 1, is composed of a hexagonal lattice of cir-cular air holes of varyingradii and a central tiny air hole. The large circular air holes, denoted bydm, are used to introduce birefringence into the structure. Tuning of the phase matching point ofthe core mode to the plasmon mode is achieved with the small circular hole at the center of thestructure denoted byd1. The presence of d1 at the center of the structure reduces the refractiveindex in central core area. The pitch, denoted by �, is the inter air hole spacing. The two holesin the first ring distort the perfect symmetry of the guided core mode thereby introducing birefrin-gence into the module. The four large holes in the second ring are used to vary the amount ofbirefringence being introduced. Additionally, the second ring forms a cladding with low refractiveindex which enables wave guidance. The third ring is composed of two gold coated slots ofsame thickness d3 which house the analyte.
Throughout this study the slot gap ds is set equal to d1. The birefringent nature of the SPRbased PCF sensor requires this channel design to provide enough coverage for the two
Vol. 6, No. 4, August 2014 6801711
IEEE Photonics Journal Birefrigent PCF SPR Biosensor
polarized modes. The slots have gold layers (thickness tAu) on which the surface plasmon wouldbe excited. The Sellmeier equation is used to model the background material (silica) [31]
nð�Þ ¼ffiffiffiffiffiffiffiffiffiffiffiffiffiffiffiffiffiffiffiffiffiffiffiffiffiffiffiffiffiffiffiffiffiffiffiffiffiffiffiffiffiffiffiffiffiffiffiffiffiffiffiffiffiffiffiffiffiffiffiffiffiffiffiffiffiffi1þ B1�2
�2 � C1þ 2�2
�2 � C2þ B3�2
�2 � 3
s(6)
where n is the index of refraction, and �ð�mÞ is wavelength, with Bði¼1;2;3Þ and Cði¼1;2;3Þ as Sellmeiercoefficients. The values of the coefficients are defined as follows: B1 ¼ 0:696166300, B2 ¼0:407942600, B3 ¼ 0:897479400, C1 ¼ 4:67914826� 10�3 �m2, C2 ¼ 1:35120631� 10�2 �m2,and C3 ¼ 97:9340025 �m2 [29]. Gold permittivity is modeled from Johnson and Christy data [32].
Full vectorial FEM is employed in all simulations. The schematic of the PCF SPR biosensormodel is divided into triangular pieces forming a mesh. In this way, accurate representation ofthe step index profile is achieved. The solver settings of FEM based on anisotropic perfectlymatched layers (PML) enable any desired number of confined and leaky modes to be analyzed.PML as a boundary condition enables accurate analysis leaky modes propagating through [30].The primary focus of the study is the fundamental modes HEx
11 and HEy11. Since the wave prop-
agates in the zdirection, modal analysis of the fundamental mode has been performed in thex–y plane of the cross section.
Our analysis begins with the investigation of the biosensor under study for good sensing capabili-ties. These are the structural parameters: � ¼ 1 �m, d1=� ¼ 0:30, d0� ¼ 0:55, d2=� ¼ 0:50,dm=� ¼ 0:60, and tAu ¼ 40 nm.
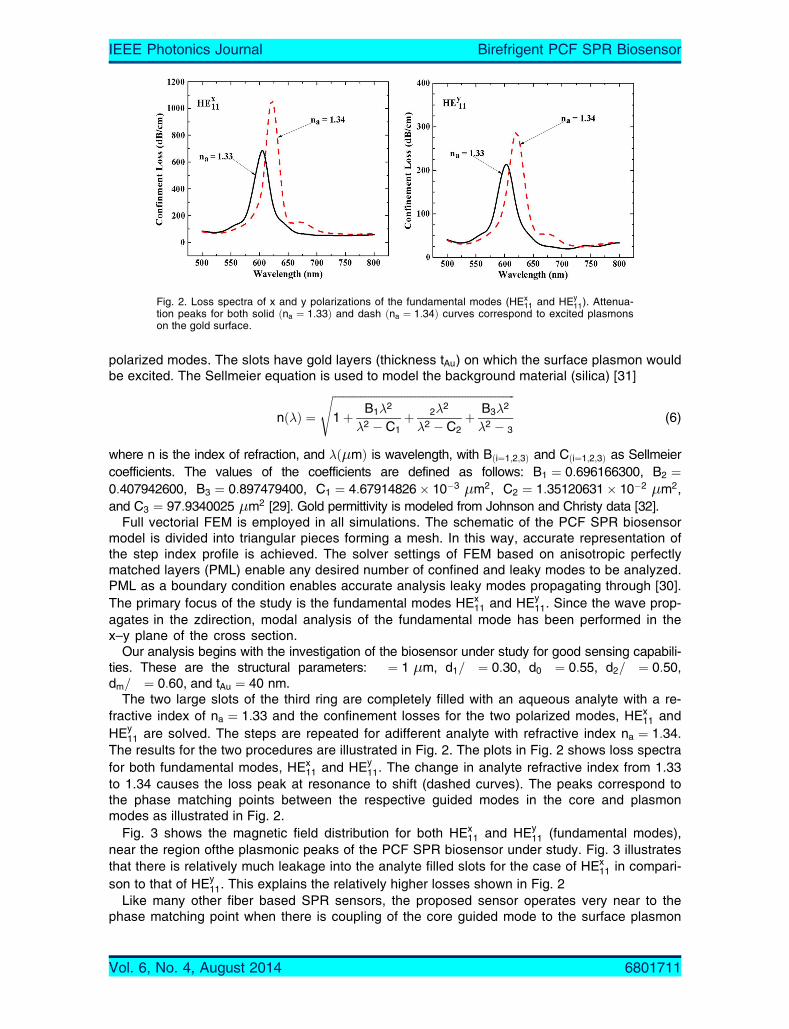
The two large slots of the third ring are completely filled with an aqueous analyte with a re-fractive index of na ¼ 1:33 and the confinement losses for the two polarized modes, HEx
11 andHEy
11 are solved. The steps are repeated for adifferent analyte with refractive index na ¼ 1:34.The results for the two procedures are illustrated in Fig. 2. The plots in Fig. 2 shows loss spectrafor both fundamental modes, HEx
11 and HEy11. The change in analyte refractive index from 1.33
to 1.34 causes the loss peak at resonance to shift (dashed curves). The peaks correspond tothe phase matching points between the respective guided modes in the core and plasmonmodes as illustrated in Fig. 2.
Fig. 3 shows the magnetic field distribution for both HEx11 and HEy
11 (fundamental modes),near the region ofthe plasmonic peaks of the PCF SPR biosensor under study. Fig. 3 illustratesthat there is relatively much leakage into the analyte filled slots for the case of HEx
11 in compari-son to that of HEy
11. This explains the relatively higher losses shown in Fig. 2Like many other fiber based SPR sensors, the proposed sensor operates very near to the
phase matching point when there is coupling of the core guided mode to the surface plasmon
Fig. 2. Loss spectra of x and y polarizations of the fundamental modes (HEx11 and HEy
11). Attenua-tion peaks for both solid ðna ¼ 1:33Þ and dash ðna ¼ 1:34Þ curves correspond to excited plasmonson the gold surface.
Vol. 6, No. 4, August 2014 6801711
IEEE Photonics Journal Birefrigent PCF SPR Biosensor
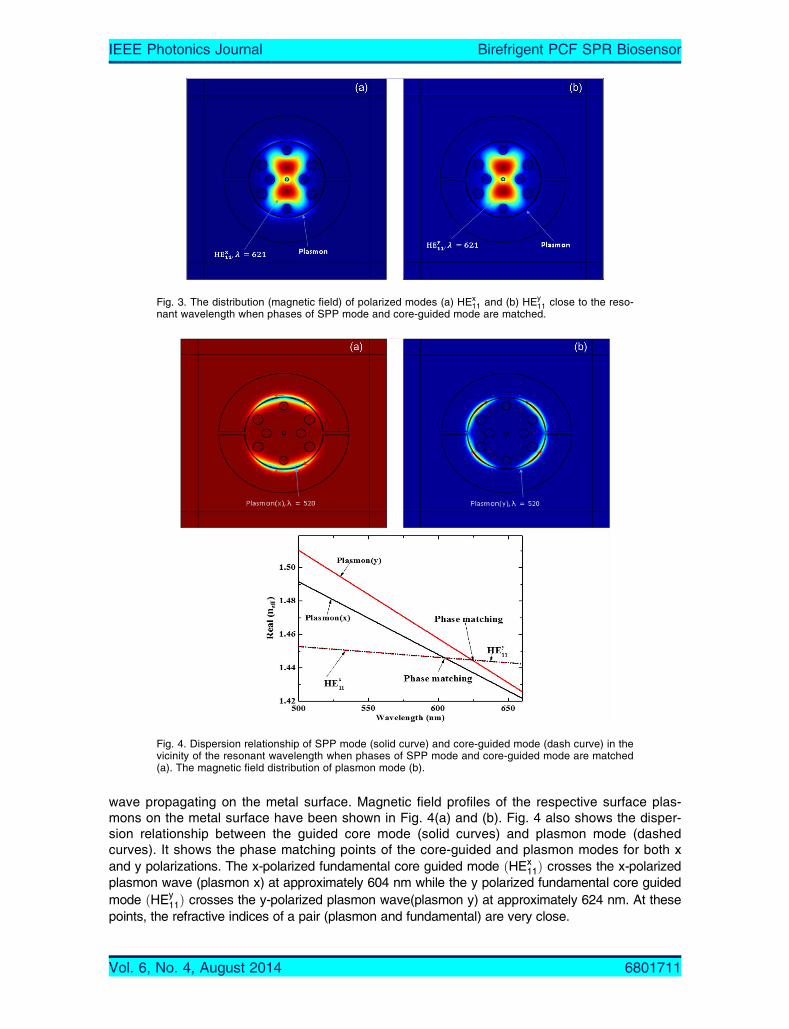
wave propagating on the metal surface. Magnetic field profiles of the respective surface plas-mons on the metal surface have been shown in Fig. 4(a) and (b). Fig. 4 also shows the disper-sion relationship between the guided core mode (solid curves) and plasmon mode (dashedcurves). It shows the phase matching points of the core-guided and plasmon modes for both xand y polarizations. The x-polarized fundamental core guided mode ðHEx
11Þ crosses the x-polarizedplasmon wave (plasmon x) at approximately 604 nm while the y polarized fundamental core guidedmode ðHEy
11Þ crosses the y-polarized plasmon wave(plasmon y) at approximately 624 nm. At thesepoints, the refractive indices of a pair (plasmon and fundamental) are very close.
Fig. 3. The distribution (magnetic field) of polarized modes (a) HEx11 and (b) HEy
11 close to the reso-nant wavelength when phases of SPP mode and core-guided mode are matched.
Fig. 4. Dispersion relationship of SPP mode (solid curve) and core-guided mode (dash curve) in thevicinity of the resonant wavelength when phases of SPP mode and core-guided mode are matched(a). The magnetic field distribution of plasmon mode (b).
Vol. 6, No. 4, August 2014 6801711
IEEE Photonics Journal Birefrigent PCF SPR Biosensor
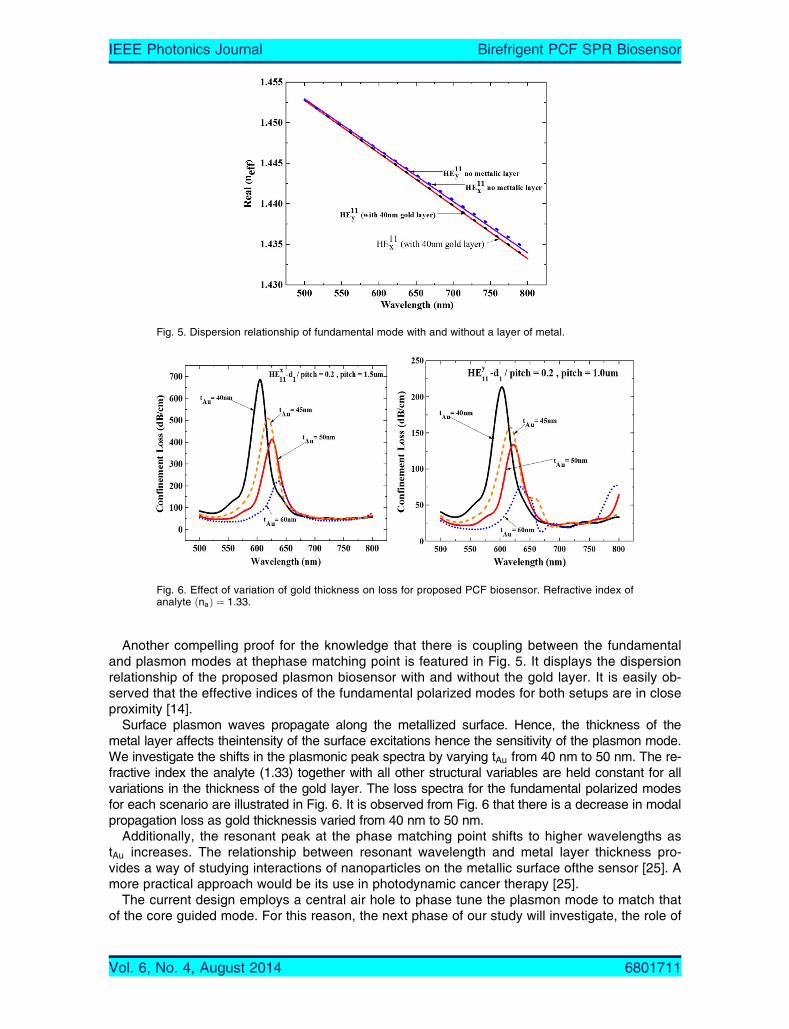
Another compelling proof for the knowledge that there is coupling between the fundamentaland plasmon modes at thephase matching point is featured in Fig. 5. It displays the dispersionrelationship of the proposed plasmon biosensor with and without the gold layer. It is easily ob-served that the effective indices of the fundamental polarized modes for both setups are in closeproximity [14].
Surface plasmon waves propagate along the metallized surface. Hence, the thickness of themetal layer affects theintensity of the surface excitations hence the sensitivity of the plasmon mode.We investigate the shifts in the plasmonic peak spectra by varying tAu from 40 nm to 50 nm. The re-fractive index the analyte (1.33) together with all other structural variables are held constant for allvariations in the thickness of the gold layer. The loss spectra for the fundamental polarized modesfor each scenario are illustrated in Fig. 6. It is observed from Fig. 6 that there is a decrease in modalpropagation loss as gold thicknessis varied from 40 nm to 50 nm.
Additionally, the resonant peak at the phase matching point shifts to higher wavelengths astAu increases. The relationship between resonant wavelength and metal layer thickness pro-vides a way of studying interactions of nanoparticles on the metallic surface ofthe sensor [25]. Amore practical approach would be its use in photodynamic cancer therapy [25].
The current design employs a central air hole to phase tune the plasmon mode to match thatof the core guided mode. For this reason, the next phase of our study will investigate, the role of
Fig. 5. Dispersion relationship of fundamental mode with and without a layer of metal.
Fig. 6. Effect of variation of gold thickness on loss for proposed PCF biosensor. Refractive index ofanalyte ðnaÞ ¼ 1:33.
Vol. 6, No. 4, August 2014 6801711
IEEE Photonics Journal Birefrigent PCF SPR Biosensor
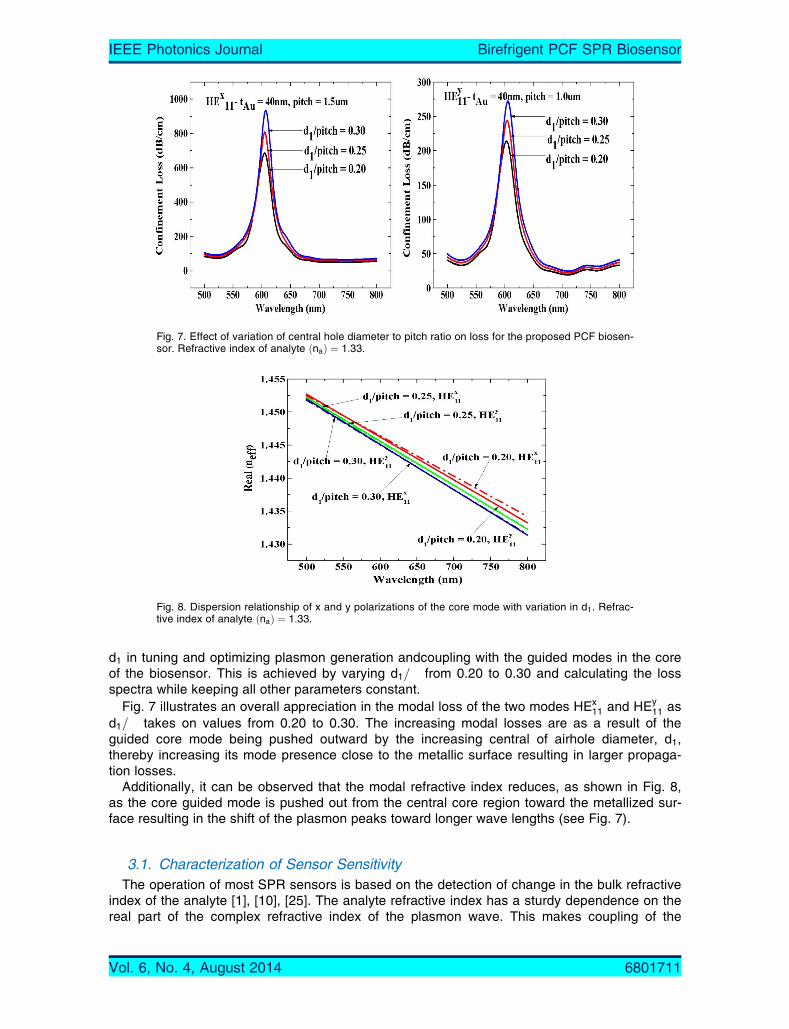
d1 in tuning and optimizing plasmon generation andcoupling with the guided modes in the coreof the biosensor. This is achieved by varying d1=� from 0.20 to 0.30 and calculating the lossspectra while keeping all other parameters constant.
Fig. 7 illustrates an overall appreciation in the modal loss of the two modes HEx11 and HEy
11 asd1=� takes on values from 0.20 to 0.30. The increasing modal losses are as a result of theguided core mode being pushed outward by the increasing central of airhole diameter, d1,thereby increasing its mode presence close to the metallic surface resulting in larger propaga-tion losses.
Additionally, it can be observed that the modal refractive index reduces, as shown in Fig. 8,as the core guided mode is pushed out from the central core region toward the metallized sur-face resulting in the shift of the plasmon peaks toward longer wave lengths (see Fig. 7).
3.1. Characterization of Sensor SensitivityThe operation of most SPR sensors is based on the detection of change in the bulk refractive
index of the analyte [1], [10], [25]. The analyte refractive index has a sturdy dependence on thereal part of the complex refractive index of the plasmon wave. This makes coupling of the
Fig. 7. Effect of variation of central hole diameter to pitch ratio on loss for the proposed PCF biosen-sor. Refractive index of analyte ðnaÞ ¼ 1:33.
Fig. 8. Dispersion relationship of x and y polarizations of the core mode with variation in d1. Refrac-tive index of analyte ðnaÞ ¼ 1:33.
Vol. 6, No. 4, August 2014 6801711
IEEE Photonics Journal Birefrigent PCF SPR Biosensor
guided-core mode with the plasmon at phase matching responsive to variations in the refractiveindex of the analyte [1], [25] The two main interrogation methods used are: amplitude or phaseinterrogation and wavelength or spectral interrogation. In amplitude interrogation, sensitivity ismeasured at a single wavelength, which makes this interrogation technique very low cost andsimple since there is no need for spectral manipulation [1].
The demerit, however, is in its narrow operation scope and lower sensitivity as compared tospectral sensitivity [1], [25]. Amplitude sensitivity is given by [25]
SAð�Þ ¼ � @�ð�; nÞ@na
� ���ð�;naÞ ½RIU�1� (7)
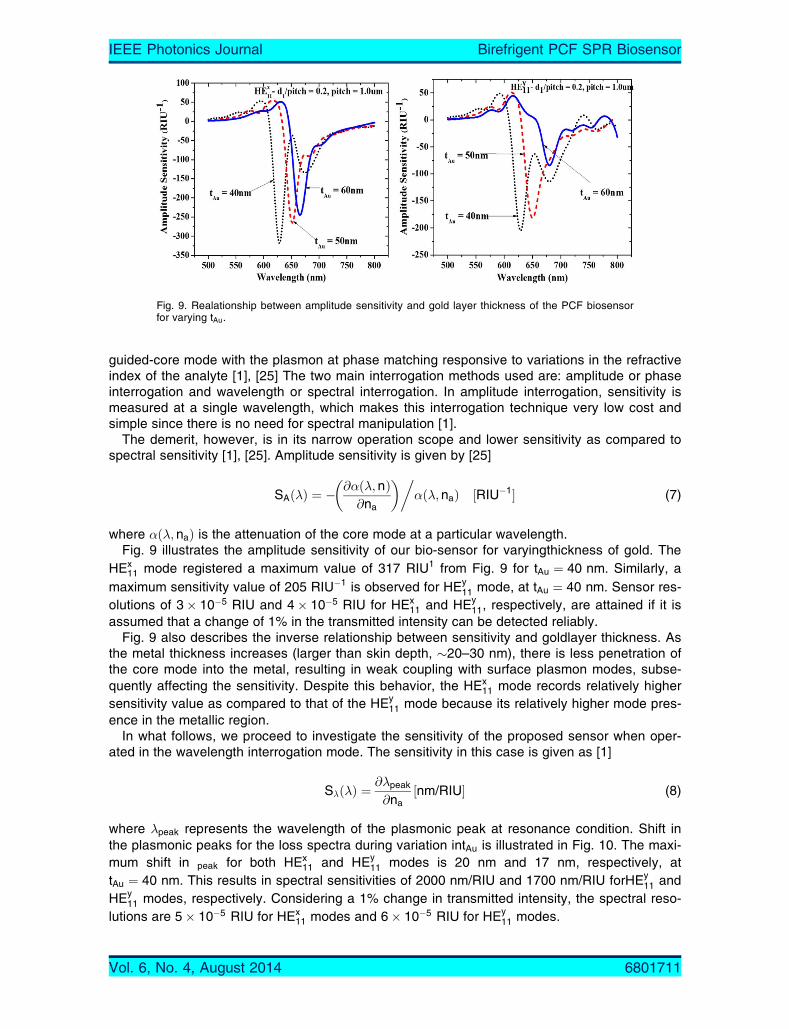
where �ð�; naÞ is the attenuation of the core mode at a particular wavelength.Fig. 9 illustrates the amplitude sensitivity of our bio-sensor for varyingthickness of gold. The
HEx11 mode registered a maximum value of 317 RIU1 from Fig. 9 for tAu ¼ 40 nm. Similarly, a
maximum sensitivity value of 205 RIU�1 is observed for HEy11 mode, at tAu ¼ 40 nm. Sensor res-
olutions of 3� 10�5 RIU and 4� 10�5 RIU for HEx11 and HEy
11, respectively, are attained if it isassumed that a change of 1% in the transmitted intensity can be detected reliably.
Fig. 9 also describes the inverse relationship between sensitivity and goldlayer thickness. Asthe metal thickness increases (larger than skin depth, �20–30 nm), there is less penetration ofthe core mode into the metal, resulting in weak coupling with surface plasmon modes, subse-quently affecting the sensitivity. Despite this behavior, the HEx
11 mode records relatively highersensitivity value as compared to that of the HEy
11 mode because its relatively higher mode pres-ence in the metallic region.
In what follows, we proceed to investigate the sensitivity of the proposed sensor when oper-ated in the wavelength interrogation mode. The sensitivity in this case is given as [1]
S�ð�Þ ¼ @�peak
@na½nm/RIU� (8)
where �peak represents the wavelength of the plasmonic peak at resonance condition. Shift inthe plasmonic peaks for the loss spectra during variation intAu is illustrated in Fig. 10. The maxi-mum shift in peak for both HEx
11 and HEy11 modes is 20 nm and 17 nm, respectively, at
tAu ¼ 40 nm. This results in spectral sensitivities of 2000 nm/RIU and 1700 nm/RIU forHEy11 and
HEy11 modes, respectively. Considering a 1% change in transmitted intensity, the spectral reso-
lutions are 5� 10�5 RIU for HEx11 modes and 6� 10�5 RIU for HEy
11 modes.
Fig. 9. Realationship between amplitude sensitivity and gold layer thickness of the PCF biosensorfor varying tAu.
Vol. 6, No. 4, August 2014 6801711
IEEE Photonics Journal Birefrigent PCF SPR Biosensor
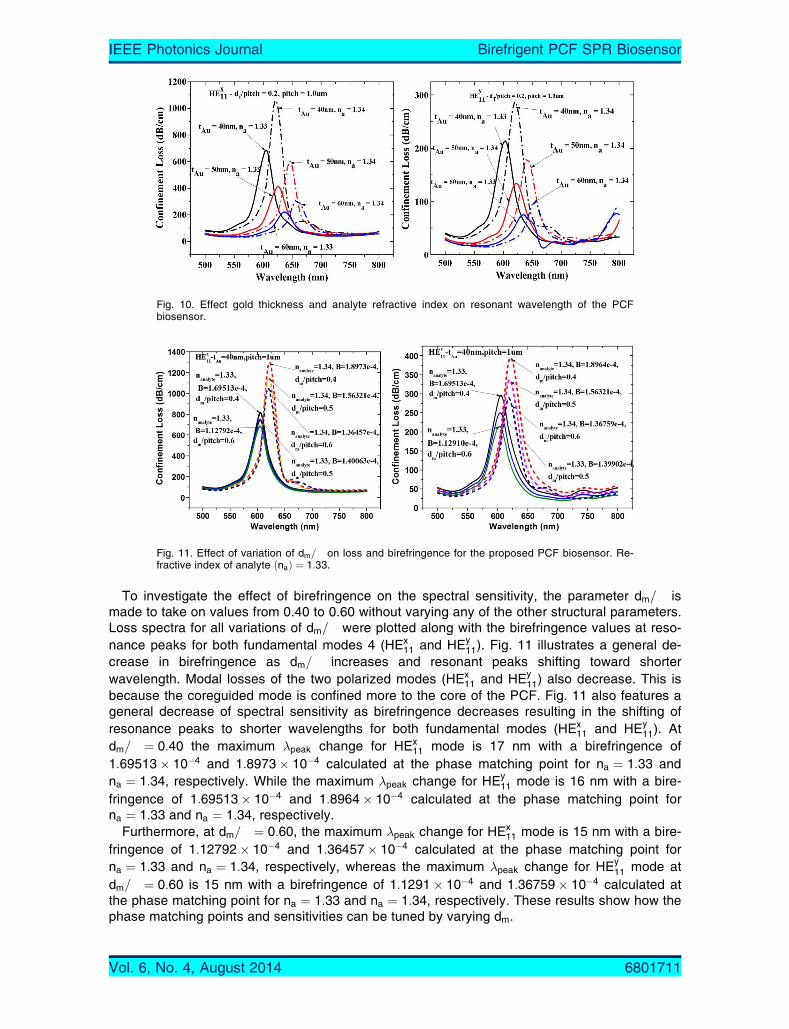
To investigate the effect of birefringence on the spectral sensitivity, the parameter dm=� ismade to take on values from 0.40 to 0.60 without varying any of the other structural parameters.Loss spectra for all variations of dm=� were plotted along with the birefringence values at reso-nance peaks for both fundamental modes 4 (HEx
11 and HEy11). Fig. 11 illustrates a general de-
crease in birefringence as dm=� increases and resonant peaks shifting toward shorterwavelength. Modal losses of the two polarized modes (HEx
11 and HEy11) also decrease. This is
because the coreguided mode is confined more to the core of the PCF. Fig. 11 also features ageneral decrease of spectral sensitivity as birefringence decreases resulting in the shifting ofresonance peaks to shorter wavelengths for both fundamental modes (HEx
11 and HEy11). At
dm=� ¼ 0:40 the maximum �peak change for HEx11 mode is 17 nm with a birefringence of
1:69513� 10�4 and 1:8973� 10�4 calculated at the phase matching point for na ¼ 1:33 andna ¼ 1:34, respectively. While the maximum �peak change for HEy
11 mode is 16 nm with a bire-fringence of 1:69513� 10�4 and 1:8964� 10�4 calculated at the phase matching point forna ¼ 1:33 and na ¼ 1:34, respectively.
Furthermore, at dm=� ¼ 0:60, the maximum �peak change for HEx11 mode is 15 nm with a bire-
fringence of 1:12792� 10�4 and 1:36457� 10�4 calculated at the phase matching point forna ¼ 1:33 and na ¼ 1:34, respectively, whereas the maximum �peak change for HEy
11 mode atdm=� ¼ 0:60 is 15 nm with a birefringence of 1:1291� 10�4 and 1:36759� 10�4 calculated atthe phase matching point for na ¼ 1:33 and na ¼ 1:34, respectively. These results show how thephase matching points and sensitivities can be tuned by varying dm.
Fig. 10. Effect gold thickness and analyte refractive index on resonant wavelength of the PCFbiosensor.
Fig. 11. Effect of variation of dm=� on loss and birefringence for the proposed PCF biosensor. Re-fractive index of analyte ðnaÞ ¼ 1:33.
Vol. 6, No. 4, August 2014 6801711
IEEE Photonics Journal Birefrigent PCF SPR Biosensor
Analysis performed so far indicates that it is possible to optimize the structural parameters ofthe proposed sensorto realize different sensors of various lengths, taking into consideration theinverse law relationship between sensor length and modal losses.
The high losses at the plasmonic peaks of the proposed PCF SPR sensor limit it to the centi-meter scale to enable easy detection of the signal. Such a structure is best considered as an in-tegrated photonics element rather than a fiber. However, these losses can be reduced byoptimizing structural parameters such as tAu, dm, and d1 as discussed in the previous sections.There must, however, be a compromise between high sensitivity and low losses.
The analysis presented so far indicate the possibility of realizing a PCF SPR sensor withdifferential sensitivities as far as the fundamental modes HEx
11 and HEy11 are concerned.
There is the possibility of optimizing d1 and dm to obtain substantial difference in the respec-tive sensitivities of HEx
11 and HEy11 modes. This particular feature will beuseful in applications
where simultaneous observation of both bulk and surface contributions to sensor response isrequired and also multi analyte/multi-channel sensing. Some researchers have successfullydemonstrated both theoretically and experimentally the importance of such a feature in SPRbiosensors [30]–[32].
4. ConclusionA detailed theoretical study of a novel PCF SPR biosensor has been presented in this paper.The biosensor structure is made up of a combination of microfluidic channels, waveguide andmetallized layers making this design compact, in contrast to other common SPR biosensors.The coupling conditions at resonance, sensitivity, and loss spectra of this SPR based PCF bio-sensor have been investigated using a finite element method with perfectly matched layers. Fur-thermore, it has been demonstrated that the proposed sensor has differential sensitivity as faras the fundamental modes HEx
11 and HEy11 are concerned and can be useful for multi analyte or
multi-channel sensing and simultaneous detection of bulk and surface sensitivities. Simulationstook into consideration the operation of the sensor in both spectral and amplitude interrogationmodes. Characteristic sensor resolution values of 5� 10�5 RIU and 6� 10�5 RIU for HEx
11 andHEy
11, respectively, were recorded for the spectral interrogation mode, while 3� 10�5 RIU forHEx
11 modes and 4� 10�5 RIU for HEy11 modes, when the sensor was operated in the amplitude
interrogation mode. The resolutions obtained are comparable to reported designs in [4] and [5].Fabrication of the structure should not be much of a problem due to the few air holes and largechannels for housing the analyte. The thin gold layer on the inner surfaces of the micro fluidic-slots can be achieved using high pressure chemical vapor deposition technique, thermal evapo-ration or a sputtering method [26]. Alternatively, electroless plating techniques used infabrication of metallized hollow waveguides and microstructures can also be employed to de-posit required amount of gold [27], [28].
References[1] J. Homola, S. S. Yee, and G. Gauglitz, “Surface plasmon resonance sensors: Review,” Sensors Actuators B.
Chem., vol. 54, No. 1, pp. 3–15, 1999.[2] E. K. Akowuah, T. Gorman, S. Haxha, and J. V. Oliver, “Dual channel planar waveguide surface plasmon resonance
biosensor for an aqueous environment,” Opt. Exp., vol. 18, No. 24, pp. 24412–24422, Nov. 2010.[3] E. K. Akowuah, T. Gorman, and S. Haxha, “Design and optimization of a novel surface plasmon resonance biosen-
sor based on Otto configuration,” Opt. Exp., vol. 17, No. 26, pp. 23511–23521, Dec. 2009.[4] W. Qin, S. Li, Y. Yao, X. Xin, and J. Xue, “Analyte-filled core self-calibration microstructured optical fiber based plas-
monic sensor for detecting high refractive index aqueous analyte,”Opt. Lasers Eng., vol. 58, pp. 1–8, Jul. 2014.[5] J. N. Dash and Jha, “SPR biosensor based on polymer PCF coated with conducting metal oxide,” IEEE Photon.
Technol. Lett., vol. 26, no. 6, pp. 595–598, Mar. 2014.[6] T. T. Goodrich, H. J. Lee, and R. M. Corn, “Direct detection of genomic DNA by enzymatically amplified SPR imag-
ing measurements of RNA microarrays,” J. Am. Chem. Soc., vol. 126, no. 13, pp. 4086–4087, Apr. 2004.[7] J. Homola, H. Vaisocherová, J. Dostálek, and M. Piliarik, “Multi-analyte surface plasmon resonance biosensing,”
Methods, vol. 37, no. 1, pp. 26–36, Sep. 2005.
Vol. 6, No. 4, August 2014 6801711
IEEE Photonics Journal Birefrigent PCF SPR Biosensor
[8] R. Jha and A. K. Sharma, “High-performance sensor based on surface plasmon resonance with chalcogenide prismand aluminum fordetection in infrared,” Opt. Lett., vol. 34, no. 6, pp. 749–751, Mar. 2009.
[9] K. Wang et al., “High-sensitivity electro-optic-modulated surface plasmon resonance measurement using multilayerwaveguide-coupled surface plasmon resonance sensors,” Sensor Lett., vol. 8, no. 2, pp. 370–374, Apr. 2010.
[10] M. Piliarik, L. Párová, and J. Homola, “High-throughput SPR sensor for food safety.” Biosensors Bioelectron.,vol. 24, no. 5, pp. 1399–1404, Jan. 2009.
[11] R. Jorgenson and S. Yee, “A fiber-optic chemical sensor based on surface plasmon resonance,” Sensors ActuatorsB. Chem., vol. 12, no. 3, pp. 213–220, Apr. 1993.
[12] D. Monzón-Hernández and J. Villatoro, “High-resolution refractive index sensing by means of a multiple-peak sur-face plasmon resonance optical fiber sensor,” Sensors Actuators B. Chem., vol. 115, no. 1, pp. 227–231, May 2006.
[13] H. Suzuki, M. Sugimoto, Y. Matsui, Y. J. Kondoh, “Fundamental characteristics of a dual-colour fibre optic SPR sen-sor,” Meas. Sci. Technol., vol. 17, no. 6, pp. 1547–1552, 2006.
[14] E. K. Akowuah, H. Ademgil, S. Haxha, G. K. Robinson, and J. V. Oliver, “Numerical analysis of a photonic crystal fi-ber for biosensing applications,” IEEE J. Quantum Electron., vol. 48, no. 11, pp. 1403–1410, Nov. 2012.
[15] S. Patskovsky, M. Meunier, N. P. Prasad, and V. A. Kabashin, “Self-noise-filtering phase-sensitive surface plasmonresonance biosensing,” Opt. Exp., vol. 18, no. 14, pp. 14353–14358, Jul. 2010.
[16] X. Hoa, A. Kirk, and M. Tabrizian, “Towards integrated and sensitive surface plasmon resonance biosensors: A re-view of recent progress,” Biosensors Bioelectron., vol. 23, no. 2, pp. 151–160, Sep. 2007.
[17] A. Dhawan, M. D. Gerhold, and J. F. Muth, Plasmonic structures based on subwavelength apertures for chemicaland biological sensing applications. IEEE Sensors J., vol. 8, no. 6, pp. 942–950, Jun. 2008.
[18] A. Ferrando, E. Silvestre, J. J. Miret, P. Andres, and M. Andres, “Vector description of higher-order modes in pho-tonic crystal fibers,” J. Opt. Soc. Amer. A, vol. 17, no. 7, pp. 1333–1340, Jul. 2000.
[19] F. Zolla et al., Fundamentals of Photonic Crystal Fibers. London, U.K.: Imperial College, 2005.[20] H. Ademgil, S. Haxha, T. Gorman, and F. AbdelMalek, “Bending effects on highly birefringent photonic crystal fibers
with low chromatic dispersion and low confinement losses,” IEEE, J. Lightw. Technol., vol. 27, no. 5, pp. 559–567,Mar. 2009.
[21] Y. Du, et al., “Polarization splitting filter characteristics of Au-filled high-birefringence photonic crystalfiber,” Appl.Phys. B, vol. 109, no. 1, pp. 65–74, Oct. 2012.
[22] B. Gauvreau, A. Hassani, M. F. Fehri, A. Kabashin, and M. Skorobogatiy, “Photonic bandgap fiber-based surfaceplasmon resonance sensors,” Opt. Exp., vol. 15, no. 18, pp. 11413–11426, Sep. 2007.
[23] A. Hassani and M. Skorobogatiy, “Design of the microstructured optical fiber-based surface plasmon resonance sen-sors with enhanced microfluidics,” Opt. Exp., vol. 14, no. 24, pp. 11616–11621, Nov. 2006.
[24] M. Hautakorpi, M. Mattinen, and H. Ludvigsen, “Surface-plasmon-resonance sensor based on three-hole microstruc-tured optical fiber” Opt. Exp., vol. 16, no. 12, pp. 8427–8432, Jun. 2008.
[25] A. Hassani, B. Gauvreau, M. F. Fehri, A. Kabashin, and M. Skorobogatiy, “Photonic crystal fiber and waveguide-based surface plasmon resonance sensors for application in thevisible and near-IR,” Electromagnetics, vol. 28,no. 3, pp. 198–213, 2008.
[26] P. J. Sazio et al., “Microstructured optical fibers as high-pressure microfluidic reactors,” Science, vol. 311, no. 5767,pp. 1583–1586, 2006.
[27] J. A. Harrington, “A review of IR transmitting, hollow waveguides,” Fiber Integr. Opt., vol. 19, no. 3, pp. 211–227,2000.
[28] N. Takeyasu, T. Tanaka, and S. Kawata, “Metal deposition deep into microstructure by electroless plating,” Japa-nese J. Appl. Phys., vol. 44, no. 8L, pp. L1134, 2005.
[29] K. Saitoh, M. Koshiba, T. Hasegawa, and E. Sasaoka, “Chromatic dispersion control in photonic crystal fibers: Appli-cation to ultra-flattened dispersion,” Opt. Exp., vol. 11, no. 8, pp. 843–852, 2003.
[30] E. K. Akowuah et al., “Novel compact photonic crystal fibre surface plasmon resonance biosensor for an aqueou-senvironment,” in Photonic Crystals–Innovative Systems, Lasers and Waveguides. Winchester, U.K.: Intech,pp. 81–96, 2012, ch. 6.
[31] W. Sellmeier, “Zur erklärung der abnormen farbenfolge im spectrum einiger substanzen,” Annalen der Physik undChemie, vol. 219, no. 6, pp. 272–282, 1871.
[32] Y. Y. Shevchenko and J. Albert, “Plasmon resonances in gold-coated tilted fiber Bragg gratings,” Opt. Lett., vol. 32,no. 3, pp. 211–213, Feb. 2007.
[33] Y. Shevchenko, C. Chen, M. A. Dakka, and J. Albert, “Polarization-selective grating excitation of plasmons in cylin-drical opticalfibers,” Opt. Lett., vol. 35, no. 5, pp. 637–639, Mar. 2010.
[34] C. Caucheteur, Y. Shevchenko, Y. L. Shao, M. Wuilpart, and J. Albert, “High resolution interrogation of tilted fibergrating SPR sensors from polarization properties measurement,” Opt. Exp., vol. 19, no. 2, pp. 1656–1664, Jan. 2011.
Vol. 6, No. 4, August 2014 6801711
IEEE Photonics Journal Birefrigent PCF SPR Biosensor


![Terahertz electromagnetic crystal waveguide fabricated by ...€¦ · [5], metal wire [6, 7], coaxial transmission line [8], sub-wavelength fiber [2, 9–11], photonic crystal fiber](https://img.pdfslide.net/doc/110x75/5fc79678232a637257064bbe/terahertz-electromagnetic-crystal-waveguide-fabricated-by-5-metal-wire-6.jpg)