Embed Size (px)
Citation preview
www.ijecs.in International Journal Of Engineering And Computer Science ISSN:2319-7242 Volume 2 Issue 6 June, 2013 Page No. 2012-2018
Nisthula P, IJECS Volume2 Issue 6 June, year 2013 Page No.2012-2018 Page 2012
A NOVEL METHOD TO DETECT BONE CANCER USING IMAGE FUSION AND
EDGE DETECTION
Nisthula P, Mr. Yadhu.R.B.
Calicut University, kerala, India
Asst.Professor,Calicut university, Kerala , India
Abstract
Employing an efficient processing technique is considered as an essential step to improve the overall visual representation of
clinical images, and as a consequence provides better diagnosis results. This paper employs an easy, fast and reliable
technique to detect cancerous tissue in bone by using different image processing techniques such as contrast enhancement,
edge detection and image fusion. The experimental results show, the proposed method could obtain the smooth image with
edge showing the disease affected part without the spatial and spectral noises.
Key words: contrast enhancement, edge detection, image fusion
1. INTRODUCTION
A bone tumor, (also spelled bone tumour), is a
neoplastic growth of tissue in bone. Abnormal growths
found in the bone can be either benign (noncancerous) or
malignant (cancerous). Bone tumors may be classified as
"primary tumors", which originate in bone or from bone-
derived cells and tissues, and "secondary tumors" which
originate in other sites and spread (metastasize) to the
skeleton. Carcinomas of the prostate, breasts, lungs, thyroid
& kidneys are the primary carcinomas that most commonly
metastasize to the bone. Secondary malignant bone tumors
are estimated to be 50 to 100 times as common as primary
bone cancers. Primary tumors of bone can be divided into
benign tumors and cancers. Common benign bone tumors
may be neoplastic, developmental, traumatic, infectious, or
inflammatory in etiology. Some benign tumors are not true
neoplasms, but rather, represent hamartomas, namely the
osteochondroma. The most common locations for many
primary tumors, both benign and malignant include the
distal femur and proximal tibia. Since, by definition, benign
bone tumors do not metastasize, all secondary bone tumors
are metastatic lesions which have spread from other organs,
most commonly carcinomas of the breast, lung, and prostate.
Reliable and valid statistics on the incidence, prevalence,
and mortality of malignant bone tumors are difficult to come
by, particularly in the oldest (those over 75 years of age),
because carcinomas that are widely metastatic to bone are
rarely ever curable, biopsies to determine the origin of the
tumor in cases like this are rarely done.
The survival of bone cancer patients is related to
the extent of their disease at the time of diagnosis. In the
absence of distant metastases, the spread of tumors to the
mediastinal lymph nodes is a major determinant of both the
prognosis and the therapeutic approach. Proper staging is
important for selecting patients who may benefit from
surgical resection and for defining the treatment modalities
of patients who will undergo radiotherapy.
Tomographic imaging in nuclear medicine is based
on the metabolic activity of tissues and may be useful for
identifying pathological changes before they are detected by
radiological examinations such as CTs. CT provides the
anatomical structure and SPECT and PET and PET[11]
Nisthula P, IJECS Volume2 Issue 6 June, year 2013 Page No.2012-2018 Page 2013
provides the functional information of organs and tissues.
PET (positron emission tomography) scans with 18F-FDG
(18F-fluorodeoxyglucose) have superior sensitivity and
specificity compared to chest CTs and are considered the
most accurate imaging method for staging patients with
bone cancers. However , there are limitations related to
positive predictive value of this method because there may
be FDG uptake in inflammatory cells. The sensitivity can
also be decreased when lymph node metastasis is
microscopic or below the spatial resolution threshold of
current, state-of-the-art scanners. The availability of PET is
restricted to a few institutions because of equipment costs.
Alternatively, single-photon emission computed tomography
(SPECT) is widely available, has lower costs than PET, and
does not require the presence of a cyclotron adjacent to the
hospital.
The association of functional images and
anatomical information from CTs may be useful in
interpreting SPECT by providing more accurate data
regarding the location and extent of tumor lesions. Hybrid
devices usually have dual detectors, with scintillation
cameras and low-dose CT scanners. Sequentially, data from
both CT and SPECT are acquired. The two images are
merged, creating SPECT images that are superimposed on
corresponding anatomical planes. This image fusion may
help to differentiate between tumors and other areas of
physiological activity.
Image fusion is the process of integrating
information from two or more images of the same position
into a single image that contains more information and is
more appropriate for visual perception. For the purpose of
most clinical applications, medical image fusion intends to
reduce ambiguity and minimize redundancy in fused image
while maximizing the relative information specifics.
This paper proposes a new method to detect
cancerous parts in body by using different image processing
techniques. Preprocessing techniques are done on SPECT,
CT images and then the edge of CT image is detected by
using a new method to enhance the disease affected part.
Then the SPECT and edge detected CT images are fused
with HIS,PCA and integrated retina inspired model (RIM)[2].
2. THE IHS, PCA AND RETINA INSPIRED
FUSION MODELS
2.1. The RGB-IHS Conversion Model
The IHS[3] transformation converts a multispectral image or
panchromatic image with red, green and blue channels
(RGB) to intensity, hue and saturation independent
components. The intensity displays the brightness in a
spectrum, the hue is the property of the spectral wavelength,
and the saturation is the purity of the spectrum. This
technique may be used for the fusion of multi-sensor
images.
To understand the whole fusion process preferably,
we must review the RGB-IHS conversion model. There are
two essential RGB-IHS conversion models. In this study, we
select a more close to the real visual effect model- triangular
spectral model. The IHS triangular model can produce a
fused and enhanced spectral image.
2.2. PCA Transform Fusion Approach
The whole idea of the method is described in detail
in References , and here the fundamentals of PCA[5] fusion
are briefly outlined as follows. Firstly, a multispectral image
is transformed with PCA transform and the eigen values and
corresponding eigenvectors of correlation matrix between
images in the multi-spectral image‟s individual bands are
worked out to obtain each matrix‟s principle components.
Next, the panchromatic image is matched by the first
principle component using histogram method. Finally, the
first principle component of the multispectral image is
replaced with the matched panchromatic image and with
other principle components, followed by the transformation
with inverse PCA transform to form the fused image.
2.3. Retina-Inspired Model
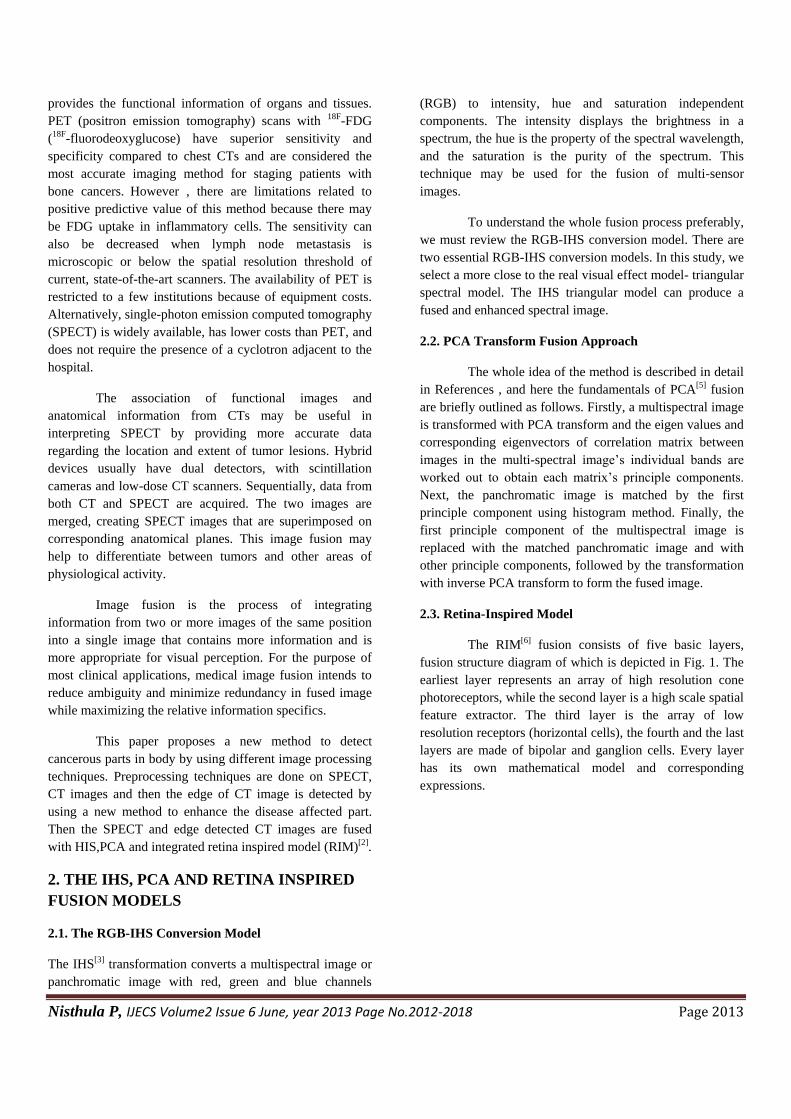
The RIM[6] fusion consists of five basic layers,
fusion structure diagram of which is depicted in Fig. 1. The
earliest layer represents an array of high resolution cone
photoreceptors, while the second layer is a high scale spatial
feature extractor. The third layer is the array of low
resolution receptors (horizontal cells), the fourth and the last
layers are made of bipolar and ganglion cells. Every layer
has its own mathematical model and corresponding
expressions.
Nisthula P, IJECS Volume2 Issue 6 June, year 2013 Page No.2012-2018 Page 2014
fig1.Retina inspired model
In the proposed fusion approach, we use a black
box to represent the RIM model, which is just a part in the
whole system, its internal structure and some cells detailed
information in the fusion process shown the same as Fig. 1.
3. The Sobel edge detector
An edge[8], in an image, is a collection of connected
high frequency points. Visually, an edge is a region in an
image where there is a sharp change in intensity of the
image. Edge detection refers to the operation(s) performed
on an image to detect the edges in an image. The output of
edge detection is usually thresholded to retain only the edge.
Edge detection plays a vital role in object detection and
feature extraction and plays pivotal role in machine vision.
There are different types of edges – step edges, roof edges,
line edges, colour edges, gray level edges, texture edges etc.
Not all edges are detected by all edge detection operators.
Each operation has its specific specialty in edges and better
the edge detection, usually, more complex and costly is the
operation. An edge has both magnitude and direction. The
direction is used to identify the next possible edge point.
Finally, all the edge points are linked together to form an
object boundary. In an ideal scenario, all edges are
connected and we get a perfect boundary, but this is seldom
the case due to various reasons such as difference in
illumination, partially visible objects, texture variation,
inefficiency of the edge detection operator etc. Some times,
the edge detection operation might even result in false
edges. To resolve these issues, there have been a number of
edge detection operators defined throughout the history of
Image Processing. All the edge detection methods are based
upon the description of „changes of continuous functions
using derivatives‟ given by calculus. Simply put, all
operators are gradient operators.
Gradient edge detectors are those which describe
edges by means of partial derivatives. A change in the image
function can be described by a gradient that points in the
direction of the largest growth of the image function. They
are of three types: Operators performing derivatives by
using differences. Eg: Sobel , Operators based on the zero
crossings of the second derivatives. Eg: Canny edge
detector. , Operators that match the image function to a
known parametric model of the edges.
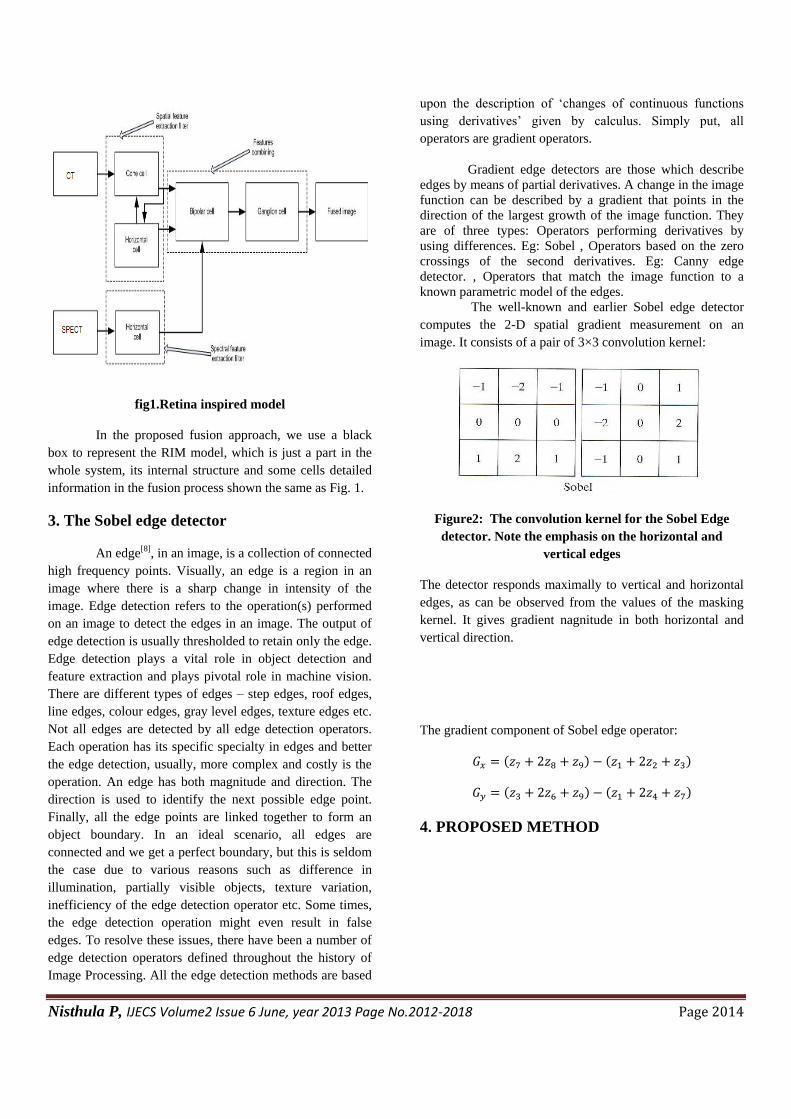
The well-known and earlier Sobel edge detector
computes the 2-D spatial gradient measurement on an
image. It consists of a pair of 3×3 convolution kernel:
Figure2: The convolution kernel for the Sobel Edge
detector. Note the emphasis on the horizontal and
vertical edges
The detector responds maximally to vertical and horizontal
edges, as can be observed from the values of the masking
kernel. It gives gradient nagnitude in both horizontal and
vertical direction.
The gradient component of Sobel edge operator:
( ) ( )
( ) ( )
4. PROPOSED METHOD
Nisthula P, IJECS Volume2 Issue 6 June, year 2013 Page No.2012-2018 Page 2015
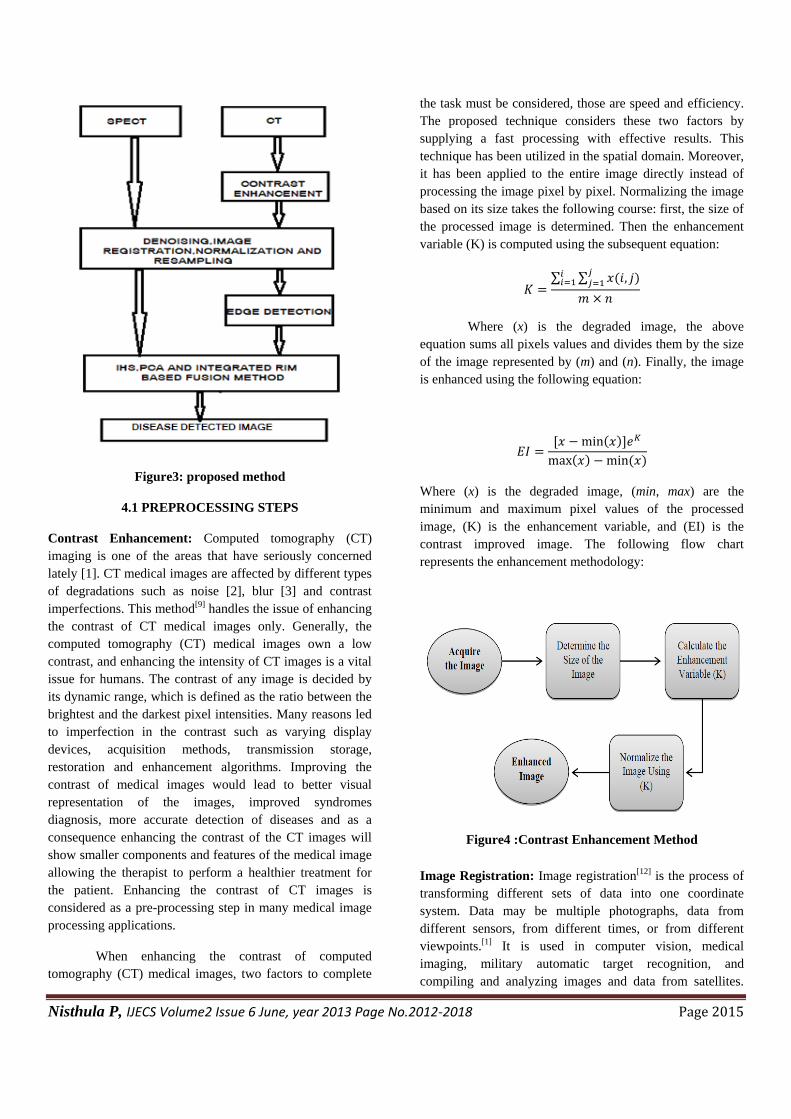
Figure3: proposed method
4.1 PREPROCESSING STEPS
Contrast Enhancement: Computed tomography (CT)
imaging is one of the areas that have seriously concerned
lately [1]. CT medical images are affected by different types
of degradations such as noise [2], blur [3] and contrast
imperfections. This method[9] handles the issue of enhancing
the contrast of CT medical images only. Generally, the
computed tomography (CT) medical images own a low
contrast, and enhancing the intensity of CT images is a vital
issue for humans. The contrast of any image is decided by
its dynamic range, which is defined as the ratio between the
brightest and the darkest pixel intensities. Many reasons led
to imperfection in the contrast such as varying display
devices, acquisition methods, transmission storage,
restoration and enhancement algorithms. Improving the
contrast of medical images would lead to better visual
representation of the images, improved syndromes
diagnosis, more accurate detection of diseases and as a
consequence enhancing the contrast of the CT images will
show smaller components and features of the medical image
allowing the therapist to perform a healthier treatment for
the patient. Enhancing the contrast of CT images is
considered as a pre-processing step in many medical image
processing applications.
When enhancing the contrast of computed
tomography (CT) medical images, two factors to complete
the task must be considered, those are speed and efficiency.
The proposed technique considers these two factors by
supplying a fast processing with effective results. This
technique has been utilized in the spatial domain. Moreover,
it has been applied to the entire image directly instead of
processing the image pixel by pixel. Normalizing the image
based on its size takes the following course: first, the size of
the processed image is determined. Then the enhancement
variable (K) is computed using the subsequent equation:
∑ ∑ ( )
Where (x) is the degraded image, the above
equation sums all pixels values and divides them by the size
of the image represented by (m) and (n). Finally, the image
is enhanced using the following equation:
( )
( ) ( )
Where (x) is the degraded image, (min, max) are the
minimum and maximum pixel values of the processed
image, (K) is the enhancement variable, and (EI) is the
contrast improved image. The following flow chart
represents the enhancement methodology:
Figure4 :Contrast Enhancement Method
Image Registration: Image registration[12] is the process of
transforming different sets of data into one coordinate
system. Data may be multiple photographs, data from
different sensors, from different times, or from different
viewpoints.[1] It is used in computer vision, medical
imaging, military automatic target recognition, and
compiling and analyzing images and data from satellites.
Nisthula P, IJECS Volume2 Issue 6 June, year 2013 Page No.2012-2018 Page 2016
Registration is necessary in order to be able to compare or
integrate the data obtained from these different
measurements. Image registration essentially consists of
following steps Feature detection: Salient and distinctive
objects (closed-boundary regions, edges, contours, line
intersections, corners, etc) in both reference and sensed
images are detected.Feature matching: The correspondence
between the features in the reference and sensed image
established.Transform model estimation: The type and
parameters of the so-called mapping functions, aligning the
sensed image with the reference image, are estimated.Image
resampling and transformation: The sensed image is
transformed by means of the mapping functions.
Image resampling (RS): RS[12] is the procedure that
creates a new version of the original image with a different
width and height in pixels. Simply speaking, RS can change
the size of the image. Increasing the size is called
upsampling, for example. On the contrast, decreasing the
size is called downsamplig. Note that the spatial resolution
would not change after the RS procedure, either upsampling
or downsamplig.
Image normalization: A common problem associated with
the use of multisource image data is the grey value
differences caused by non-surface factors such as different
illumination, or sensor conditions. Such differences make it
difficult to compare images using same color metric system.
Image normalization[12] is required to reduce the radiometric
influences caused by non-surface factors and to ensure that
the grey value differences between temporal images reflect
actual changes.
4.2 EDGE DETECTION
Edge detection[1] is one of the fundamental steps in
image processing, image analysis, image pattern recognition
etc. Edge can outline the target objects profile, which is an
important attribute of extract from the images recognition.
Edge information in CT image is an important characteristic
because lung region contains an abundance of edges like
vessels, air tree, air sacs, artery branches etc.. In real world
applications, medical images contain object boundaries and
object shadows and noise. Therefore, they may be difficult
to distinguish
the exact edge from noise or trivial geometric features.
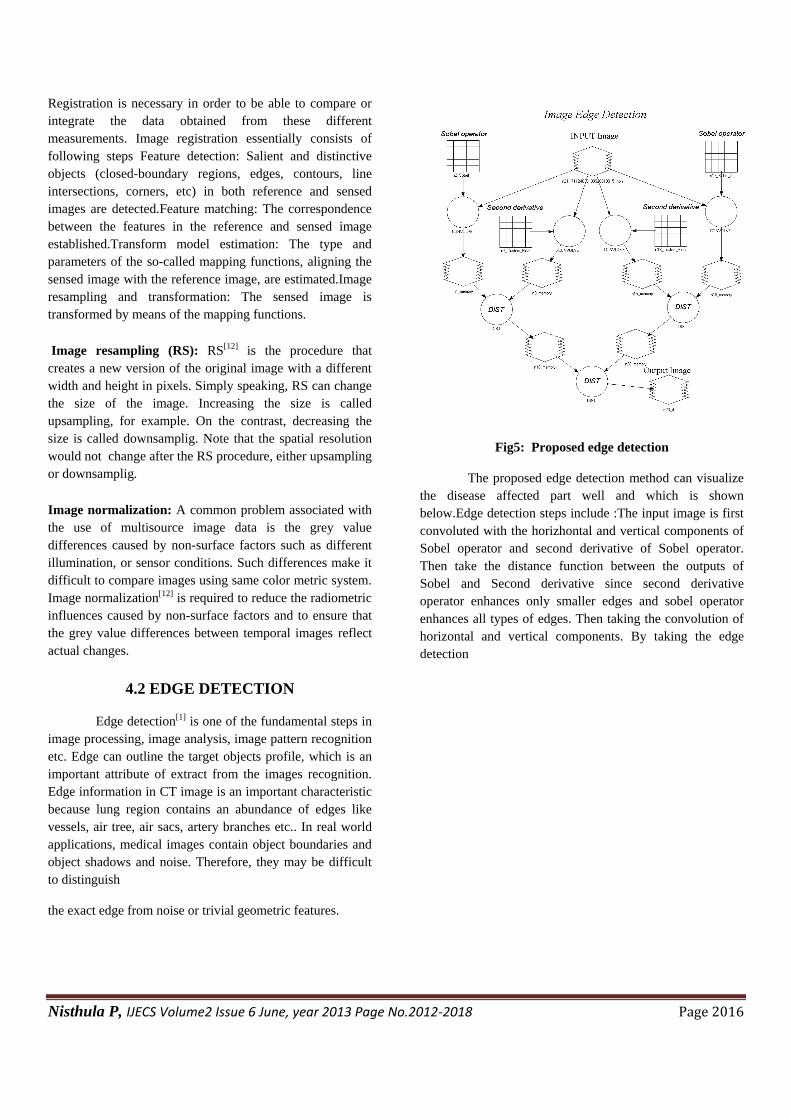
Fig5: Proposed edge detection
The proposed edge detection method can visualize
the disease affected part well and which is shown
below.Edge detection steps include :The input image is first
convoluted with the horizhontal and vertical components of
Sobel operator and second derivative of Sobel operator.
Then take the distance function between the outputs of
Sobel and Second derivative since second derivative
operator enhances only smaller edges and sobel operator
enhances all types of edges. Then taking the convolution of
horizontal and vertical components. By taking the edge
detection
Nisthula P, IJECS Volume2 Issue 6 June, year 2013 Page No.2012-2018 Page 2017
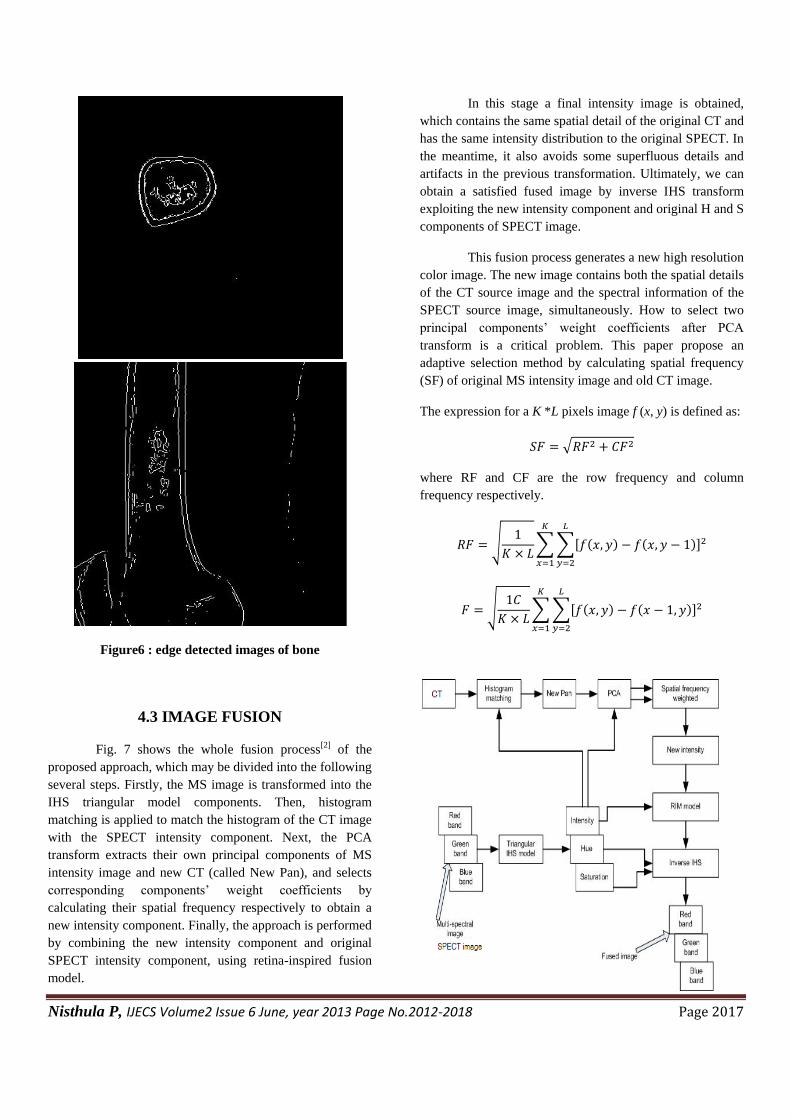
Figure6 : edge detected images of bone
4.3 IMAGE FUSION
Fig. 7 shows the whole fusion process[2] of the
proposed approach, which may be divided into the following
several steps. Firstly, the MS image is transformed into the
IHS triangular model components. Then, histogram
matching is applied to match the histogram of the CT image
with the SPECT intensity component. Next, the PCA
transform extracts their own principal components of MS
intensity image and new CT (called New Pan), and selects
corresponding components‟ weight coefficients by
calculating their spatial frequency respectively to obtain a
new intensity component. Finally, the approach is performed
by combining the new intensity component and original
SPECT intensity component, using retina-inspired fusion
model.
In this stage a final intensity image is obtained,
which contains the same spatial detail of the original CT and
has the same intensity distribution to the original SPECT. In
the meantime, it also avoids some superfluous details and
artifacts in the previous transformation. Ultimately, we can
obtain a satisfied fused image by inverse IHS transform
exploiting the new intensity component and original H and S
components of SPECT image.
This fusion process generates a new high resolution
color image. The new image contains both the spatial details
of the CT source image and the spectral information of the
SPECT source image, simultaneously. How to select two
principal components‟ weight coefficients after PCA
transform is a critical problem. This paper propose an
adaptive selection method by calculating spatial frequency
(SF) of original MS intensity image and old CT image.
The expression for a K *L pixels image f (x, y) is defined as:
√
where RF and CF are the row frequency and column
frequency respectively.
√
∑ ∑ ( ) ( )
√
∑ ∑ ( ) ( )
Nisthula P, IJECS Volume2 Issue 6 June, year 2013 Page No.2012-2018 Page 2018
Fig7. Proposed fusion method
The selection of two principal components‟ weight
coefficients based on SF can be depicted as:
Where , represent the principal component of New Pan
and original multispectral intensity component,
respectively. and are normalized SF values.
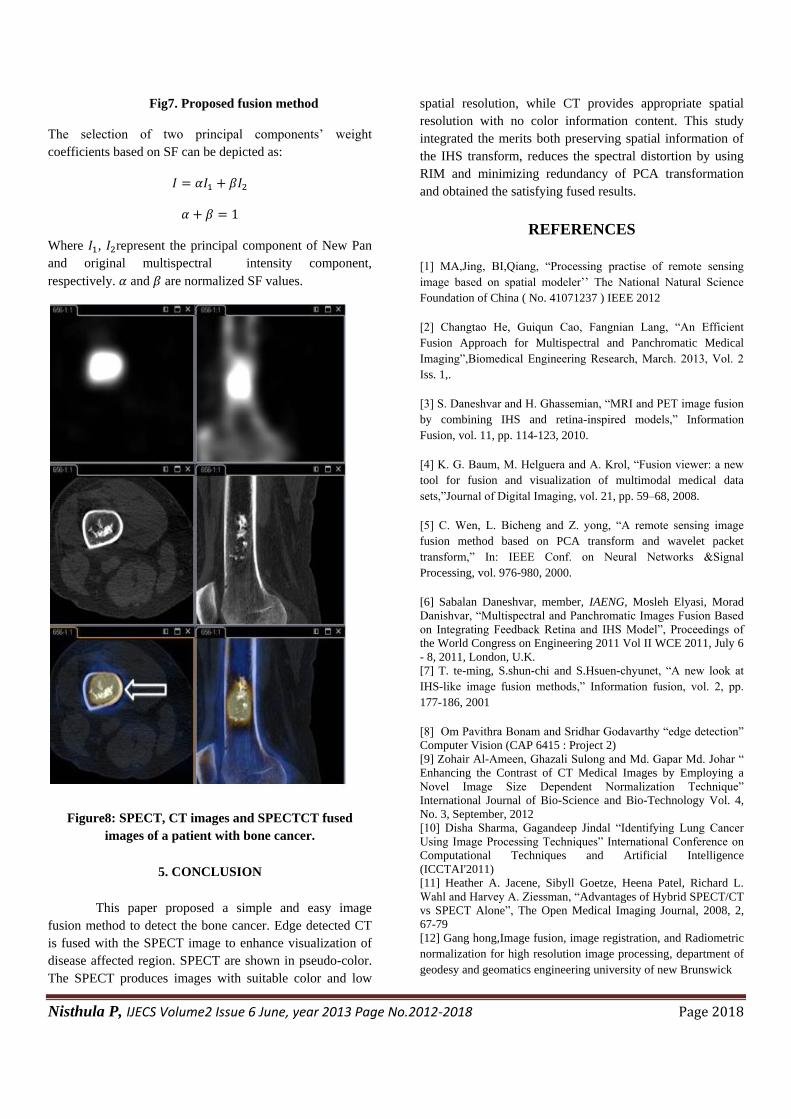
Figure8: SPECT, CT images and SPECTCT fused
images of a patient with bone cancer.
5. CONCLUSION
This paper proposed a simple and easy image
fusion method to detect the bone cancer. Edge detected CT
is fused with the SPECT image to enhance visualization of
disease affected region. SPECT are shown in pseudo-color.
The SPECT produces images with suitable color and low
spatial resolution, while CT provides appropriate spatial
resolution with no color information content. This study
integrated the merits both preserving spatial information of
the IHS transform, reduces the spectral distortion by using
RIM and minimizing redundancy of PCA transformation
and obtained the satisfying fused results.
REFERENCES
[1] MA,Jing, BI,Qiang, “Processing practise of remote sensing
image based on spatial modeler‟‟ The National Natural Science
Foundation of China ( No. 41071237 ) IEEE 2012
[2] Changtao He, Guiqun Cao, Fangnian Lang, “An Efficient
Fusion Approach for Multispectral and Panchromatic Medical
Imaging”,Biomedical Engineering Research, March. 2013, Vol. 2
Iss. 1,.
[3] S. Daneshvar and H. Ghassemian, “MRI and PET image fusion
by combining IHS and retina-inspired models,” Information
Fusion, vol. 11, pp. 114-123, 2010.
[4] K. G. Baum, M. Helguera and A. Krol, “Fusion viewer: a new
tool for fusion and visualization of multimodal medical data
sets,”Journal of Digital Imaging, vol. 21, pp. 59–68, 2008.
[5] C. Wen, L. Bicheng and Z. yong, “A remote sensing image
fusion method based on PCA transform and wavelet packet
transform,” In: IEEE Conf. on Neural Networks &Signal
Processing, vol. 976-980, 2000.
[6] Sabalan Daneshvar, member, IAENG, Mosleh Elyasi, Morad
Danishvar, “Multispectral and Panchromatic Images Fusion Based
on Integrating Feedback Retina and IHS Model”, Proceedings of
the World Congress on Engineering 2011 Vol II WCE 2011, July 6
- 8, 2011, London, U.K.
[7] T. te-ming, S.shun-chi and S.Hsuen-chyunet, “A new look at
IHS-like image fusion methods,” Information fusion, vol. 2, pp.
177-186, 2001
[8] Om Pavithra Bonam and Sridhar Godavarthy “edge detection”
Computer Vision (CAP 6415 : Project 2)
[9] Zohair Al-Ameen, Ghazali Sulong and Md. Gapar Md. Johar “
Enhancing the Contrast of CT Medical Images by Employing a
Novel Image Size Dependent Normalization Technique”
International Journal of Bio-Science and Bio-Technology Vol. 4,
No. 3, September, 2012
[10] Disha Sharma, Gagandeep Jindal “Identifying Lung Cancer
Using Image Processing Techniques” International Conference on
Computational Techniques and Artificial Intelligence
(ICCTAI'2011)
[11] Heather A. Jacene, Sibyll Goetze, Heena Patel, Richard L.
Wahl and Harvey A. Ziessman, “Advantages of Hybrid SPECT/CT
vs SPECT Alone”, The Open Medical Imaging Journal, 2008, 2,
67-79
[12] Gang hong,Image fusion, image registration, and Radiometric
normalization for high resolution image processing, department of
geodesy and geomatics engineering university of new Brunswick