Embed Size (px)
Citation preview
Biochimica et Biophysica Acta, 423 (1976) 203-216 Elsevier Scientific Publishing Company, Amsterdam - Printed in The Netherlands
BBA 47039
A POSSIBLE MECHANISM OF THE GENERATION OF SINGLET MOLECU- LAR OXYGEN IN NADPH-DEPENDENT MICROSOMAL LIPID PEROXIDA- TION
KATSUAKI SUGIOKA and M I N O R U N A K A N O
Department of Biochemistry, School of Medicine, Gunma University Maebashi, 371, Gunma (Japan)
(Received May 30th, 1975)
S U M M A R Y
A simplified system, consisting of NADPH, Fe 3 +-ADP, EDTA, liposomes, NADPH-cytochrome c reductase and Tris • HCI buffer (pH 6.8), has been employed in studies of the generation of singlet oxygen in NADPH-dependent microsomal lipid peroxidation.
The light emitted by the system involves ZAg type molecular oxygen identifiable by its characteristic emission spectrum and its behavior with fl-carotene. The genera- tion of another excited species (a compound in the triplet state) could be demonstrated in this system by changes of light intensity and emission spectra which arise from photosensitizer (9, 10-dibromoanthracene sulfonate, eosin, Rose-Bengal)-mediated energy transfers.
Chemiluminescence in the visible region was markedly quenched by various radical trappers and by an inhibitor of NADPH-cytochrome c reductase, but not by superoxide dismutase. During the early stage of lipid peroxidation, the intensity of chemiluminescence was proportional to the square of the concentration of lipid peroxide.
These characteristics suggest that singlet oxygen and a compound in the triplet state (probably a carbonyl comPound ) are generated by a self-reaction of lipid peroxy radicals.
INTRODUCTION
The unsaturated fatty acids of liver microsomal phospholipids readily undergo peroxidation in the presence of NADPH and oxygen [1, 2]. The NADPH-dependent flavoprotein, NADPH-cytochrome c reductase, catalyzes the peroxidation of isolated lipids [3] or lipoprotein [4] under similar conditions, provided that EDTA is present in appropriate concentration in the reaction system. EDTA in such reconstructed systems appears to elevate the redox potential of Fe 3+ and of the iron complex, facilitating thereby the transfer of one electron from NADPH to tri-valent iron through the flavin moiety of the reductase [4]. Reduced iron, free in the solution,
204
plays an important role in the initiation and propagation of phospholipid peroxida- tion [4, 5]. NADPH-dependent lipid peroxidation is usually accompanied with an emission of ultra weak light [4, 6, 7]. Recently the emitter in the NADPH-dependent microsomal lipid peroxidation system has been spectrometrically confirmed to be lag type singlet molecular oxygen [7].
Little is known, however, of the relationship between lipid peroxidation and 10 2 generation. The present work was undertaken to identify the mechanism of 10 2 generation during peroxidative cleavage of phospholipid in microsomes, using a simplified NADPH-dependent lipid peroxidation system (NADPH-NADPH-cyto- chrome c reductase-Fe 3 ÷-ADP-EDTA-liposomes).
MATERIALS AND METHODS
Reagents. ADP and 0c-tocopherol were obtained from Sigma. NADPH was purchased from Oriental Yeast Co. Ltd. The 9, 10-dibromoanthracene sulfonate (sodium salt) and fl-anthracene sulfonate (sodium salt) were kindly supplied by Professor G. Cilento. All other chemicals were of reagent grade, fl-Carotene, obtained from Tokyo Kasei Co., was purified by three crystallizations from a benzene/methanol mixture. The molar absorption at 4640 and 4940 A for crystalline fl-carotene in benzene was 11.0.104 and 9.4- 10 '~ M -1 • cm -~, respectively.
Enzyme preparation. Microsomal NADPH-cytochrome c reductase (spec. act., 18-25 pmol ferricytochrome c reduced/min per mg protein) was prepared from rat liver microsomes by established method [8]. Superoxide dismutase (spec. act., 2500 units/mg protein) was prepared from bovine red blood ceils and assayed in terms of its ability to inhibit (50 ~ ) the reduction of cytochrome c by milk xanthine oxidase by the method of McCord and Fridovich [9].
Preparation ofliposomes. The lipid was extracted from rat liver microsomes [2] by the method of Folch et al. [10] and the chloroform layer was then stored at --20 °C under anaerobic conditions. Just before the experiment, an aliquot of the chloroform solution was added to a I00 ml round bottomed flask and evaporated under reduced pressure. In some cases fl-carotene or ~-tocopherol in chloroform was mixed with the chloroform solution of the microsomal lipid, and evaporated to dryness as described above. Distilled water was then added to the flask and the lipids (with or without added chemicals) were thoroughly agitated by means of a Vortex mixer until the lipid film was no longer detectable on the sides of flask.
The amount of lipid was measured as lipid phosphorous by a modification of the method of Bartlett [11 ].
Preparation of malondialdehyde. Malondialdehyde in free form was prepared by NADPH-dependent microsomal lipid peroxidation [2]. Malondialdehyde-bis- bisulfate (sodium salt) was obtained by treating malondialdehyde-bis(dimethylacetal) with aqueous HC1 and mixing it with sodium meta-bisulfite [12]. The free form was then obtained by its hydrolysis in 1 M HCI for 20 min at room temperature. Both the enzymatically and chemically prepared malondialdehyde in free form was then purified by gel filtration on Sephadex G-10 column, using 0.1 M potassium phos- phate/NaC1 buffer at pH 7.2 [2].
Incubation conditions. The standard reaction mixture consisted of liposomes (0.43 #tool phosphate per ml of incubation mixture), 1 • 10 -4 M Fe(NO3)3, 1.67 mM
205
ADP, 5 • 10- 5 M E D T A , 0.16 m M N A D P H , N A D P H - c y t o c h r o m e c reductase (0.5 unit) and 0.1 M Tr is . HC1 buffer (pH 6.8) in a total volume o f 3 ml.
In some experiments components such as superoxide dismutase, radical scavengers and SH inhibitor were added to the s tandard incubat ion mixture to examine their effect on light emission or N A D P H consumption. Unless otherwise noted, incubat ion was carried out at 37 °C.
Other methods. N A D P H disappearence and malortdialdehyde format ion were measured by previously described methods [4]. Lipid peroxide was determined by iodometry [13]. The excitation and fluorescence spectra o f dye in 0.1 M Tris • HCI buffer (pH 6.8) and of malondialdehyde in 0.1 M potassium phospha te /NaCl buffer at p H 7.2 were determined by means o f a Hitachi Model 203 fluorescence spectrom- eter. The excitation energy (kcal/mol) of the dye was calculated f rom its excitation wavelength (2 as A) according to the equat ion (E = 2 .8589 .108 ca l . 2 - 1 . mol -1 ) . Luminescence was measured by means o f a single photoelectron [14] and Packard Model-2311 liquid scintillation counter with the coincidence circuit off [15]. The emission spectrum was determined as previously described [7].
RESULTS
(1) Factors which promote light emission. To test the effect o f 02 concentrat ions on light emission, the reaction mixture containing N A D P H - c y t o c h r o m e c reductase, F e 3 + - A D P - E D T A , and liposomes was flushed with air or 100 % 02 for 30 s and chemiluminescence in both systems was compared after the addit ion o f N A D P H . In
I0 0 ILl (/3
o 8
)<
P--4 Z
0 0 2
I
I
A Z
I I I I
0 20 40 60
MIN
IC
¢n
o_e
x 6
~-4
8 2
I I I
0 20 40 60 MIN
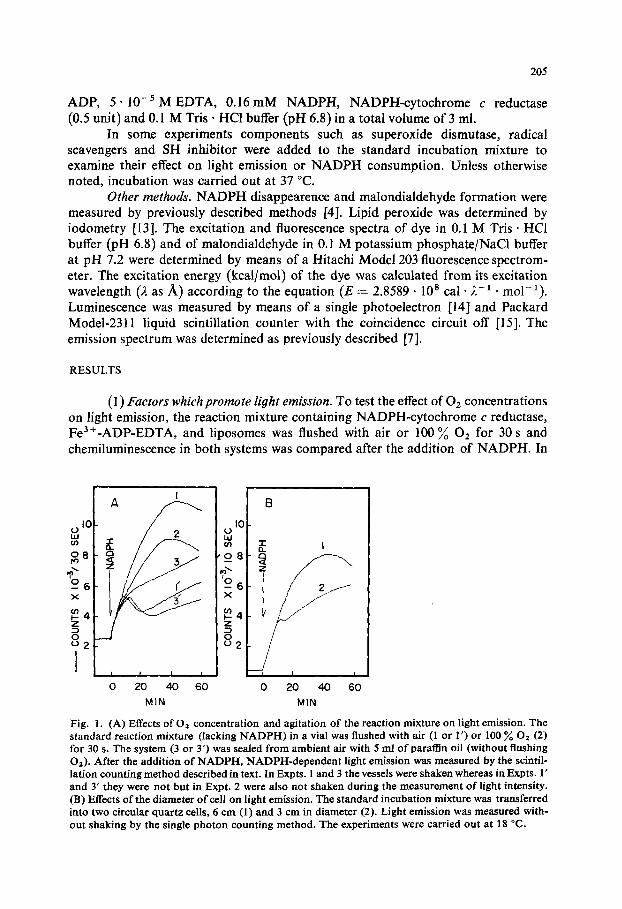
Fig. 1. (A) Effects of 02 concentration and agitation of the reaction mixture on light emission. The standard reaction mixture (lacking NADPH) in a vial was flushed with air (1 or 1 ') or 100 % 02 (2) for 30 s. The system (3 or 3') was sealed from ambient air with 5 ml of paraffin oil (without flushing 02). After the addition of NADPH, NADPH-dependent light emission was measured by the scintil- lation counting method described in text. In Expts. 1 and 3 the vessels were shaken whereas in Expts. 1' and 3" they were not but in Expt. 2 were also not shaken during the measurement of light intensity. (B) Effects of the diameter of cell on light emission. The standard incubation mixture was transferred into two circular quartz ceils, 6 cm (1) and 3 cm in diameter (2). Light emission was measured with- out shaking by the single photon counting method. The experiments were carried out at 18 °C.
206
some experiments the reaction mixture was shielded from air by paraffin oil. Light emission was then measured with or without shaking for a 20-s interval per 1 min at room temperature, using a Packard Model-2311 liquid scintillation counter with its coincidence circuit turned off. As shown in Fig. 1A, the system requires both O2 and agitation for a continuous increase in light emission. The relation between chemi- luminescence and liquid height of the reaction mixture was also studied by our single photon counting method. The reaction mixture with NADPH omitted (2.9 ml) in each of two types of circular quartz cells (3.0 cm in diameter and 6.0 cm in diam- eter) was placed for 5 min in front of head-on type photomultiplier in a single photon counter.
After obtaining the background counts, NADPH-dependent luminescence was then measured after the addition of NADPH without shaking during the reaction. Fig. 1B shows that the level of liquid and the surface area are important factors in the continued increase of light emission by this system. The light intensity obtained with a wide quartz cell (6.0 cm in diameter) by the single photon counting method (Method 1) correlated well with those obtained with shaking of vial (2.3 cm in diameter) in a liquid scintillation counter (Method 2). Unless otherwise noted, light intensity was expressed in terms of counts per 10 s (or 30 s) corrected for background. With identical systems, NADPH-induced light intensity measured by Method I is approx. three times greater than that measured by Method 2. In the following experiments, either Method 1 or Method 2 was employed for the detection of light intensity. Boiling of the liposomes for 5 min increased the background counts slightly. Omission of either Fe 3 ÷ or NADPH-cytochrome c reductase from the standard mixture did not produce NADPH-dependent light emission. However, omission of EDTA produced detectable light emission which increased linearly in intensity for more than 600 s after the addition of NADPH. This corresponded to about one-fourth of the light intensity of the complete system.
(2) Effect of enzyme and liposome concentrations on lioht emission. When both the initial light intensity (counts at 500 s after the addition of NADPH) and maximal light intensity were measured at a fixed enzyme concentration of 0.17 unit per ml of incubation mixture, both were first order with respect to phospholipid concentration (up to 0.4 #mol phosphate per ml of incubation mixture). With a fixed phospholipid concentration of 0.4 #mol phosphate per ml of the incubation mixture, either NADPH- dependent initial light intensity or maximal light intensity was proportional to the enzyme concentration (up to 0.2 unit per ml of the incubation mixture).
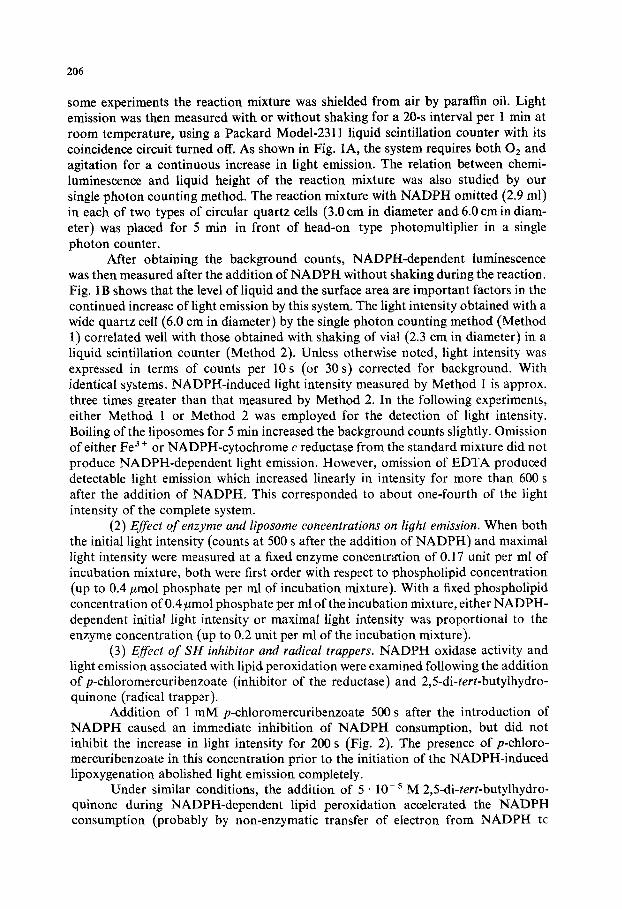
(3) Effect of SH inhibitor and radical trappers. NADPH oxidase activity and light emission associated with lipid peroxidation were examined following the addition ofp-chloromercuribenzoate (inhibitor of the reductase) and 2,5-di-tert-butylhydro- quinone (radical trapper).
Addition of 1 mM p-chloromercuribenzoate 500 s after the introduction of NADPH caused an immediate inhibition of NADPH consumption, but did not inhibit the increase in light intensity for 200 s (Fig. 2). The presence of p-chloro- mercuribenzoate in this concentration prior to the initiation of the NADPH-induced lipoxygenation abolished light emission completely.
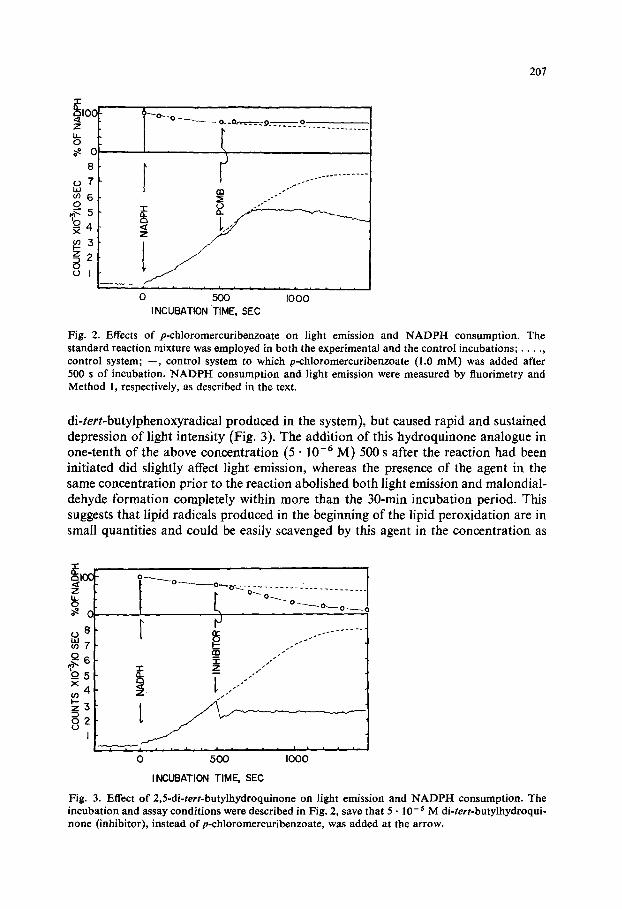
Under similar conditions, the addition of 5 • 10- s M 2,5-di-tert-butylhydro- quinone during NADPH-dependent lipid peroxidation accelerated the NADPH consumption (probably by non-enzymatic transfer of electron from NADPH tc
207
~100 z I..L O
8
( . )7 U) 6 0 - - 5
p_3
I
m
0 500 I000 INCUBATION TIME, SEC
Fig. 2. Effects o f p -ch loromercur ibenzoa te on light emiss ion and N A D P H consumpt ion . The s t andard react ion mixture was employed in bo th the exper imenta l and the control incubat ions ; . . . . , control system; - - , control sys tem to which p-ch loromercur ibenzoa te (1.0 m M ) was added after 500 s o f incubat ion . N A D P H c o n s u m p t i o n and l ight emiss ion were measu red by f luorimetry and Method 1, respectively, as described in the text.
di-tert-butylphenoxyradical produced in the system), but caused rapid and sustained depression of light intensity (Fig. 3). The addition of this hydroquinone analogue in one-tenth of the above concentration (5 • 10 -6 M) 500 s after the reaction had been initiated did slightly affect light emission, whereas the presence of the agent in the same concentration prior to the reaction abolished both light emission and malondial- dehyde formation completely within more than the 30-min incubation period. This suggests that lipid radicals produced in the beginning of the lipid peroxidation are in small quantities and could be easily scavenged by this agent in the concentration as
! ! . . j- L j
i / 5 _
0 500 I000
INCUBATION TIME, SEC
Fig. 3. Effect o f 2,5-di-tert-butylhydroquinone on light emiss ion and N A D P H consumpt ion . The incuba t ion and assay condi t ions were described in Fig. 2, save tha t 5 • 10 -5 M di-tert-butylhydroqui- none (inhibitor), ins tead o fp -ch lo romercur ibenzoa te , was added at the arrow.
208
_ P ° F - ~ - ° , 1
!+° n--
c.)
~ e a <Z INHIBITOR, NXIO "6 0 7 Z
r - ,
~ " 6 o
8 2 V- . . . . . . I .....
0 200 400 600 800 I000 1200 1400 • INCUBATION TIME ,SEC
Fig. 4. Measurements of lag time of light emission and chemiluminescence slope. The control (curve 1) and experimental (curve 2) systems were identical with the standard reaction mixture save that the latter contained a radical scavenger. 2,5-di-tert-butylhydroquinone (2,5/~M) was added to the reaction mixture (lacking NADPH). NADPH was then added at 0 s to initiate the reaction. The lag time indicated on the figure was measured from zero to the time at which a line tangent to the light intensity (luminescence slope) intersects the "time axis". Prolongation of lag time by this hydroqui- none was calculated the lag time in its absence and its presence, The relationship between the con- centration of this hydroquinone and the luminescence slope was obtained by plotting each value estimated (as described above) versus concentration of the inhibitor (inset).
+1 ~2 ~ 6 Z U.I
~ 4
I ~ 2 _J
I 0 2 4 6 8 I0 12 14 INCUBATION TIME, MIN
Io 3-
B / /° /
I I I I I i I
I 2 5 4 5 6 7 {,/3-CAROTENE] XIO 4, M
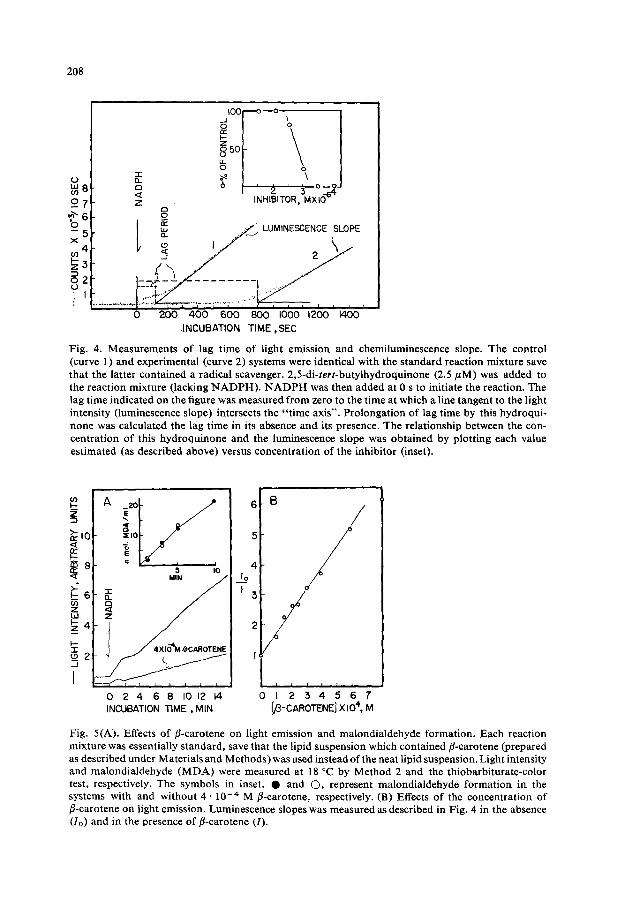
Fig. 5(A). Effects of fl-carotene on light emission and malondialdehyde formation. Each reaction mixture was essentially standard, save that the lipid suspension which contained fl-carotene (prepared as described under Materials and Methods) was used instead of the neat lipid suspension. Light intensity and malondialdehyde (MDA) were measured at 18 °C by Method 2 and the thiobarbiturate-color test, respectively. The symbols in inset, • and (3, represent malondialdehyde formation in the systems with and without 4 . 1 0 -+ M fl-carotene, respectively. (B) Effects of the concentration of fl-carotene on light emission. Luminescence slopes was measured as described in Fig. 4 in the absence (I0) and in the presence of fl-carotene (I).
209
low as 5 • 10 -6 M thereby facilitating the inhibition of a propagative formation of the precursor of light species.
(4) Potency of various antioxidants. Potencies of agents which inhibit chemi- luminescence associated with lipoxygenation can be tested by the addition of these agents prior to the reaction. Their effects can be expressed in terms of the minimum concentration (ktM) required to produce a 50 ~ decrease in the luminescence slope (quenching potency). Fig. 4 shows the effects of 2,5-di-tert-butylhydroquinone and indicates the luminescence slope and lag time measured in our experiments. Lag time was prolonged with increasing amount of the hydroquinone analogue. Under our assay conditions, the quenching potencies of 2,5-di-tert-butylhydroquinone, 2,6- diiodo-4-hydroxyphenol, 2-butyl-4-methoxyphenol and ~-tocopherol were found to be 2.8, 2.8, 5.0 and 600, respectively.
(5) Effects of 102 and 02 -" scavengers on light emission. Under assay conditions similar to those employed in testing the quenching potency of the antioxidant, r- carotene [16, 17] (a known quencher of lag type oxygen) and superoxide dismutase [18] (a known scavenger of 02 -") were tested as possible inhibitors of light emission.
In contrast to the radical trappers, r-carotene was found to produce a decrease in the slope of chemiluminescence without prolongation of the lag period nor depres- sion of malondialdehyde formation (Fig. 5A). The absorption spectra (4000--6000 A) of benzene extracts obtained from reaction mixtures before and after the incubation were identical to that of r-carotene in benzene, indicating that r-carotene was not altered during lipid peroxidation. As shown in Fig. 5B, kinetically this compound acted as quencher which obeys the Stern - Volmer formula for all types of quenching mechanisms:
lo/1 = 1 ÷krofA]
Where lo/I, k, [A] and Vo represent the ratio of the unquenched to the quenched intensity of chemiluminescence in terms of the chemiluminescence slope, the quench- ing rate constant, the quencher concentration and the actual life time of an excited species in the absence of A. From the data shown in Fig. 5B, the k ~'o (slope) was calculated to be 8 • 103 M -1. Assuming a life time of the light species (as 102) in water of 2 • 10 -6 S [19], the rate constant in the above equation is 4 • 1 0 9 s - 1 • M - 1
(i.e. about one-tenth of the k in benzene [20]). Intact superoxide dismutase at a concentration of 1/zM, known to scavenge
more than 70~ of 02 -" generated in a system with 3.3.10-4 M xanthine and xanthine oxidase (0.9 unit per ml of the incubation mixture) at pH 6.8 [4], produced 37-40 inhibition of the chemiluminescence slope and 25 ~o inhibition ofmalondialdehyde for- mation without prolongation of lag time. On the other hand, heat-inactivated super- oxide dismutase produced 18-20 ~ inhibition of the chemiluminescence slope and 8-10 ~ inhibition of malondialdehyde formation.
Light emission under the same conditions during 20 min in the presence of intact superoxide dismutase was found to be 80 ~ of that emitted in the presence of heat-inactivated dismutase. This indicates that enzyme-catalyzed inhibition is slight.
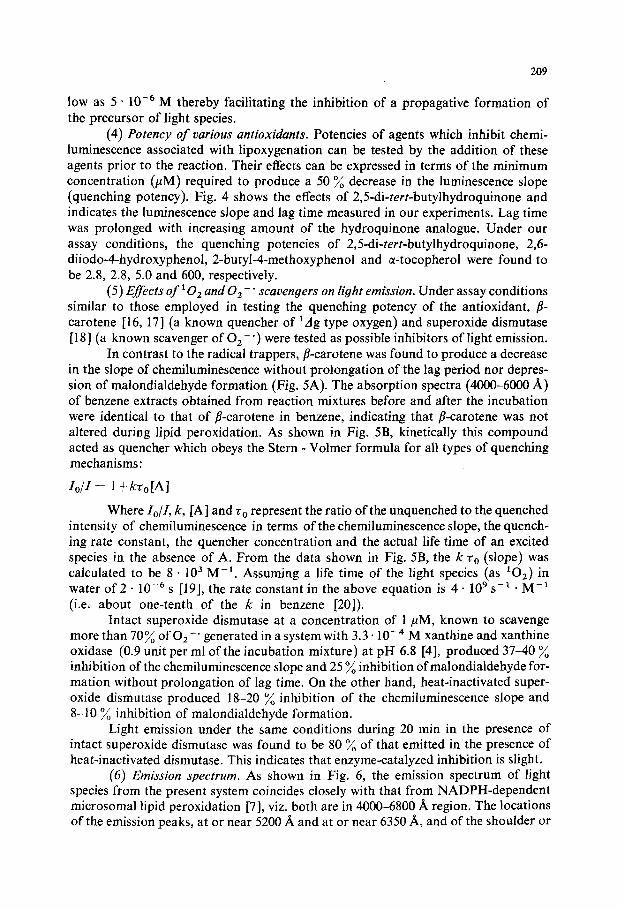
(6) Emission spectrum. As shown in Fig. 6, the emission spectrum of light species from the present system coincides closely with that from NADPH-dependent microsomal lipid peroxidation [7], viz. both are in 4000-6800 A region. The locations of the emission peaks, at or near 5200 A and at or near 6350 A, and of the shoulder or
210
(o,o) (2,o) (ho) (o.o} (o.I)
;,- 1.0 ~ . I - -
t, l.I
z :' ",,..,/
W.5 _>
W
i • i • I i i i 1 I i i t i I
5000 6000 7000 WAVELENGTH
Fig. 6. Emission spectrum of light species in the reconstructed microsomal lipid peroxidation system. Spectral analysis was carried out after the addition of N A D P H to the standard reaction mixture (lacking NADPI-I). Each point (©) is the average of two experiments. Dotted line indicates the spectrum of light emission from the NADPH-dependent microsomal system (data taken from the report of Nakano et al. [7]). Arrows indicate the location of the band labeled according to upper electronic state by energy conversion with vibronic components (after Kahn and Kasha [23]).
distinct peak at near 5800 A also coincide with those from a H202/NaOC1/NH3 aqueous system [7]. It seems likely therefore that the simplified lipid peroxidation system produces, at the least, tag type-singlet molecular oxygen identical to that observed in the complicated microsomal NADPH-dependent system. It may be postulated that the above three emission peaks (or the two bands and the shoulder) in the observed spectrum represent pairs of metastable 1A g molecules in binary collisions identical with those observed with chemically produced IO2 in an aqueous solution [21, 22].
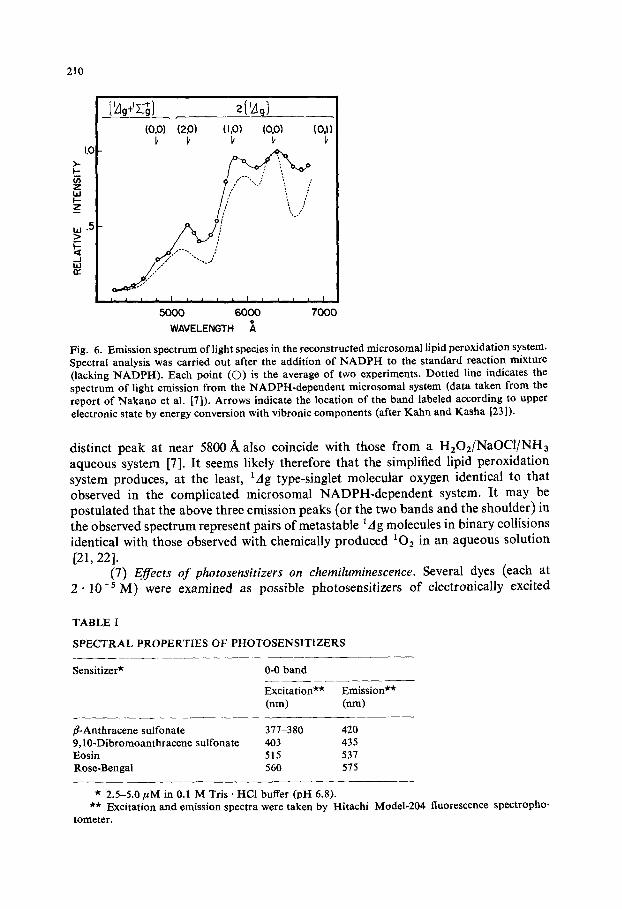
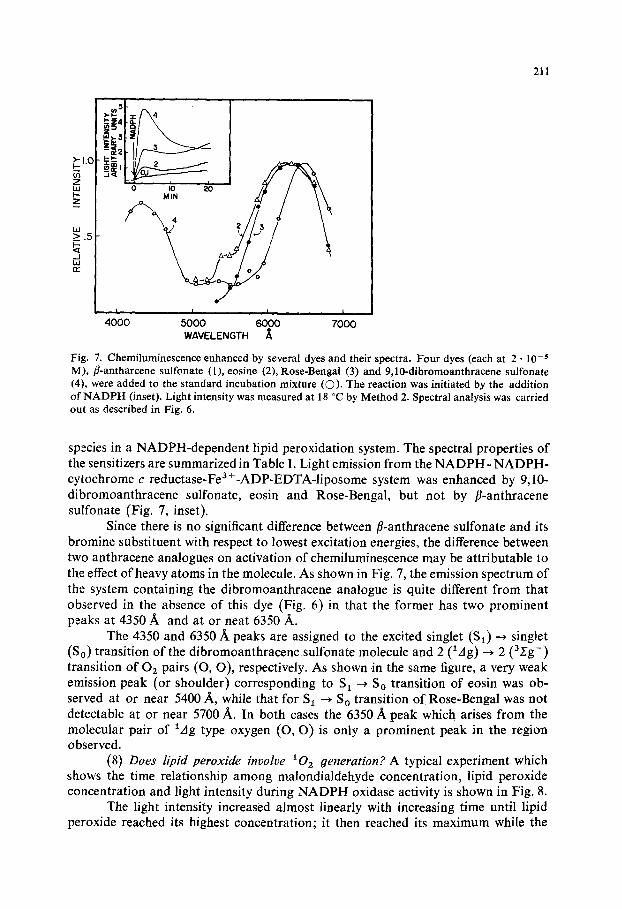
(7) Effects of photosensitizers on chemiluminescence. Several dyes (each at 2 .10 -5 M) were examined as possible photosensitizers of electronically excited
TABLE I
SPECTRAL PROPERTIES OF PHOTOSENSITIZERS
Sensitizer* 0-0 band
Excitation** Emission** (nm) (nm)
fl-Anthracene sulfonate 377-380 420 9,10-Dibromoanthracene sulfonate 403 435 Eosin 515 537 Rose-Bengal 560 575
* 2.5-5.0 # M in 0.1 M Tris • HCI buffer (pH 6.8). ** Excitation and emission spectra were taken by Hitachi Model-204 fluorescence spectropho.
tometer.
211
l ,-~5t. F~4
>-IO ~.~ 2 r "a~c ' ( /x~ I-- " ~ 1
o . , . 2 / iX
i \ J/ I
i i I
4000 5000 6000 7000 WAVELENGTH ,~
Fig. 7. Chemiluminescence enhanced by several dyes and their spectra. Four dyes (each at 2 • 10 - s M), fl-antharcene sulfonate (1), cosine (2), Rose-Bengal (3) and 9,10-dibromoanthracene sulfonate (4), were added to the standard incubation mixture (O). The reaction was initiated by the addition of NADPH (inset). Light intensity was measured at 18 °C by Method 2. Spectral analysis was carried out as described in Fig. 6.
species in a NADPH-dependent lipid peroxidation system. The spectral properties of the sensitizers are summarized in Table I. Light emission from the NADPH- NADPH- cytochrome c reductase-Fea+-ADP-EDTA-liposome system was enhanced by 9,10- dibromoanthracene sulfonate, eosin and Rose-Bengal, but not by fl-anthracene sulfonate (Fig. 7, inset).
Since there is no significant difference between fl-anthracene sulfonate and its bromine substituent with respect to lowest excitation energies, the difference between two anthracene analogues on activation of chemiluminescence may be attributable to the effect of heavy atoms in the molecule. As shown in Fig. 7, the emission spectrum of the system containing the dibromoanthracene analogue is quite different from that observed in the absence of this dye (Fig. 6) in that the former has two prominent peaks at 4350 A and at or neat 6350 A.
The 4350 and 6350/~ peaks are assigned to the excited singlet ($1) ~ singlet (So) transition of the dibromoanthracene sulfonate molecule and 2 (lAg) ~ 2 (3,rg-) transition of 02 pairs (O, O), respectively. As shown in the same figure, a very weak emission peak (or shoulder) corresponding to S1 ~ So transition of eosin was ob- served at or near 5400 A, while that for S 1 ~ S O transition of Rose-Bengal was not detectable at or near 5700 A. In both cases the 6350 A peak which arises from the molecular pair of lag type oxygen (O, O) is only a prominent peak in the region observed.
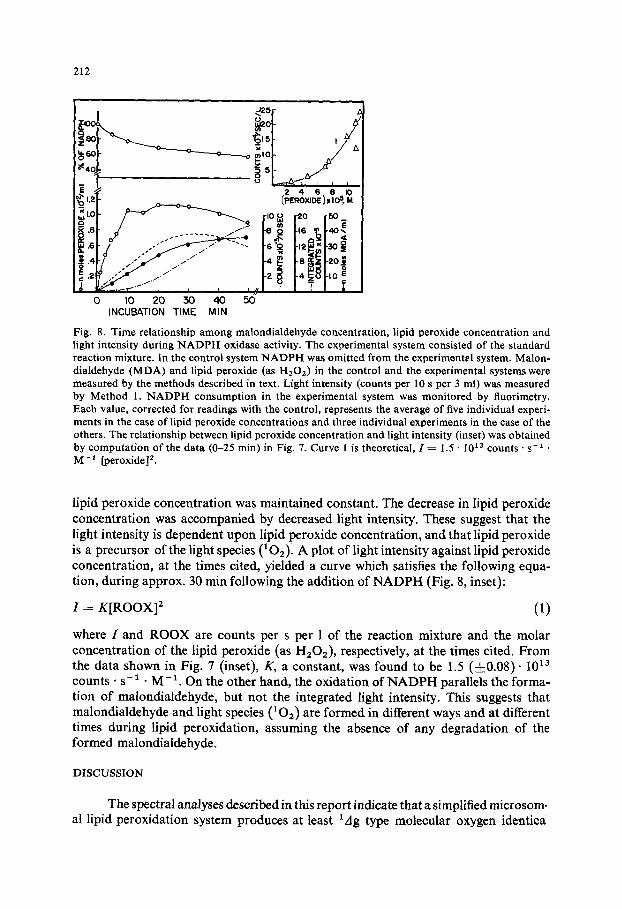
(8) Does lipid peroxide involve 102 generation? A typical experiment which shows the time relationship among malondialdehyde concentration, lipid peroxide concentration and light intensity during NADPH oxidase activity is shown in Fig. 8.
The light intensity increased almost linearly with increasing time until lipid peroxide reached its highest concentration; it then reached its maximum while the
212
~ ~ z 4 e e ~o 1.2[" [PEROXIDE J X I05~ M
~,.o1 ~ r,O..q r'ZO rSO -=.8 t * ,8
~ - s t / ..-'~." "'- t8 Q t , ~ _ ~ t 3 o , ,
0 I0 20 5O 4O 5O INCUBATION TIME MIN
Fig. 8. Time relationship among malondialdehyde concentration, lipid peroxide concentration and light intensity during NADPH oxidase activity. The experimental system consisted of the standard reaction mixture. In the control system NADPH was omitted from the experimental system. Malon- dialdehyde (MDA) and lipid peroxide (as H202) in the control and the experimental systems were measured by the methods described in text. Light intensity (counts per 10 s per 3 ml) was measured by Method 1. NADPH consumption in the experimental system was monitored by fluorimetry. Each value, corrected for readings with the control, represents the average of five individual experi- ments in the case of lipid peroxide concentrations and three individual experiments in the case of the others. The relationship between lipid peroxide concentration and light intensity (inset) was obtained by computation of the data (0-25 rain) in Fig. 7. Curve 1 is theoretical, 1 = 1.5 • I0 ~ counts • s -~ • M -1 [peroxide] 2.
lipid peroxide concentra t ion was maintained constant. The decrease in lipid peroxide concentra t ion was accompanied by decreased light intensity. These suggest that the light intensity is dependent u p o n lipid peroxide concentrat ion, and that lipid peroxide is a precursor o f the light species (102) ' A plot of light intensity against lipid peroxide concentrat ion, at the times cited, yielded a curve which satisfies the following equa- tion, during approx. 30 rain following the addit ion of N A D P H (Fig. 8, inset):
I = K [ R O O X ] 2 (1)
where I and R O O X are counts per s per 1 o f the reaction mixture and the molar concentra t ion o f the lipid peroxide (as H202) , respectively, at the times cited. F r o m the data shown in Fig. 7 (inset), K, a constant , was found to be 1.5 ( ± 0 . 0 8 ) . 1013 counts • s - 1. M - 1. On the other hand, the oxidation o f N A D P H parallels the forma- tion o f malondialdehyde, but not the integrated light intensity. This suggests that malondialdehyde and light species (102) are fo rmed in different ways and at different times during lipid peroxidation, assuming the absence o f any degradation o f the formed malondialdehyde.
D I S C U S S I O N
The spectral analyses described in this repor t indicate that a simplified microsom- al lipid peroxidat ion system produces at least l a g type molecular oxygen identical
213
with that formed by a NADPH-dependent intact rnicrosomal system [7]. Kinetic studies of the effect of fl-carotene on light emission by the system also support the conclusion that the involved light species is 102 .
In contrast to the observation that 10 2 (generated by photosensitization or radio frequency discharge) does cause peroxidation of liposomal lipid which is prevented by fl-carotene [ 17, 24], fl-carotene had no effect on our NADPH-dependent peroxidation. This discrepancy may be attributable to the reason that in the NADPH- dependent system lipid peroxidation proceeds by means of free radical chain mecha- nism which is much more dominating than the lipid peroxidation involving 102 (produced as a by-product).
In view of the finding that the chemiluminescence in the system was markedly inhibited by radical scavengers but not affected significantly by superoxide dismutase, it seems likely that 102 is formed by some reaction involving radical interaction, but not by the reaction: O2 ~q-O2 = zn~. H202q-lO2.
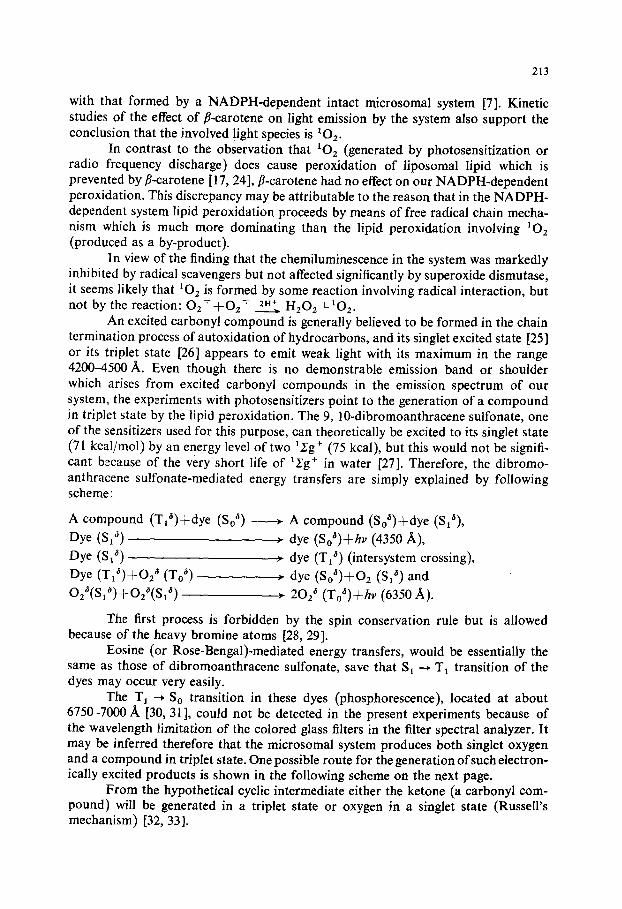
An excited carbonyl compound is generally believed to be formed in the chain termination process of autoxidation of hydrocarbons, and its singlet excited state [25] or its triplet state [26] appears to emit weak light with its maximum in the range 4200-4500 A. Even though there is no demonstrable emission band or shoulder which arises from excited carbonyl compounds in the emission spectrum of our system, the experiments with photosensitizers point to the generation of a compound in triplet state by the lipid peroxidation. The 9, 10-dibromoanthracene sulfonate, one of the sensitizers used for this purpose, can theoretically be excited to its singlet state (71 kcal/mol) by an energy level of two 1,rg+ (75 kcal), but this would not be signifi- cant because of the very short life of 1Sg+ in water [27]. Therefore, the dibromo- anthracene sulfonate-mediated energy transfers are simply explained by following scheme:
A compound (Tl~)+dye (So 6) -- Dye (S1 a) Dye (S1 ~)
Dye (T16)q-O2 ~ (To a) -
02~(81d)-~02~(516)
.-- A compound (SoS)+dye (Sla),
, dye (So~)+hv (4350 A), dye (T1 *) (intersystem crossing),
, dye (So~)+O2 ($1 *) and , 202 a (To')+hv (6350 A).
The first process is forbidden by the spin conservation rule but is allowed because of the heavy bromine atoms [28, 29].
Eosine (or Rose-Bengal)-mediated energy transfers, would be essentially the same as those of dibromoanthracene sulfonate, save that $1 ~ T1 transition of the dyes may occur very easily.
The T 1 ~ So transition in these dyes (phosphorescence), located at about 6750-7000 A [30, 31], could not be detected in the present experiments because of the wavelength limitation of the colored glass filters in the filter spectral analyzer. It may be inferred therefore that the microsomal system produces both singlet oxygen and a compound in triplet state. One possible route for the generation of such electron- ically excited products is shown in the following scheme on the next page.
From the hypothetical cyclic intermediate either the ketone (a carbonyl com- pound) will be generated in a triplet state or oxygen in a singlet state (Russell's mechanism) [32, 33].
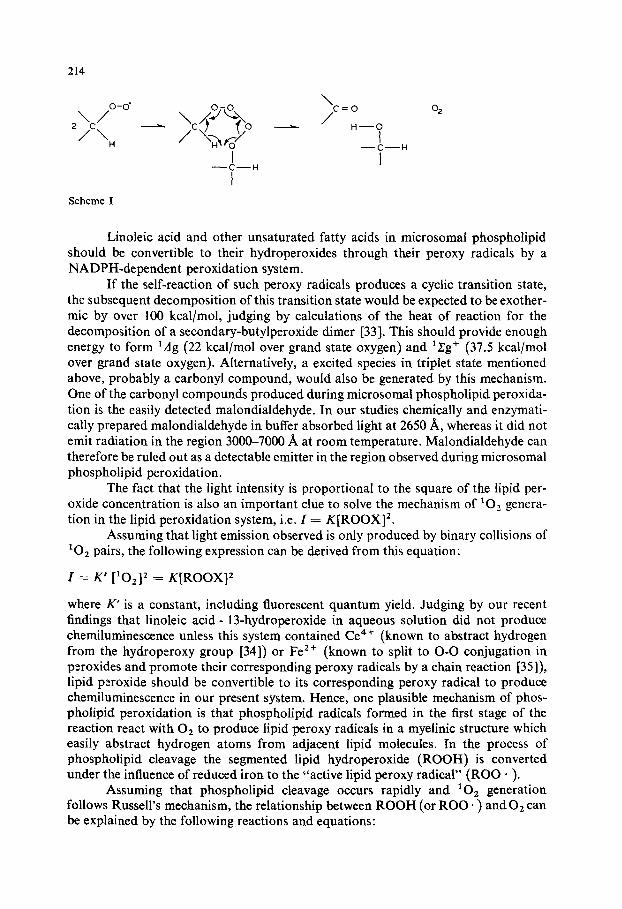
214
o-o" o - o ~ c = o \ / \ x / z/c\ - - c j ~ o - H - - o
- - C - - H
- - C - - H
I Scheme I
%
Linoleic acid and other unsaturated fatty acids in microsomal phospholipid should be convertible to their hydroperoxides through their peroxy radicals by a NADPH-dependent peroxidation system.
If the self-reaction of such peroxy radicals produces a cyclic transition state, the subsequent decomposition of this transition state would be expected to be exother- mic by over 100 kcal/mol, judging by calculations of the heat of reaction for the decomposition of a secondary-butylperoxide dimer [33]. This should provide enough energy to form lAg (22 kcal/mol over grand state oxygen) and 1Zg+ (37.5 kcal/mol over grand state oxygen). Alternatively, a excited species in triplet state mentioned above, probably a carbonyl compound, would also be generated by this mechanism. One of the carbonyl compounds produced during microsomal phospholipid peroxida- tion is the easily detected malondialdehyde. In our studies chemically and enzymati- cally prepared malondialdehyde in buffer absorbed light at 2650 A, whereas it did not emit radiation in the region 3000--7000 )k at room temperature. Malondialdehyde can therefore be ruled out as a detectable emitter in the region observed during microsomal phospholipid peroxidation.
The fact that the light intensity is proportional to the square of the lipid per- oxide concentration is also an important clue to solve the mechanism of 10 2 genera- tion in the lipid peroxidation system, i.e. I = K[ROOX] 2,
Assuming that light emission observed is only produced by binary collisions of tO 2 pairs, the following expression can be derived from this equation:
l = g ' [ 1 0 2 1 2 = K[ROOX] 2
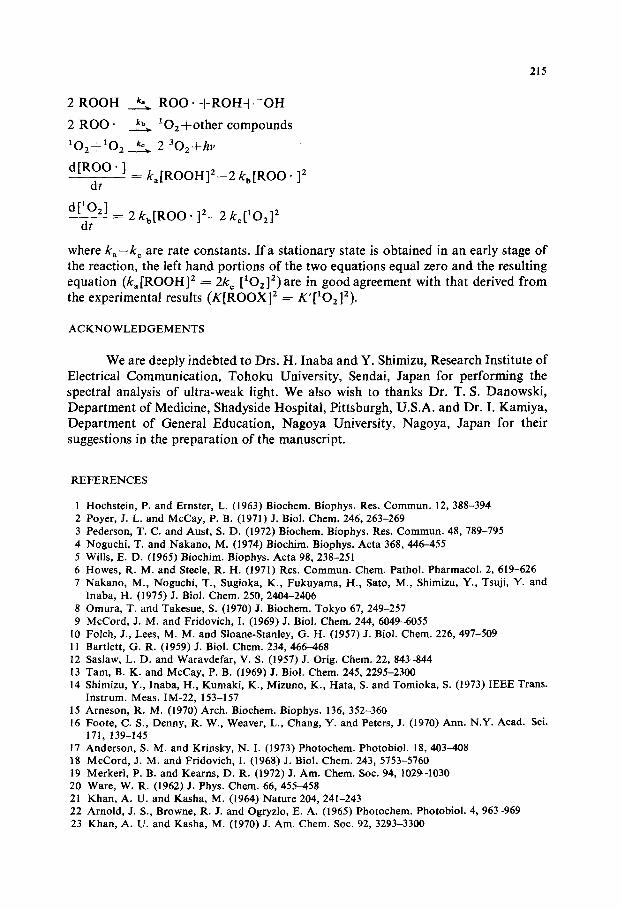
where K' is a constant, including fluorescent quantum yield. Judging by our recent findings that linoleic acid- 13-hydroperoxide in aqueous solution did not produce chemiluminescence unless this system contained Ce 4+ (known to abstract hydrogen from the hydroperoxy group [34]) or Fe 2+ (known to split to O-O conjugation in peroxides and promote their corresponding peroxy radicals by a chain reaction [35]), lipid peroxide should be convertible to its corresponding peroxy radical to produce chemiluminescence in our present system. Hence, one plausible mechanism of phos- pholipid peroxidation is that phospholipid radicals formed in the first stage of the reaction react with 02 to produce lipid peroxy radicals in a myelinic structure which easily abstract hydrogen atoms from adjacent lipid molecules. In the process of phospholipid cleavage the segmented lipid hydroperoxide (ROOH) is converted under the influence of reduced iron to the "active lipid peroxy radical" (ROO • ).
Assuming that phospholipid cleavage occurs rapidly and 102 generation follows Russell's mechanism, the relationship between ROOH (or ROO-) andO2 can be explained by the following reactions and equations:
215
2 R O O H
2 R O O "
1 ~_1 O21 02
d [ R O O • ]
dt
k% RO0" + R O H + - O H
kb ~O2+other compounds k% 2 30a+hv
_ _ k a [ R O O H ] 2 2 k b [ R O O . ] 2
d[102]
dt - - 2 k b [ R O O • ] 2 - - 2 k e [ I O 2 ] 2
where ka--k ~ are rate constants. I fa stationary state is obtained in an early stage of the reaction, the left hand portions of the two equations equal zero and the resulting equation (ka[ROOH] 2 = 2k¢ [IO2]2)are in good agreement with that derived from the experimental results (K[ROOX] 2 ---- K'[10212).
ACKNOWLEDGEMENTS
We are deeply indebted to Drs. H. Inaba and Y. Shimizu, Research Institute of Electrical Communication, Tohoku University, Sendai, Japan for performing the spectral analysis of ultra-weak light. We also wish to thanks Dr. T. S. Danowski, Department of Medicine, Shadyside Hospital, Pittsburgh, U.S.A. and Dr. I. Kamiya, Department of General Education, Nagoya University, Nagoya, Japan for their suggestions in the preparation of the manuscript.
REFERENCES
1 Hochstein, P. and Ernster, L. (1963) Biochem. Biophys. Res. Commun. 12, 388-394 2 Poyer, J. L. and McCay, P. B. (1971) J. Biol. Chem. 246, 263-269 3 Pederson, T. C. and Aust, S. D. (1972) Biochem. Biophys. Res. Commun. 48, 789-795 4 Noguchi, T. and Nakano, M. (1974) Biochim. Biophys. Acta 368,446--455 5 Wills, E. D. (1965) Biochim. Biophys. Acta 98, 238-251 6 Howes, R. M. and Steele, R. H. (1971) Res. Commun. Chem. Pathol. Pharmacol. 2, 619-626 7 Nakano, M., Noguchi, T., Sugioka, K., Fukuyama, I-L, Sato, M., Shimizu, Y., Tsuji, Y. and
Inaba, H. (1975) J. Biol. Chem. 250, 2404-2406 8 0 m u r a , T. and Takesue, S. (1970) J. Biochem. Tokyo 67, 249-257 9 McCord, J. M. and Fridovich, I. (1969) J. Biol. Chem. 244, 6049--6055
10 Folch, J., Lees, M. M. and Sloane-Stanley, G. H. (1957) J. Biol. Chem. 226, 497-509 11 Bartlett, G. R. (1959) J. Biol. Chem. 234, 466--468 12 Saslaw, L. D. and Waravdefar, V. S. (1957) J. Orig. Chem. 22, 843-844 13 Tam, B. K. and McCay, P. B. (1969) J. Biol. Chem. 245, 2295-2300 14 Shimizu, Y., Irtaba, H., Kumaki, K., Mizuno, K., Hata, S. and Tomioka, S. (1973) IEEE Trans.
Instrum. Meas. IM-22, 153-157 15 Arneson, R. M. (1970)Arch. Biochem. Biophys. 136, 352-360 16 Foote, C. S., Denny, R. W., Weaver, L., Chang, Y. and Peters, J. (1970) Ann. N.Y. Acad. Sci.
171, 139-145 17 Anderson, S. M. and Krinsky, N. I. (1973) Photochem. Photobiol. 18, 403--408 18 McCord, J. M. and Fridovich, I. (1968) J. Biol. Chem. 243, 5753-5760 19 Merkerl, P. B. and Kearns, D. R. (1972) J. Am. Chem. Soc. 94, 1029-1030 20 Ware, W. R. (1962) J. Phys. Chem. 66, 455-458 21 Khan, A. U. and Kasha, M. (1964) Nature 204, 241-243 22 Arnold, J. S., Browne, R. J. and Ogryzlo, E. A. (1965) Photochem. Photobiol. 4, 963-969 23 Khan, A. U. and Kasha, M. (1970) J. Am. Chem. Soc. 92, 3293-3300

216
24 Anderson, S. M., Krinsky, N. I., Stone, M. J. and Clagett, D. C. (1974) Photochem. Photobiol 20, 65-69
25 Lloyd, R. A. (1965) Faraday Soc. Trans. 61, 2182-2193 26 Vassil6v, R. F. (1965) Opt. Spectrosc. 18, 131-135 27 Khan, A. U. (1970) Science 168,476-477 28 Vassil~v, R. F. (1962) Nature 196, 668-669 29 Vassil6v, R. F. (1963) Nature 200, 773-774 30 Gollnick, K., Franken, T., Schade, G. and D6rhtiter, G. (1970) Ann. N.Y. Acad. Sci. 171, 89-
104 31 Belyakov, V. A. and Vassil6v, R. F. (1970) Photochem. Photobiol. 11, 179-192 32 Russell, G. A. (1975) J. Am. Chem. Soc. 79, 3871-3877 33 Howard, J. A. and Ingold, K. U. (1968) J. Am. Chem. Soc. 90, 1056-1058 34 Dixon, W. T. and Norman, R. O. C. (1962) Nature 196, 891-892 35 Kochi, J. K. (1962) J. Am. Chem. Soc. 84, 1193-1197


![[1-3] Microsomal Lipid... · Chem.-Biol. Interactions, 50 (1984) 361-366 Elsevier Scientific Publishers Ireland Ltd. Short Communication 361 MICROSOMAL LIPID PEROXIDATION AND OXIDATIVE](https://img.pdfslide.net/doc/110x75/6089787ce01a1042bc238926/1-3-microsomal-lipid-chem-biol-interactions-50-1984-361-366-elsevier.jpg)