Embed Size (px)
Citation preview
Wright State University Wright State University
CORE Scholar CORE Scholar
Browse all Theses and Dissertations Theses and Dissertations
2017
A Power Iteration Based Co-Training Approach to Achieve A Power Iteration Based Co-Training Approach to Achieve
Convergence for Multi-View Clustering Convergence for Multi-View Clustering
Pavankalyan Yallamelli Wright State University, [email protected]
Follow this and additional works at: https://corescholar.libraries.wright.edu/etd_all
Part of the Computer Sciences Commons
Repository Citation Repository Citation Yallamelli, Pavankalyan, "A Power Iteration Based Co-Training Approach to Achieve Convergence for Multi-View Clustering" (2017). Browse all Theses and Dissertations. 1792. https://corescholar.libraries.wright.edu/etd_all/1792
This Thesis is brought to you for free and open access by the Theses and Dissertations at CORE Scholar. It has been accepted for inclusion in Browse all Theses and Dissertations by an authorized administrator of CORE Scholar. For more information, please contact [email protected].
A Power Iteration Based Co-Training
Approach to Achieve Convergence for
Multi-View Clustering
A thesis submitted in partial fulfillment
of the requirements for the degree of
Master of Science
By
Pavankalyan Yallamelli
B.Tech, Jawaharlal Nehru Technological University, 2013
2017
Wright State University
WRIGHT STATE UNIVERSITY
GRADUATE SCHOOL
May 6, 2017
I HEREBY RECOMMEND THAT THE THESIS PREPARED UNDER MY SUPERVISION BY
PAVANKALYAN YALLAMELLI ENTITLED A POWER ITERATION BASED CO-
TRAINING APPROACH TO ACHIEVE CONVERGENCE FOR MULTI-VIEW CLUSTERING BE
ACCEPTED IN PARTIAL FULFILLMENT OF THE REQUIREMENTS FOR THE DEGREE OF MASTER
OF SCIENCE.
_____________________________________
Amit P. Sheth, Ph.D.
Thesis Director
_____________________________________
Mateen M. Rizki, Ph.D.
Department Chair
Committee on
Final Examination
_____________________________________
Amit P. Sheth, Ph.D.
_____________________________________
Keke Chen, Ph.D.
_____________________________________
Brandon Minnery, Ph.D.
_____________________________________
Barry Milligan, Ph.D.
Interim Dean of Graduate School
iii
ABSTRACT
YALLAMELLI, PAVANKALYAN. M.S., Department of Computer Science and
Engineering, Wright State University, 2017. A Power Iteration Based Co-Training
Approach to Achieve Convergence for Multi-View Clustering.
Collecting diversified opinions is the key to achieve "the Wisdom of Crowd". In this
work, we propose to use a novel multi-view clustering method to group the crowd
so that diversified opinions can be effectively sampled from different groups of
people.
Clustering is the process of dividing input data into possible subsets, where every
element (entity) in each subset is considered to be related by some similarity
measure. For example, a set of social media users can be clustered using their
locations or common interests. However, real-world data is often best represented
by multiple views/dimensions. For example, a set of social media users have a
friend/follower network as well as a conversation network (different from a follower
network).
Multiple views enable a better understanding of data by improving knowledge
accuracy through cross verification across different views; it also improves the
performance by integrating multiple views. Multi-view clustering enables this.
Clustering quality, clustering agreement (consensus) and scalability are the three
essential qualities for achieving higher correspondence between the clusters and the
real underlying groups in multi-view clustering. Existing algorithms either lack
iv
scalability or achieve cluster convergence (consistent clusters across the views) very
slowly. Most of the existing and recent multi-view clustering algorithms make use
of spectral clustering. Spectral clustering which ensures higher accuracy is
computationally costly because of eigenvector computation. To address this gap, in
this paper we propose a clustering mechanism based on a co-training approach that
achieves the three qualities.
The two main contributions of our work are as follows: (1) a learning method using
power-iteration clustering for clustering a single data view, and (2) an efficient and
scalable update method that uses the cluster label information for updating other
data views iteratively to achieve convergence (clustering agreement) and cluster
quality.
The proposed method is evaluated on two real-world datasets to show that it
outperforms existing approaches in terms of clustering quality and consensus. We
evaluate the clustering quality in the context of a Wisdom of Crowds application.
Specifically, we use clustering to identify groups of similar users (crowd members)
based on their social media conversations (Tweets) related to a particular topic, in
this case, fantasy sports (Fantasy Premier League soccer in particular). We then
form virtual groups of diverse and non-diverse users based on the clusters identified.
Our results show that diverse crowds outperform non-diverse crowds in a typical
fantasy sports task (picking a team captain), consequently validating our cluster
qualities.
v
Table of Contents
1. Introduction ..................................................................................................................1
2. Background ..................................................................................................................8
2.1. Multi-View Clustering ..........................................................................................8
2.1.1. Overview ........................................................................................................8
2.1.2. Importance and Advantages ...........................................................................8 2.1.3. Related Work .................................................................................................9
2.1.4. Multi-view Clustering Categories ..................................................................9
2.2. Power Iteration Clustering ..................................................................................12
2.2.1. Overview ......................................................................................................12 2.2.2. Importance and Advantages .........................................................................13
2.2.3. Algorithm .....................................................................................................13
3. Co-training based multi-view clustering ....................................................................15
4. Approach ....................................................................................................................18
4.1. Co-training with Power Iteration clustering ........................................................18
5. Experimental Results .................................................................................................24
5.1. Evaluation Metrics ..............................................................................................24
5.2. Synthetic Graph Dataset ......................................................................................25
5.3. Twitter UK Politics Dataset ................................................................................28
5.4. Wisdom of Crowd Dataset ..................................................................................30
5.4.1. Experimental Setup ......................................................................................31
6. Related Work .............................................................................................................35
7. Conclusion .................................................................................................................37
Bibliogrpahy ......................................................................................................................38
Appendix A ........................................................................................................................41
vi
List of Figures
Figure 1. Individual vs. Non-diverse vs. Diverse crowd. ................................................... 2
Figure 2. Co-training style algorithm................................................................................ 10
Figure 3. Sketch Map for Multi-kernel learning ............................................................... 11
Figure 4. Sketch map of subspace learning for multi-view data…………………………12
Figure 5. Workflow of Co-training based spectral clustering approach ........................... 16
Figure 6. Example for Co-training based Spectral Clustering……………………………17
Figure 7. Architecture for proposed method……………………………………………...19
Figure 8. Workflow of Co-training with Power iteration clustering. …………………….21
Figure 9. Example of Co-training based power iteration clustering using new update
method……………………………………………………………………………………22
Figure 10. NMI scores in different views vs. the number of iterations of co-trained spectral
clustering and power iteration clustering for Synthetic data. Each view is represented by a
different color…………………………………………………………………………….27
Figure 11. NMI and Variance of co-trained spectral clustering and power iteration
clustering for Synthetic data……………………………………………………………...27
Figure 12. NMI scores in different views vs. number of iterations of co-trained spectral
clustering and power iteration clustering for Twitter data……………………………….29
Figure 13. NMI and Variance of co-trained spectral clustering and power iteration
clustering for Twitter data..………………………………………………………………29
Figure 14. Captain scores for diverse and non-diverse crowd vs. crowd size for player’s
view………………………………………………………………………………………33
Figure 15. Captain scores for diverse and non-diverse crowd vs. crowd size for team view
……………………………………………………………………………………………34

vii
Figure 16. Captain scores for diverse and non-diverse crowd vs. group size for both the
views……………………………………………………………………………………34
viii
List of Tables
Table 1. Results of Cohen’s kappa for the 3 datasets ....................................................... 25
Table 2. Clustering performance on Synthetic Dataset…………………………………..26
Table 3. Clustering performance on Twitter Dataset……………………………………..28
ix
Acknowledgment
This work was partially supported by Army Research Office Grant No. W911NF-
16-1-0300.
I would firstly like to thank my advisor Dr. Amit Sheth. Not only has he been a great
advisor to me, but a great mentor as well. He provided me with constant support
both personally and academically through my graduate journey. I have learnt a lot
from the interactions I have had with him and will carry these valuable lessons
throughout my life. I would like to thank Shreyansh Bhatt for being a wonderful
mentor and a great friend. I am grateful to him for the insightful discussions,
brainstorming sessions and for all his support and guidance.
I would also like to thank my committee members Dr. Keke Chen and Dr. Brandon
Minnery for being on my panel and reviewing my work. I would also like to thank
Dr. Prasad, Sarasi and Vinh for guiding me on my initial projects; this prepared me
for the latter part of my graduate program. Being a part of Kno.e.sis has made this
process a lot of fun and I would like to thank the entire Kno.e.sis family for it.
This acknowledgment would be incomplete without thanking my dear friends
Nishita, Shalini, Roopteja, Yamini and my parents for their help, hard-work, and
support.

x
My graduate program has been a fulfilling one, and I am excited for whatever is in
store next.
Last but not the least, I am thankful to my parents Jaya Lakshmi and Y.N.S.C Bose,
for all their continued faith in me. This thesis is dedicated to you.
1
1. Introduction
The "wisdom of crowds" (WoC) effect is one of the best-known examples of
collective human intelligence. WoC is a phenomenon in which an aggregated
judgment of a group of people is shown to be more accurate (on average) than that
of any one individual within the group. A well-known quote attributed to Ken
Blanchard is: “None of us is as smart as all of us.” [1]
James Surowiecki's New York Times bestseller The Wisdom of Crowds states that
“a diverse collection of independently-deciding individuals is likely to make certain
types of decisions and predictions better than individuals or even experts” [2].
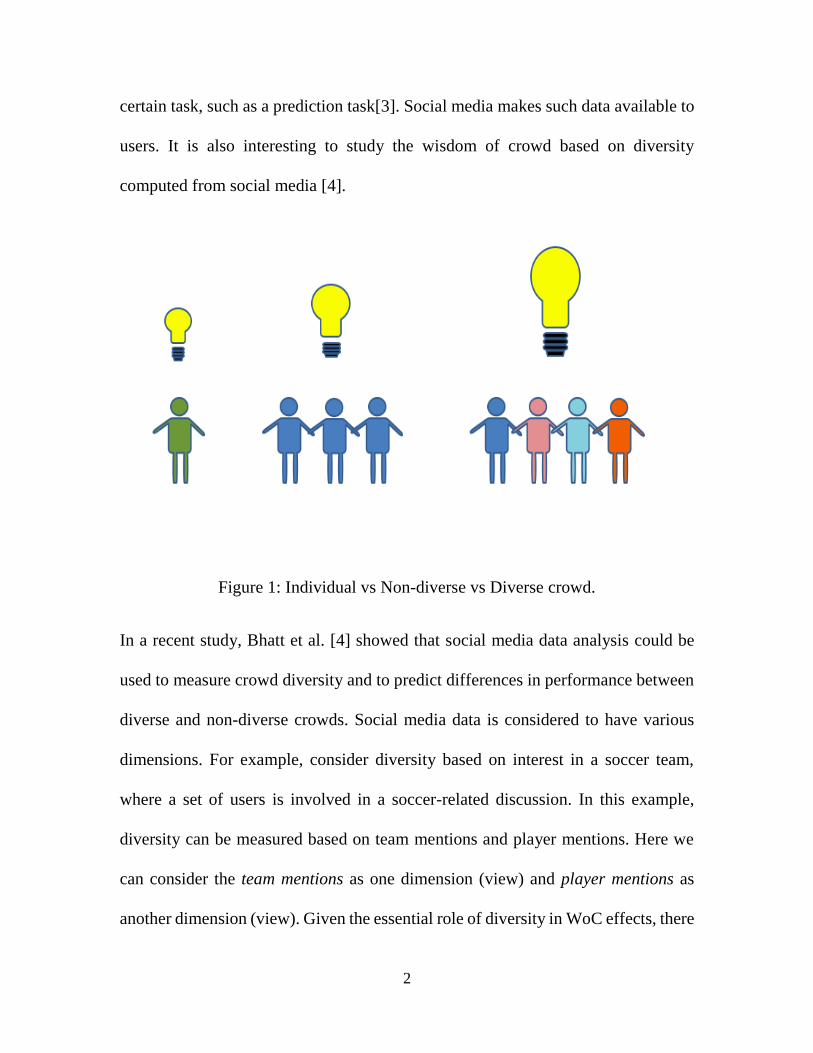
Figure 1 illustrates this basic idea that a crowd can be smarter than an individual,
and a diverse crowd is even smarter. Various forms of domain-specific and/or
domain independent diversity can affect WoC. It is interesting to ask whether a
domain-independent diversity measure based on (for example) geolocation versus a
domain-specific measure based on (for instance) crowd members’ subject matter
knowledge or a combination of both helps create smarter groups. This has led to an
interest in studying and understanding multiple diversity measures to form an
intelligent crowd. These experiments are mostly performed in a lab environment
where an experimenter gathers a group of subjects and asks them to perform a
2
certain task, such as a prediction task[3]. Social media makes such data available to
users. It is also interesting to study the wisdom of crowd based on diversity
computed from social media [4].
Figure 1: Individual vs Non-diverse vs Diverse crowd.
In a recent study, Bhatt et al. [4] showed that social media data analysis could be
used to measure crowd diversity and to predict differences in performance between
diverse and non-diverse crowds. Social media data is considered to have various
dimensions. For example, consider diversity based on interest in a soccer team,
where a set of users is involved in a soccer-related discussion. In this example,
diversity can be measured based on team mentions and player mentions. Here we
can consider the team mentions as one dimension (view) and player mentions as
another dimension (view). Given the essential role of diversity in WoC effects, there
3
is a surprising lack of research on how to measure the diversity of a crowd at scale
[4]. Although the existing methodology of WoC is efficient, such an approach
usually attributes superiority of the crowd interests over individual judgment. In
other words, it prioritizes the opinions and interests of crowd averages over an
individual's point of view. To overcome such a gap, we need a mechanism to
measure crowd diversity.
In this paper, we present a novel clustering method which facilitates measuring
crowd diversity. Based on members’ social media (Twitter) communications, we
examined whether it is possible to extract measures of crowd diversity and checked
if those measures can drive the selection of wiser crowds. Our principal assumption
is that content of a person's communications involving a particular judgment
problem carries the knowledge of what the person knows about the issue and those
factors and knowledge sources he or she believes are most appropriate to formulate
a judgment. We identified tweets related to Fantasy Premier League (FPL)
fantasy.premierleague.com as a promising data source for evaluating our hypothesis.
For the domain of fantasy sports, we aimed to come up with a technique that
identifies crowds (a set of fantasy team owners) that are diverse based on their tweet
content. We show that such diverse crowds demonstrably outperform less diverse
crowds.
Most Twitter users post their profile information, which can be utilized to match
their Twitter record with their other publicly available social data, such as their
4
publicly posted fantasy sports activity. Thus we can match the tweets of fantasy
team owners with their judgments (i.e., their team picks) and the outcomes of those
judgments (i.e., their scores) [4].
One approach to forming diverse crowds is to identify subgroups of similar users
and to select users from multiple subgroups. We identify subgroups of similar users
using a clustering mechanism. Clustering is the process of dividing input data into
possible subsets where elements in each subset are considered related by some
similarity measure. Existing work suggests that a clustering approach could be used
to generate more diverse, wiser crowds [4]. The most common approach to
clustering involves describing an entity (user) by a feature vector. For example, one
feature can be a user description based on soccer teams that a user is interested in
while another feature can be a user description based on soccer players that a user
is interested in. In this example, users could be clustered based on their interest in a
particular team or their interest in a particular player. Since we do not know the
importance of a feature in the clustering process, we use multi-view clustering to
find a similar set of users.
For a multi-dimensional clustering problem, one can create diverse and non-diverse
crowds based on the clustering technique or quality of clusters. Clustering
algorithms are assessed mostly on three criteria -- time complexity, clustering
quality, and consensus. Multi-view clustering techniques are mostly categorized as
5
one of the following: subspace algorithm; multiple kernel learning; or co-training
[5].
In this paper, we develop a co-training approach for cluster identification.
Essentially, co-training style algorithms train alternately to maximize a mutual
agreement on two distinct views of the data. One of the recent well-known co-
training based clustering approaches is based on spectral clustering [6], which uses
spectral embedding for co-training, i.e., to update views. Since spectral clustering
[7] can be a bottleneck for large graphs, we explore the use of a more efficient
spectral based clustering method, power iteration clustering [8]. Power iteration
clustering (PIC) does not provide spectral embeddings as spectral clustering.
Specifically, PIC does not depend on computing all the eigenvalues. Hence, we
cannot use spectral embedding for co-training. Moreover, such a spectral
embedding based co-training fails to achieve clustering consensus across views,
which is the most important quality in multi-view clustering.
Achieving a consensus is essential for any co-training based multi-view clustering
algorithm. In a co-training based approach, each view generates a clustering result
in every iteration. If the generated results of a view do not agree with other views,
it is hard for someone to select clustering results for a view randomly. For example,
consider two views with five nodes (say 1,2,3,4,5). If clustering result of the first
view is ({1,3,5}, {2,4}), and the clustering result of the second view is ({1,2,5},
{3,4}), then it is hard for someone to select one result out of these two. Instead if
6
the clustering of both the views results in the same clusters ({1,3,5}, {2,4}), then it
is easy to select one. Hence, the consensus is a significant property for multi-view
clustering.
In this work, we propose a novel approach that integrates the co-training approach
with PIC using a new view update mechanism which achieves fast view agreement
and works more efficiently for multi-view clustering. Our new update mechanism
considers the clustering labels in co-training rather than using spectral embedding,
which helps in achieving convergence. We use two datasets to evaluate the
clustering quality and clustering consensus and show that our approach achieves
better normalized mutual information (NMI) compared to existing co-training based
multi-view clustering approaches. We then use the proposed co-training based
multi-view clustering method on a Twitter user dataset [4] and show that the
resulting cluster structure can be used to select more diverse, and hence wiser,
crowds. Our results show that such a diverse crowd performs better at a captain
prediction task than a non-diverse crowd.
The main contributions are as follows:
1. Scalable co-training based multi-view clustering algorithm using PIC
which in most cases is faster than state of the art.
2. Cluster label based update for co-training which achieves
convergence.

7
3. Detailed experiment and comparison of the proposed approach with
existing multi-view clustering techniques.
4. Framework for experimenting with multi-view clustering in Wisdom
of Crowd applications in the domain of fantasy sports.
5. Clustering-based measures of crowd diversity which can be used to
guide the selection of more diverse, hence wiser, crowds.
We have organized the paper as follows: we begin with Section 2, background
description of multi-view clustering and PIC. Then we move on to discuss existing
co-training based multi-view clustering in Section 3. Section 4 explains the
clustering agreement method we propose in our work. Section 5 presents the
experimental results on real, synthetic and WoC datasets and compares them with
existing approaches. This will be followed by discussions of related work and
conclusions in Section 6 and 7 respectively.
8
2. Background
2.1. Multi-View Clustering
2.1.1. Overview
Many real-world datasets can be described using multiple dimensions/features. For
example, consider a set of web pages. The hyperlink network between these pages
conveys a relationship between them and can serve as a measure of similarity
between pages. The textual and/or multimedia content contained in the web pages
also serves as a measure of similarity; i.e., two pages can be compared based on
their content. The similarity computed based on multiple relationships between
these data points are also referred as views.
2.1.2. Importance and Advantages
Traditionally it was understood that one particular subset would be sufficient for
data mining, and multiple views were often regarded as redundant. However,
research has now illustrated that these multiple views are often complementary [6]
and help gain a better understanding of the data structure. Multiple view learning
has two advantages: a better performance can be obtained by integrating the
multiple views rather than a single view, and the accuracy of the knowledge
9
produced can be cross-verified from multiple views. Hence there is a need for multi-
view clustering to handle multi-view data.
2.1.3. Related Work
Over the recent years, many successful multi-view learning methods have been
introduced (e.g., co-training [9], co-EM [10] and co-regularized multi-view spectral
clustering algorithms [24]). After analyzing several algorithms, we observed that
the most crucial principle for multi-view clustering is the consensus. Consensus tries
to maximize the agreement between the clusters in distinct views.
2.1.4. Multi-view Clustering Categories
As described above, multi-view clustering offers advantages over traditional
clustering methods in terms of performance and cross-verification. For these
purposes, there has been burgeoning interest in multi-view clustering approaches.
These approaches can be classified into three categories: 1) subspace; 2) multiple
kernel learning, and 3) co-training.[5]
2.1.4.1. Co-training
Co-training is one of the earliest techniques for multi-view learning proposed for
semi-supervised learning problems by Blum & Mitchell in 1998 [11]. The co-
training approach trains to maximize the agreement on two distinct views of the
10
data. Three main assumptions that co-training algorithms relies on are: (a)
sufficiency - each view is sufficient for classification on its own; (b) compatibility
- the target function of both views predicts the same labels for co-occurring features
with a high probability; and (c) conditional independence - views are conditionally
independent given the label [5].
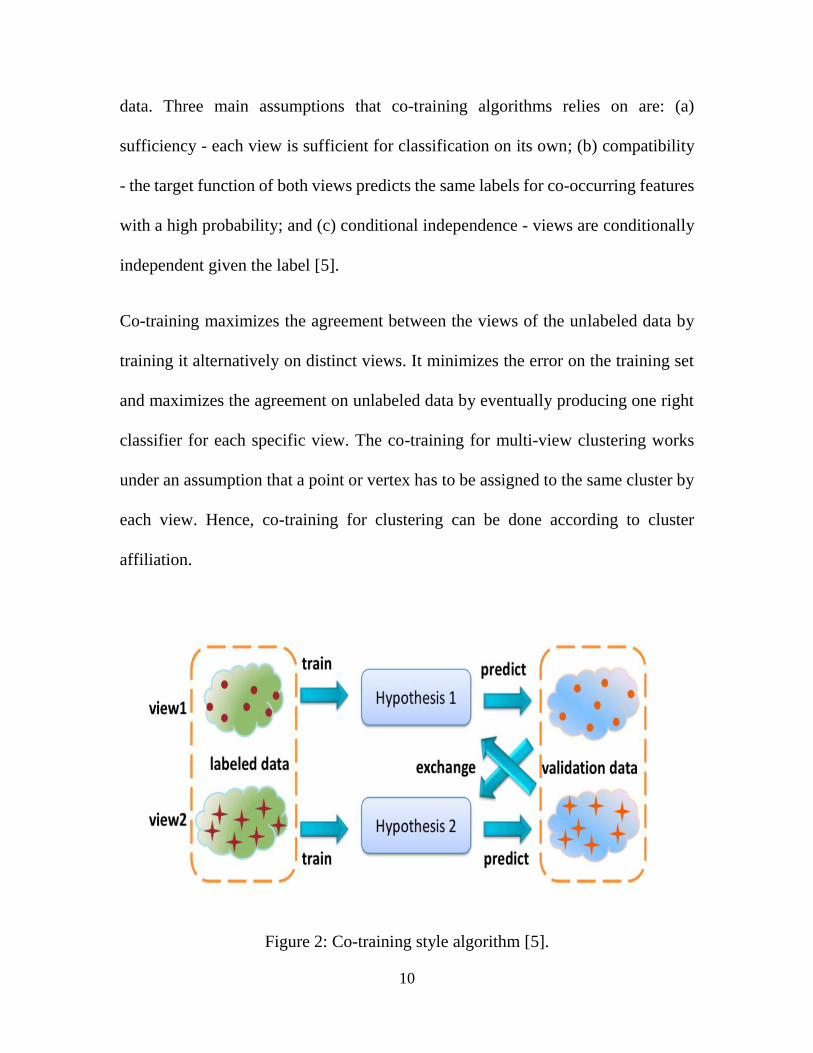
Co-training maximizes the agreement between the views of the unlabeled data by
training it alternatively on distinct views. It minimizes the error on the training set
and maximizes the agreement on unlabeled data by eventually producing one right
classifier for each specific view. The co-training for multi-view clustering works
under an assumption that a point or vertex has to be assigned to the same cluster by
each view. Hence, co-training for clustering can be done according to cluster
affiliation.
Figure 2: Co-training style algorithm [5].
11
2.1.4.2. Multi-kernel Learning
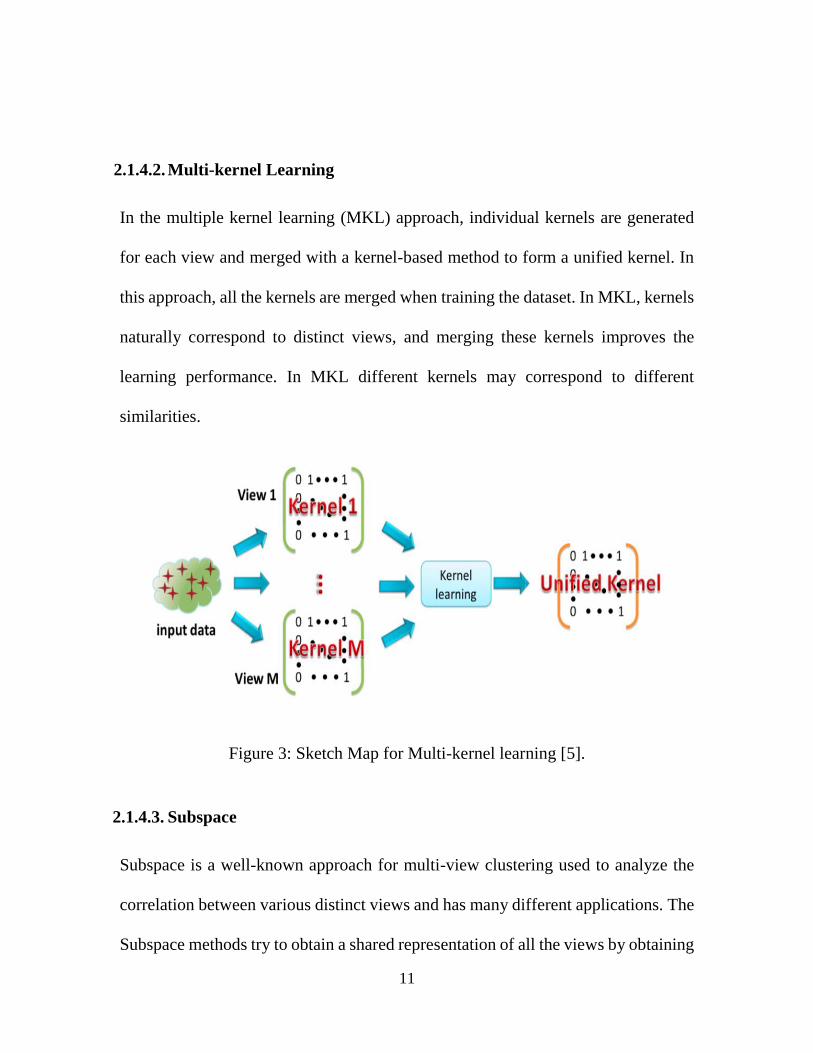
In the multiple kernel learning (MKL) approach, individual kernels are generated
for each view and merged with a kernel-based method to form a unified kernel. In
this approach, all the kernels are merged when training the dataset. In MKL, kernels
naturally correspond to distinct views, and merging these kernels improves the
learning performance. In MKL different kernels may correspond to different
similarities.
Figure 3: Sketch Map for Multi-kernel learning [5].
2.1.4.3. Subspace
Subspace is a well-known approach for multi-view clustering used to analyze the
correlation between various distinct views and has many different applications. The
Subspace methods try to obtain a shared representation of all the views by obtaining
12
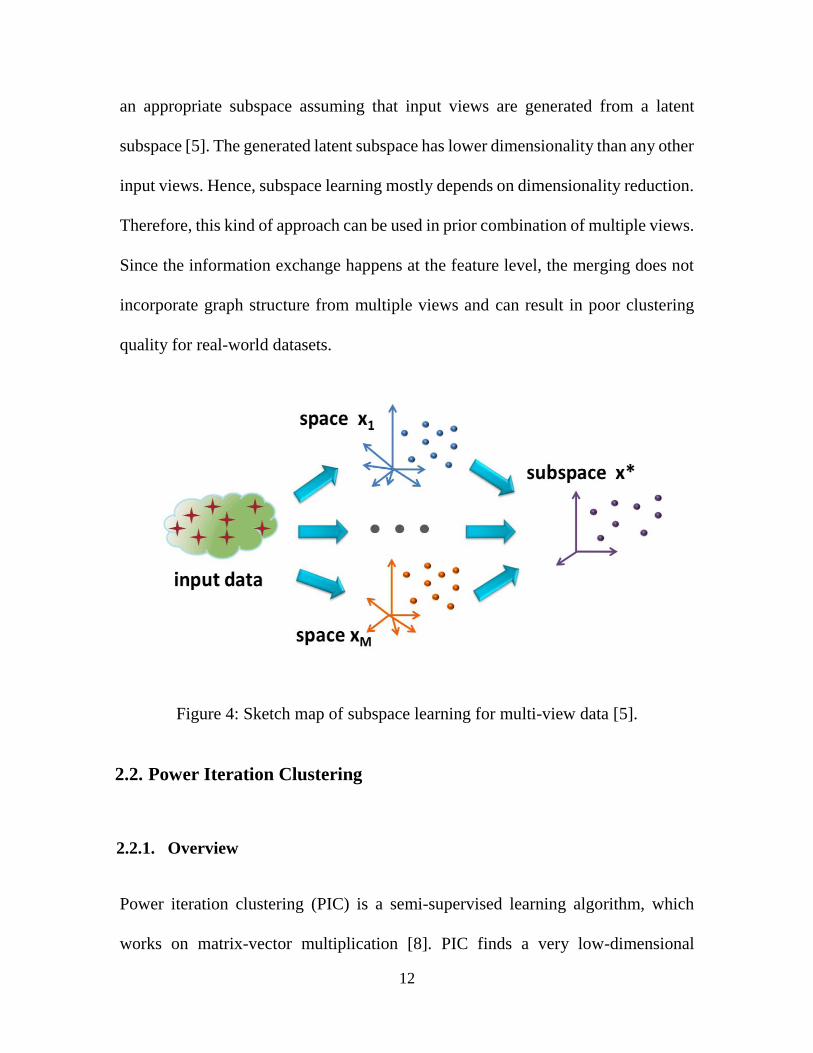
an appropriate subspace assuming that input views are generated from a latent
subspace [5]. The generated latent subspace has lower dimensionality than any other
input views. Hence, subspace learning mostly depends on dimensionality reduction.
Therefore, this kind of approach can be used in prior combination of multiple views.
Since the information exchange happens at the feature level, the merging does not
incorporate graph structure from multiple views and can result in poor clustering
quality for real-world datasets.
Figure 4: Sketch map of subspace learning for multi-view data [5].
2.2. Power Iteration Clustering
2.2.1. Overview
Power iteration clustering (PIC) is a semi-supervised learning algorithm, which
works on matrix-vector multiplication [8]. PIC finds a very low-dimensional
13
embedding of a dataset using truncated power iteration on a normalized pairwise
similarity matrix of the data. In other words, PIC identifies a combination of
dominant eigenvectors of a matrix that reveals the underlying clustering structure
of data.
2.2.2. Importance and Advantages
PIC has gained prominence due to its mathematical framework and its capability to
deliver good results with arbitrarily shaped clusters, which is otherwise a
shortcoming with several other clustering algorithms such as k-means and spectral
clustering algorithms [8]. It is also proven that PIC is faster than traditional Ncut
implementation [8]. Hence, we adopted the PIC technique to solve multi-view
clustering problems.
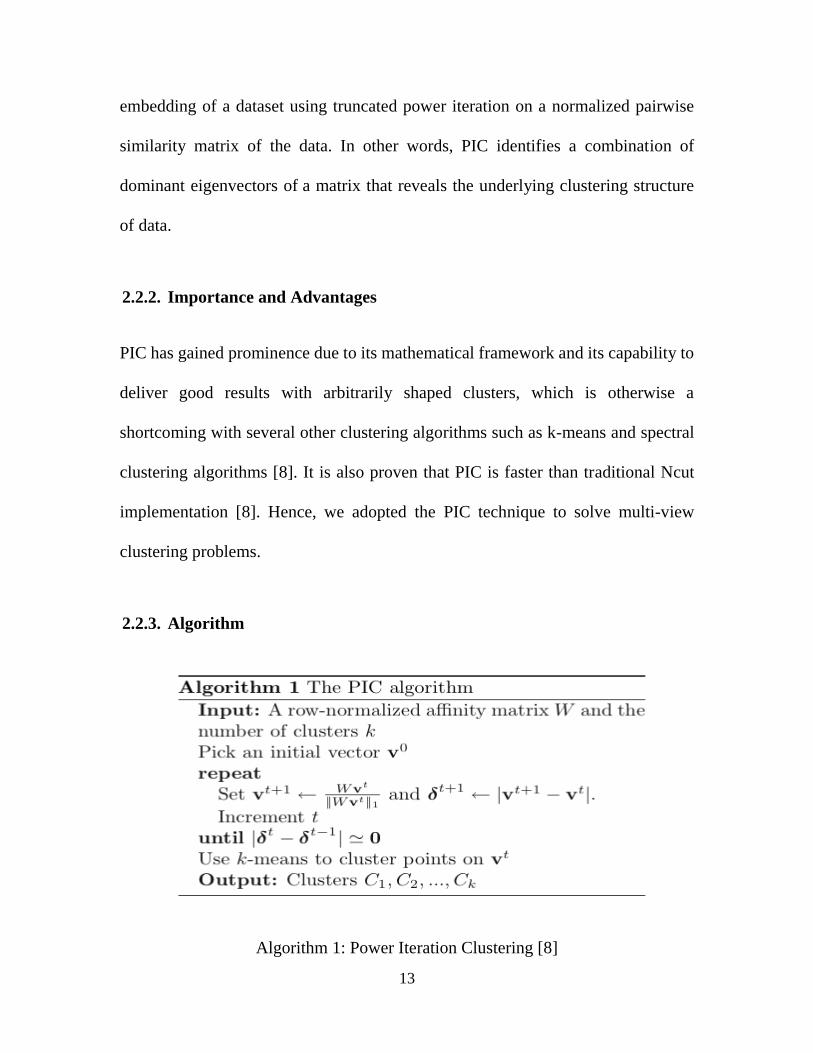
2.2.3. Algorithm
Algorithm 1: Power Iteration Clustering [8]

14
Here we briefly outline the PIC algorithm (see [8] for a detailed introduction). Given
a row-normalized affinity matrix and an initial vector, PIC iteratively performs the
update until it generates the vector that is most similar to the vector that is used to
update.
15
3. Co-training based multi-view clustering
In this section, we provide a summary of co-training based multi-view clustering
with existing methods and their drawbacks. The basic idea of co-training algorithms
is that the clustering results from one view are used to constrain the similarity for
the other views. Several previous attempts related to co-training [6,9,12] have
achieved better clustering results. All these algorithms use spectral clustering, which
handles irregular cluster shapes and thus is good for graph clustering. The latest co-
training based multi-view clustering approach [6] uses spectral embedding from one
view to update other views. The spectral embedding of a view represents an
underlying clustering structure since this low-dimensional embedding is the one
which is used to generate clusters. However, the spectral embedding does not
represent clear boundaries between clusters; hence it affects co-training algorithm
to achieve convergence. Moreover, spectral clustering used in the whole process has
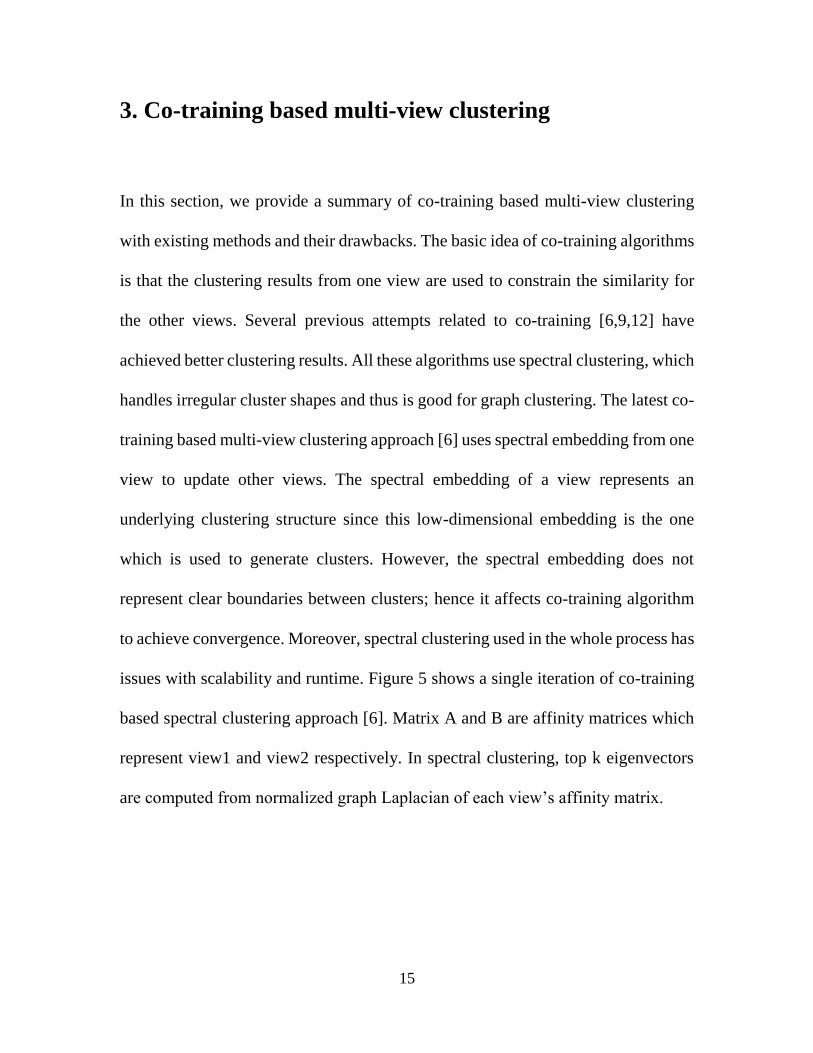
issues with scalability and runtime. Figure 5 shows a single iteration of co-training
based spectral clustering approach [6]. Matrix A and B are affinity matrices which
represent view1 and view2 respectively. In spectral clustering, top k eigenvectors
are computed from normalized graph Laplacian of each view’s affinity matrix.
16
Figure 5: Workflow of co-training based spectral clustering approach
Once the k eigenvectors of each view are generated, they are then multiplied with
its transpose to generate a n*n matrix X for the first view and Y for the second view.
Matrix X and Y represent the clustering affiliation (spectral embedding) of the first
view and second view respectively. Co-training algorithms train in a way that
spectral embedding of one view is multiplied to affinity matrix of the second view,
i.e., X is multiplied to B and Y is multiplied with A for the second iteration. This
process will be carried out for a certain number of iterations. However, spectral
embedding does not provide the precise boundaries between the clusters because
eigenvalues can be negative and can be spread for future iterations. Moreover, it is
very high in time complexity because of eigenvector computation, and a lot of
unnecessary edges will be added between the nodes which makes the graph thick.
Example 1 illustrates the disadvantages of spectral clustering with co-training.
17
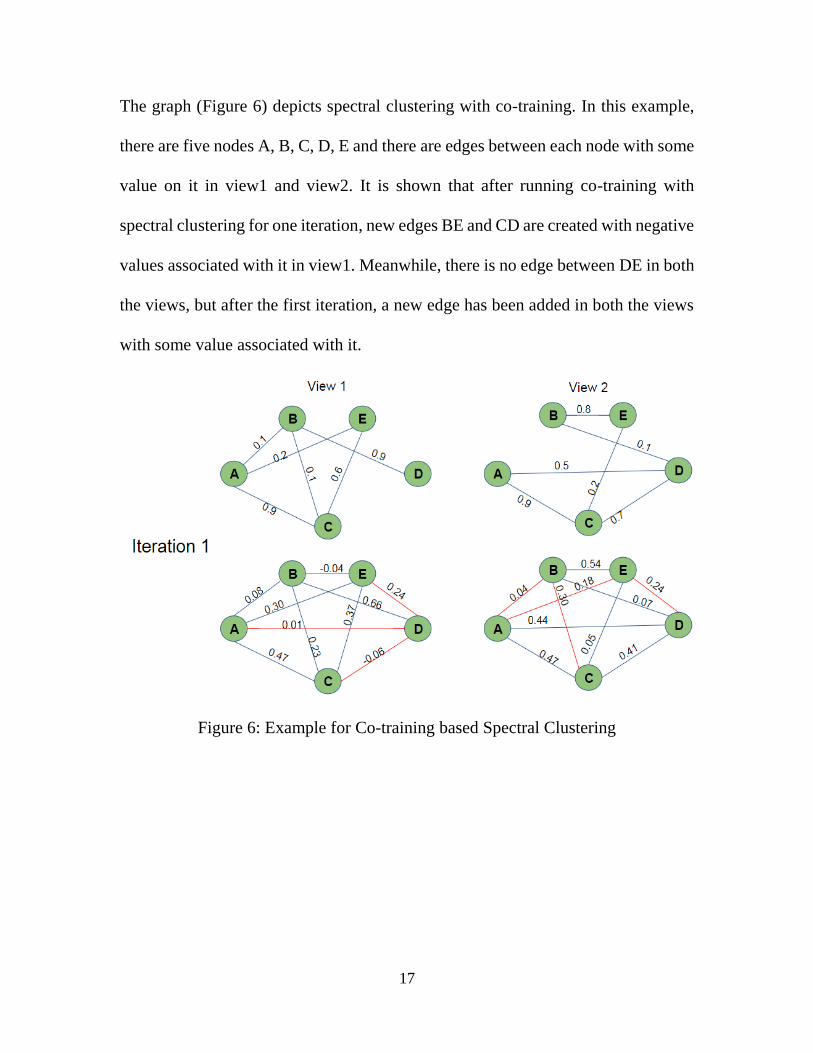
The graph (Figure 6) depicts spectral clustering with co-training. In this example,
there are five nodes A, B, C, D, E and there are edges between each node with some
value on it in view1 and view2. It is shown that after running co-training with
spectral clustering for one iteration, new edges BE and CD are created with negative
values associated with it in view1. Meanwhile, there is no edge between DE in both
the views, but after the first iteration, a new edge has been added in both the views
with some value associated with it.
Figure 6: Example for Co-training based Spectral Clustering
18
4. Approach
4.1. Co-training with Power Iteration clustering
In this section, we develop a new co-training framework to carry out multi-view
PIC. For any multi-view clustering, it is essential to achieve good quality clusters
and consensus across all the views. Consensus can be defined as the clustering
agreement across all the views, i.e., each view generates the same clustering result
at the end of the co-training algorithm. Existing algorithms either lack in achieving
consensus or clustering quality or scalability. Hence, we approached this problem
with three broad aims – achieving consensus, scalability, and clustering quality.
First, we introduce a new method to update an affinity matrix of an augmented view
using the cluster labels of all the other views. This ensures that, unlike spectral
embedding, we do not influence the affinities between the vertices that belong to
different clusters. This update method helps to achieve consensus by establishing a
guided co-training procedure and consequently converges to a more efficient
affinity matrix for PIC in every iteration. This update method works on the
assumption that if two points present in the same cluster in the maximum number
of views, it should be so in all the views. On the other hand, if two points belong to
different clusters, it should be so in all the views. We use the clustering labels of
19
each view which are generated from k-means algorithms to update the views for the
next iteration instead of the eigenvector. The proposed update method adds the
weight between the nodes if the nodes belong to the same cluster in rest of the views.
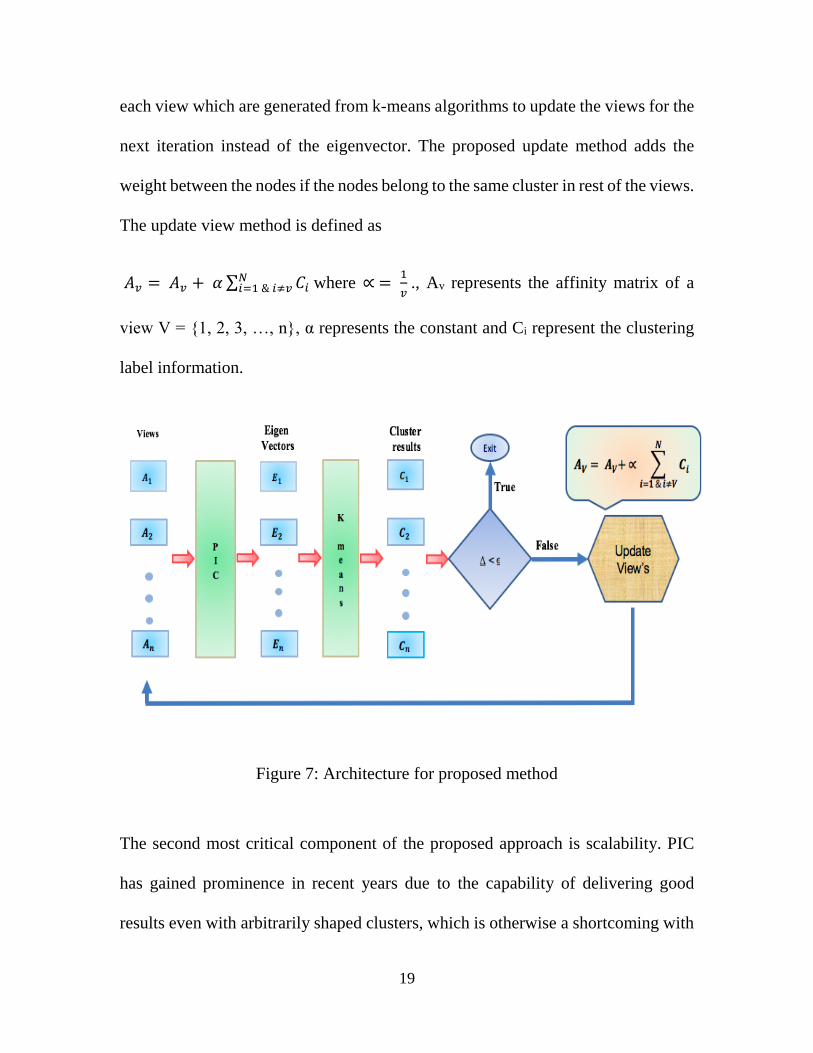
The update view method is defined as
𝐴𝑣 = 𝐴𝑣 + 𝛼 ∑ 𝐶𝑖 𝑁𝑖=1 & 𝑖≠𝑣 where ∝ =
1
𝑣 ., Av represents the affinity matrix of a
view V = {1, 2, 3, …, n}, α represents the constant and Ci represent the clustering
label information.
Figure 7: Architecture for proposed method
The second most critical component of the proposed approach is scalability. PIC
has gained prominence in recent years due to the capability of delivering good
results even with arbitrarily shaped clusters, which is otherwise a shortcoming with
20
several other clustering algorithms. When compared to spectral clustering, the cost
(in space and time) of explicitly calculating eigenvectors is replaced by that of a
small number of matrix-vector multiplications. Hence, we adopted PIC technique
to solve multi-view clustering problem. PIC generates the top eigenvector of a given
matrix, unlike spectral clustering which generates top k eigenvectors.
Figure 7 demonstrates the idea of co-training with PIC using the proposed update
method. Given the affinity matrix of v views say 𝐴1, 𝐴2, …, 𝐴𝑣 where 𝐴𝑣 is n*n
affinity matrix of view v and v = {1,2, …, v}. And 𝐸1, 𝐸2, …, 𝐸𝑣 represent the
eigenvectors of corresponding views which are computed using PIC. We apply the
k-means algorithm on this eigenvector to generate the cluster labels 𝐶1, 𝐶2, …, 𝐶𝑣.
We check the error rate between all the cluster labels using NMI. If the error rate is
below the given threshold, the co-training algorithm terminates else affinity matrix
of each view will be computed using proposed view update method, and these
updated views are used as the input for the subsequent iteration.
21
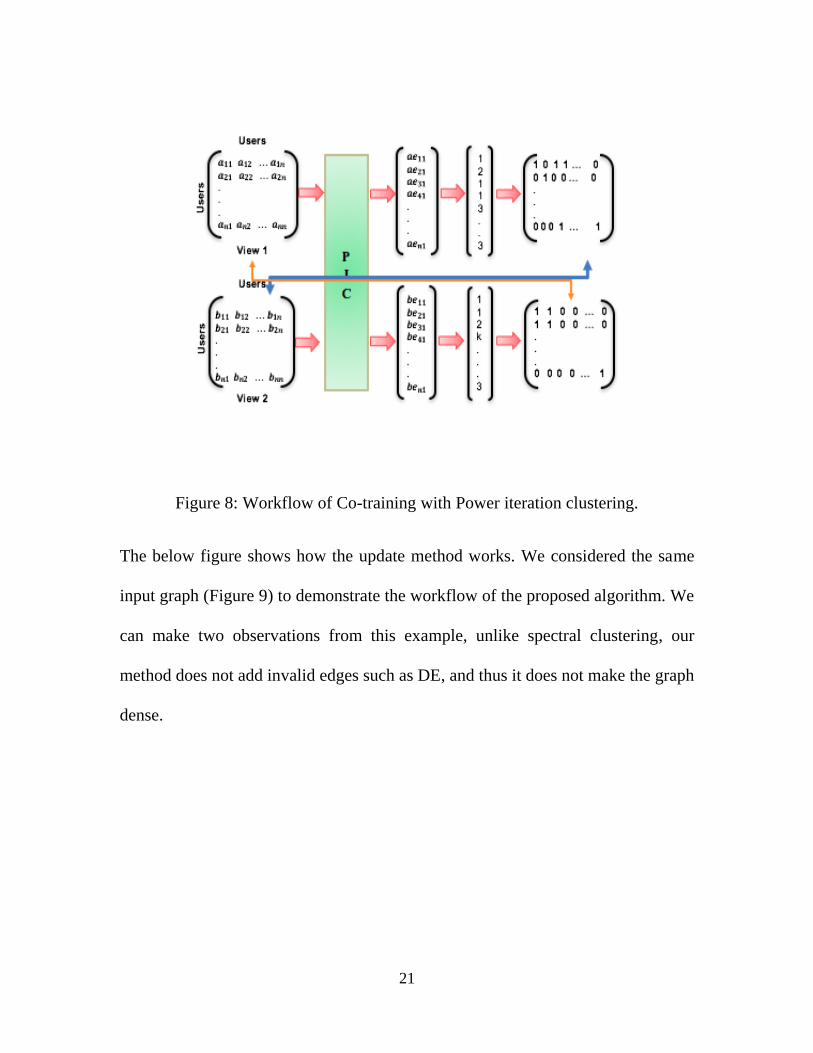
Figure 8: Workflow of Co-training with Power iteration clustering.
The below figure shows how the update method works. We considered the same
input graph (Figure 9) to demonstrate the workflow of the proposed algorithm. We
can make two observations from this example, unlike spectral clustering, our
method does not add invalid edges such as DE, and thus it does not make the graph
dense.
22
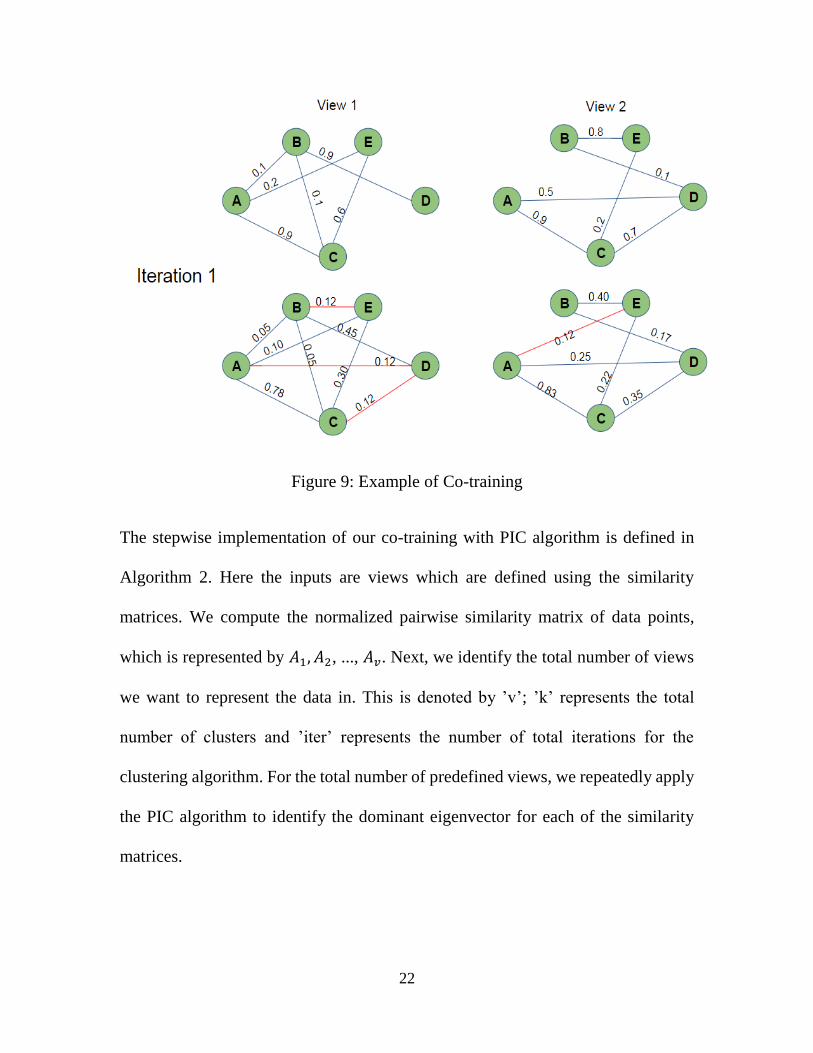
Figure 9: Example of Co-training
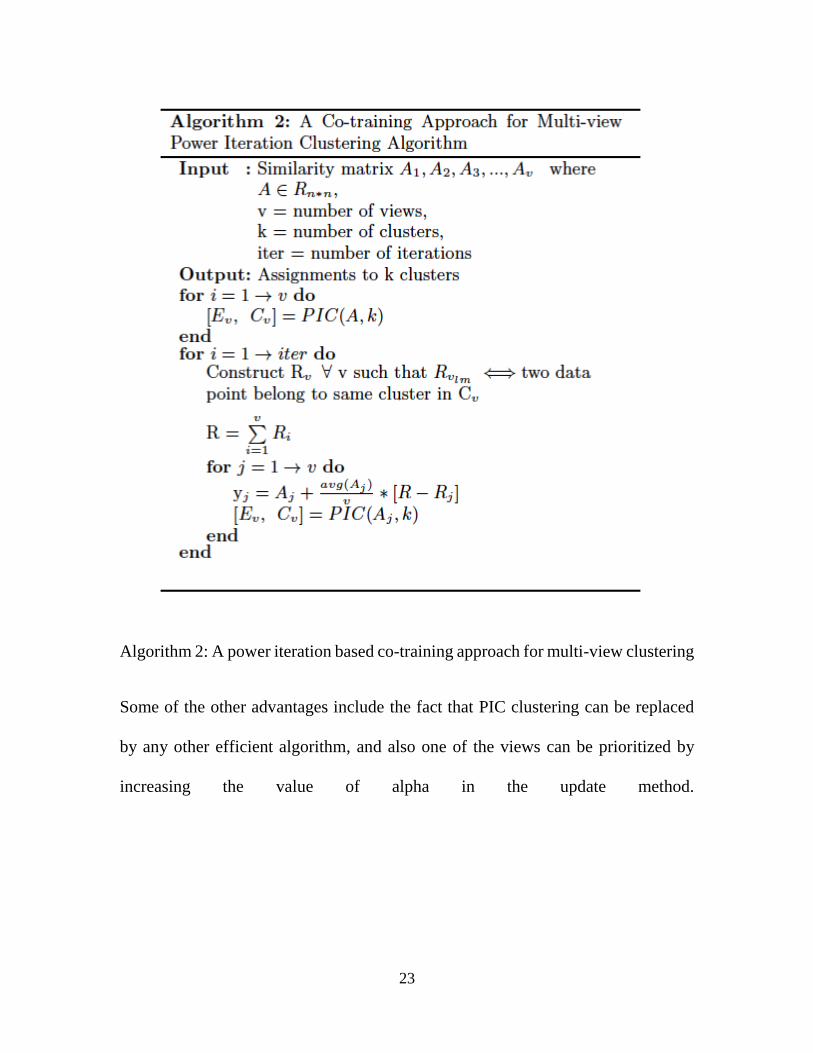
The stepwise implementation of our co-training with PIC algorithm is defined in
Algorithm 2. Here the inputs are views which are defined using the similarity
matrices. We compute the normalized pairwise similarity matrix of data points,
which is represented by 𝐴1, 𝐴2, ..., 𝐴𝑣. Next, we identify the total number of views
we want to represent the data in. This is denoted by ’v’; ’k’ represents the total
number of clusters and ’iter’ represents the number of total iterations for the
clustering algorithm. For the total number of predefined views, we repeatedly apply
the PIC algorithm to identify the dominant eigenvector for each of the similarity
matrices.
23
Algorithm 2: A power iteration based co-training approach for multi-view clustering
Some of the other advantages include the fact that PIC clustering can be replaced
by any other efficient algorithm, and also one of the views can be prioritized by
increasing the value of alpha in the update method.
24
5. Experimental Results
In this section, we compare our approach with the number of baseline methods like the
single view, feature concatenation and co-training with spectral clustering on three
different datasets to show the convergence of our approach. Three data sets are-- a synthetic
dataset, a real-world dataset, and wisdom of crowd dataset. Each dataset has a different
number of views and a different number of data points (nodes).
5.1. Evaluation Metrics
We evaluate the clustering results using different measures like NMI and Cohen's kappa
coefficient and Monte Carlo Simulation. All measures mentioned above return a value
between 0 and 1, and the higher the value, the better the clustering results. The Cohen’s
kappa is used to measure the agreement between every possible pair of views. It represents
the degree of accuracy and reliability. If Cohen’s kappa results in 1, then it indicates
absolute agreement between the views, and if it results in 0, then it indicates that any
agreement is entirely due to chance. Kappa can result in any adverse value, although we
are interested only in values between 0 and 1. Results reported in Table 1 are the average
value of Cohen’s kappa between every possible view pair of three datasets (described
below). The results show that our approach outperforms co-training with spectral clustering
25
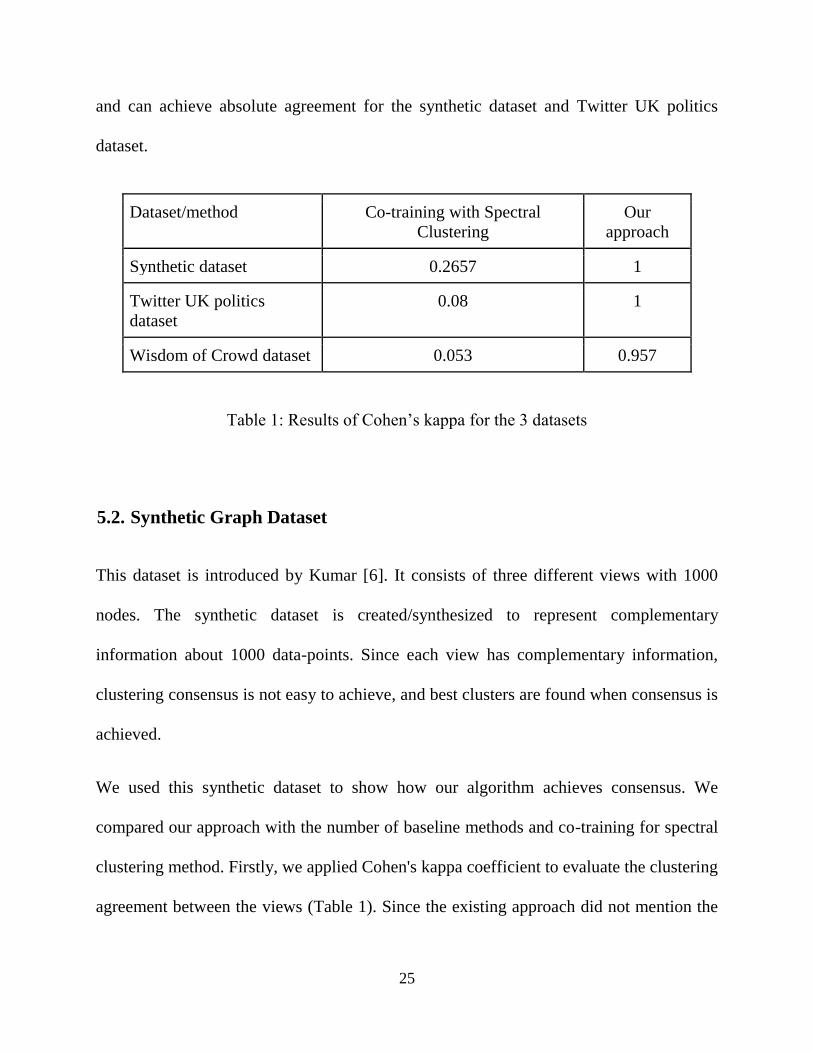
and can achieve absolute agreement for the synthetic dataset and Twitter UK politics
dataset.
Dataset/method Co-training with Spectral
Clustering
Our
approach
Synthetic dataset 0.2657 1
Twitter UK politics
dataset
0.08 1
Wisdom of Crowd dataset 0.053 0.957
Table 1: Results of Cohen’s kappa for the 3 datasets
5.2. Synthetic Graph Dataset
This dataset is introduced by Kumar [6]. It consists of three different views with 1000
nodes. The synthetic dataset is created/synthesized to represent complementary
information about 1000 data-points. Since each view has complementary information,
clustering consensus is not easy to achieve, and best clusters are found when consensus is
achieved.
We used this synthetic dataset to show how our algorithm achieves consensus. We
compared our approach with the number of baseline methods and co-training for spectral
clustering method. Firstly, we applied Cohen's kappa coefficient to evaluate the clustering
agreement between the views (Table 1). Since the existing approach did not mention the
26
stopping criteria of their algorithm, we report the results obtained in the fifth iteration;
however, our algorithm achieved convergence in the fourth iteration.
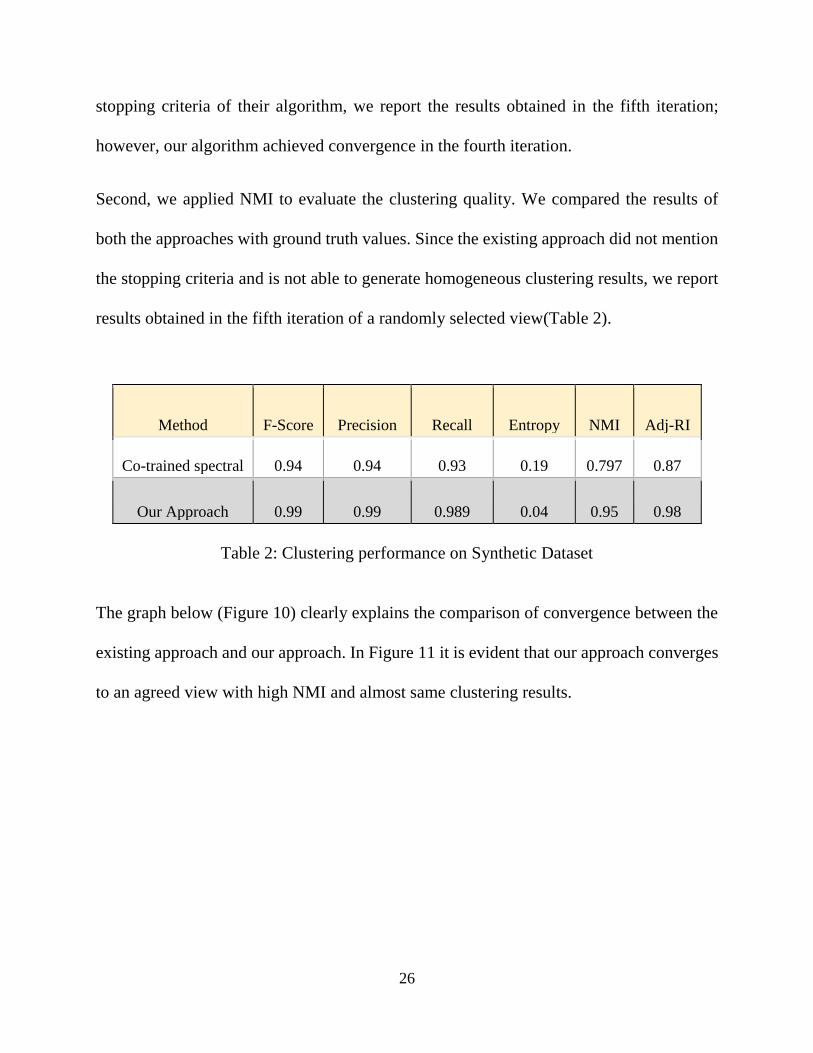
Second, we applied NMI to evaluate the clustering quality. We compared the results of
both the approaches with ground truth values. Since the existing approach did not mention
the stopping criteria and is not able to generate homogeneous clustering results, we report
results obtained in the fifth iteration of a randomly selected view(Table 2).
Method F-Score Precision Recall Entropy NMI Adj-RI
Co-trained spectral 0.94 0.94 0.93 0.19 0.797 0.87
Our Approach 0.99 0.99 0.989 0.04 0.95 0.98
Table 2: Clustering performance on Synthetic Dataset
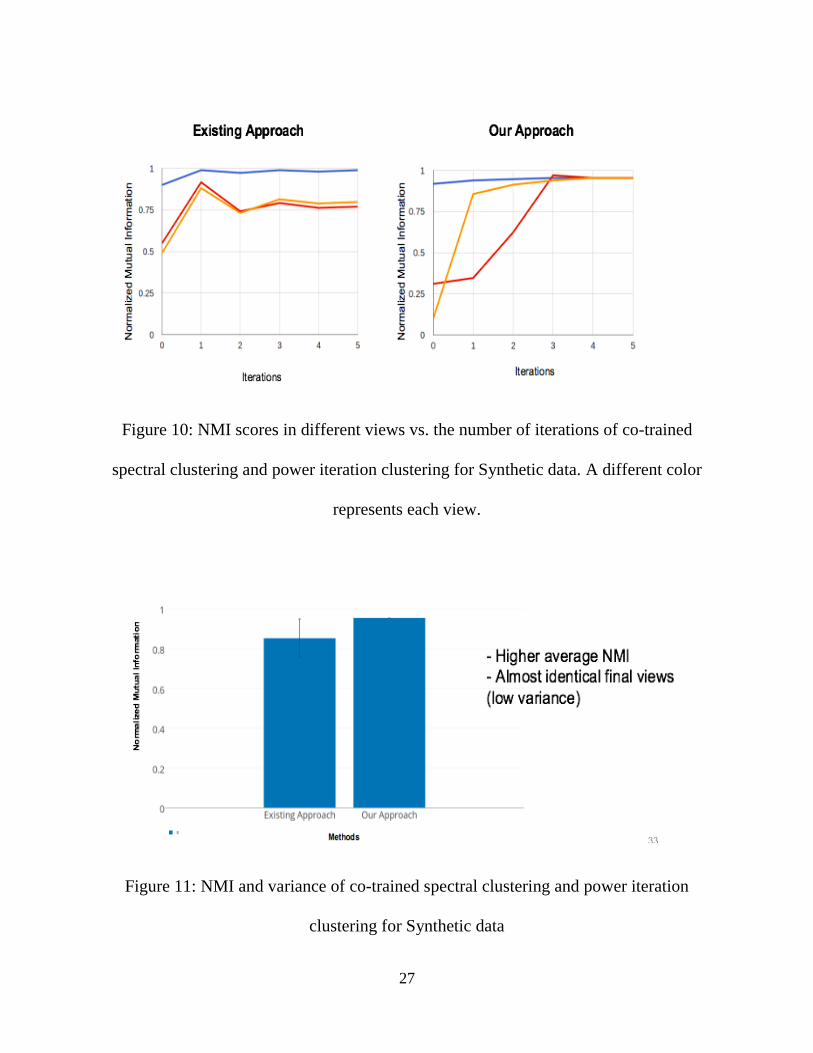
The graph below (Figure 10) clearly explains the comparison of convergence between the
existing approach and our approach. In Figure 11 it is evident that our approach converges
to an agreed view with high NMI and almost same clustering results.
27
Figure 10: NMI scores in different views vs. the number of iterations of co-trained
spectral clustering and power iteration clustering for Synthetic data. A different color
represents each view.
Figure 11: NMI and variance of co-trained spectral clustering and power iteration
clustering for Synthetic data
28
5.3. Twitter UK Politics Dataset
This dataset is introduced by Greene and Derek [23]. It contains seven views (followed by,
follows, retweeted by, retweets, tweets, mentioned by, mentions) with 1200 users (nodes).
Each of the seven views brings complementary information, and clusters found based on
all the information are likely to be more robust as well as more accurate.
Firstly, we applied Cohen's kappa coefficient to evaluate the clustering agreement between
the views (Table 1). Since the existing approach did not mention the stopping criteria of
their algorithm, we report the results obtained in the fifth iteration; however, our algorithm
achieved convergence in the fourth iteration.
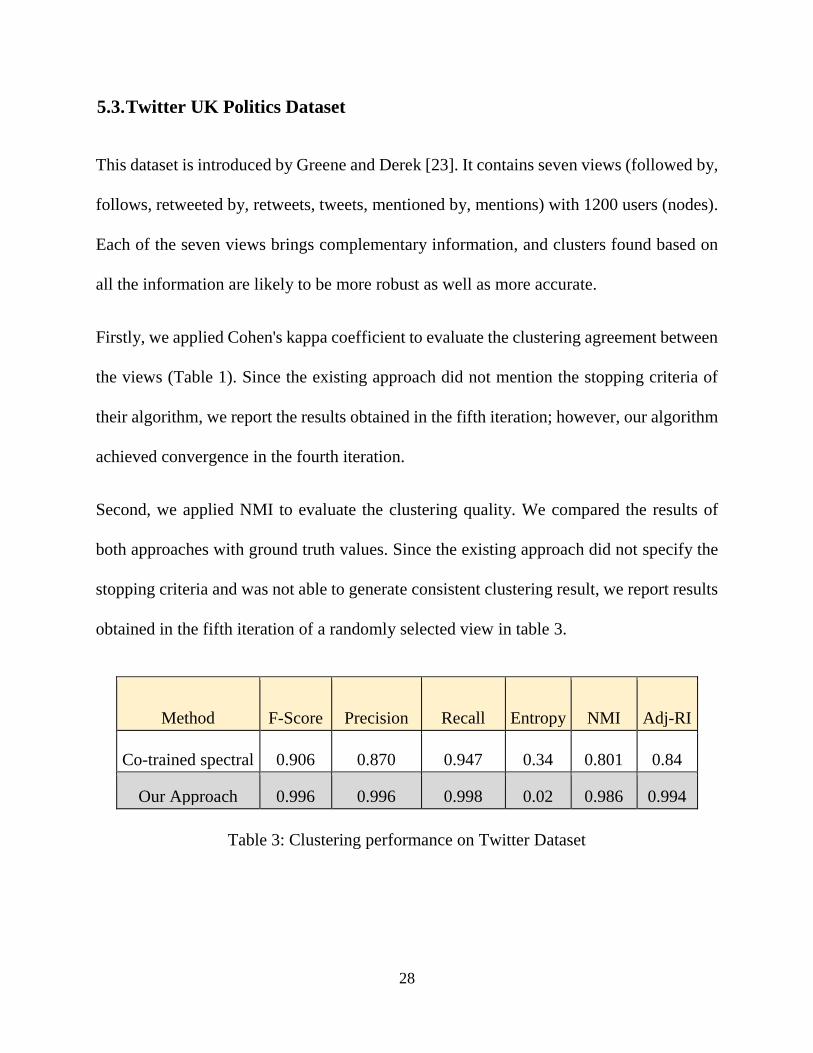
Second, we applied NMI to evaluate the clustering quality. We compared the results of
both approaches with ground truth values. Since the existing approach did not specify the
stopping criteria and was not able to generate consistent clustering result, we report results
obtained in the fifth iteration of a randomly selected view in table 3.
Method F-Score Precision Recall Entropy NMI Adj-RI
Co-trained spectral 0.906 0.870 0.947 0.34 0.801 0.84
Our Approach 0.996 0.996 0.998 0.02 0.986 0.994
Table 3: Clustering performance on Twitter Dataset
29
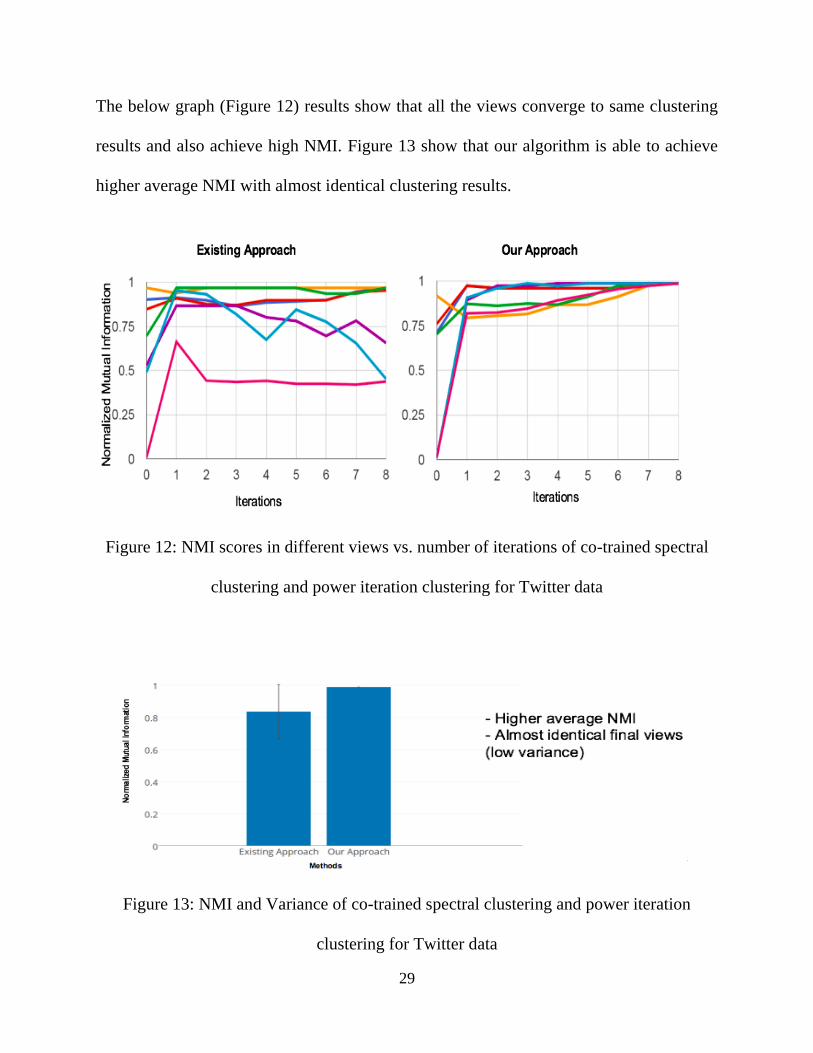
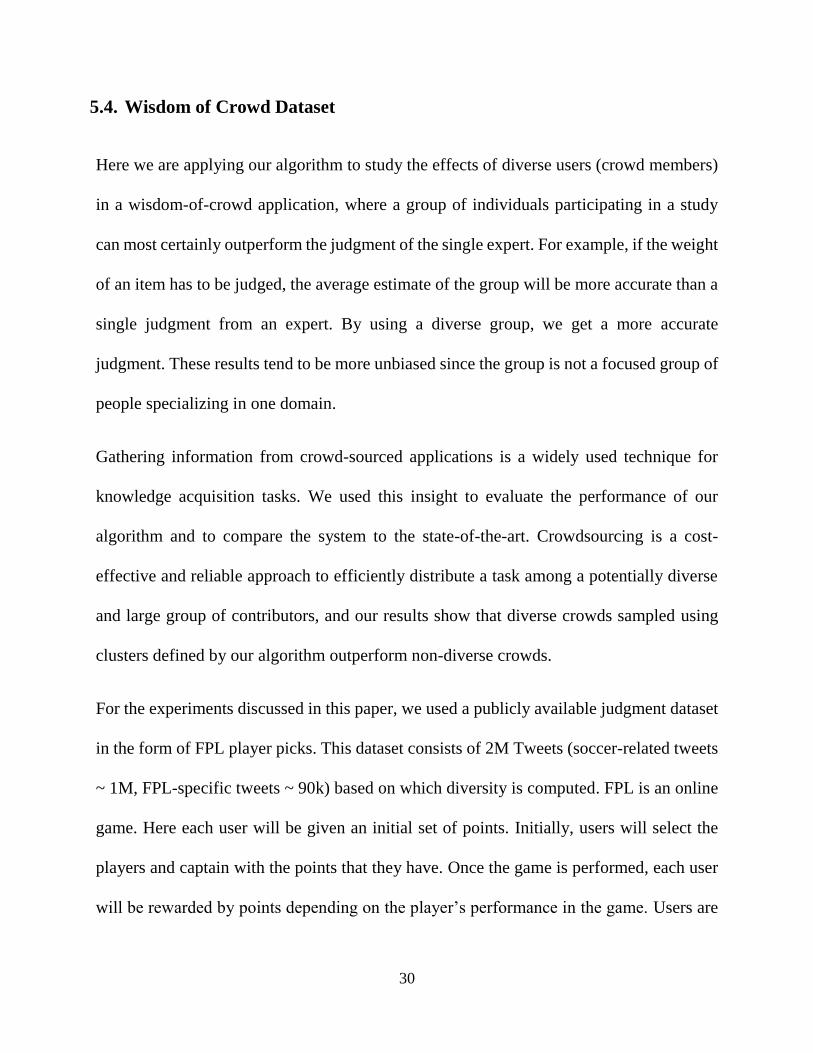
The below graph (Figure 12) results show that all the views converge to same clustering
results and also achieve high NMI. Figure 13 show that our algorithm is able to achieve
higher average NMI with almost identical clustering results.
Figure 12: NMI scores in different views vs. number of iterations of co-trained spectral
clustering and power iteration clustering for Twitter data
Figure 13: NMI and Variance of co-trained spectral clustering and power iteration
clustering for Twitter data
30
5.4. Wisdom of Crowd Dataset
Here we are applying our algorithm to study the effects of diverse users (crowd members)
in a wisdom-of-crowd application, where a group of individuals participating in a study
can most certainly outperform the judgment of the single expert. For example, if the weight
of an item has to be judged, the average estimate of the group will be more accurate than a
single judgment from an expert. By using a diverse group, we get a more accurate
judgment. These results tend to be more unbiased since the group is not a focused group of
people specializing in one domain.
Gathering information from crowd-sourced applications is a widely used technique for
knowledge acquisition tasks. We used this insight to evaluate the performance of our
algorithm and to compare the system to the state-of-the-art. Crowdsourcing is a cost-
effective and reliable approach to efficiently distribute a task among a potentially diverse
and large group of contributors, and our results show that diverse crowds sampled using
clusters defined by our algorithm outperform non-diverse crowds.
For the experiments discussed in this paper, we used a publicly available judgment dataset
in the form of FPL player picks. This dataset consists of 2M Tweets (soccer-related tweets
~ 1M, FPL-specific tweets ~ 90k) based on which diversity is computed. FPL is an online
game. Here each user will be given an initial set of points. Initially, users will select the
players and captain with the points that they have. Once the game is performed, each user
will be rewarded by points depending on the player’s performance in the game. Users are
31
motivated to select a captain that gives them the best reward [4]. Our goal is to predict
player performance based on users’ opinions.
We collected the tweets via Twitter streaming API using keywords related to FPL of
English Premier League season 2016-17 from August 2016 to November 2016
corresponding to the first four months (25 weeks) of the season. We considered tweets
related to teams mentions as one view and tweets related to players mentions as another
view. Using these tweets, we obtained the names of Twitter users. We extracted the captain
pick data from the FPL website by matching the Twitter users name and username on the
FPL website.
5.4.1. Experimental Setup
Our experimental setup was carried out as follows: initially created a similarity matrix for
each view, that is for tweets which have mentions of FPL players and tweets with mention
of the teams. This matrix was generated using the Word2vec based diversity. Word2Vec
measure is used by most state-of-the-art systems to compute the semantic similarity
between words using average pairwise cosine distance. Word2Vec has been used for
natural language processing tasks, including hashtag prediction in tweets [16], sentence
completion as reported in work by Godin, Fréderic, et al. [14], and part-of-speech tagging
[15]. Research suggests that Word2Vec can be applied to social data as well. In work by
De Boom, Cedric et al. and Wijeratne Sanjaya, et al., the authors show that it is possible to
32
identify similar Twitter users and even represent short text sentences using Word2Vec
[17][18].
We applied both existing and proposed methods to generate k user clusters using both the
views. We evaluated consensus using Cohen's kappa between the views. We report the
results obtained in the fifth iteration for both the views where the consensus between the
existing approach is 0.053, the proposed approach is 0.608. Since existing approaches are
not able to generate homogeneous clustering results from both views, we are not able to
generate diverse and non-diverse crowds. We therefore carried out the WoC experiment
only with our proposed method instead.
We used the k user clusters generated by the proposed method to form the diverse crowd
and non-diverse crowds by selecting one user from each cluster to form a diverse crowd of
k users and selecting k users from one of the clusters to form a non-diverse crowd. Using
this approach, we then generate 5000 random unique groups of different sizes, for each
category (diverse and non-diverse).
We evaluate the crowd wisdom by calculating wisdom score of each group of size n, G =
(C1, C2, ..., Cn) over 25 weeks, with group size ranging 8 to 18. The wisdom score of each
group can be computed by ∑ 𝑀𝑜𝑑(𝐶𝑖)25
1
25, where Mod(Ci) represents the score of the individual
captain receiving the most “votes” from the group in the ith game week. We observed the
following when we compared the results of diverse crowds and non-diverse crowds in
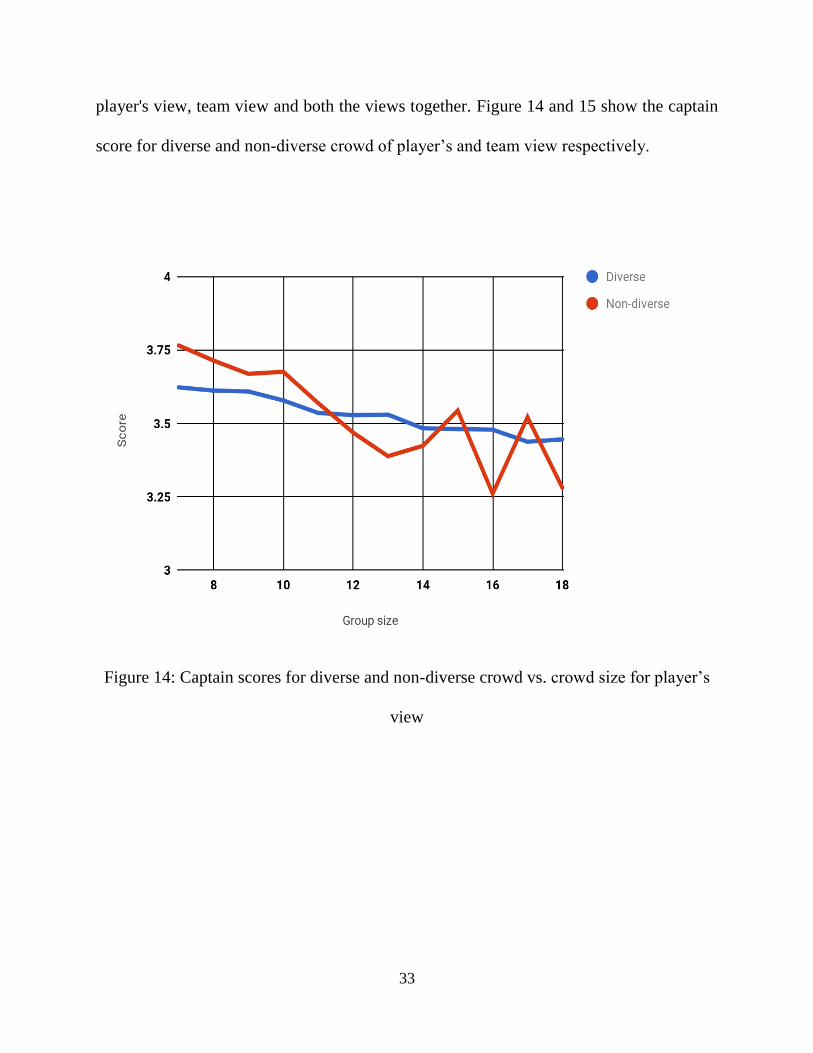
33
player's view, team view and both the views together. Figure 14 and 15 show the captain
score for diverse and non-diverse crowd of player’s and team view respectively.
Figure 14: Captain scores for diverse and non-diverse crowd vs. crowd size for player’s
view
34
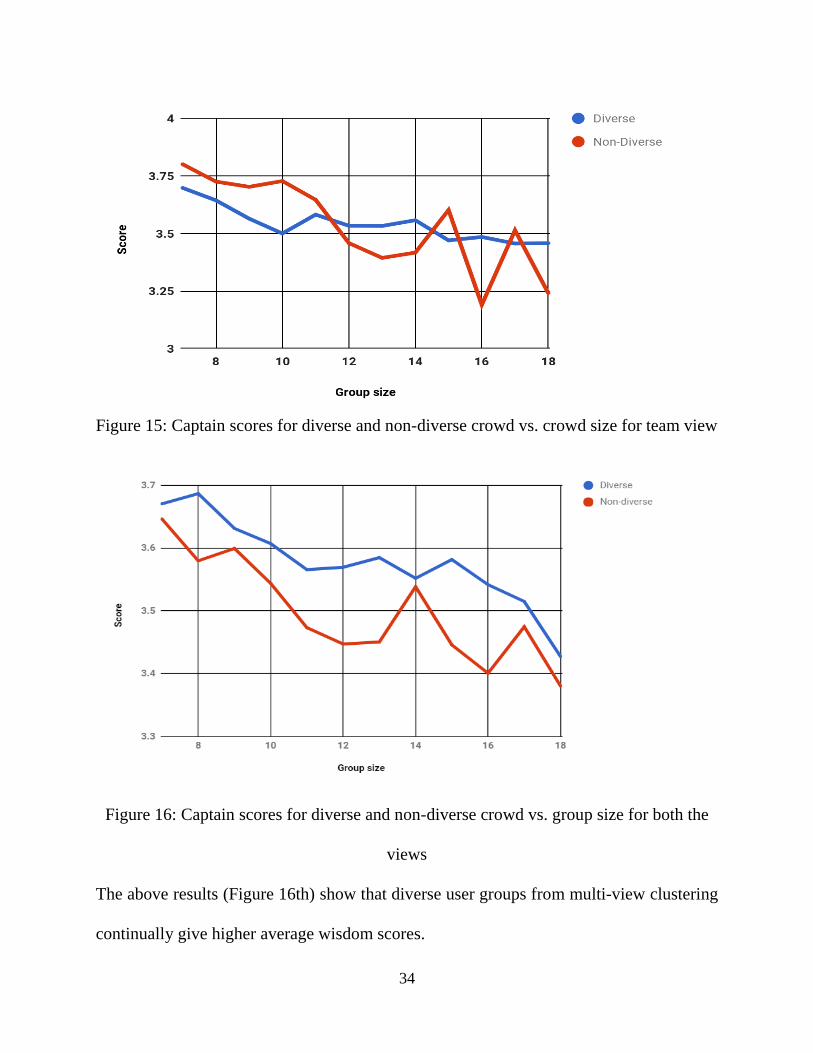
Figure 15: Captain scores for diverse and non-diverse crowd vs. crowd size for team view
Figure 16: Captain scores for diverse and non-diverse crowd vs. group size for both the
views
The above results (Figure 16th) show that diverse user groups from multi-view clustering
continually give higher average wisdom scores.
35
6. Related Work
The motivation for our method is to cluster the data points that share the similar attributes
in the multiple views by achieving the maximum clustering agreement between the views
with the efficient and scalable approach.
In this section, we discuss some of the existing work in multi-view clustering. Several
multi-view clustering algorithms have been proposed in the past which deal with multi-
view data. Most of these algorithms extract shared attributes from multiple views and apply
simple clustering algorithms like k-means on the extracted attributes. Canonical
Correlation Analysis (CCA) [19] is one best example of this kind. Some other algorithms
utilize the data in multiple views as part of the clustering algorithm. Co-EM is one best
example of this kind. Co-EM [20] iteratively computes the clustering results of each view
and uses them to update the other views for a certain number of iterations.
Co-training with multi-view clustering was first introduced by Blum and Mitchell [11].
The idea of co-training is to train various views to maximize the mutual agreement
iteratively. Spectral clustering [21] was first used in multi-view clustering by de Sa in 2005
by constructing a bipartite graph of two views [22]. In 2007, Zhou & Burges developed a
framework which is good for multiple graphs but not the best for a single graph [12].
Kumar and Daume have also done extensive work in this area [6]. They applied the idea
of co-training using spectral clustering for multi-view data where the similarity matrix of

36
one view will be computed by the eigenvector of the Laplacian in another view and vice
versa. This process is carried out through a certain number of iterations. This algorithm
often does not converge.
37
7. Conclusion
We introduce a novel framework which facilitates measuring crowd diversity and
technique to understand whether and how diversity is affecting the collective intelligence.
Here we examined whether it is possible to extract measures of a crowd’s diversity based
on its members’ social media (Twitter) communications and whether such measures can
lead to a selection of wiser crowds. We describe an efficient and scalable power iteration
based co-training approach to achieve convergence for multi-view clustering. Experiments
on real, synthetic datasets show that our algorithm can converge faster than existing
algorithms. Experimental results on WoC datasets also show that diverse crowd
outperforms non-diverse crowd.
38
Bibliogrpahy
1. Bennis, Warren, and Burt Nanus. "The strategies for taking charge." Leaders, New
York: Harper. Row (1985).
2. Surowiecki, James. The wisdom of crowds. Anchor, 2005.
3. Wagner, Christian, and Ayoung Suh. "The wisdom of crowds: impact of collective
size and expertise transfer on collective performance." System Sciences (HICSS),
2014 47th Hawaii International Conference on. IEEE, 2014.
4. Bhatt, Shreyansh, et al. "Enhancing crowd wisdom using measures of diversity
computed from social media data." Proceedings of the International Conference
on Web Intelligence. ACM, 2017.
5. Xu, Chang, Dacheng Tao, and Chao Xu. "A survey on multi-view learning." arXiv
preprint arXiv:1304.5634 (2013).
6. Kumar, Abhishek, and Hal Daumé. "A co-training approach for multi-view
spectral clustering." Proceedings of the 28th International Conference on
Machine Learning (ICML-11). 2011.
7. Ng, Andrew Y., Michael I. Jordan, and Yair Weiss. "On spectral clustering:
Analysis and an algorithm." Advances in neural information processing systems.
2002.
8. Lin, Frank, and William W. Cohen. "Power iteration clustering." (2010).
39
9. Nigam, Kamal, and Rayid Ghani. "Analyzing the effectiveness and applicability
of co-training." Proceedings of the ninth international conference on Information
and knowledge management. ACM, 2000.
10. Brefeld, Ulf, and Tobias Scheffer. "Co-EM support vector learning." Proceedings
of the twenty-first international conference on Machine learning. ACM, 2004.
11. Blum, Avrim, and Tom Mitchell. "Combining labeled and unlabeled data with co-
training." Proceedings of the eleventh annual conference on Computational
learning theory. ACM, 1998.
12. Zhou, Dengyong, and Christopher JC Burges. "Spectral clustering and
transductive learning with multiple views." Proceedings of the 24th international
conference on Machine learning. ACM, 2007.
13. Bickel, Steffen, and Tobias Scheffer. "Multi-view clustering." ICDM. Vol. 4.
2004.
14. Godin, Fréderic, et al. "Alleviating Manual Feature Engineering for Part-of-
Speech Tagging of Twitter Microposts using Distributed Word Representations."
Workshop on Modern Machine Learning and Natural Language Processing,
NIPS. 2014.
15. Hu, Baotian, et al. "Convolutional neural network architectures for matching
natural language sentences." Advances in neural information processing systems.
2014.
16. Weston, Jason, Sumit Chopra, and Keith Adams. "# tagspace: Semantic
embeddings from hashtags." (2014).
40
17. De Boom, Cedric, et al. "Learning semantic similarity for very short texts." Data
Mining Workshop (ICDMW), 2015 IEEE International Conference on. IEEE,
2015.
18. Wijeratne, Sanjaya, et al. "Word embeddings to enhance twitter gang member
profile identification." arXiv preprint arXiv:1610.08597 (2016).
19. Thompson, Bruce. "Canonical correlation analysis." Encyclopedia of statistics in
behavioral science (2005).
20. Brefeld, Ulf, and Tobias Scheffer. "Co-EM support vector learning." Proceedings
of the twenty-first international conference on Machine learning. ACM, 2004.
21. Von Luxburg, Ulrike. "A tutorial on spectral clustering." Statistics and computing
17.4 (2007): 395-416.
22. De Sa, Virginia R. "Spectral clustering with two views." ICML workshop on
learning with multiple views. 2005.
23. Greene, Derek, and Pádraig Cunningham. "Producing a unified graph
representation from multiple social network views." Proceedings of the 5th annual
ACM web science conference. ACM, 2013.
24. Kumar, Abhishek, Piyush Rai, and Hal Daume. "Co-regularized multi-view
spectral clustering." Advances in neural information processing systems. 2011.
41
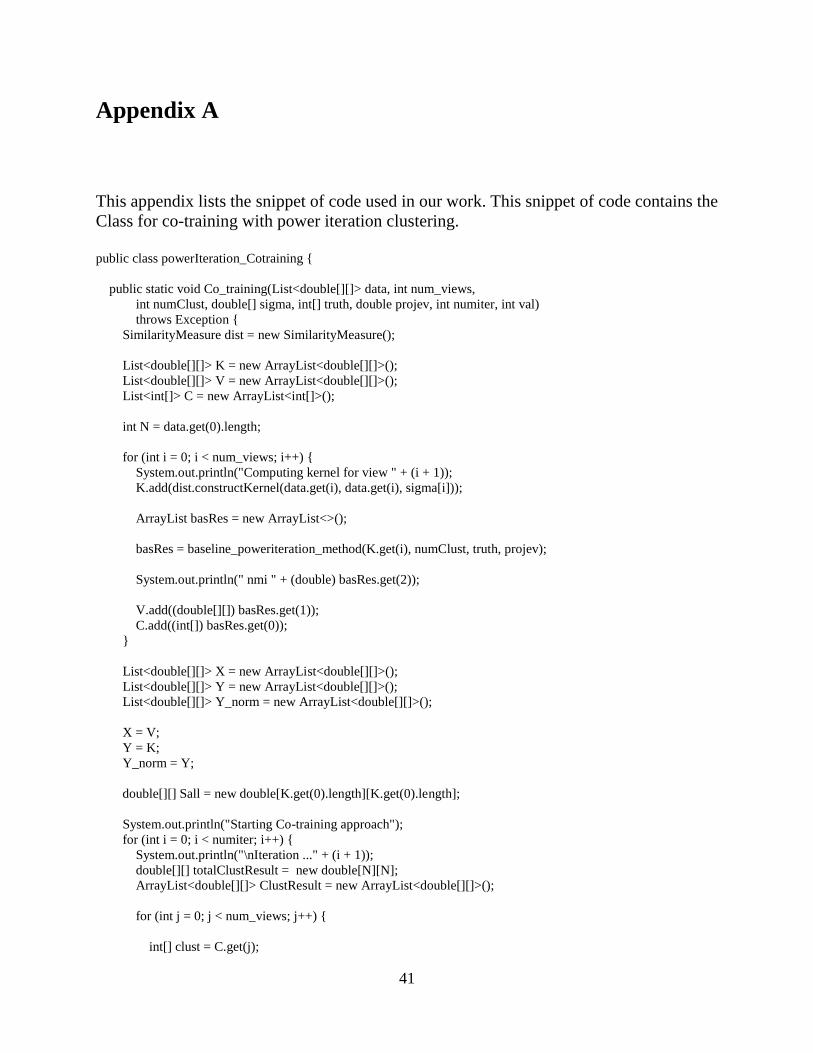
Appendix A
This appendix lists the snippet of code used in our work. This snippet of code contains the
Class for co-training with power iteration clustering.
public class powerIteration_Cotraining {
public static void Co_training(List<double[][]> data, int num_views,
int numClust, double[] sigma, int[] truth, double projev, int numiter, int val)
throws Exception {
SimilarityMeasure dist = new SimilarityMeasure();
List<double[][]> K = new ArrayList<double[][]>();
List<double[][]> V = new ArrayList<double[][]>();
List<int[]> C = new ArrayList<int[]>();
int N = data.get(0).length;
for (int i = 0; i < num_views; i++) {
System.out.println("Computing kernel for view " + (i + 1));
K.add(dist.constructKernel(data.get(i), data.get(i), sigma[i]));
ArrayList basRes = new ArrayList<>();
basRes = baseline_poweriteration_method(K.get(i), numClust, truth, projev);
System.out.println(" nmi " + (double) basRes.get(2));
V.add((double[][]) basRes.get(1));
C.add((int[]) basRes.get(0));
}
List<double[][]> X = new ArrayList<double[][]>();
List<double[][]> Y = new ArrayList<double[][]>();
List<double[][]> Y_norm = new ArrayList<double[][]>();
X = V;
Y = K;
Y_norm = Y;
double[][] Sall = new double[K.get(0).length][K.get(0).length];
System.out.println("Starting Co-training approach");
for (int i = 0; i < numiter; i++) {
System.out.println("\nIteration ..." + (i + 1));
double[][] totalClustResult = new double[N][N];
ArrayList<double[][]> ClustResult = new ArrayList<double[][]>();
for (int j = 0; j < num_views; j++) {
int[] clust = C.get(j);
42
double[][] Kval = K.get(j);
double[][] tmpClustResult = new double[N][N];
for(int row_iter=0;row_iter<N-1;row_iter++)
{
tmpClustResult[row_iter][row_iter] = 1;
for (int col_iter = row_iter+1;col_iter<N;col_iter++)
{
if(Kval[row_iter][col_iter] != 0)
{
if(clust[row_iter] == clust[col_iter])
{
tmpClustResult[row_iter][col_iter] = 1;
tmpClustResult[row_iter][col_iter] = 1;
}
else
{
tmpClustResult[row_iter][col_iter] = 0;
tmpClustResult[row_iter][col_iter] = 0;
}
}
else
{
tmpClustResult[row_iter][col_iter] = 0;
tmpClustResult[row_iter][col_iter] = 0;
}
}
}
ClustResult.add(j,tmpClustResult);
totalClustResult = MatrixOperations.sumMatrix(totalClustResult,tmpClustResult);
}
double alpha = (double)1/num_views;
for (int j = 0; j < num_views; j++) {
double[][] Xtmp = X.get(j);
double[][] Ktmp = K.get(j);
Matrix Kmat = new Matrix(Ktmp);
Matrix totalClustResultMat = new Matrix(totalClustResult);
Matrix ClustResultMat = new Matrix(ClustResult.get(j));
Matrix YtmpMat = totalClustResultMat.minus(ClustResultMat);
Matrix Ymat = Kmat.plus(YtmpMat.times(alpha));
Ymat = Ymat.plus(Ymat.transpose());
double[][] YnTmp = Ymat.getArray();
for (int ll = 0; ll < YnTmp.length; ll++) {
for (int lm = 0; lm < YnTmp.length; lm++) {
YnTmp[ll][lm] = YnTmp[ll][lm] / 2;
}
}
Y.set(j, YnTmp);
Y_norm.set(j, YnTmp);
43
ArrayList basRes = new ArrayList<>();
basRes = baseline_poweriteration_method(YnTmp, numClust, truth, projev);
X.set(j, (double[][]) basRes.get(1));
C.set(j, (int[]) basRes.get(0));
System.out.println(" nmi " + (double) basRes.get(2));
}
}
}
}


![T-76.4115 Iteration Demo BaseByters [I1] Iteration 04.12.2005](https://img.pdfslide.net/doc/110x75/56649cff5503460f949d053f/t-764115-iteration-demo-basebyters-i1-iteration-04122005.jpg)