Embed Size (px)
Citation preview
Marine Pollution Bulletin 59 (2009) 65–71
Contents lists available at ScienceDirect
Marine Pollution Bulletin
journal homepage: www.elsevier .com/ locate /marpolbul
A process for comparing and interpreting differences in two benthicindices in New York Harbor
Sandra J. Benyi *, Jeffrey W. Hollister, John A. Kiddon, Henry A. WalkerUS Environmental Protection Agency, Office of Research and Development, National Health and Environmental Effects Research Laboratory, Atlantic Ecology Division,Narragansett, RI 02882, United States
a r t i c l e i n f o
Keywords:Benthic indexSediment contaminationEMAPREMAPConditional probabilityROC curvesBenthic community
0025-326X/$ - see front matter Published by Elsevierdoi:10.1016/j.marpolbul.2008.11.009
* Corresponding author. Tel.: +1 (401) 782 3041.E-mail address: [email protected] (S.J. Benyi).
a b s t r a c t
Often when various estuarine benthic indices disagree in their assessments of benthic condition, they arereflecting different aspects of benthic condition. We describe a process to screen indices for associationsand, after identifying candidate metrics, evaluate metrics individually against the indices. We utilizeradar plots as a multi-metric visualization tool, and conditional probability plots and receiver operatingcharacteristic curves to evaluate associations seen in the plots. We investigated differences in two indi-ces, the US EPA Environmental Monitoring and Assessment Program’s benthic index for the VirginianProvince and the New York Harbor benthic index of biotic integrity using data collected in New York Har-bor and evaluated overall agreement of the indices and associations between each index and measures ofhabitat and sediment contamination. The indices agreed in approximately 78% of the cases. The New YorkHarbor benthic index of biotic integrity showed stronger associations with sediment metal contamina-tion and grain size.
Published by Elsevier Ltd.
1. Introduction
Observations of highly contaminated estuarine areas in thevicinity of New York City, New York from EPA’s EnvironmentalMonitoring and Assessment Program (EMAP; Strobel et al., 1995)brought much attention to the New York Harbor area. Based oncoastal monitoring data collected from 1990 through 1993 fromthe Virginian Province (from Cape Cod, Massachusetts to the Ches-apeake Bay, Virginia), the New York Harbor area was found to havehigher than average sediment concentrations for all but one of the59 chemicals measured.
Following the EMAP study, two investigations (one in 1993 and1994 and another in 1998) were conducted by the US EPA Region 2to evaluate water quality, sediment contaminants, and the benthiccommunity structure of New York Harbor through a programknown as Regional EMAP (REMAP). At the start of the regionalmonitoring program, the main tool used to evaluate benthic com-munity condition for similar studies in the Virginian Province wasthe EMAP benthic index (EMAP BI; Paul et al., 2001). The regionaloffice and their partners perceived a need for and developed an in-dex specifically for the New York area (Adams et al., 1998). This,however, meant that two indices could be applied to the same dataset.
Ltd.
Borja and Dauer (2008), observing the need for validating andintercalibrating multiple indices, recommended intercalibrationsby assessing agreement between indices by using benthic exper-tise to assess benthic condition as was done by Weisberg et al.(2008) and by assessing the level of agreement when using multi-ple indices as was done by Borja et al. (2007, 2008).
Several questions arise from applying two indices to the moni-toring data from the New York Harbor. First, how do they agree ordisagree in their assessment of benthic condition? Second, how dowe identify associations of other parameters (e.g. sediment metalsand habitat characteristics) with those places of agreement ordisagreement?
This paper describes a screening and evaluation process bywhich we can examine indices and their associations with environ-mental metrics. We utilize radar plots as a multi-metric visualiza-tion tool to screen for differences in water and sedimentparameters, and conditional probability plots and receiver operat-ing characteristic (ROC) curves to evaluate any apparent associa-tions seen in the radar plots, and then apply this process to acase study in New York Harbor.
2. Materials and methods
2.1. Study area and data
Our study area was the New York Harbor system including theUpper and Lower Harbors, Newark Bay, and Jamaica Bay (Fig. 1).
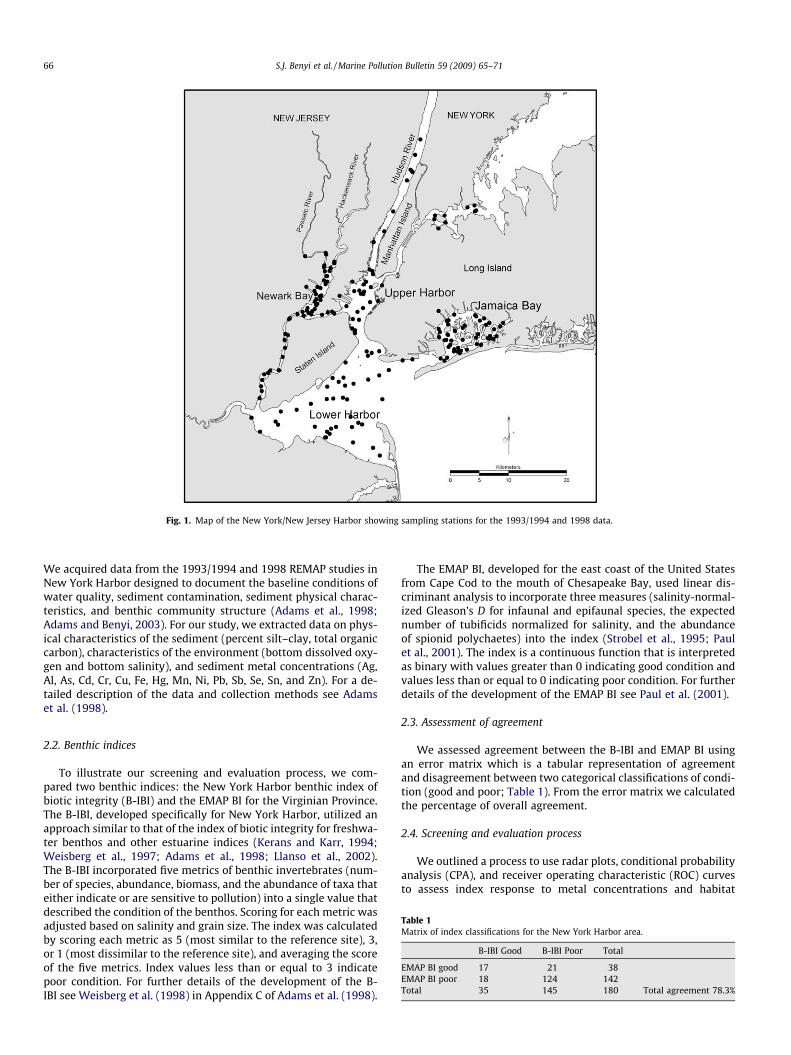
Fig. 1. Map of the New York/New Jersey Harbor showing sampling stations for the 1993/1994 and 1998 data.
66 S.J. Benyi et al. / Marine Pollution Bulletin 59 (2009) 65–71
We acquired data from the 1993/1994 and 1998 REMAP studies inNew York Harbor designed to document the baseline conditions ofwater quality, sediment contamination, sediment physical charac-teristics, and benthic community structure (Adams et al., 1998;Adams and Benyi, 2003). For our study, we extracted data on phys-ical characteristics of the sediment (percent silt–clay, total organiccarbon), characteristics of the environment (bottom dissolved oxy-gen and bottom salinity), and sediment metal concentrations (Ag,Al, As, Cd, Cr, Cu, Fe, Hg, Mn, Ni, Pb, Sb, Se, Sn, and Zn). For a de-tailed description of the data and collection methods see Adamset al. (1998).
Table 1Matrix of index classifications for the New York Harbor area.
B-IBI Good B-IBI Poor Total
EMAP BI good 17 21 38EMAP BI poor 18 124 142Total 35 145 180 Total agreement 78.3%
2.2. Benthic indices
To illustrate our screening and evaluation process, we com-pared two benthic indices: the New York Harbor benthic index ofbiotic integrity (B-IBI) and the EMAP BI for the Virginian Province.The B-IBI, developed specifically for New York Harbor, utilized anapproach similar to that of the index of biotic integrity for freshwa-ter benthos and other estuarine indices (Kerans and Karr, 1994;Weisberg et al., 1997; Adams et al., 1998; Llanso et al., 2002).The B-IBI incorporated five metrics of benthic invertebrates (num-ber of species, abundance, biomass, and the abundance of taxa thateither indicate or are sensitive to pollution) into a single value thatdescribed the condition of the benthos. Scoring for each metric wasadjusted based on salinity and grain size. The index was calculatedby scoring each metric as 5 (most similar to the reference site), 3,or 1 (most dissimilar to the reference site), and averaging the scoreof the five metrics. Index values less than or equal to 3 indicatepoor condition. For further details of the development of the B-IBI see Weisberg et al. (1998) in Appendix C of Adams et al. (1998).
The EMAP BI, developed for the east coast of the United Statesfrom Cape Cod to the mouth of Chesapeake Bay, used linear dis-criminant analysis to incorporate three measures (salinity-normal-ized Gleason’s D for infaunal and epifaunal species, the expectednumber of tubificids normalized for salinity, and the abundanceof spionid polychaetes) into the index (Strobel et al., 1995; Paulet al., 2001). The index is a continuous function that is interpretedas binary with values greater than 0 indicating good condition andvalues less than or equal to 0 indicating poor condition. For furtherdetails of the development of the EMAP BI see Paul et al. (2001).
2.3. Assessment of agreement
We assessed agreement between the B-IBI and EMAP BI usingan error matrix which is a tabular representation of agreementand disagreement between two categorical classifications of condi-tion (good and poor; Table 1). From the error matrix we calculatedthe percentage of overall agreement.
2.4. Screening and evaluation process
We outlined a process to use radar plots, conditional probabilityanalysis (CPA), and receiver operating characteristic (ROC) curvesto assess index response to metal concentrations and habitat
S.J. Benyi et al. / Marine Pollution Bulletin 59 (2009) 65–71 67
measures including physical sediment structure and water chemis-try. We utilized a two-step process. First, we screened the datawith a matrix of radar plots to identify broad, multivariate associ-ations between environmental metrics and each index’s classifica-tion of condition. Second, where metrics appeared to be related toat least one index, we used CPA plots and ROC curves to evaluatethat association.
The first step in our process was to screen multivariate environ-mental metric data, e.g., concentrations of 15 metals in sediments,for apparent relationships to each index. Sites were groupedaccording to a good or poor rating by the EMAP BI and by the B-IBI, for a total of four groups. Average concentrations were calcu-lated separately for each metal for each group, and normalizedby dividing by the average metal concentration for all sites. Nor-malization was necessary to plot metrics with different units ormagnitudes on radar plots. When greater than 100%, the metricwas greater than average, and, conversely, when less than 100%,the metric was less than average. We also screened four metricstypically used to characterize habitat condition (bottom watersalinity and dissolved oxygen, and percent silt–clay and TOC insediment). The large quantity of summarized data was comparedusing radar plots, which readily highlighted differences in the de-gree of sediment contamination at good and poor sites, as evalu-ated by one index or the other.
In cases where the screening step of our process identified apossible response of an index to a particular environmental metric,we used CPA and ROC curves to further evaluate any apparentassociations. A conditional probability describes the probabilityof observing an event if another event has occurred. In this study,conditional probability was the probability of impairment when anenvironmental metric was greater than a given amount (e.g., theprobability of EMAP BI less than or equal to 0 if silver concentra-tions exceeded a given amount). We used CPA plots to identify sig-nificant associations (a = 0.05) between an environmental metricand the probability of impairment. Confidence intervals (CIs) ofthe conditional probabilities were calculated with bootstrap re-sampling. The first point of the CPA plot is called the unconditionalprobability of impairment, measuring the probability of impair-ment regardless of the value of the environmental metric. A condi-tional probability was significant when the range of the CI of theunconditional probability did not include the range of the CI of aconditional probability, suggesting that the change in probabilitywas a function of the tested metric. For details of CPA and methodsof interpreting conditional probability plots, refer to Paul andMcDonald (2005) and Hollister et al. (2008).
Lastly, to continue to evaluate the responses of the indices toindividual metrics and how well they distinguished between goodand poor condition, we used ROC curves. ROC curves are often usedto determine acceptable error rates when evaluating alternativemodels, especially in the medical field. In an ROC curve, the truepositive fraction (TPF; a positive outcome where a positive out-come is expected) is plotted versus the false positive fraction(FPF; a positive outcome where a negative one is expected). Themore a curve deviates from the line where TPF and FPF are equal,the greater the ability of a model to predict condition accurately.The total area under the curve of the line is useful to compare mul-tiple models or, as in our case, multiple indices. For details of ROCcurves and ROC analysis see Fawcett (2006).
3. Results and discussion
New York Harbor had a high percentage of stations with im-pacted benthic communities whether using the B-IBI or the EMAPBI (81% and 79%, respectively, Table 1). The B-IBI and EMAP BIagreed in their assessments of benthic condition at about 78% of
sites in NY Harbor (141 of 180 stations). The B-IBI only classifiedthree more stations as impacted in the NY/NJ Harbor than didthe EMAP BI, but the stations designated as impacted by each indexdiffered.
Although 78% agreement is good, it is instructive to examinewhere and why 22% disagree. Such information could reveal partic-ular strengths or weaknesses of one index over another. This studysite served to illustrate a procedure that examined relationshipsbetween a benthic index and pertinent metrics.
While both the B-IBI and EMAP BI can be applied to the regionaldata, it is important to understand the EMAP BI was developed as abroad provincial indicator of benthic condition of estuaries of theVirginian Province and the B-IBI was developed as a regional indi-cator using reference data from New York Harbor. The indices weevaluated were developed using different biological relationshipsand environmental parameters. Neither index was developed usingany direct relationship with chemical contamination. However,when exploring these data sets and applying more than one indexof biological condition to them, it was clear that the indices havedifferent patterns of response.
Presumably, the two benthic indices sometimes disagreed intheir assessments because their underlying biological componentswere responsive to different environmental conditions and stressormetrics. It would be useful to identify these metrics and under-stand how they influence the assessments, especially when tryingto interpret results of an assessment or when deciding which indexto use. We employed a two-step process to help in these tasks.First, a screening procedure highlighted candidate metrics with arelationship to the B-IBI or EMAP BI qualitatively, and second, anevaluation step provided information about a few select metricsquantitatively. Below, we step through examples using the screen-ing and evaluation process for metals in sediment and habitatcondition.
3.1. Screening relationships between benthic index scores, and metalsand habitat
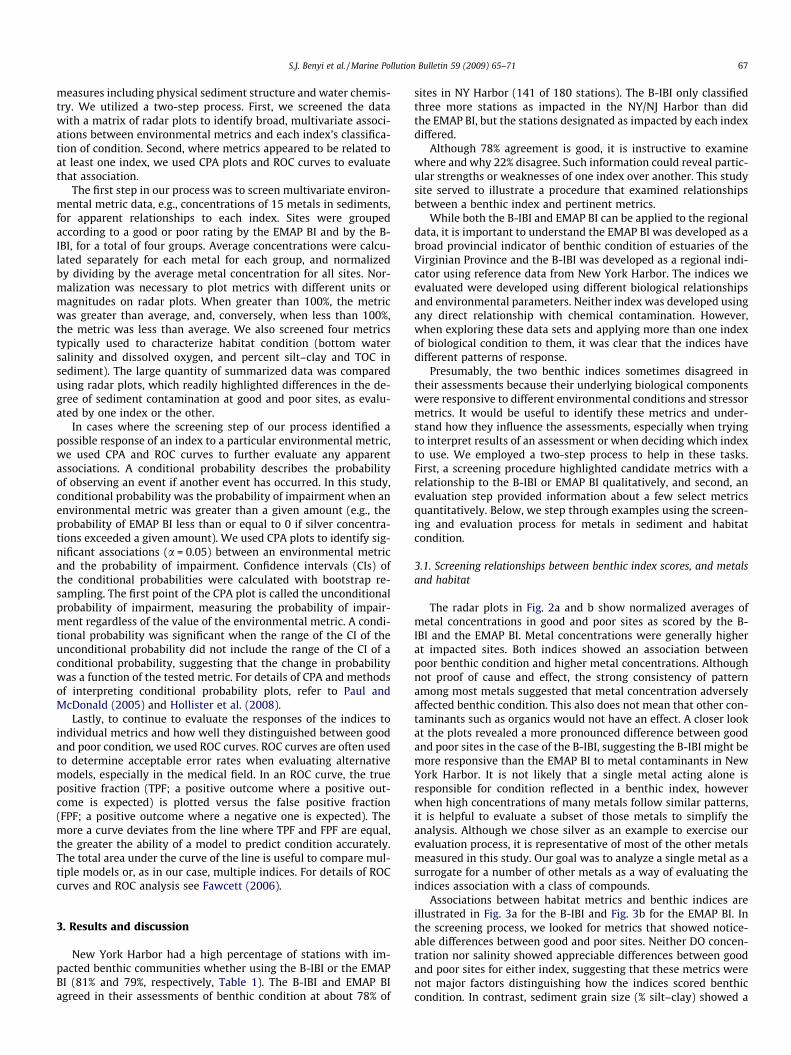
The radar plots in Fig. 2a and b show normalized averages ofmetal concentrations in good and poor sites as scored by the B-IBI and the EMAP BI. Metal concentrations were generally higherat impacted sites. Both indices showed an association betweenpoor benthic condition and higher metal concentrations. Althoughnot proof of cause and effect, the strong consistency of patternamong most metals suggested that metal concentration adverselyaffected benthic condition. This also does not mean that other con-taminants such as organics would not have an effect. A closer lookat the plots revealed a more pronounced difference between goodand poor sites in the case of the B-IBI, suggesting the B-IBI might bemore responsive than the EMAP BI to metal contaminants in NewYork Harbor. It is not likely that a single metal acting alone isresponsible for condition reflected in a benthic index, howeverwhen high concentrations of many metals follow similar patterns,it is helpful to evaluate a subset of those metals to simplify theanalysis. Although we chose silver as an example to exercise ourevaluation process, it is representative of most of the other metalsmeasured in this study. Our goal was to analyze a single metal as asurrogate for a number of other metals as a way of evaluating theindices association with a class of compounds.
Associations between habitat metrics and benthic indices areillustrated in Fig. 3a for the B-IBI and Fig. 3b for the EMAP BI. Inthe screening process, we looked for metrics that showed notice-able differences between good and poor sites. Neither DO concen-tration nor salinity showed appreciable differences between goodand poor sites for either index, suggesting that these metrics werenot major factors distinguishing how the indices scored benthiccondition. In contrast, sediment grain size (% silt–clay) showed a
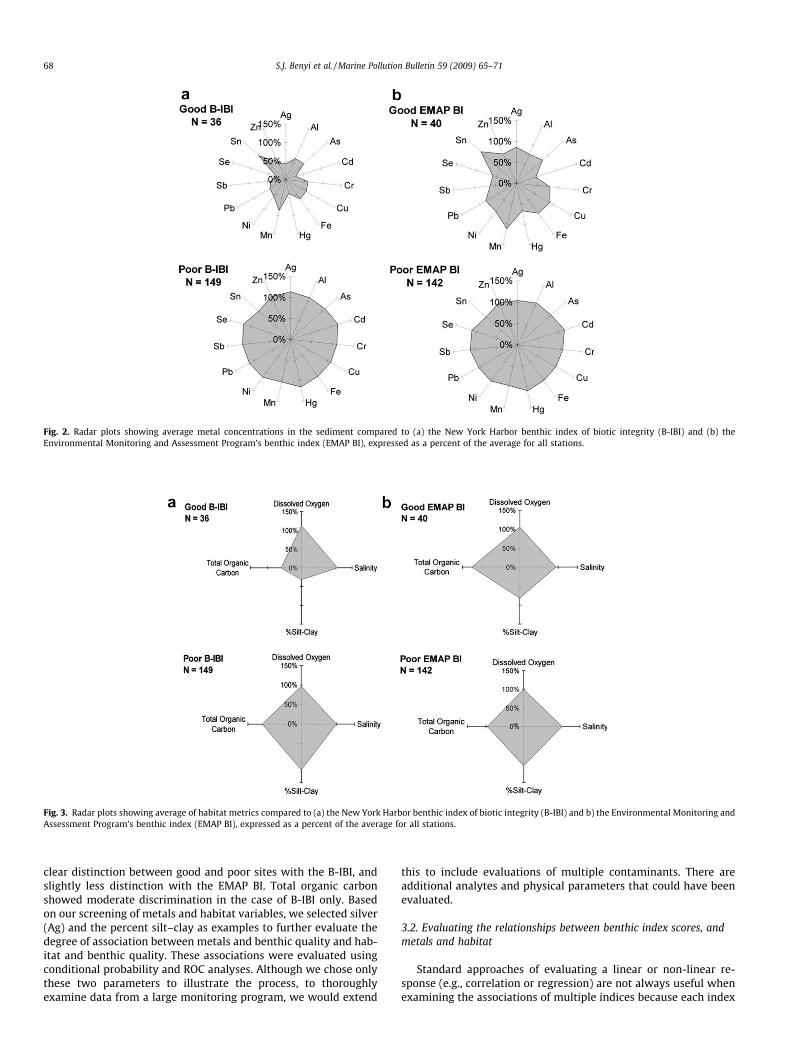
Fig. 2. Radar plots showing average metal concentrations in the sediment compared to (a) the New York Harbor benthic index of biotic integrity (B-IBI) and (b) theEnvironmental Monitoring and Assessment Program’s benthic index (EMAP BI), expressed as a percent of the average for all stations.
Fig. 3. Radar plots showing average of habitat metrics compared to (a) the New York Harbor benthic index of biotic integrity (B-IBI) and b) the Environmental Monitoring andAssessment Program’s benthic index (EMAP BI), expressed as a percent of the average for all stations.
68 S.J. Benyi et al. / Marine Pollution Bulletin 59 (2009) 65–71
clear distinction between good and poor sites with the B-IBI, andslightly less distinction with the EMAP BI. Total organic carbonshowed moderate discrimination in the case of B-IBI only. Basedon our screening of metals and habitat variables, we selected silver(Ag) and the percent silt–clay as examples to further evaluate thedegree of association between metals and benthic quality and hab-itat and benthic quality. These associations were evaluated usingconditional probability and ROC analyses. Although we chose onlythese two parameters to illustrate the process, to thoroughlyexamine data from a large monitoring program, we would extend
this to include evaluations of multiple contaminants. There areadditional analytes and physical parameters that could have beenevaluated.
3.2. Evaluating the relationships between benthic index scores, andmetals and habitat
Standard approaches of evaluating a linear or non-linear re-sponse (e.g., correlation or regression) are not always useful whenexamining the associations of multiple indices because each index
S.J. Benyi et al. / Marine Pollution Bulletin 59 (2009) 65–71 69
might use different thresholds or scales. Furthermore, the EMAP BIcan only be used categorically, indicating either good or poor ben-thic condition (Paul et al., 2001). These limitations required an ap-proach that examined associations between a binary responsevariable and a continuous variable.
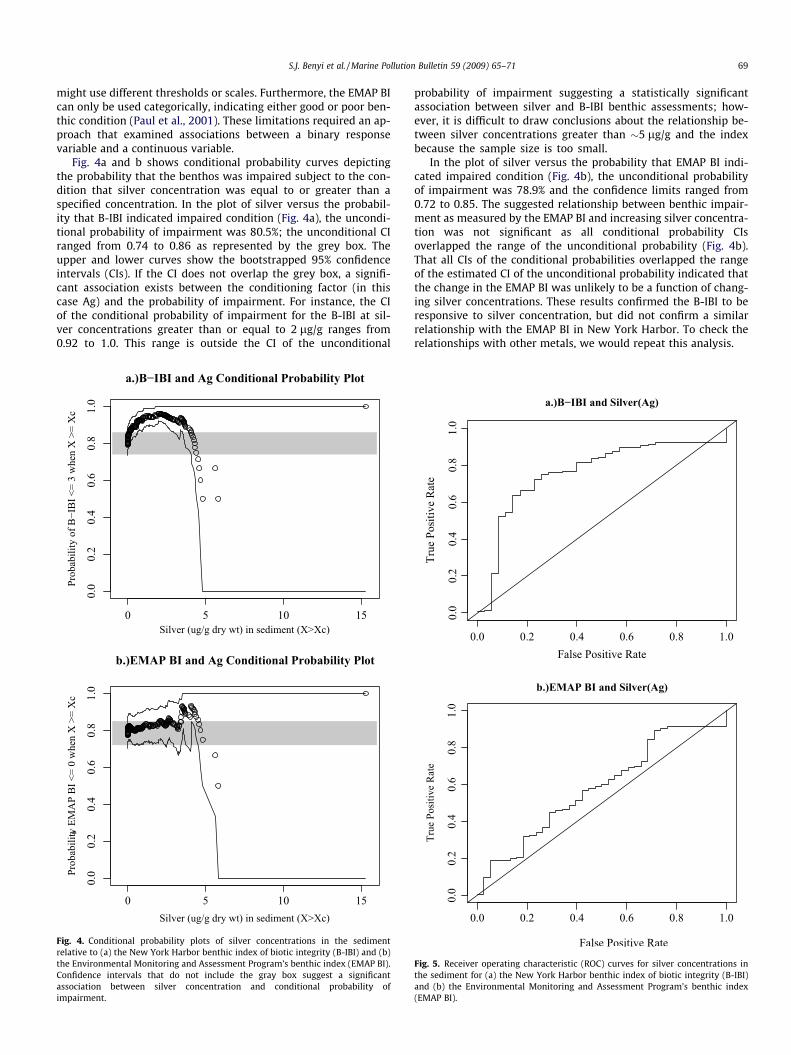
Fig. 4a and b shows conditional probability curves depictingthe probability that the benthos was impaired subject to the con-dition that silver concentration was equal to or greater than aspecified concentration. In the plot of silver versus the probabil-ity that B-IBI indicated impaired condition (Fig. 4a), the uncondi-tional probability of impairment was 80.5%; the unconditional CIranged from 0.74 to 0.86 as represented by the grey box. Theupper and lower curves show the bootstrapped 95% confidenceintervals (CIs). If the CI does not overlap the grey box, a signifi-cant association exists between the conditioning factor (in thiscase Ag) and the probability of impairment. For instance, the CIof the conditional probability of impairment for the B-IBI at sil-ver concentrations greater than or equal to 2 lg/g ranges from0.92 to 1.0. This range is outside the CI of the unconditional
Fig. 4. Conditional probability plots of silver concentrations in the sedimentrelative to (a) the New York Harbor benthic index of biotic integrity (B-IBI) and (b)the Environmental Monitoring and Assessment Program’s benthic index (EMAP BI).Confidence intervals that do not include the gray box suggest a significantassociation between silver concentration and conditional probability ofimpairment.
probability of impairment suggesting a statistically significantassociation between silver and B-IBI benthic assessments; how-ever, it is difficult to draw conclusions about the relationship be-tween silver concentrations greater than �5 lg/g and the indexbecause the sample size is too small.
In the plot of silver versus the probability that EMAP BI indi-cated impaired condition (Fig. 4b), the unconditional probabilityof impairment was 78.9% and the confidence limits ranged from0.72 to 0.85. The suggested relationship between benthic impair-ment as measured by the EMAP BI and increasing silver concentra-tion was not significant as all conditional probability CIsoverlapped the range of the unconditional probability (Fig. 4b).That all CIs of the conditional probabilities overlapped the rangeof the estimated CI of the unconditional probability indicated thatthe change in the EMAP BI was unlikely to be a function of chang-ing silver concentrations. These results confirmed the B-IBI to beresponsive to silver concentration, but did not confirm a similarrelationship with the EMAP BI in New York Harbor. To check therelationships with other metals, we would repeat this analysis.
Fig. 5. Receiver operating characteristic (ROC) curves for silver concentrations inthe sediment for (a) the New York Harbor benthic index of biotic integrity (B-IBI)and (b) the Environmental Monitoring and Assessment Program’s benthic index(EMAP BI).
70 S.J. Benyi et al. / Marine Pollution Bulletin 59 (2009) 65–71
We gained further insight by viewing the ROC curves con-structed using silver concentration data with the B-IBI or EMAP BIdata (Fig. 5a and b, respectively). In Fig. 5a, silver concentrationwas considered to be a predictive indicator of benthic conditionas rated by the B-IBI (i.e., silver levels above a threshold should pre-dict a poor B-IBI score). We used the ROC curves in Fig. 5a and b toview how the B-IBI and EMAP BI indices related to silver. The stee-ply curved line in the B-IBI plot indicates that the B-IBI exhibited astrong association with silver concentrations. Sites with high silverconcentrations were likely to be rated poor by the B-IBI. In contrast,the relatively small area under the curve in the case of the EMAP BIindicated a weak association with silver concentrations. The areaunder the curve for B-IBI and EMAP BI were 0.759 and 0.581,respectively. These observations were consistent with the resultsof the screening process and the conditional probability analysis.
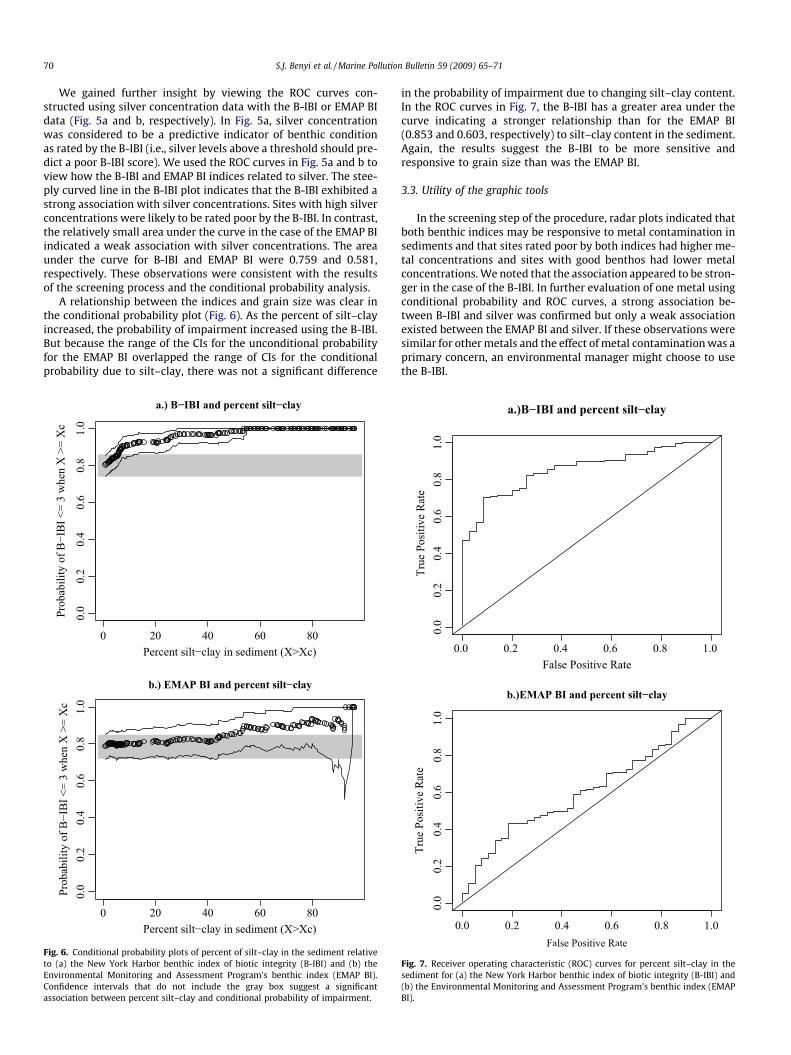
A relationship between the indices and grain size was clear inthe conditional probability plot (Fig. 6). As the percent of silt–clayincreased, the probability of impairment increased using the B-IBI.But because the range of the CIs for the unconditional probabilityfor the EMAP BI overlapped the range of CIs for the conditionalprobability due to silt–clay, there was not a significant difference
Fig. 6. Conditional probability plots of percent of silt–clay in the sediment relativeto (a) the New York Harbor benthic index of biotic integrity (B-IBI) and (b) theEnvironmental Monitoring and Assessment Program’s benthic index (EMAP BI).Confidence intervals that do not include the gray box suggest a significantassociation between percent silt–clay and conditional probability of impairment.
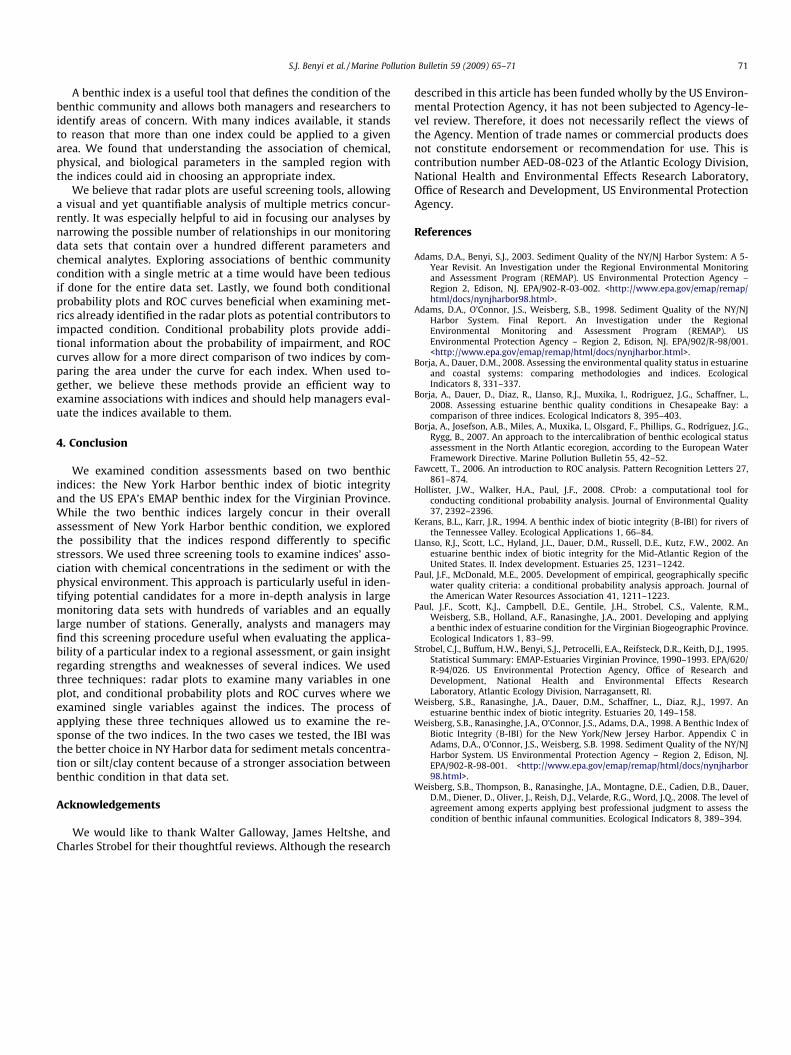
in the probability of impairment due to changing silt–clay content.In the ROC curves in Fig. 7, the B-IBI has a greater area under thecurve indicating a stronger relationship than for the EMAP BI(0.853 and 0.603, respectively) to silt–clay content in the sediment.Again, the results suggest the B-IBI to be more sensitive andresponsive to grain size than was the EMAP BI.
3.3. Utility of the graphic tools
In the screening step of the procedure, radar plots indicated thatboth benthic indices may be responsive to metal contamination insediments and that sites rated poor by both indices had higher me-tal concentrations and sites with good benthos had lower metalconcentrations. We noted that the association appeared to be stron-ger in the case of the B-IBI. In further evaluation of one metal usingconditional probability and ROC curves, a strong association be-tween B-IBI and silver was confirmed but only a weak associationexisted between the EMAP BI and silver. If these observations weresimilar for other metals and the effect of metal contamination was aprimary concern, an environmental manager might choose to usethe B-IBI.
Fig. 7. Receiver operating characteristic (ROC) curves for percent silt–clay in thesediment for (a) the New York Harbor benthic index of biotic integrity (B-IBI) and(b) the Environmental Monitoring and Assessment Program’s benthic index (EMAPBI).
S.J. Benyi et al. / Marine Pollution Bulletin 59 (2009) 65–71 71
A benthic index is a useful tool that defines the condition of thebenthic community and allows both managers and researchers toidentify areas of concern. With many indices available, it standsto reason that more than one index could be applied to a givenarea. We found that understanding the association of chemical,physical, and biological parameters in the sampled region withthe indices could aid in choosing an appropriate index.
We believe that radar plots are useful screening tools, allowinga visual and yet quantifiable analysis of multiple metrics concur-rently. It was especially helpful to aid in focusing our analyses bynarrowing the possible number of relationships in our monitoringdata sets that contain over a hundred different parameters andchemical analytes. Exploring associations of benthic communitycondition with a single metric at a time would have been tediousif done for the entire data set. Lastly, we found both conditionalprobability plots and ROC curves beneficial when examining met-rics already identified in the radar plots as potential contributors toimpacted condition. Conditional probability plots provide addi-tional information about the probability of impairment, and ROCcurves allow for a more direct comparison of two indices by com-paring the area under the curve for each index. When used to-gether, we believe these methods provide an efficient way toexamine associations with indices and should help managers eval-uate the indices available to them.
4. Conclusion
We examined condition assessments based on two benthicindices: the New York Harbor benthic index of biotic integrityand the US EPA’s EMAP benthic index for the Virginian Province.While the two benthic indices largely concur in their overallassessment of New York Harbor benthic condition, we exploredthe possibility that the indices respond differently to specificstressors. We used three screening tools to examine indices’ asso-ciation with chemical concentrations in the sediment or with thephysical environment. This approach is particularly useful in iden-tifying potential candidates for a more in-depth analysis in largemonitoring data sets with hundreds of variables and an equallylarge number of stations. Generally, analysts and managers mayfind this screening procedure useful when evaluating the applica-bility of a particular index to a regional assessment, or gain insightregarding strengths and weaknesses of several indices. We usedthree techniques: radar plots to examine many variables in oneplot, and conditional probability plots and ROC curves where weexamined single variables against the indices. The process ofapplying these three techniques allowed us to examine the re-sponse of the two indices. In the two cases we tested, the IBI wasthe better choice in NY Harbor data for sediment metals concentra-tion or silt/clay content because of a stronger association betweenbenthic condition in that data set.
Acknowledgements
We would like to thank Walter Galloway, James Heltshe, andCharles Strobel for their thoughtful reviews. Although the research
described in this article has been funded wholly by the US Environ-mental Protection Agency, it has not been subjected to Agency-le-vel review. Therefore, it does not necessarily reflect the views ofthe Agency. Mention of trade names or commercial products doesnot constitute endorsement or recommendation for use. This iscontribution number AED-08-023 of the Atlantic Ecology Division,National Health and Environmental Effects Research Laboratory,Office of Research and Development, US Environmental ProtectionAgency.
References
Adams, D.A., Benyi, S.J., 2003. Sediment Quality of the NY/NJ Harbor System: A 5-Year Revisit. An Investigation under the Regional Environmental Monitoringand Assessment Program (REMAP). US Environmental Protection Agency –Region 2, Edison, NJ. EPA/902-R-03-002. <http://www.epa.gov/emap/remap/html/docs/nynjharbor98.html>.
Adams, D.A., O’Connor, J.S., Weisberg, S.B., 1998. Sediment Quality of the NY/NJHarbor System. Final Report. An Investigation under the RegionalEnvironmental Monitoring and Assessment Program (REMAP). USEnvironmental Protection Agency – Region 2, Edison, NJ. EPA/902/R-98/001.<http://www.epa.gov/emap/remap/html/docs/nynjharbor.html>.
Borja, A., Dauer, D.M., 2008. Assessing the environmental quality status in estuarineand coastal systems: comparing methodologies and indices. EcologicalIndicators 8, 331–337.
Borja, A., Dauer, D., Diaz, R., Llanso, R.J., Muxika, I., Rodriguez, J.G., Schaffner, L.,2008. Assessing estuarine benthic quality conditions in Chesapeake Bay: acomparison of three indices. Ecological Indicators 8, 395–403.
Borja, A., Josefson, A.B., Miles, A., Muxika, I., Olsgard, F., Phillips, G., Rodríguez, J.G.,Rygg, B., 2007. An approach to the intercalibration of benthic ecological statusassessment in the North Atlantic ecoregion, according to the European WaterFramework Directive. Marine Pollution Bulletin 55, 42–52.
Fawcett, T., 2006. An introduction to ROC analysis. Pattern Recognition Letters 27,861–874.
Hollister, J.W., Walker, H.A., Paul, J.F., 2008. CProb: a computational tool forconducting conditional probability analysis. Journal of Environmental Quality37, 2392–2396.
Kerans, B.L., Karr, J.R., 1994. A benthic index of biotic integrity (B-IBI) for rivers ofthe Tennessee Valley. Ecological Applications 1, 66–84.
Llanso, R.J., Scott, L.C., Hyland, J.L., Dauer, D.M., Russell, D.E., Kutz, F.W., 2002. Anestuarine benthic index of biotic integrity for the Mid-Atlantic Region of theUnited States. II. Index development. Estuaries 25, 1231–1242.
Paul, J.F., McDonald, M.E., 2005. Development of empirical, geographically specificwater quality criteria: a conditional probability analysis approach. Journal ofthe American Water Resources Association 41, 1211–1223.
Paul, J.F., Scott, K.J., Campbell, D.E., Gentile, J.H., Strobel, C.S., Valente, R.M.,Weisberg, S.B., Holland, A.F., Ranasinghe, J.A., 2001. Developing and applyinga benthic index of estuarine condition for the Virginian Biogeographic Province.Ecological Indicators 1, 83–99.
Strobel, C.J., Buffum, H.W., Benyi, S.J., Petrocelli, E.A., Reifsteck, D.R., Keith, D.J., 1995.Statistical Summary: EMAP-Estuaries Virginian Province, 1990–1993. EPA/620/R-94/026. US Environmental Protection Agency, Office of Research andDevelopment, National Health and Environmental Effects ResearchLaboratory, Atlantic Ecology Division, Narragansett, RI.
Weisberg, S.B., Ranasinghe, J.A., Dauer, D.M., Schaffner, L., Diaz, R.J., 1997. Anestuarine benthic index of biotic integrity. Estuaries 20, 149–158.
Weisberg, S.B., Ranasinghe, J.A., O’Connor, J.S., Adams, D.A., 1998. A Benthic Index ofBiotic Integrity (B-IBI) for the New York/New Jersey Harbor. Appendix C inAdams, D.A., O’Connor, J.S., Weisberg, S.B. 1998. Sediment Quality of the NY/NJHarbor System. US Environmental Protection Agency – Region 2, Edison, NJ.EPA/902-R-98-001. <http://www.epa.gov/emap/remap/html/docs/nynjharbor98.html>.
Weisberg, S.B., Thompson, B., Ranasinghe, J.A., Montagne, D.E., Cadien, D.B., Dauer,D.M., Diener, D., Oliver, J., Reish, D.J., Velarde, R.G., Word, J.Q., 2008. The level ofagreement among experts applying best professional judgment to assess thecondition of benthic infaunal communities. Ecological Indicators 8, 389–394.