Embed Size (px)
Citation preview
A public-private sector collaborative campaign to
accelerate the spread of evidence-based practice
to improve patient outcomes
Dr Gary Kantor, Dr Dena van den Bergh
Best Care Always Task Team
2
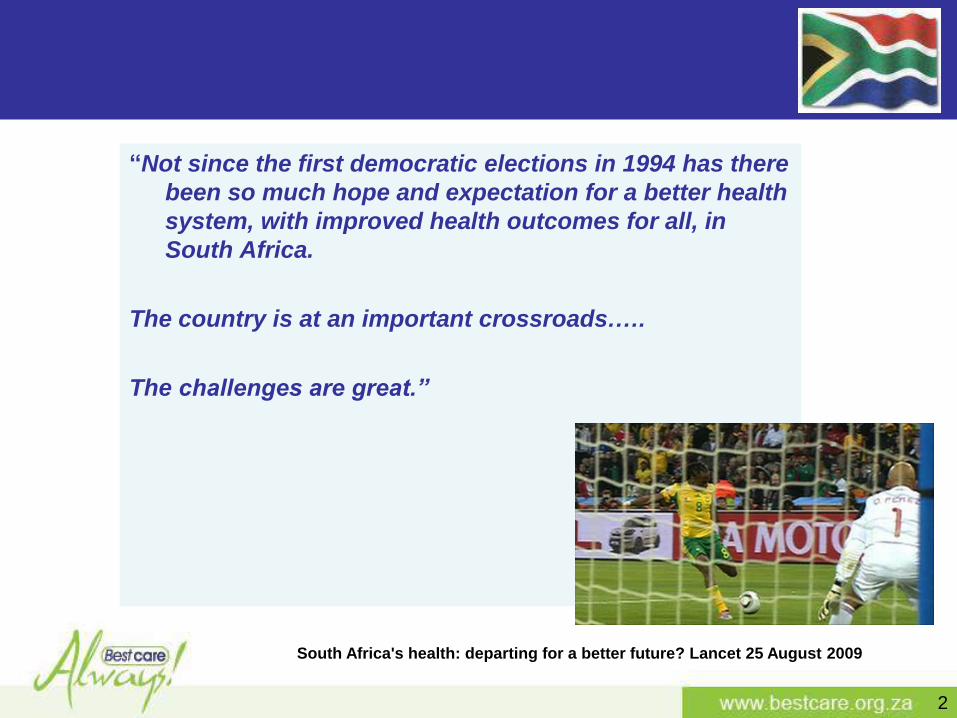
“Not since the first democratic elections in 1994 has there
been so much hope and expectation for a better health
system, with improved health outcomes for all, in
South Africa.
The country is at an important crossroads.….
The challenges are great.”
South Africa's health: departing for a better future? Lancet 25 August 2009
3
Best Care ? Gap Between Evidence & Practice
• In developed countries, patients receive
“recommended care” ~ 50% of the time.
• Adverse events in 10% of hospital patients.
– 50% preventable.
– 7.5% of these patients die.
1. NEJM 2003; 348:2635-2645
2. Qual Safety in Health Care 2008;17:216-223
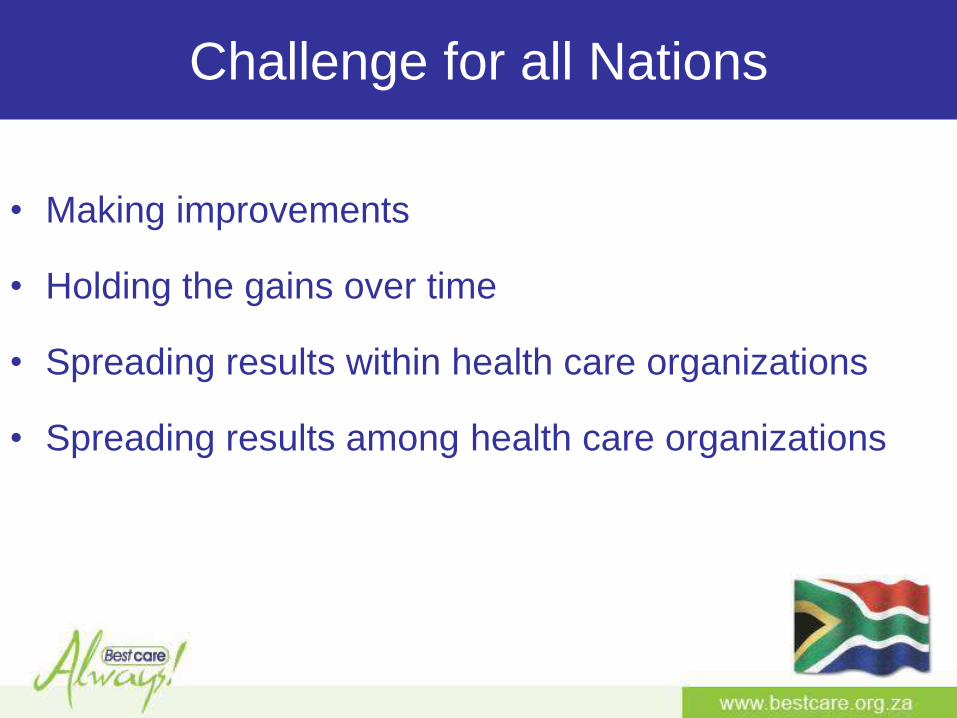
• Making improvements
• Holding the gains over time
• Spreading results within health care organizations
• Spreading results among health care organizations
Challenge for all Nations
5
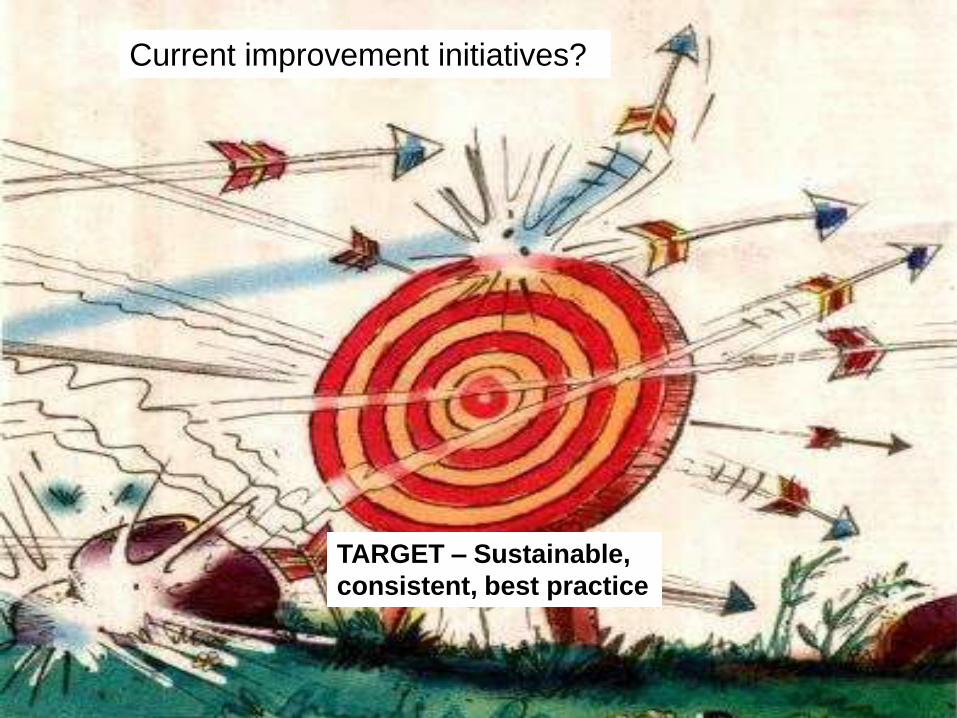
Current improvement initiatives?
TARGET – Sustainable,
consistent, best practice
6
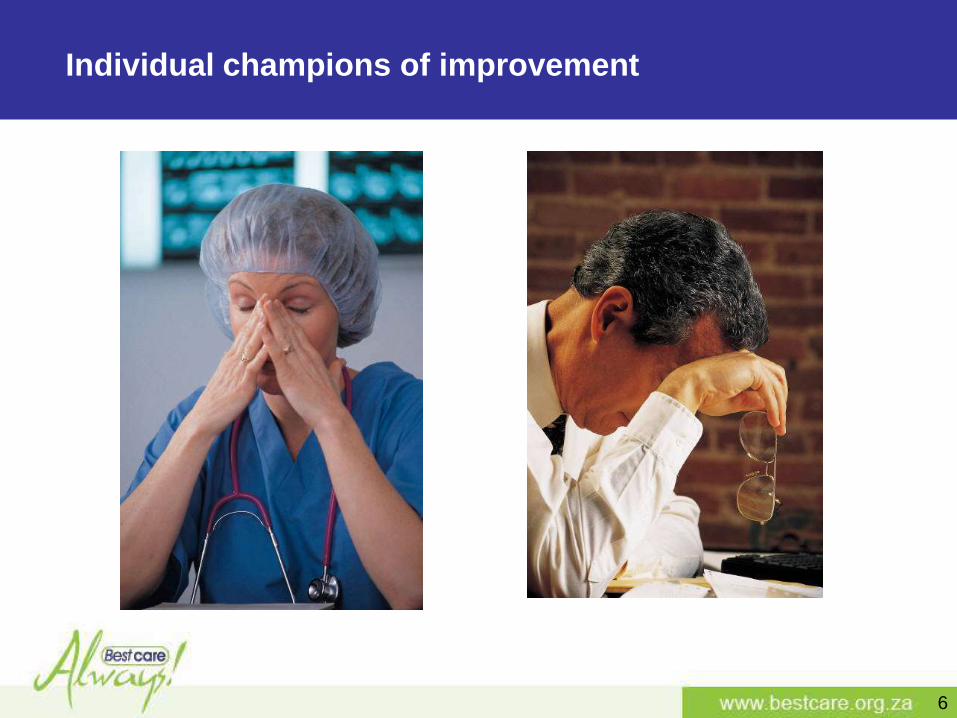
Individual champions of improvement
7
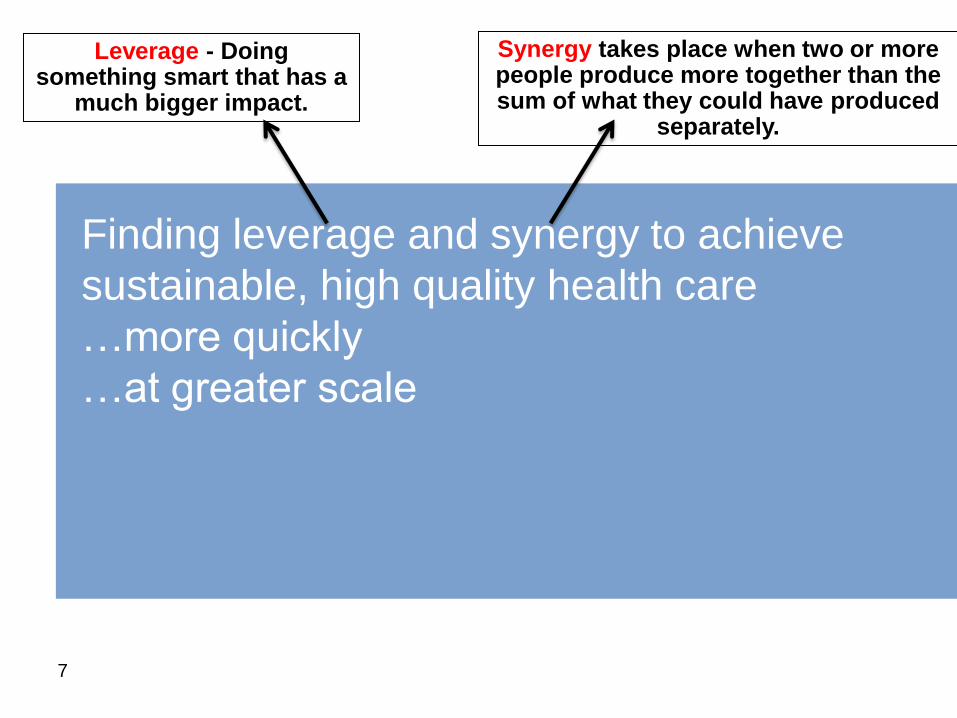
Finding leverage and synergy to achieve
sustainable, high quality health care
…more quickly
…at greater scale
Power of leverage and synergyLeverage - Doing something smart that has a
much bigger impact.
Synergy takes place when two or more people produce more together than the sum of what they could have produced
separately.
8
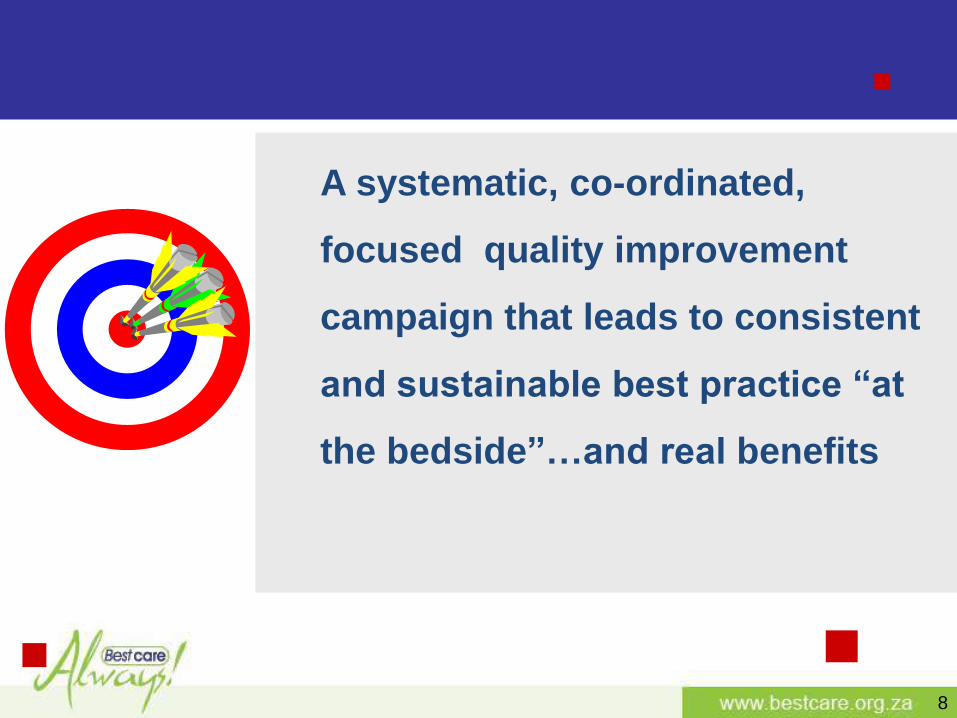
A systematic, co-ordinated,
focused quality improvement
campaign that leads to consistent
and sustainable best practice “at
the bedside”…and real benefits
9
The Opportunity
• What if a few “simple” interventions could
markedly reduce common, serious, adverse
events in hospitalized patients?
• What if we already knew what those
interventions are?
• What if we implemented all of them, always,
on every eligible patient?
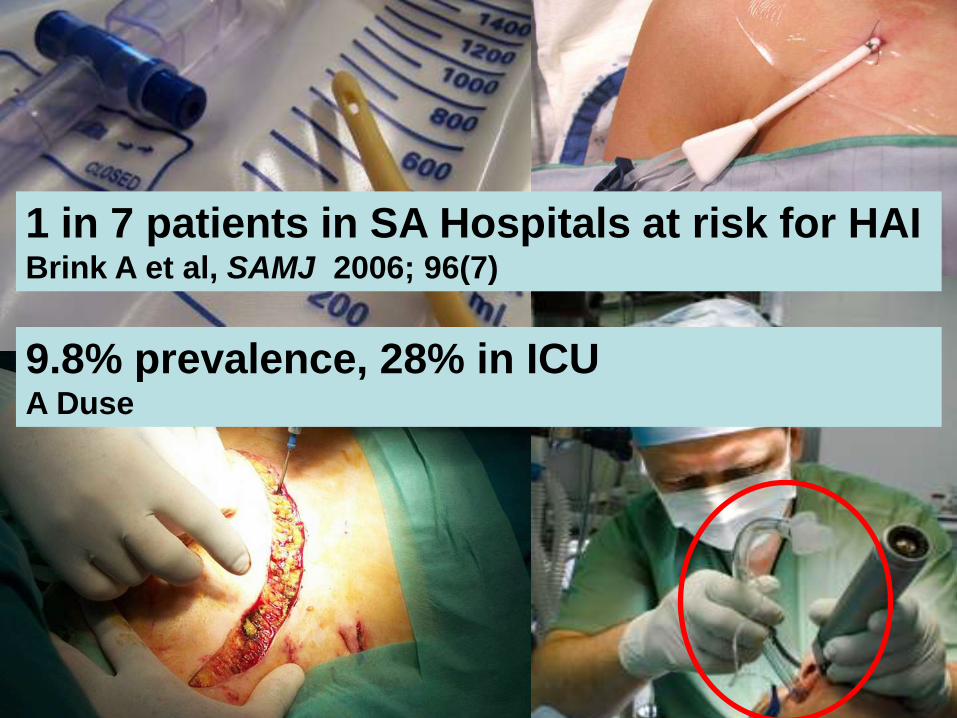
1 in 7 patients in SA Hospitals at risk for HAIBrink A et al, SAMJ 2006; 96(7)
9.8% prevalence, 28% in ICUA Duse
11
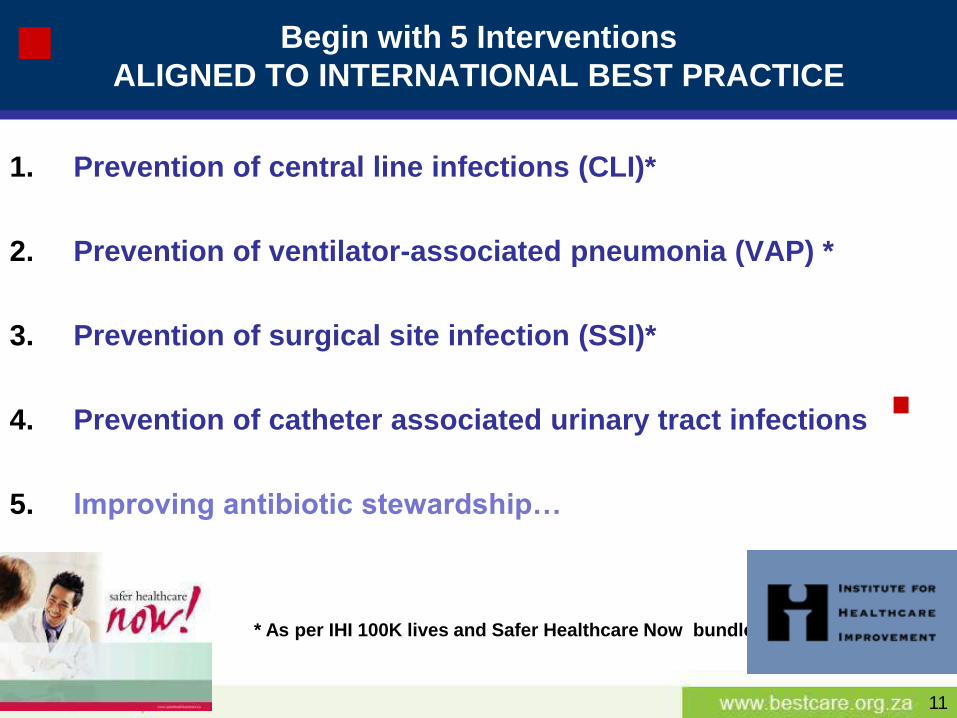
Begin with 5 Interventions
ALIGNED TO INTERNATIONAL BEST PRACTICE
1. Prevention of central line infections (CLI)*
2. Prevention of ventilator-associated pneumonia (VAP) *
3. Prevention of surgical site infection (SSI)*
4. Prevention of catheter associated urinary tract infections
5. Improving antibiotic stewardship…
* As per IHI 100K lives and Safer Healthcare Now bundles
12
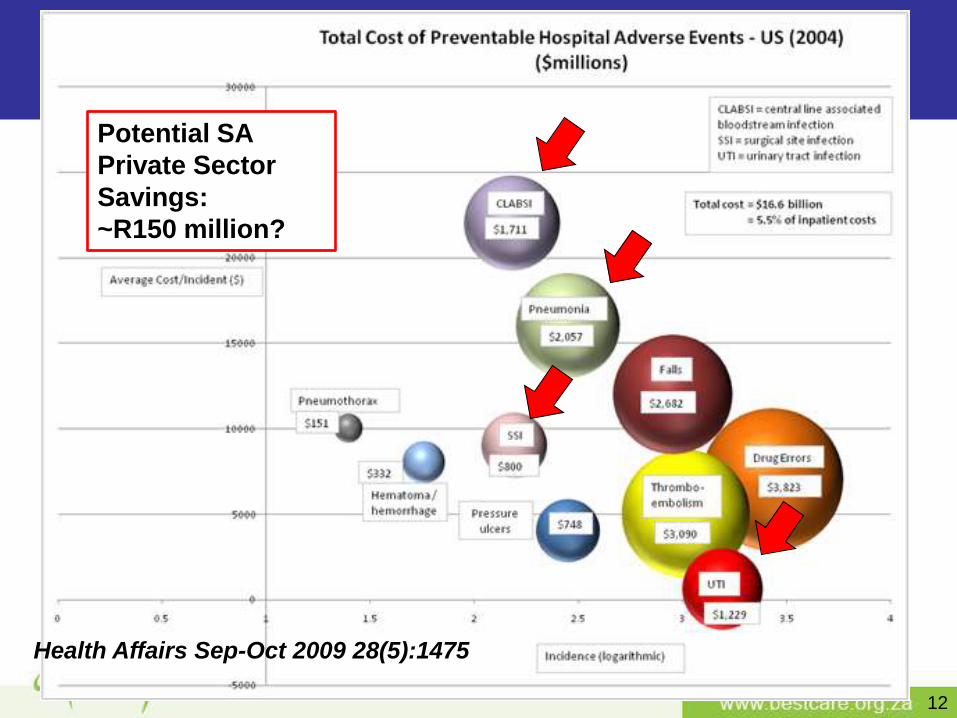
Potential SA
Private Sector
Savings:
~R150 million?
Health Affairs Sep-Oct 2009 28(5):1475
“Quality”
13
Patient-centred
Efficient
Effective
Timely
Safe
Equitable
14
Launch August 2009
The Best Care Always Campaign....
• A national campaign working together to make a bigger
impact on patient care than we could each do alone
• To join the campaign, a hospital must be willing to:
a) Implement evidence-based interventions at a faster pace
b) Share information, experiences and successes with others
c) Commit to measurement
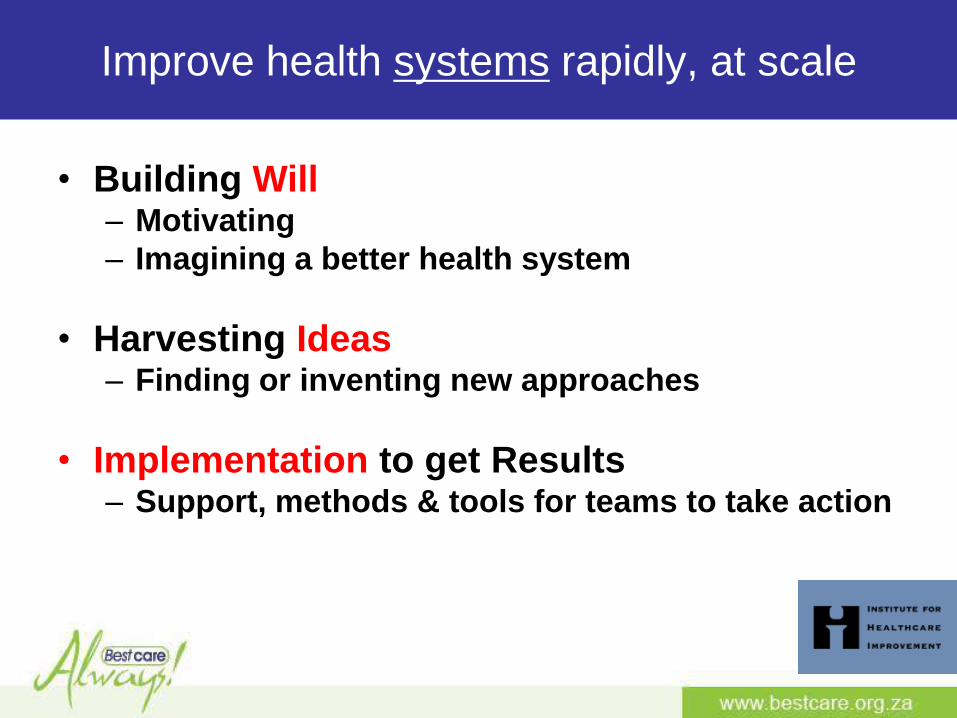
Improve health systems rapidly, at scale
• Building Will– Motivating
– Imagining a better health system
• Harvesting Ideas– Finding or inventing new approaches
• Implementation to get Results– Support, methods & tools for teams to take action
17
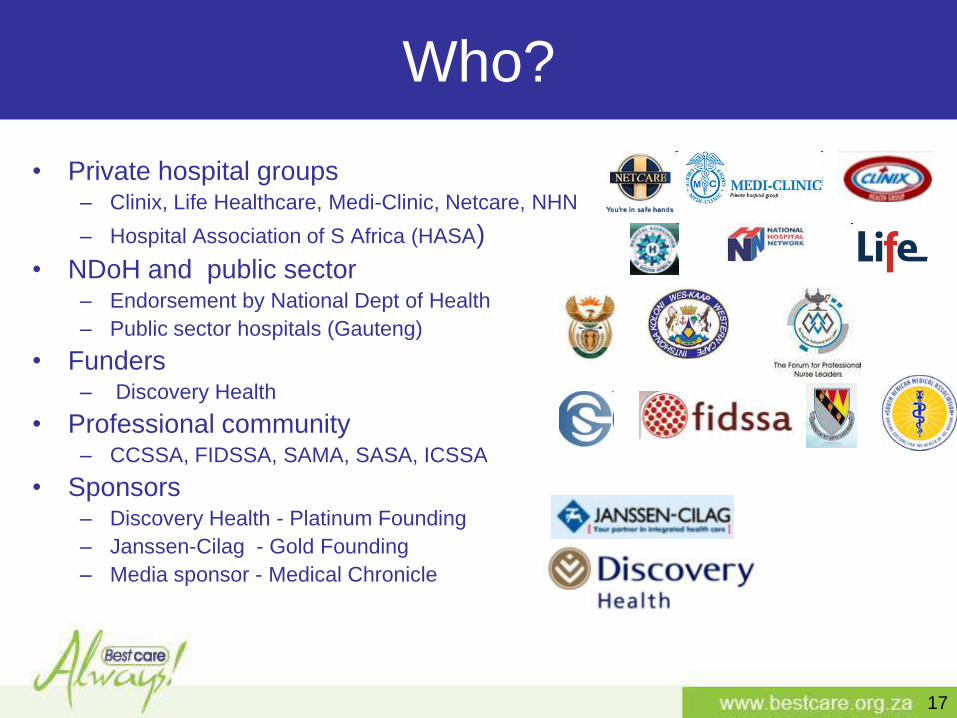
Who?
• Private hospital groups– Clinix, Life Healthcare, Medi-Clinic, Netcare, NHN
– Hospital Association of S Africa (HASA)
• NDoH and public sector– Endorsement by National Dept of Health
– Public sector hospitals (Gauteng)
• Funders– Discovery Health
• Professional community – CCSSA, FIDSSA, SAMA, SASA, ICSSA
• Sponsors– Discovery Health - Platinum Founding
– Janssen-Cilag - Gold Founding
– Media sponsor - Medical Chronicle
18
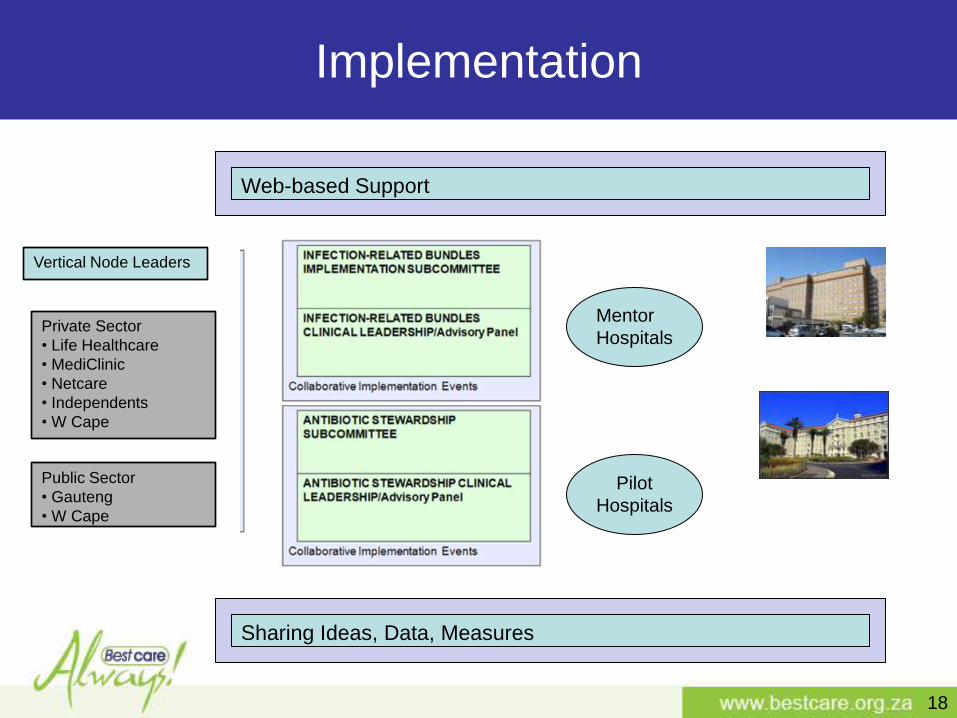
Implementation
Sharing Ideas, Data, Measures
Vertical Node Leaders
Public Sector
• Gauteng
• W Cape
Private Sector
• Life Healthcare
• MediClinic
• Netcare
• Independents
• W Cape
Web-based Support
Mentor
Hospitals
Pilot
Hospitals
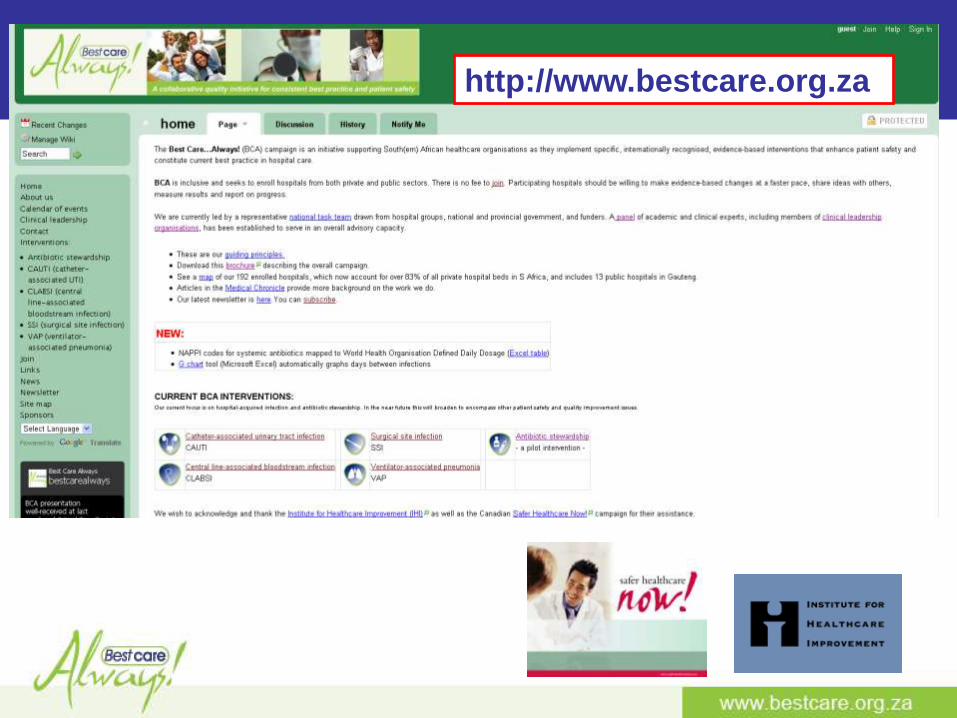
http://www.bestcare.org.za
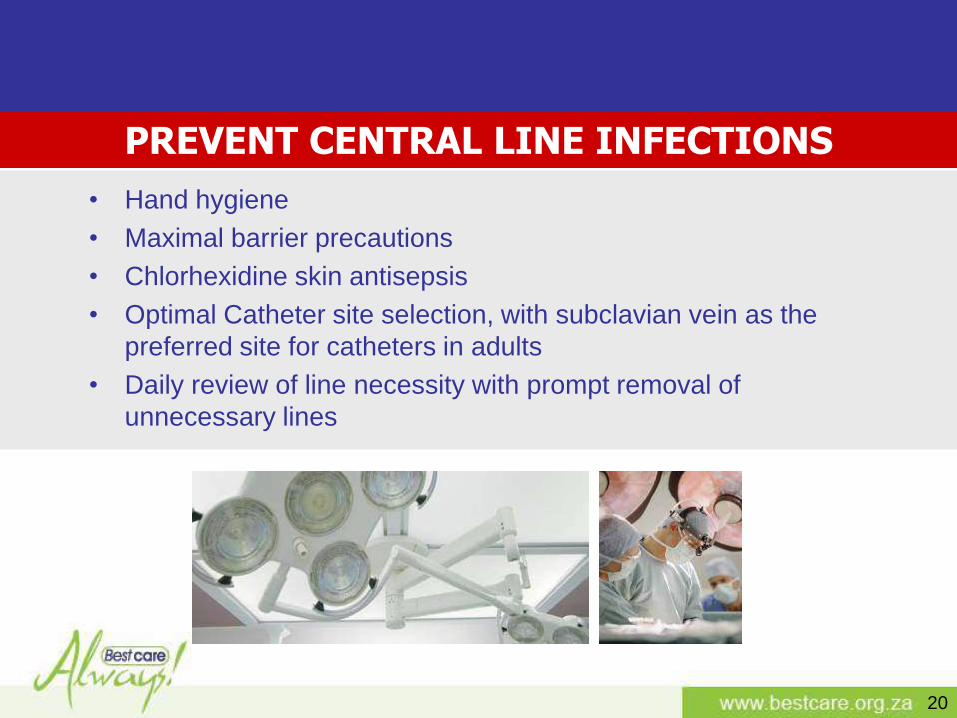
• Hand hygiene
• Maximal barrier precautions
• Chlorhexidine skin antisepsis
• Optimal Catheter site selection, with subclavian vein as the
preferred site for catheters in adults
• Daily review of line necessity with prompt removal of
unnecessary lines
PREVENT CENTRAL LINE INFECTIONS
20
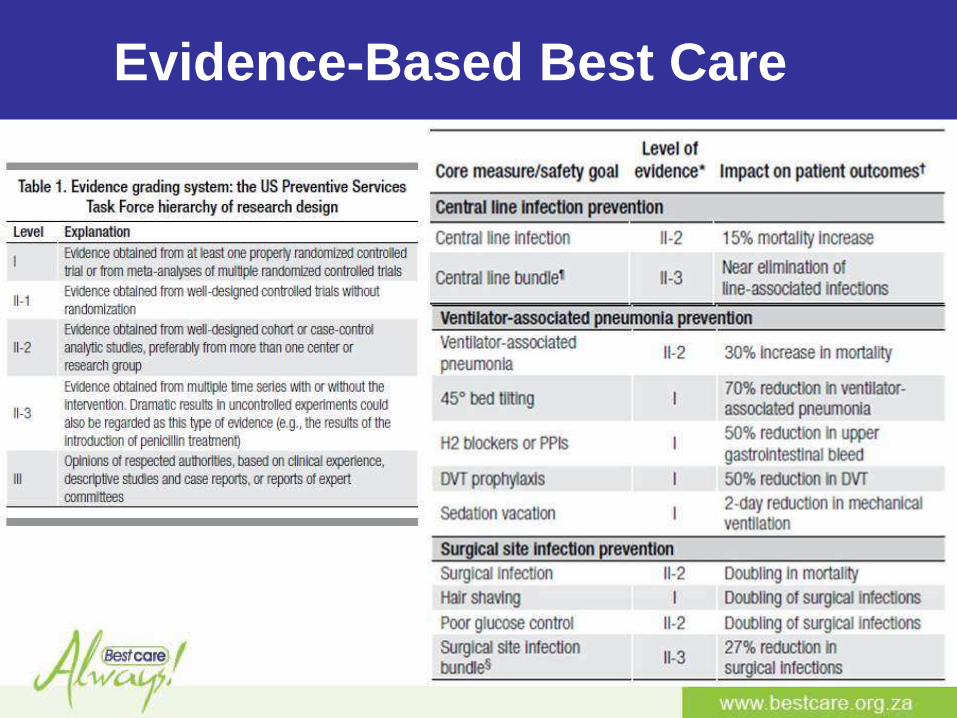
Evidence-Based Best Care
What Is a Bundle?
A grouping of best practices with respect to a disease process that individually improve care, but when applied together result in substantially greater improvement.
The science behind the bundle is so well established that it should be considered standard of care.
Bundle elements are dichotomous and compliance can be measured: yes/no answers.
Bundles require “all or none” approach rather than piecemeal application.
At the same time - recognize the complexity of care, acknowledge that further aspects of “best care” may exist and that the science behind best practice will continue evolve over time
23
The decision to accelerate pace, scale and spread
Implementing all elements of each bundle to every patient every time
What is new and how we have done …
24
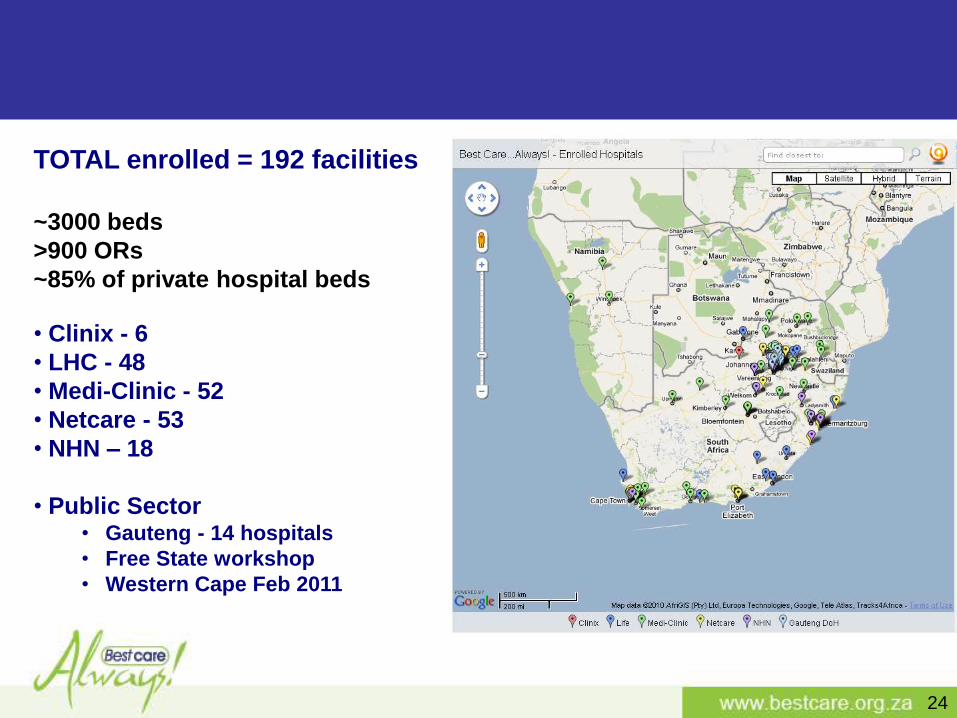
TOTAL enrolled = 192 facilities
~3000 beds
>900 ORs
~85% of private hospital beds
• Clinix - 6
• LHC - 48
• Medi-Clinic - 52
• Netcare - 53
• NHN – 18
• Public Sector • Gauteng - 14 hospitals
• Free State workshop
• Western Cape Feb 2011
25
Prevent Ventilator Associated Pneumonias - 143
Prevent Central-line Associated Blood Stream Infections - 150
Prevent Surgical Site Infections - 144
Prevent Catheter Associated Urinary Tract Infections - 154
Antibiotic stewardship – goal - 6 pilot sites
HOSPITALS ALREADY SIGNED UP
Compliance measurement and checklists
commenced in many hospitals
26
The work brings clinical teams together and creates the capacity, will and
motivation for further improvement work .
What is new and how we have done …
27
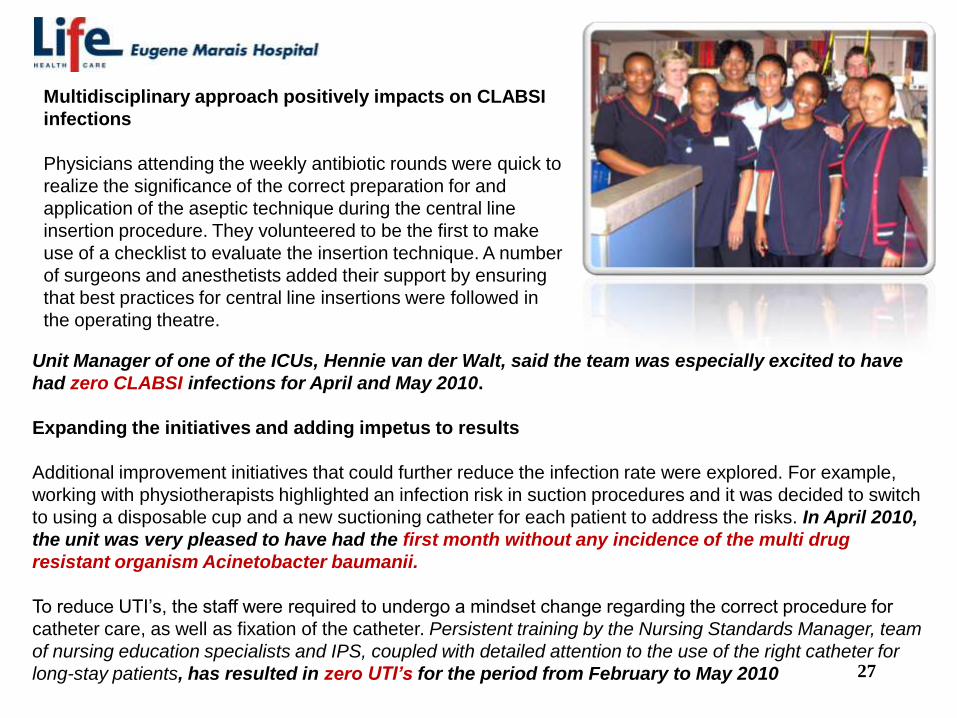
Unit Manager of one of the ICUs, Hennie van der Walt, said the team was especially excited to have
had zero CLABSI infections for April and May 2010.
Expanding the initiatives and adding impetus to results
Additional improvement initiatives that could further reduce the infection rate were explored. For example,
working with physiotherapists highlighted an infection risk in suction procedures and it was decided to switch
to using a disposable cup and a new suctioning catheter for each patient to address the risks. In April 2010,
the unit was very pleased to have had the first month without any incidence of the multi drug
resistant organism Acinetobacter baumanii.
To reduce UTI‟s, the staff were required to undergo a mindset change regarding the correct procedure for
catheter care, as well as fixation of the catheter. Persistent training by the Nursing Standards Manager, team
of nursing education specialists and IPS, coupled with detailed attention to the use of the right catheter for
long-stay patients, has resulted in zero UTI’s for the period from February to May 2010
Multidisciplinary approach positively impacts on CLABSI
infections
Physicians attending the weekly antibiotic rounds were quick to
realize the significance of the correct preparation for and
application of the aseptic technique during the central line
insertion procedure. They volunteered to be the first to make
use of a checklist to evaluate the insertion technique. A number
of surgeons and anesthetists added their support by ensuring
that best practices for central line insertions were followed in
the operating theatre.
28
Improvement measurement – South African data
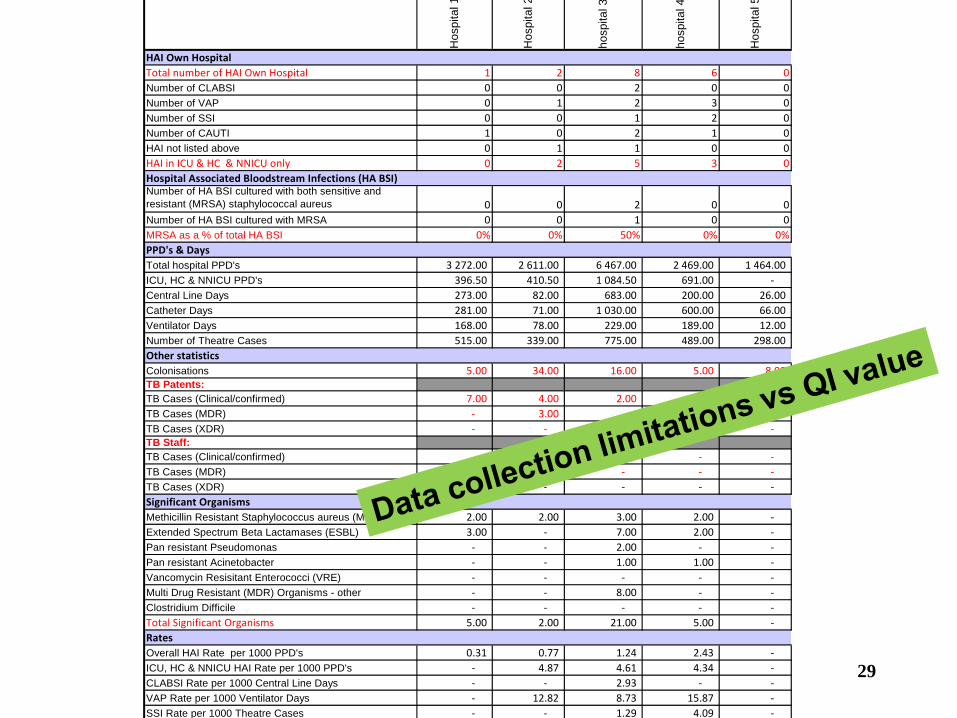
29
Ho
sp
ita
l 1
Ho
sp
ita
l 2
ho
sp
ita
l 3
ho
sp
ita
l 4
Ho
sp
ita
l 5
HAI Own Hospital
Total number of HAI Own Hospital 1 2 8 6 0
Number of CLABSI 0 0 2 0 0
Number of VAP 0 1 2 3 0
Number of SSI 0 0 1 2 0
Number of CAUTI 1 0 2 1 0
HAI not listed above 0 1 1 0 0
HAI in ICU & HC & NNICU only 0 2 5 3 0
Hospital Associated Bloodstream Infections (HA BSI)Number of HA BSI cultured with both sensitive and
resistant (MRSA) staphylococcal aureus 0 0 2 0 0
Number of HA BSI cultured with MRSA 0 0 1 0 0
MRSA as a % of total HA BSI 0% 0% 50% 0% 0%
PPD's & Days
Total hospital PPD's 3 272.00 2 611.00 6 467.00 2 469.00 1 464.00
ICU, HC & NNICU PPD's 396.50 410.50 1 084.50 691.00 -
Central Line Days 273.00 82.00 683.00 200.00 26.00
Catheter Days 281.00 71.00 1 030.00 600.00 66.00
Ventilator Days 168.00 78.00 229.00 189.00 12.00
Number of Theatre Cases 515.00 339.00 775.00 489.00 298.00
Other statistics
Colonisations 5.00 34.00 16.00 5.00 8.00 TB Patents:
TB Cases (Clinical/confirmed) 7.00 4.00 2.00 - 1.00
TB Cases (MDR) - 3.00 - - -
TB Cases (XDR) - - - - - TB Staff:
TB Cases (Clinical/confirmed) - - - - -
TB Cases (MDR) - - - - -
TB Cases (XDR) - - - - -
Significant Organisms
Methicillin Resistant Staphylococcus aureus (MRSA) 2.00 2.00 3.00 2.00 -
Extended Spectrum Beta Lactamases (ESBL) 3.00 - 7.00 2.00 -
Pan resistant Pseudomonas - - 2.00 - -
Pan resistant Acinetobacter - - 1.00 1.00 -
Vancomycin Resisitant Enterococci (VRE) - - - - -
Multi Drug Resistant (MDR) Organisms - other - - 8.00 - -
Clostridium Difficile - - - - -
Total Significant Organisms 5.00 2.00 21.00 5.00 -
Rates
Overall HAI Rate per 1000 PPD's 0.31 0.77 1.24 2.43 -
ICU, HC & NNICU HAI Rate per 1000 PPD's - 4.87 4.61 4.34 -
CLABSI Rate per 1000 Central Line Days - - 2.93 - -
VAP Rate per 1000 Ventilator Days - 12.82 8.73 15.87 -
SSI Rate per 1000 Theatre Cases - - 1.29 4.09 -
CAUTI Rate per 1000 Catheter Days 3.56 - 1.94 1.67 -
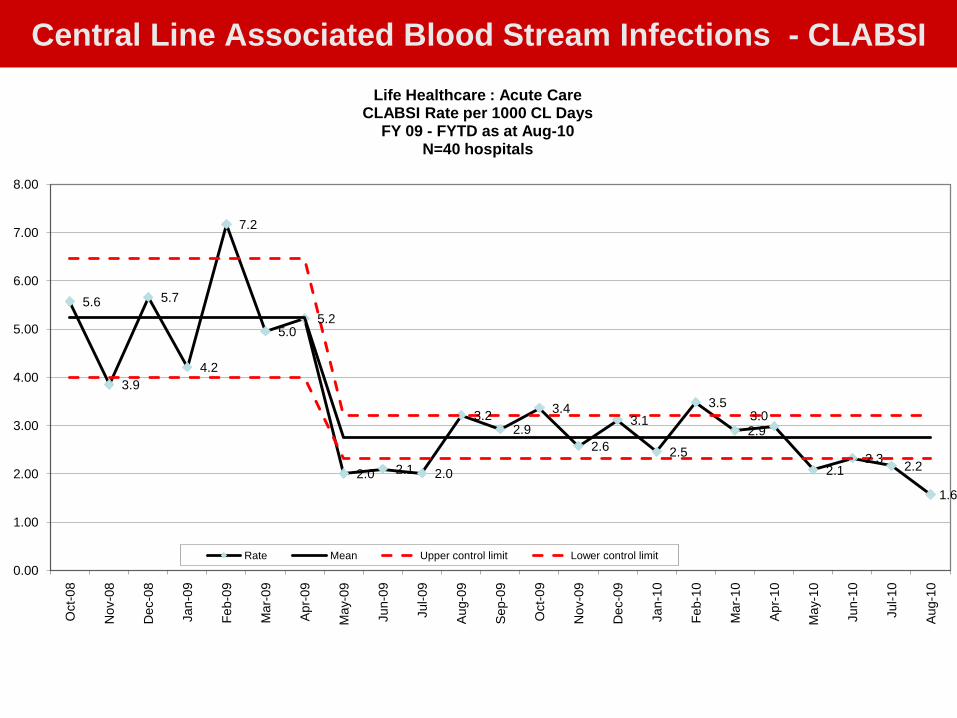
5.6
3.9
5.7
4.2
7.2
5.05.2
2.0 2.1 2.0
3.22.9
3.4
2.6
3.1
2.5
3.5
2.93.0
2.12.3
2.2
1.6
0.00
1.00
2.00
3.00
4.00
5.00
6.00
7.00
8.00
Oct-
08
Nov-0
8
De
c-0
8
Ja
n-0
9
Fe
b-0
9
Mar-
09
Apr-
09
Ma
y-0
9
Ju
n-0
9
Ju
l-09
Aug-0
9
Sep-0
9
Oct-
09
No
v-0
9
De
c-0
9
Ja
n-1
0
Fe
b-1
0
Ma
r-10
Apr-
10
Ma
y-1
0
Ju
n-1
0
Ju
l-10
Aug-1
0
Life Healthcare : Acute CareCLABSI Rate per 1000 CL Days
FY 09 - FYTD as at Aug-10N=40 hospitals
Rate Mean Upper control limit Lower control limit
Central Line Associated Blood Stream Infections - CLABSI
31
Jul-09 Aug-09 Sep-09 Oct-09 Nov-09 Dec-09
Tota
l C
om
plia
nce %
Tota
l C
om
plia
nce %
Tota
l C
om
plia
nce %
Tota
l C
om
plia
nce %
Tota
l C
om
plia
nce %
Tota
l C
om
plia
nce %
Tota
l C
om
plia
nce %
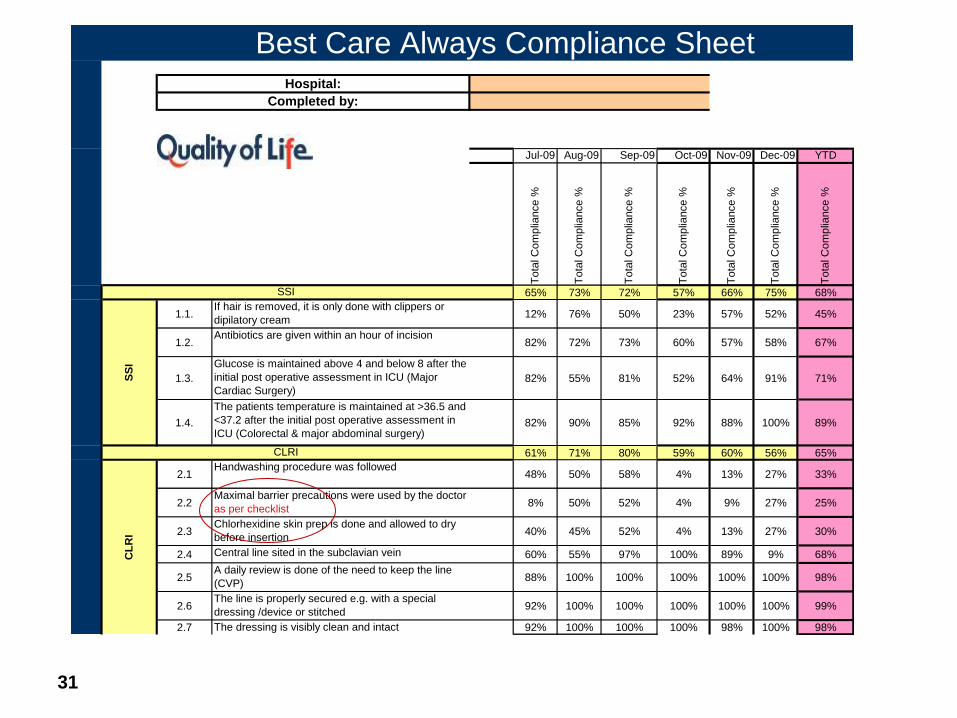
65% 73% 72% 57% 66% 75% 68%
1.1.If hair is removed, it is only done with clippers or
dipilatory cream12% 76% 50% 23% 57% 52% 45%
1.2.Antibiotics are given within an hour of incision
82% 72% 73% 60% 57% 58% 67%
1.3.
Glucose is maintained above 4 and below 8 after the
initial post operative assessment in ICU (Major
Cardiac Surgery)82% 55% 81% 52% 64% 91% 71%
1.4.
The patients temperature is maintained at >36.5 and
<37.2 after the initial post operative assessment in
ICU (Colorectal & major abdominal surgery)82% 90% 85% 92% 88% 100% 89%
61% 71% 80% 59% 60% 56% 65%
2.1Handwashing procedure was followed
48% 50% 58% 4% 13% 27% 33%
2.2Maximal barrier precautions were used by the doctor
as per checklist8% 50% 52% 4% 9% 27% 25%
2.3Chlorhexidine skin prep is done and allowed to dry
before insertion40% 45% 52% 4% 13% 27% 30%
2.4 Central line sited in the subclavian vein 60% 55% 97% 100% 89% 9% 68%
2.5A daily review is done of the need to keep the line
(CVP)88% 100% 100% 100% 100% 100% 98%
2.6The line is properly secured e.g. with a special
dressing /device or stitched92% 100% 100% 100% 100% 100% 99%
2.7 The dressing is visibly clean and intact 92% 100% 100% 100% 98% 100% 98%
SS
I
SSI
CL
RI
CLRI
Best Care Always Compliance Sheet
YTD
Hospital:
Completed by:
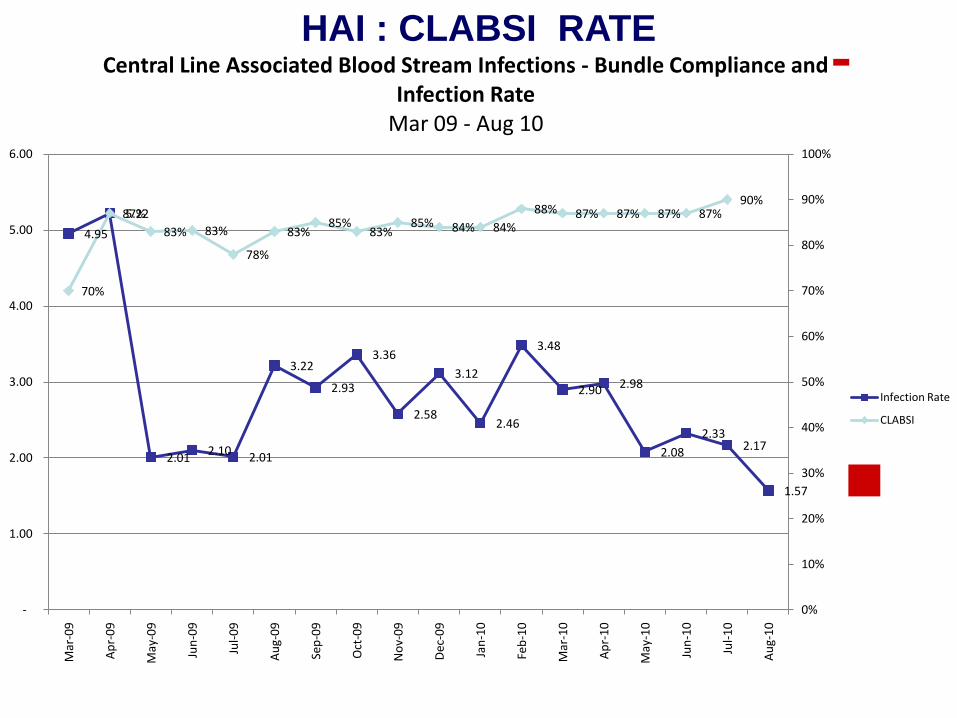
HAI : CLABSI RATE
4.95
5.22
2.01 2.10
2.01
3.22
2.93
3.36
2.58
3.12
2.46
3.48
2.90 2.98
2.08
2.33 2.17
1.57
70%
87%
83% 83%
78%
83%85%
83%85% 84% 84%
88% 87% 87% 87% 87%90%
0%
10%
20%
30%
40%
50%
60%
70%
80%
90%
100%
-
1.00
2.00
3.00
4.00
5.00
6.00
Mar
-09
Ap
r-0
9
May
-09
Jun
-09
Jul-
09
Au
g-0
9
Sep
-09
Oct
-09
No
v-0
9
Dec
-09
Jan
-10
Feb
-10
Mar
-10
Ap
r-1
0
May
-10
Jun
-10
Jul-
10
Au
g-1
0
Central Line Associated Blood Stream Infections - Bundle Compliance and Infection Rate
Mar 09 - Aug 10
Infection Rate
CLABSI
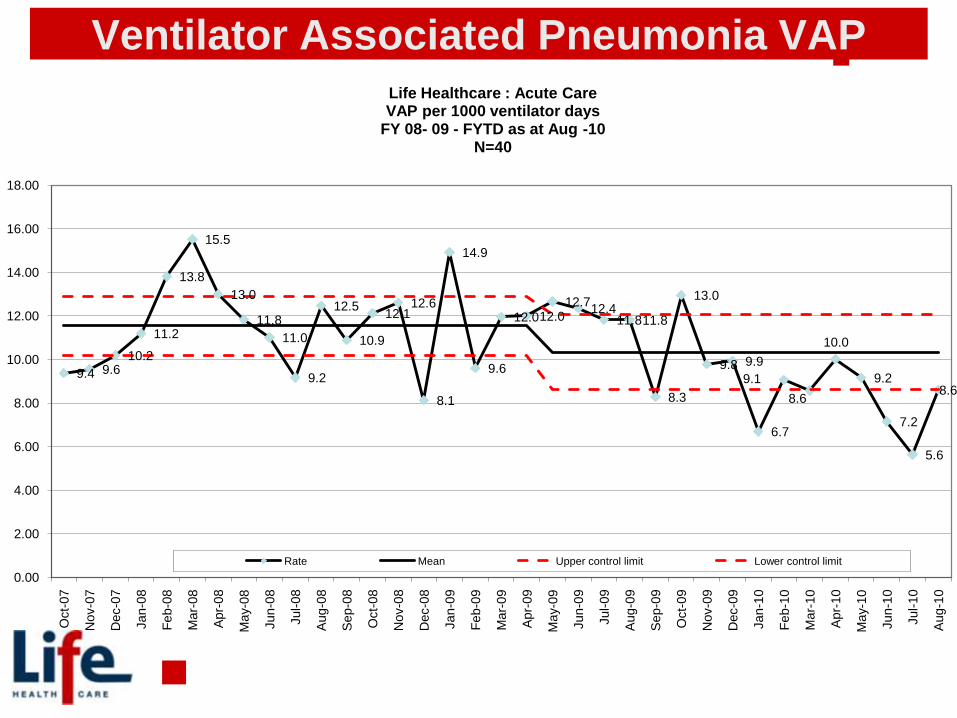
9.4 9.610.2
11.2
13.8
15.5
13.0
11.8
11.0
9.2
12.5
10.9
12.112.6
8.1
14.9
9.6
12.012.012.7
12.411.811.8
8.3
13.0
9.8 9.9
6.7
9.1
8.6
10.0
9.2
7.2
5.6
8.6
0.00
2.00
4.00
6.00
8.00
10.00
12.00
14.00
16.00
18.00
Oct-
07
No
v-0
7
De
c-0
7
Ja
n-0
8
Fe
b-0
8
Ma
r-08
Apr-
08
Ma
y-0
8
Ju
n-0
8
Ju
l-08
Aug-0
8
Sep-0
8
Oct-
08
Nov-0
8
De
c-0
8
Ja
n-0
9
Fe
b-0
9
Ma
r-09
Apr-
09
Ma
y-0
9
Ju
n-0
9
Ju
l-09
Aug-0
9
Sep-0
9
Oct-
09
No
v-0
9
Dec-0
9
Ja
n-1
0
Fe
b-1
0
Ma
r-10
Apr-
10
Ma
y-1
0
Ju
n-1
0
Ju
l-10
Aug-1
0
Life Healthcare : Acute Care VAP per 1000 ventilator days
FY 08- 09 - FYTD as at Aug -10N=40
Rate Mean Upper control limit Lower control limit
Ventilator Associated Pneumonia VAP
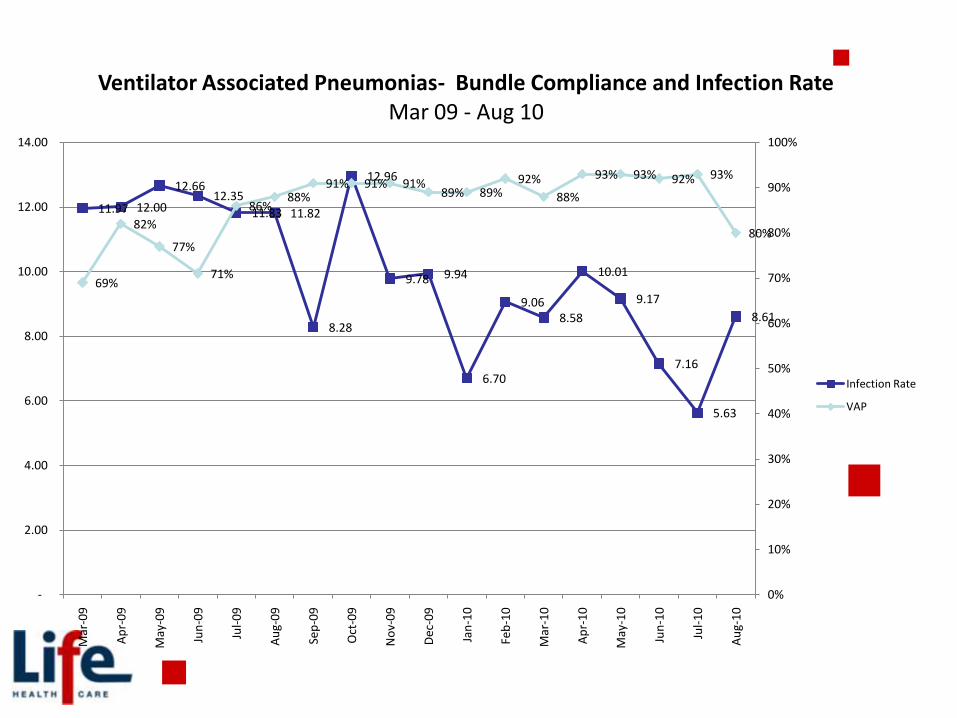
11.97 12.00
12.66 12.35
11.83 11.82
8.28
12.96
9.78 9.94
6.70
9.06 8.58
10.01
9.17
7.16
5.63
8.61
69%
82%
77%
71%
86%88%
91% 91% 91%89% 89%
92%
88%
93% 93% 92% 93%
80%
0%
10%
20%
30%
40%
50%
60%
70%
80%
90%
100%
-
2.00
4.00
6.00
8.00
10.00
12.00
14.00
Mar
-09
Ap
r-0
9
May
-09
Jun
-09
Jul-
09
Au
g-0
9
Sep
-09
Oct
-09
No
v-0
9
Dec
-09
Jan
-10
Feb
-10
Mar
-10
Ap
r-1
0
May
-10
Jun
-10
Jul-
10
Au
g-1
0
Ventilator Associated Pneumonias- Bundle Compliance and Infection RateMar 09 - Aug 10
Infection Rate
VAP
35
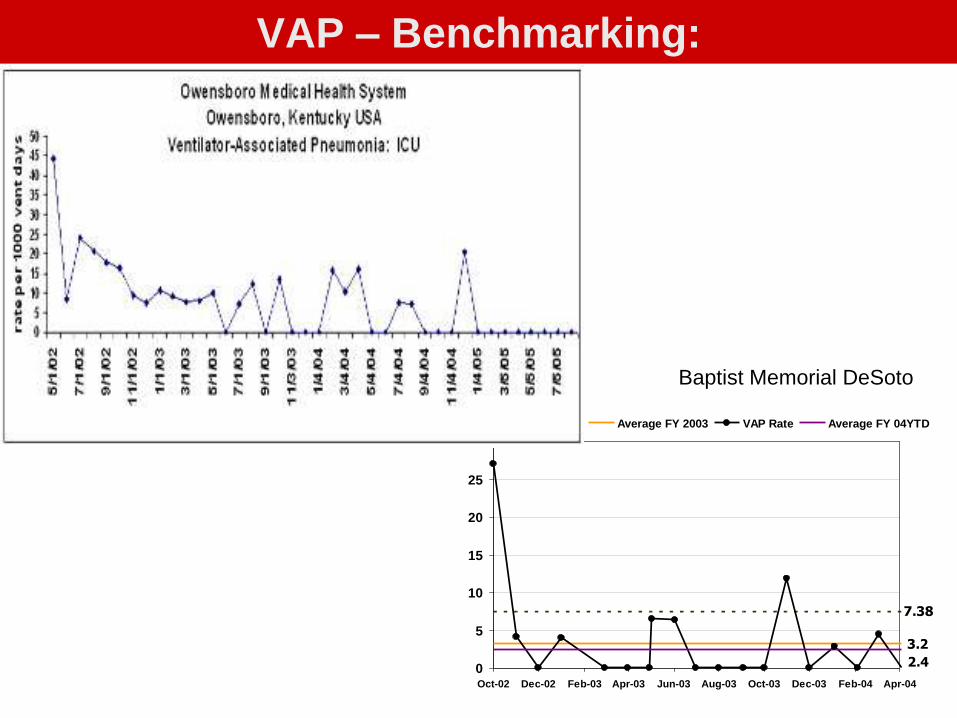
VAP – Benchmarking:
7.38
3.2
2.40
5
10
15
20
25
30
Oct-02 Dec-02 Feb-03 Apr-03 Jun-03 Aug-03 Oct-03 Dec-03 Feb-04 Apr-04
Baseline FY 2002 Average FY 2003 VAP Rate Average FY 04YTD
Baptist Memorial DeSoto
1.4
1.2
2.7
1.1
1.3
1.6
1.3 1.3
1.5
1.21.3
1.1
1.61.6
2.2
1.3
1.9
2.1
1.5
2.1
1.9
1.3
1.9
1.3
1.1
1.8
1.6
1.4
1.21.2
1.6
0.9
1.4
0.9
1.4
0.00
0.50
1.00
1.50
2.00
2.50
3.00
Oct-
07
No
v-0
7
De
c-0
7
Ja
n-0
8
Fe
b-0
8
Ma
r-08
Apr-
08
Ma
y-0
8
Ju
n-0
8
Ju
l-08
Aug-0
8
Sep-0
8
Oct-
08
Nov-0
8
De
c-0
8
Ja
n-0
9
Fe
b-0
9
Ma
r-09
Apr-
09
Ma
y-0
9
Ju
n-0
9
Ju
l-09
Aug-0
9
Sep-0
9
Oct-
09
No
v-0
9
Dec-0
9
Ja
n-1
0
Fe
b-1
0
Ma
r-10
Apr-
10
Ma
y-1
0
Ju
n-1
0
Ju
l-10
Aug-1
0
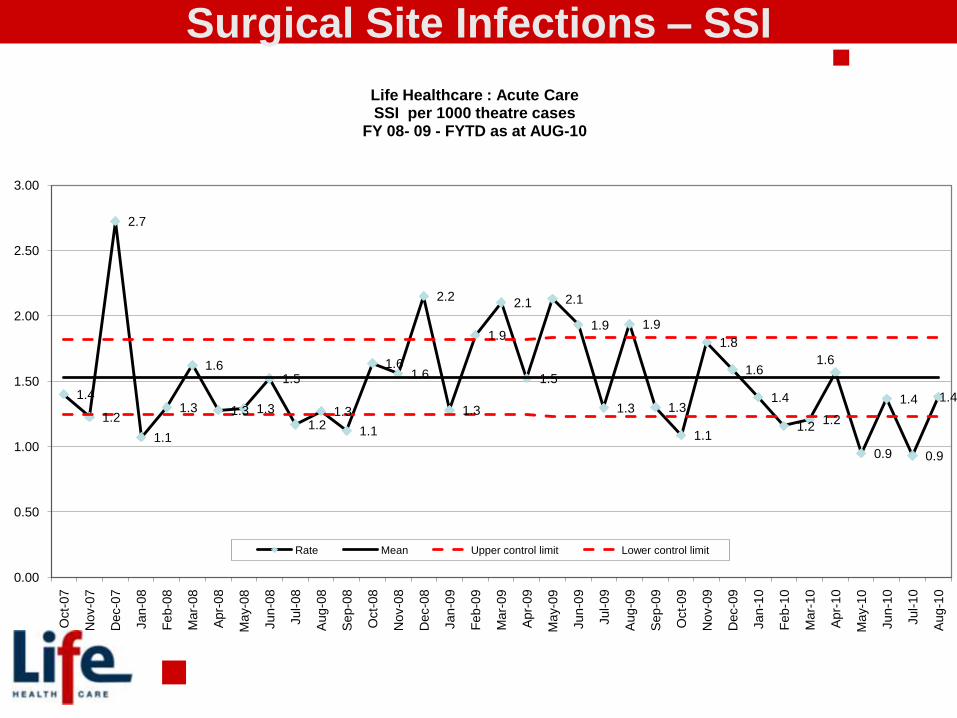
Life Healthcare : Acute CareSSI per 1000 theatre cases
FY 08- 09 - FYTD as at AUG-10
Rate Mean Upper control limit Lower control limit
Surgical Site Infections – SSI
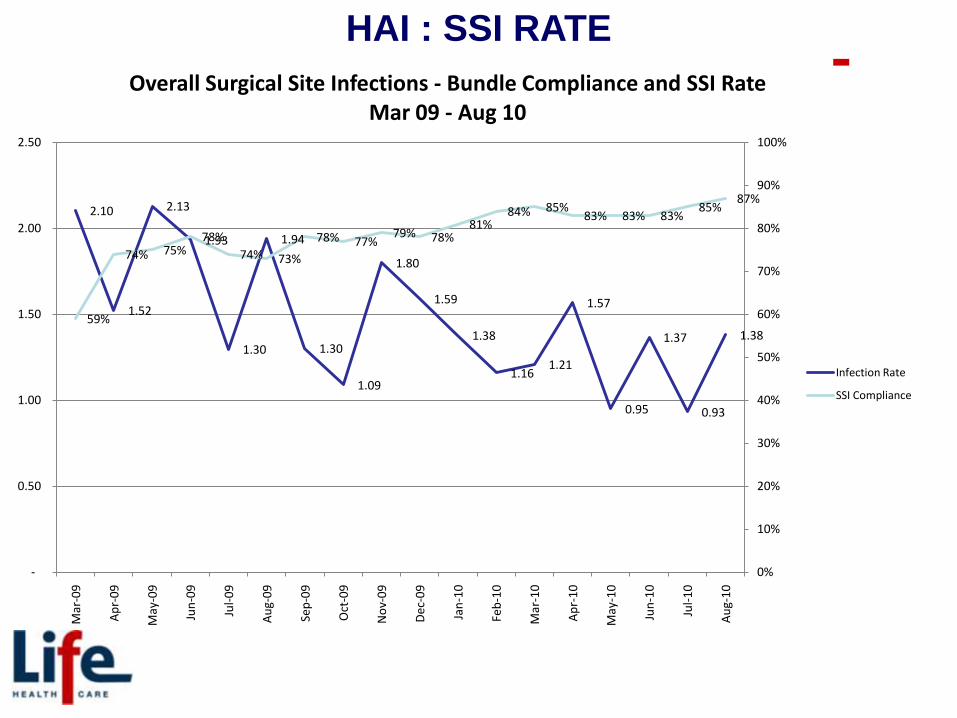
2.10
1.52
2.13
1.93
1.30
1.94
1.30
1.09
1.80
1.59
1.38
1.16 1.21
1.57
0.95
1.37
0.93
1.38 59%
74% 75%78%
74% 73%
78% 77%79% 78%
81%84% 85%
83% 83% 83%85%
87%
0%
10%
20%
30%
40%
50%
60%
70%
80%
90%
100%
-
0.50
1.00
1.50
2.00
2.50
Mar
-09
Ap
r-0
9
May
-09
Jun
-09
Jul-
09
Au
g-0
9
Sep
-09
Oct
-09
No
v-0
9
Dec
-09
Jan
-10
Feb
-10
Mar
-10
Ap
r-1
0
May
-10
Jun
-10
Jul-
10
Au
g-1
0
Overall Surgical Site Infections - Bundle Compliance and SSI RateMar 09 - Aug 10
Infection Rate
SSI Compliance
HAI : SSI RATE
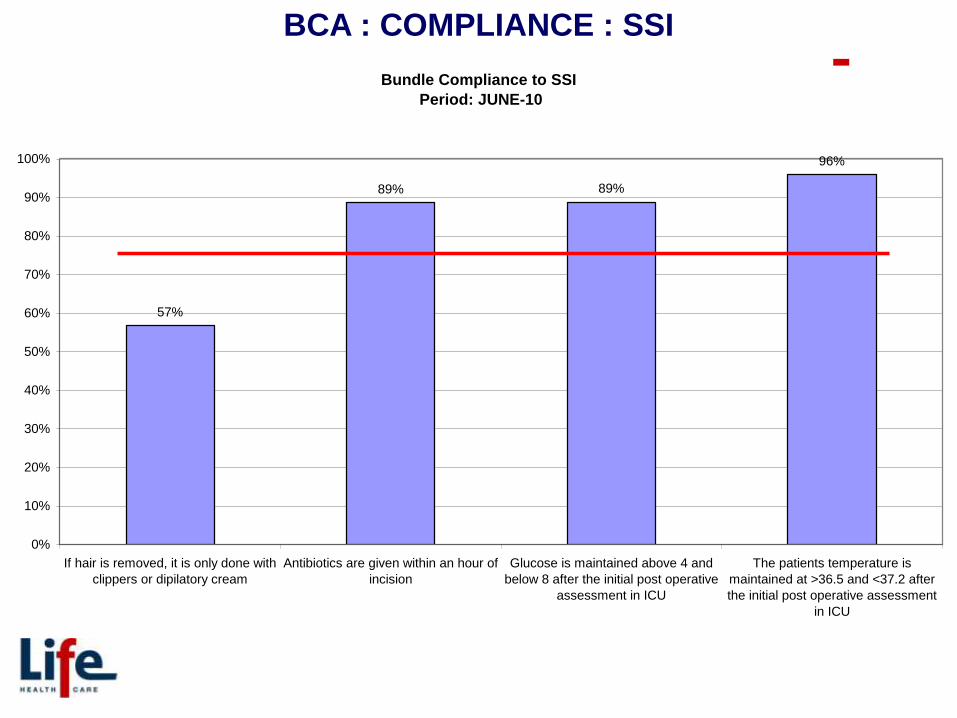
BCA : COMPLIANCE : SSI
Bundle Compliance to SSI
Period: JUNE-10
57%
89% 89%
96%
0%
10%
20%
30%
40%
50%
60%
70%
80%
90%
100%
If hair is removed, it is only done with
clippers or dipilatory cream
Antibiotics are given within an hour of
incision
Glucose is maintained above 4 and
below 8 after the initial post operative
assessment in ICU
The patients temperature is
maintained at >36.5 and <37.2 after
the initial post operative assessment
in ICU
39
Collaboration - different stakeholders within the private sector and between
the private sector and public sector
Shared learning - We have agreed to share our learnings and help each other
achieve the objective of best care to every patient every time.
Partnerships - clinical leadership organizations have agreed to partner with us to
support implementation and to elevate skills and knowledge of health
professionals in the identified areas.
What is new and how have we done …
40
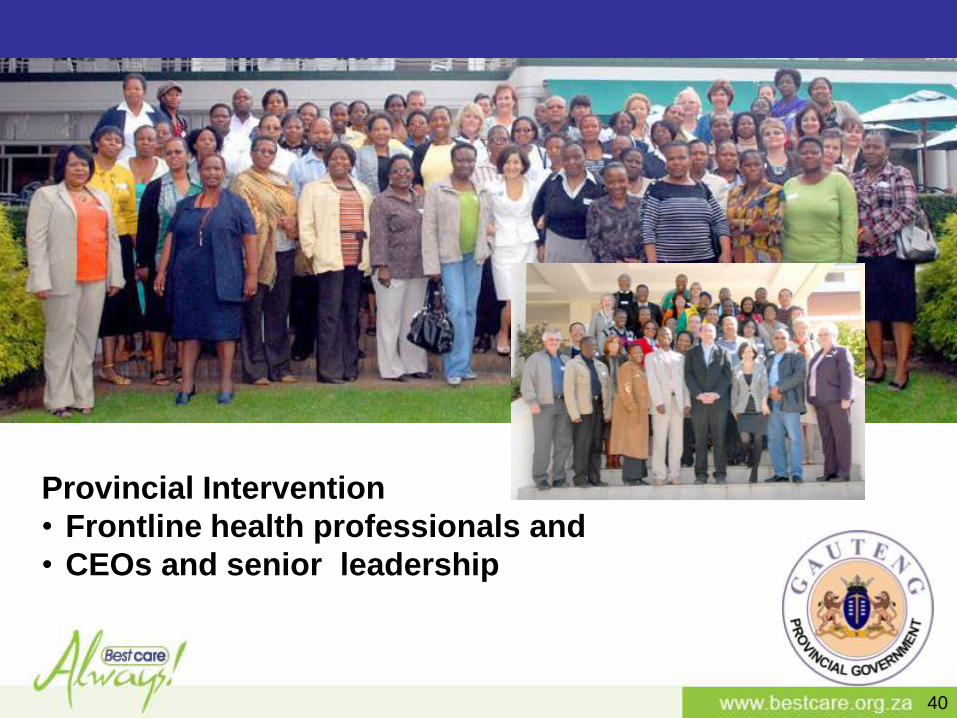
Provincial Intervention
• Frontline health professionals and
• CEOs and senior leadership
41
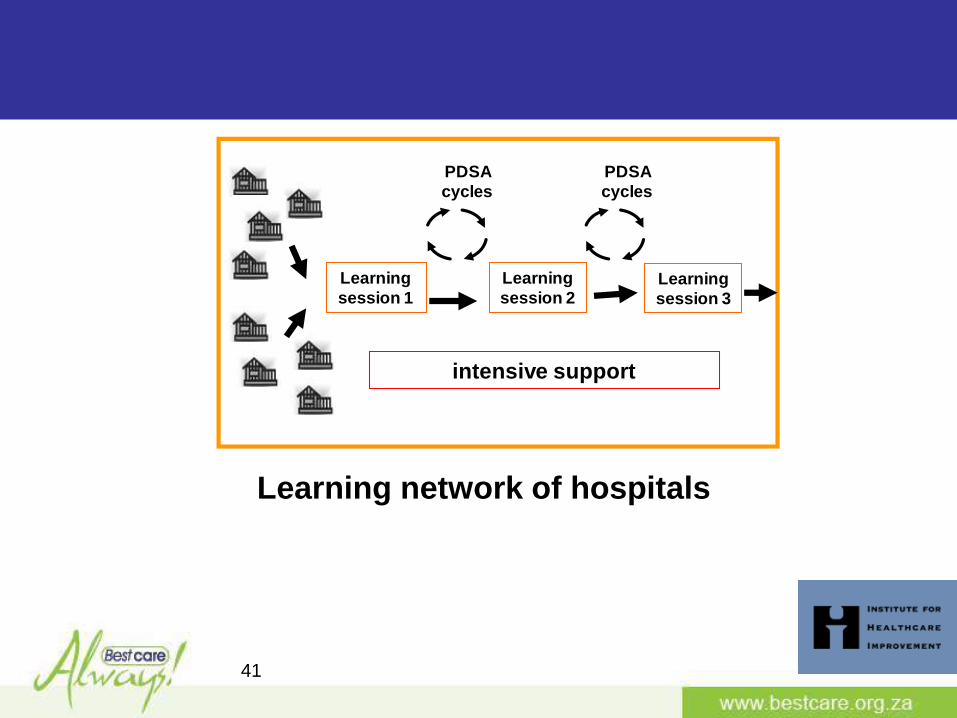
Learning network of hospitals
Learning
session 2
Learning
session 1
PDSA
cycles
PDSA
cycles
Learning
session 3
intensive support
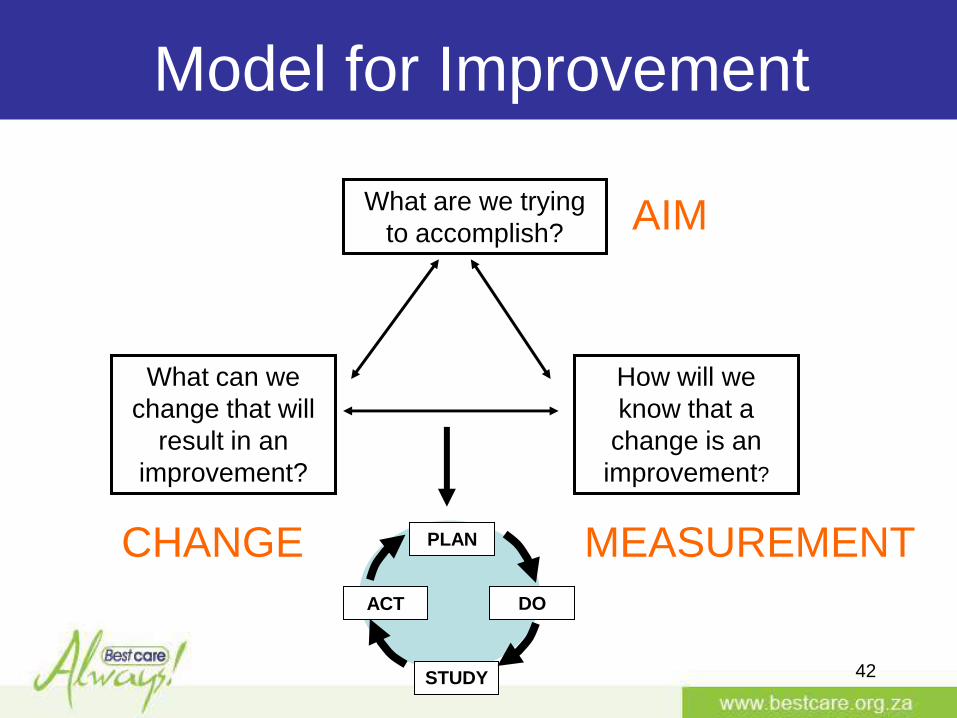
Model for Improvement
What can we
change that will
result in an
improvement?
PLAN
DO
STUDY
ACT
How will we
know that a
change is an
improvement?
What are we trying
to accomplish?AIM
MEASUREMENTCHANGE
42
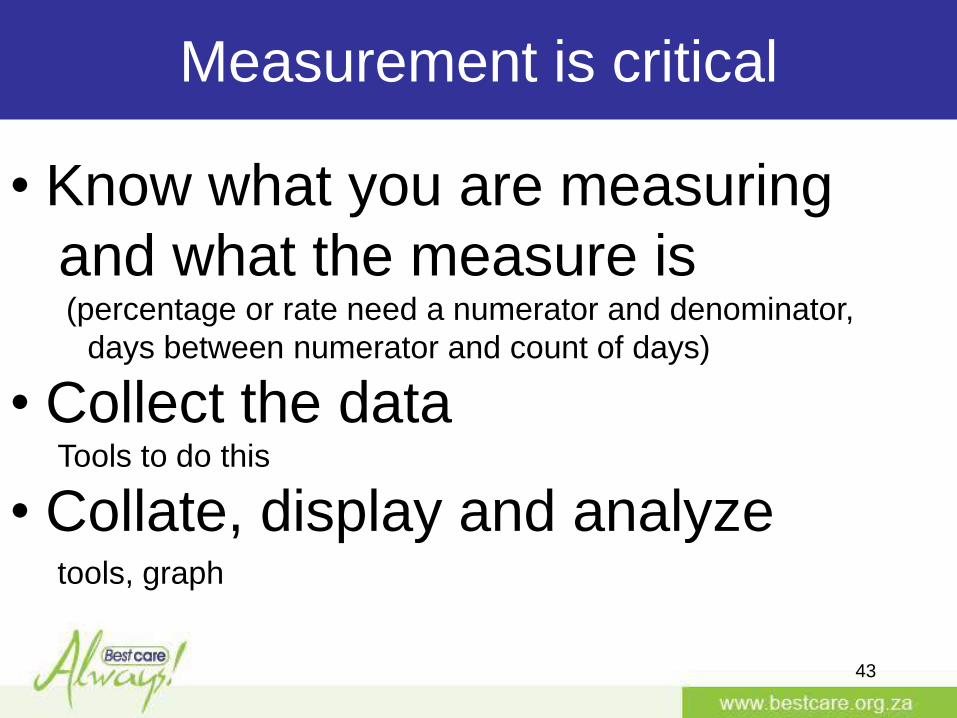
Measurement is critical
• Know what you are measuring
and what the measure is(percentage or rate need a numerator and denominator,
days between numerator and count of days)
• Collect the dataTools to do this
• Collate, display and analyzetools, graph
43
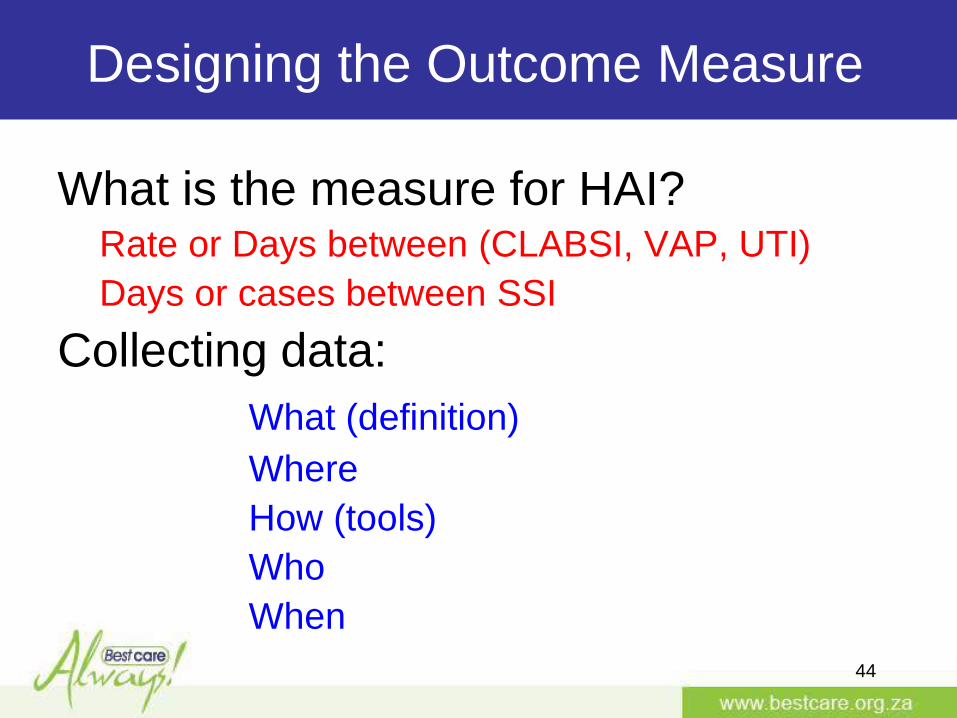
Designing the Outcome Measure
What is the measure for HAI?Rate or Days between (CLABSI, VAP, UTI)
Days or cases between SSI
Collecting data:
What (definition)
Where
How (tools)
Who
When
44
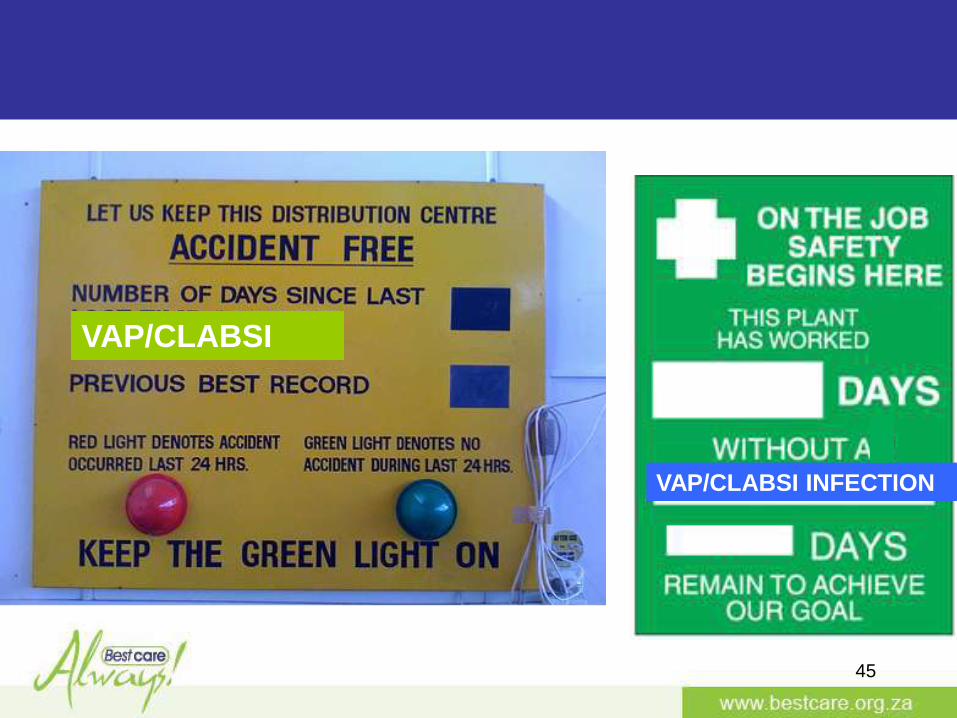
45
VAP/CLABSI
VAP/CLABSI INFECTION
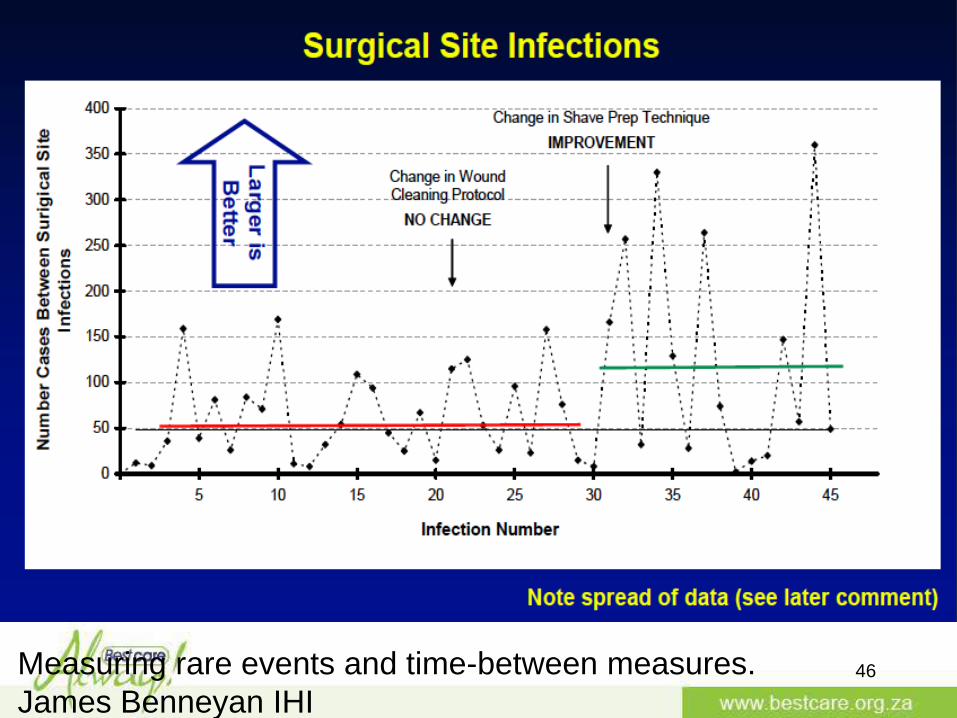
Measuring rare events and time-between measures.
James Benneyan IHI46
47
• Feedback reports are being tracked and used to adapt the methodology.
• 14 of the original 15 hospitals have committed to implementation of at least
one BCA infection prevention bundle.
• sustained attendance (over 95% of 14 hospitals) & expansion of some teams
• Nearly 100 frontline health professionals including ICU unit managers,
infection prevention and quality assurance practitioners, doctors, theatre
matrons and pharmacists are participating in local improvement teams and
the learning collaboratives.
• All 14 hospitals have set up a BCA team some include the CEO
• 12 of the 14 hospitals have commenced with specific measures for their
interventions.
• Private hospitals, participating in the BCA Campaign, are sharing “lessons
learnt” and have agreed to form collaborative learning partnerships with
public hospitals.
• Gauteng Provincial DOH has sustained support, jointly facilitating learning
sessions, and providing opportunities to address healthcare leadership
forums.
Results so far
48
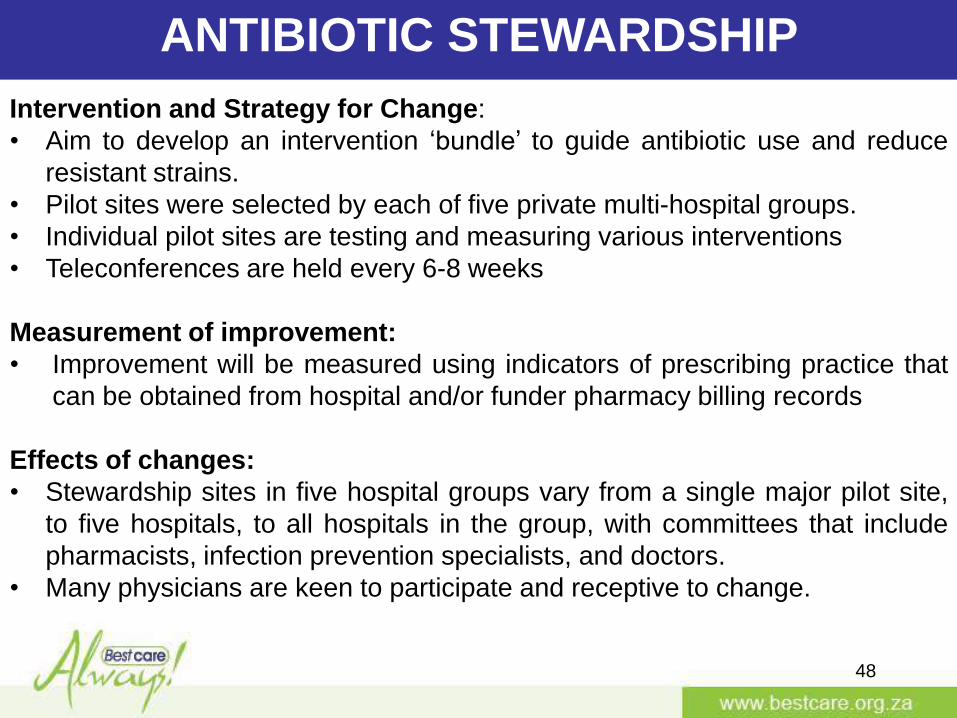
Intervention and Strategy for Change:
• Aim to develop an intervention „bundle‟ to guide antibiotic use and reduce
resistant strains.
• Pilot sites were selected by each of five private multi-hospital groups.
• Individual pilot sites are testing and measuring various interventions
• Teleconferences are held every 6-8 weeks
Measurement of improvement:
• Improvement will be measured using indicators of prescribing practice that
can be obtained from hospital and/or funder pharmacy billing records
Effects of changes:
• Stewardship sites in five hospital groups vary from a single major pilot site,
to five hospitals, to all hospitals in the group, with committees that include
pharmacists, infection prevention specialists, and doctors.
• Many physicians are keen to participate and receptive to change.
ANTIBIOTIC STEWARDSHIP
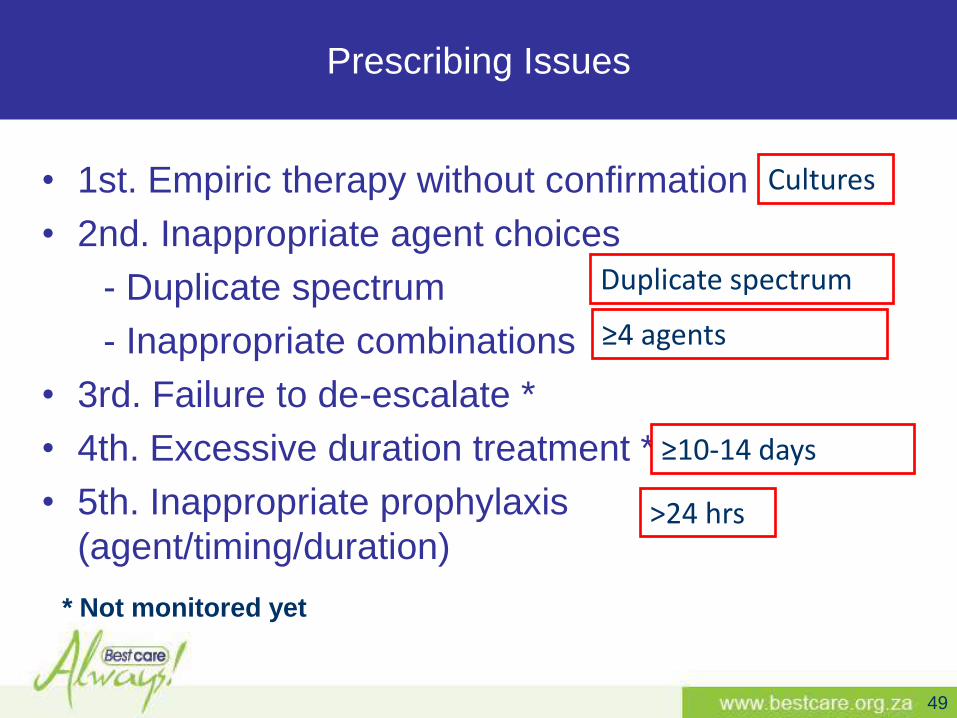
Prescribing Issues
• 1st. Empiric therapy without confirmation
• 2nd. Inappropriate agent choices
- Duplicate spectrum
- Inappropriate combinations
• 3rd. Failure to de-escalate *
• 4th. Excessive duration treatment *
• 5th. Inappropriate prophylaxis
(agent/timing/duration)
49
Duplicate spectrum
Cultures
≥10-14 days
≥4 agents
>24 hrs
* Not monitored yet
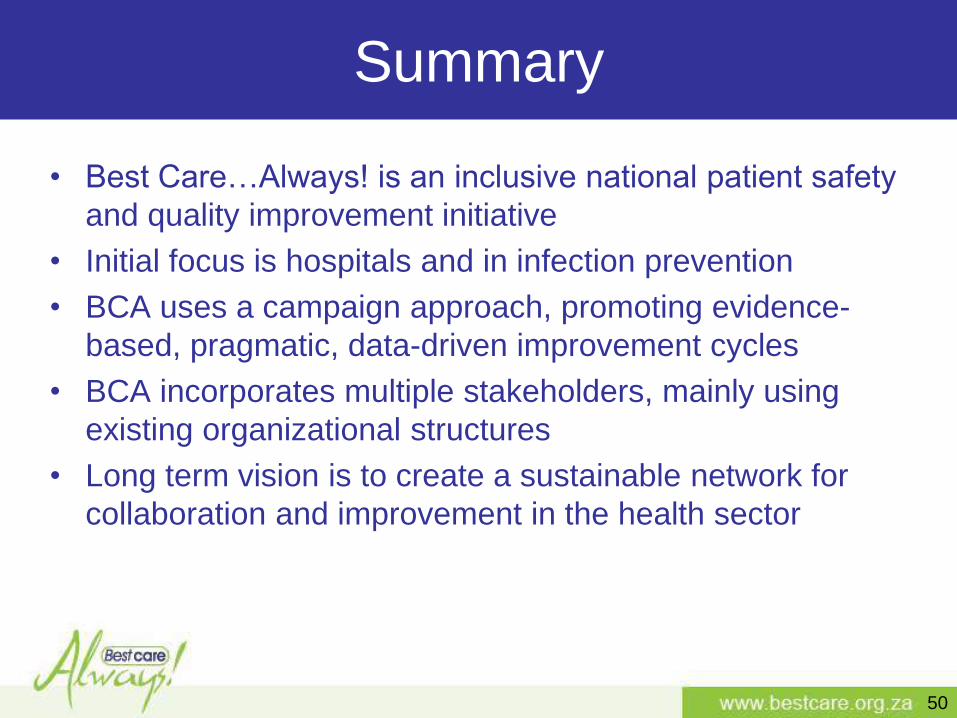
Summary
• Best Care…Always! is an inclusive national patient safety
and quality improvement initiative
• Initial focus is hospitals and in infection prevention
• BCA uses a campaign approach, promoting evidence-
based, pragmatic, data-driven improvement cycles
• BCA incorporates multiple stakeholders, mainly using
existing organizational structures
• Long term vision is to create a sustainable network for
collaboration and improvement in the health sector
50
51
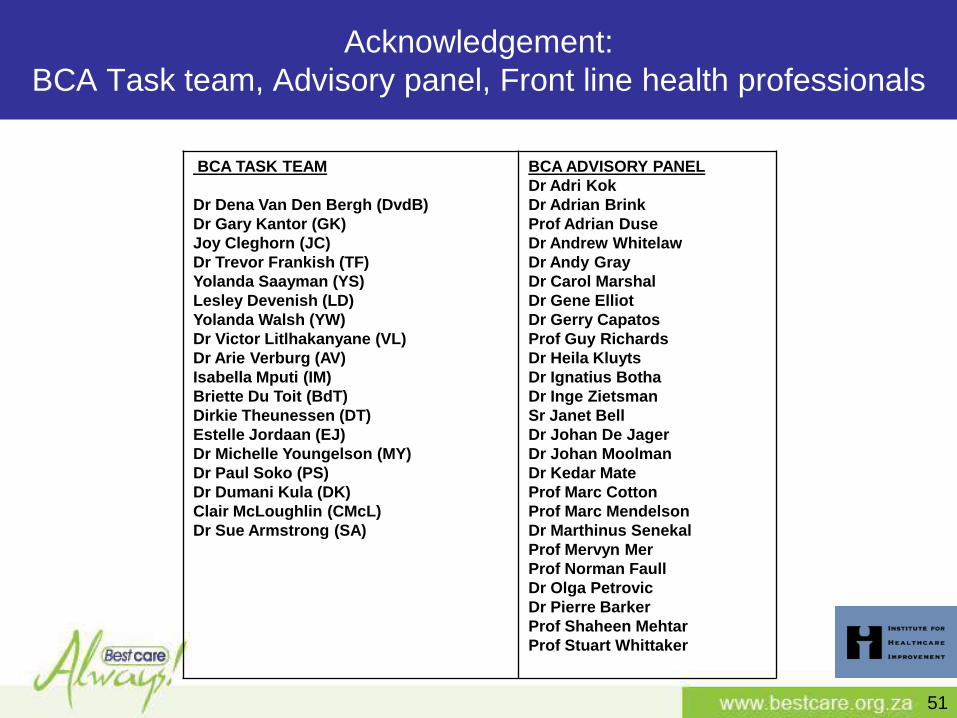
Acknowledgement:
BCA Task team, Advisory panel, Front line health professionals
BCA TASK TEAM
Dr Dena Van Den Bergh (DvdB)
Dr Gary Kantor (GK)
Joy Cleghorn (JC)
Dr Trevor Frankish (TF)
Yolanda Saayman (YS)
Lesley Devenish (LD)
Yolanda Walsh (YW)
Dr Victor Litlhakanyane (VL)
Dr Arie Verburg (AV)
Isabella Mputi (IM)
Briette Du Toit (BdT)
Dirkie Theunessen (DT)
Estelle Jordaan (EJ)
Dr Michelle Youngelson (MY)
Dr Paul Soko (PS)
Dr Dumani Kula (DK)
Clair McLoughlin (CMcL)
Dr Sue Armstrong (SA)
BCA ADVISORY PANEL
Dr Adri Kok
Dr Adrian Brink
Prof Adrian Duse
Dr Andrew Whitelaw
Dr Andy Gray
Dr Carol Marshal
Dr Gene Elliot
Dr Gerry Capatos
Prof Guy Richards
Dr Heila Kluyts
Dr Ignatius Botha
Dr Inge Zietsman
Sr Janet Bell
Dr Johan De Jager
Dr Johan Moolman
Dr Kedar Mate
Prof Marc Cotton
Prof Marc Mendelson
Dr Marthinus Senekal
Prof Mervyn Mer
Prof Norman Faull
Dr Olga Petrovic
Dr Pierre Barker
Prof Shaheen Mehtar
Prof Stuart Whittaker
52
• Support and help drive this initiative.
• Pay attention, show a personal interest, seek out
forward-thinking, change-oriented individuals and
teach and empower them to make practice
improvements.
• Encourage measurement to support improvement
• Support teams in achieving bold goals
An invitation to leaders …
Design
• CEO or senior executive
• Teams that include doctors
• Periodic learning sessions
• Support in-between
• Training a cadre of improvement advisors
• Measurement
• Sharing ideas
• Testing ideas
53