Embed Size (px)
Citation preview
A Quantitative Analysis of Peer Review
Azzurra Ragone, Katsiaryna Mirylenka, Fabio Casati and Maurizio Marchese
{ragone, kmirylenka,casati,marchese}@disi.unitn.it Dipartimento di Ingegneria e Scienza dell’Informazione University of Trento, Via Sommarive, 14
38100 Trento, Italy
Abstract In this paper we focus on the analysis of peer reviews and reviewers behaviour in a number of different review
processes. More specifically, we report on the development, definition and rationale of a number of appropriate
quantitative metrics to assess the processes main properties. We then apply the proposed metrics and analysis
framework to data sets from conference evaluation processes and we discuss the results implications and their
eventual use toward improving the analyzed peer review processes. A number of unexpected results were found,
in particular: (1) the low correlation between peer review outcome and impact in time of the accepted
contributions and (2) the presence of a high level of randomness in the analyzed peer review processes.
Introduction
Peer review is one of the most established and most controversial aspects of research
assessment. Virtually every active researcher has - at one time or another - gained great ben-
efit from a reviewer who helped to correct unnoticed (and sometimes serious) errors,
suggested ways to clarify or improve results and their description, or brought to the attention
other related work that was of great interest. At the same time most researchers have also
experienced some of their papers or research proposals being blocked by reviews that seemed
very superficial at the best and in some cases even mendacious. Indeed, peer review has been
defined by Kassirer and Campion (1994) as a crude and understudied, but indispensable
process or by Smith (2006) as a process “whose effectiveness is a matter of faith rather than
evidence”. These arguments are mostly based on the assumption that reviewers sometime are
not completely objective, but are, instead, biased or, worst, they have malicious intents
against rival scientists they do not like (Lawrence, 2003). Moreover, peer review processes
have been not yet investigated in detail with a scientific quantitative approach.
Since the role of the peer review process is fundamental for science (to select quality
contributions), for innovation (to select relevant research proposals and patents) and for
people (to provide proper credits assignment as well as career advancement), we think it is
crucial to monitor it more closely and quantitatively in order to provide to all involved
stockholders all relevant information in the most transparent way.
The focus of our work is to analyze and understand the characteristics of current review
processes in academia. In parallel, we aim to highlight strengths and weaknesses of the
processes and to study quantitatively aspects potentially related to two core dimensions:
quality, fairness. Specially, we aim at a peer review process that allows the selection of high
quality papers and proposals and that is at the same time fair. In the past this quantitative
analysis were somehow hinder by the manual and paper-based nature of the evaluation
procedures. Nowadays, with the use of computer supported environment (e.g. Peer Review
Management Systems) quantitative analysis are feasible and -in our view -should be included
in every review process.
The main contributions of the paper are: (1) the definition of an initial number of metrics
capable to analyze quantitatively two core dimensions of the process: quality and fairness;
(2) application of the proposed analysis framework to a large review processes‟ data sets from
ten different conferences in Computer Science (for a total of ca. 9000 reviews on ca. 2800
submitted contributions).
A number of interesting (and some unexpected for us) aspects of the review system have been
found. In brief for the specific analyzed data sets:
there is a significant degree of randomness in the analyzed review processes, more marked
than we initially expected; the disagreement among reviewers is high and there is very
little correlation between the rankings of the review process and the impact of the papers
as measured by citations.
it has been always possible to identify groups of reviewers that consistently give higher
(or lower) marks than the others independently from the quality of the specific proposal
they have to assess. Moreover, we have shown that even simple unbiasing procedure can
have a significant effect on the final result. This information and proposed unbiasing tool
could be useful to the review chairs to improve the fairness of the review process.
Looking at the results obtained from the application of the proposed analysis framework and
related metrics we were able to drawn some general remarks and lessons learned.
The paper is structured as follows. First we describe the dataset we used for the analysis, then
we present the dimension of our analysis (quality and fairness), detailing in the subsequent
sections the proposed metrics, analysis and related results and lessons learned. Conclusion
and a brief description of related work close the paper.
Data Set Description
In this work we have analyzed data gathered from ten conferences that took place from 2003
to 2010, whose topics were related to the computer science domain (Table 1). Among these,
there are five conferences (C1, C3, C8, C9, C10) that took place in the period from 2003 to
2006, therefore they are “old” enough for checking the impact of the accepted papers during
the years. As the data we used for the analysis are confidential, we cannot disclose the name
of the conferences. So we use an ID to identify the conference and we only report
approximate numbers in Table 1 to guarantee the anonymity of the original data.
In Table 1 for each conference we show (i) the conference ID; (ii) the approximate number of
papers submitted to the conference; (iii) the scale used by reviewers to assign marks to
papers; (iv) the typical number of reviews per paper (RPP); (v) the papers per reviewer (PPR)
and (vi) the acceptance rate of the conference. The RPP and PPR reported in Table 1 are the
most frequent values for each conference (specifically, those occurring for more than 10% of
the times for that conference). It is in fact quite normal that in one conference - on average -
three reviewers review a single paper, but sometime, in particular for some disputed papers,
there could be more than three reviewers. So we see from the table that while the typical
number of reviews per paper (RPP) is stable - in our data set - around 3, the number of paper
assigned to reviewer (PPR) is more variable and some reviewers get a higher number of
papers to review.
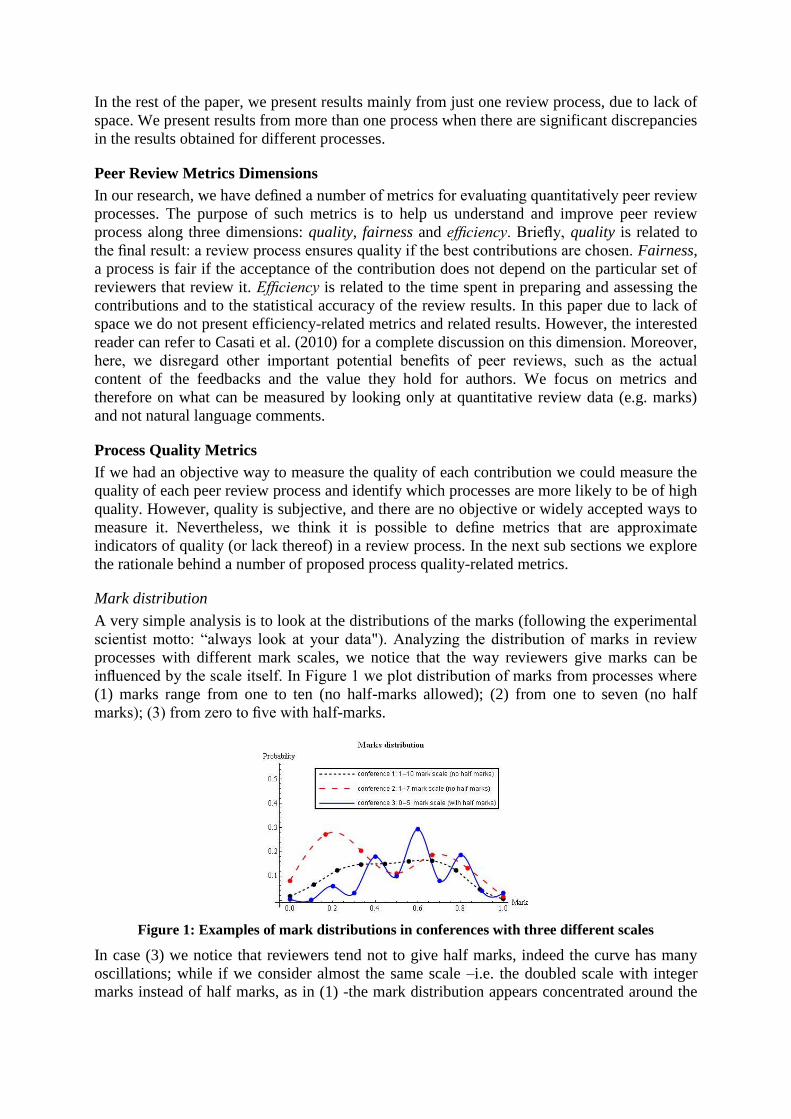
Table 1: Description of the conference data. Conference
ID
Number of
papers
Marks scale RPP PPR % accepted
papers
C1 900 1,2,...,10 3-4 1-4 21
C2 250 1,2,...,7 3-4 1,2,9,10 16
C3 700 0,0.5,...,5 3 >3 27
C4 200 0,0.5,...,5 3 1-2 26
C5 200 -3,-2,...,3 3-4 1,2,7 31
C6 150 1,2,...,5 3-4 1,2,6,7 33
C7 120 -3,-2,...,3 3-4 6-8 22
C8 150 1,2,...,7 3 4,5 45
C9 40 1,2,...,4 2-4 2,4,5,7 51
C10 100 1,2,...,7 2-3 5-6 55
In the rest of the paper, we present results mainly from just one review process, due to lack of
space. We present results from more than one process when there are significant discrepancies
in the results obtained for different processes.
Peer Review Metrics Dimensions
In our research, we have defined a number of metrics for evaluating quantitatively peer review
processes. The purpose of such metrics is to help us understand and improve peer review
process along three dimensions: quality, fairness and efficiency. Briefly, quality is related to
the final result: a review process ensures quality if the best contributions are chosen. Fairness,
a process is fair if the acceptance of the contribution does not depend on the particular set of
reviewers that review it. Efficiency is related to the time spent in preparing and assessing the
contributions and to the statistical accuracy of the review results. In this paper due to lack of
space we do not present efficiency-related metrics and related results. However, the interested
reader can refer to Casati et al. (2010) for a complete discussion on this dimension. Moreover,
here, we disregard other important potential benefits of peer reviews, such as the actual
content of the feedbacks and the value they hold for authors. We focus on metrics and
therefore on what can be measured by looking only at quantitative review data (e.g. marks)
and not natural language comments.
Process Quality Metrics
If we had an objective way to measure the quality of each contribution we could measure the
quality of each peer review process and identify which processes are more likely to be of high
quality. However, quality is subjective, and there are no objective or widely accepted ways to
measure it. Nevertheless, we think it is possible to define metrics that are approximate
indicators of quality (or lack thereof) in a review process. In the next sub sections we explore
the rationale behind a number of proposed process quality-related metrics.
Mark distribution
A very simple analysis is to look at the distributions of the marks (following the experimental
scientist motto: “always look at your data"). Analyzing the distribution of marks in review
processes with different mark scales, we notice that the way reviewers give marks can be
influenced by the scale itself. In Figure 1 we plot distribution of marks from processes where
(1) marks range from one to ten (no half-marks allowed); (2) from one to seven (no half
marks); (3) from zero to five with half-marks.
Figure 1: Examples of mark distributions in conferences with three different scales
In case (3) we notice that reviewers tend not to give half marks, indeed the curve has many
oscillations; while if we consider almost the same scale –i.e. the doubled scale with integer
marks instead of half marks, as in (1) -the mark distribution appears concentrated around the
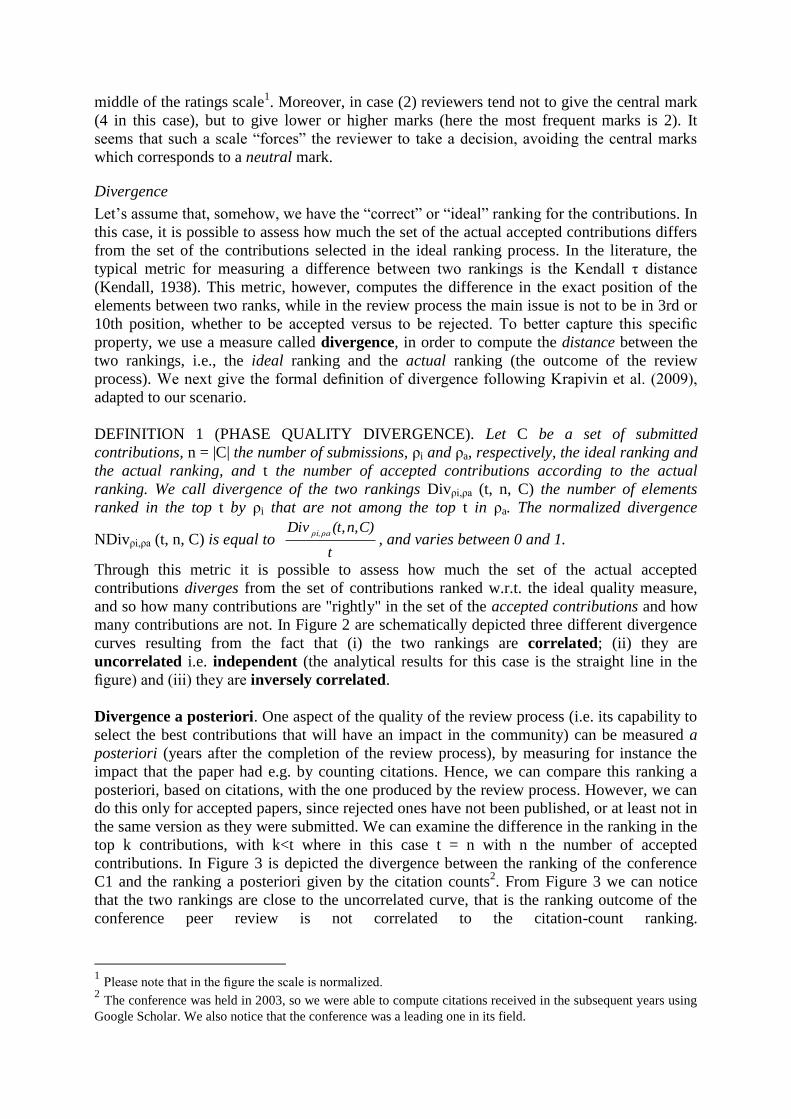
middle of the ratings scale1. Moreover, in case (2) reviewers tend not to give the central mark
(4 in this case), but to give lower or higher marks (here the most frequent marks is 2). It
seems that such a scale “forces” the reviewer to take a decision, avoiding the central marks
which corresponds to a neutral mark.
Divergence
Let‟s assume that, somehow, we have the “correct” or “ideal” ranking for the contributions. In
this case, it is possible to assess how much the set of the actual accepted contributions differs
from the set of the contributions selected in the ideal ranking process. In the literature, the
typical metric for measuring a difference between two rankings is the Kendall τ distance
(Kendall, 1938). This metric, however, computes the difference in the exact position of the
elements between two ranks, while in the review process the main issue is not to be in 3rd or
10th position, whether to be accepted versus to be rejected. To better capture this specific
property, we use a measure called divergence, in order to compute the distance between the
two rankings, i.e., the ideal ranking and the actual ranking (the outcome of the review
process). We next give the formal definition of divergence following Krapivin et al. (2009),
adapted to our scenario.
DEFINITION 1 (PHASE QUALITY DIVERGENCE). Let C be a set of submitted
contributions, n = |C| the number of submissions, ρi and ρa, respectively, the ideal ranking and
the actual ranking, and t the number of accepted contributions according to the actual
ranking. We call divergence of the two rankings Divρi,ρa (t, n, C) the number of elements
ranked in the top t by ρi that are not among the top t in ρa. The normalized divergence
NDivρi,ρa (t, n, C) is equal to t
C)n,(t,Divρaρi,
, and varies between 0 and 1.
Through this metric it is possible to assess how much the set of the actual accepted
contributions diverges from the set of contributions ranked w.r.t. the ideal quality measure,
and so how many contributions are "rightly" in the set of the accepted contributions and how
many contributions are not. In Figure 2 are schematically depicted three different divergence
curves resulting from the fact that (i) the two rankings are correlated; (ii) they are
uncorrelated i.e. independent (the analytical results for this case is the straight line in the
figure) and (iii) they are inversely correlated.
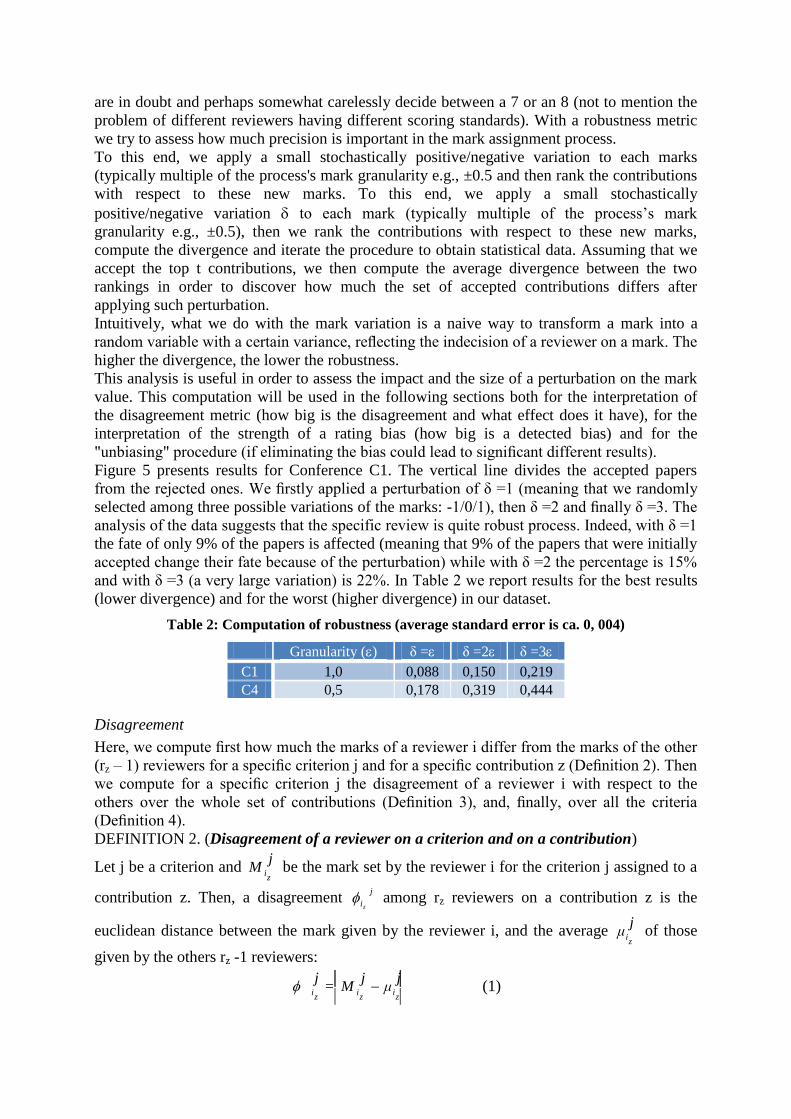
Divergence a posteriori. One aspect of the quality of the review process (i.e. its capability to
select the best contributions that will have an impact in the community) can be measured a
posteriori (years after the completion of the review process), by measuring for instance the
impact that the paper had e.g. by counting citations. Hence, we can compare this ranking a
posteriori, based on citations, with the one produced by the review process. However, we can
do this only for accepted papers, since rejected ones have not been published, or at least not in
the same version as they were submitted. We can examine the difference in the ranking in the
top k contributions, with k<t where in this case t = n with n the number of accepted
contributions. In Figure 3 is depicted the divergence between the ranking of the conference
C1 and the ranking a posteriori given by the citation counts2. From Figure 3 we can notice
that the two rankings are close to the uncorrelated curve, that is the ranking outcome of the
conference peer review is not correlated to the citation-count ranking.
1 Please note that in the figure the scale is normalized.
2 The conference was held in 2003, so we were able to compute citations received in the subsequent years using
Google Scholar. We also notice that the conference was a leading one in its field.
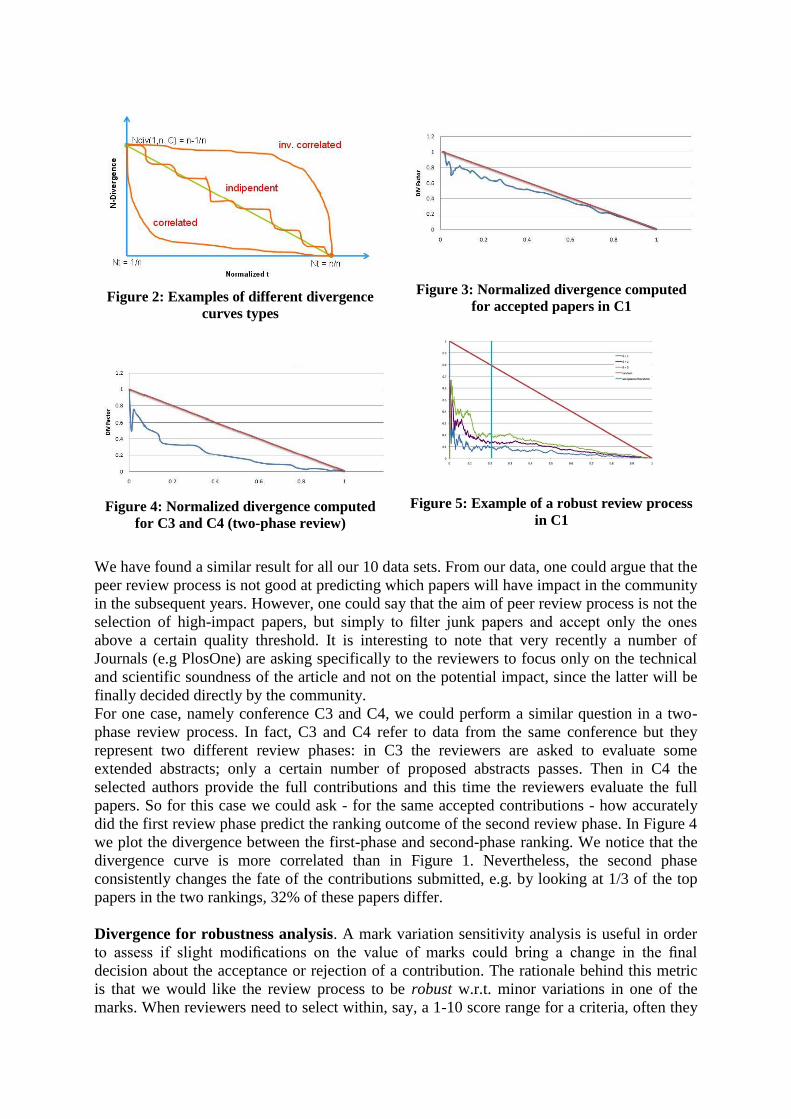
Figure 2: Examples of different divergence
curves types
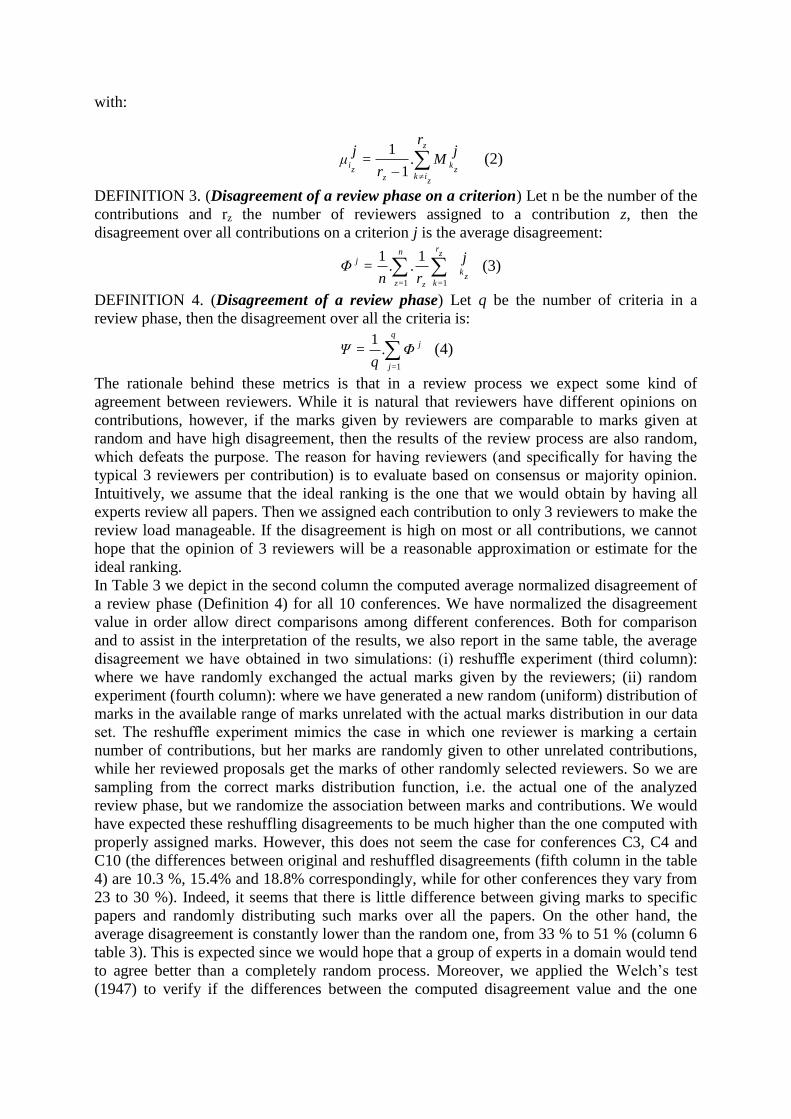
Figure 4: Normalized divergence computed
for C3 and C4 (two-phase review)
Figure 3: Normalized divergence computed
for accepted papers in C1
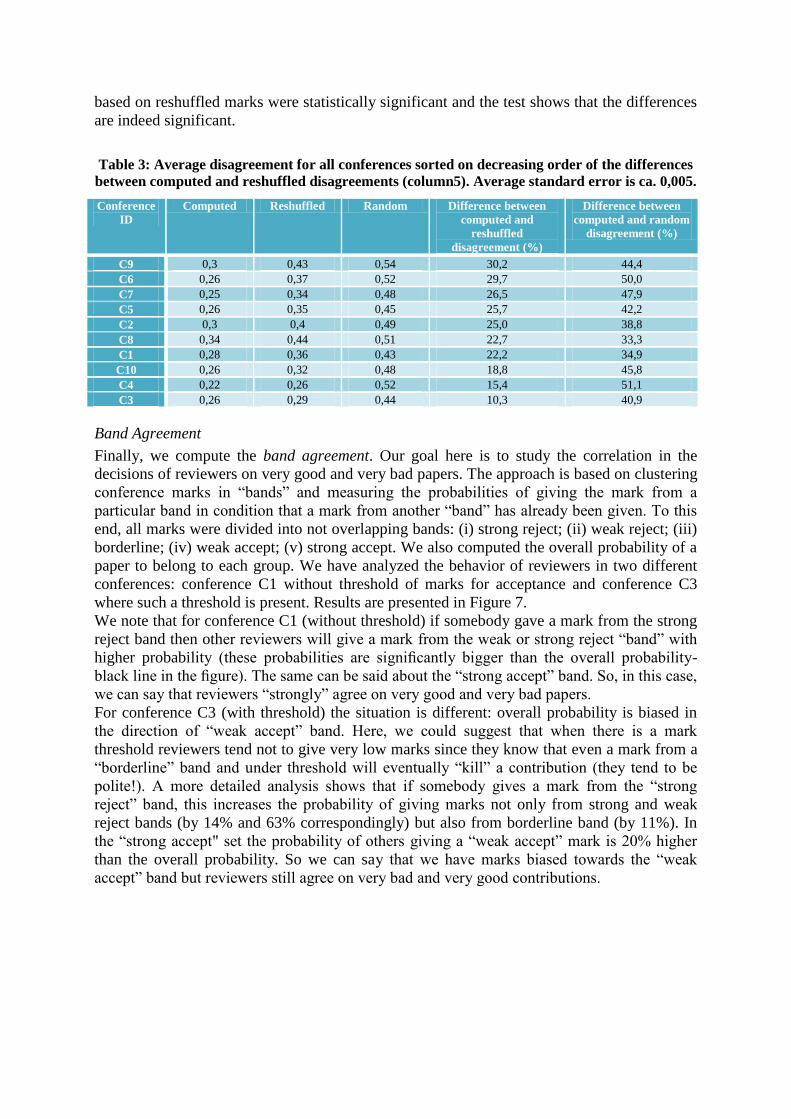
Figure 5: Example of a robust review process
in C1
We have found a similar result for all our 10 data sets. From our data, one could argue that the
peer review process is not good at predicting which papers will have impact in the community
in the subsequent years. However, one could say that the aim of peer review process is not the
selection of high-impact papers, but simply to filter junk papers and accept only the ones
above a certain quality threshold. It is interesting to note that very recently a number of
Journals (e.g PlosOne) are asking specifically to the reviewers to focus only on the technical
and scientific soundness of the article and not on the potential impact, since the latter will be
finally decided directly by the community.
For one case, namely conference C3 and C4, we could perform a similar question in a two-
phase review process. In fact, C3 and C4 refer to data from the same conference but they
represent two different review phases: in C3 the reviewers are asked to evaluate some
extended abstracts; only a certain number of proposed abstracts passes. Then in C4 the
selected authors provide the full contributions and this time the reviewers evaluate the full
papers. So for this case we could ask - for the same accepted contributions - how accurately
did the first review phase predict the ranking outcome of the second review phase. In Figure 4
we plot the divergence between the first-phase and second-phase ranking. We notice that the
divergence curve is more correlated than in Figure 1. Nevertheless, the second phase
consistently changes the fate of the contributions submitted, e.g. by looking at 1/3 of the top
papers in the two rankings, 32% of these papers differ.
Divergence for robustness analysis. A mark variation sensitivity analysis is useful in order
to assess if slight modifications on the value of marks could bring a change in the final
decision about the acceptance or rejection of a contribution. The rationale behind this metric
is that we would like the review process to be robust w.r.t. minor variations in one of the
marks. When reviewers need to select within, say, a 1-10 score range for a criteria, often they
are in doubt and perhaps somewhat carelessly decide between a 7 or an 8 (not to mention the
problem of different reviewers having different scoring standards). With a robustness metric
we try to assess how much precision is important in the mark assignment process.
To this end, we apply a small stochastically positive/negative variation to each marks
(typically multiple of the process's mark granularity e.g., ±0.5 and then rank the contributions
with respect to these new marks. To this end, we apply a small stochastically
positive/negative variation to each mark (typically multiple of the process‟s mark
granularity e.g., ±0.5), then we rank the contributions with respect to these new marks,
compute the divergence and iterate the procedure to obtain statistical data. Assuming that we
accept the top t contributions, we then compute the average divergence between the two
rankings in order to discover how much the set of accepted contributions differs after
applying such perturbation.
Intuitively, what we do with the mark variation is a naive way to transform a mark into a
random variable with a certain variance, reflecting the indecision of a reviewer on a mark. The
higher the divergence, the lower the robustness.
This analysis is useful in order to assess the impact and the size of a perturbation on the mark
value. This computation will be used in the following sections both for the interpretation of
the disagreement metric (how big is the disagreement and what effect does it have), for the
interpretation of the strength of a rating bias (how big is a detected bias) and for the
"unbiasing" procedure (if eliminating the bias could lead to significant different results).
Figure 5 presents results for Conference C1. The vertical line divides the accepted papers
from the rejected ones. We firstly applied a perturbation of δ =1 (meaning that we randomly
selected among three possible variations of the marks: -1/0/1), then δ =2 and finally δ =3. The
analysis of the data suggests that the specific review is quite robust process. Indeed, with δ =1
the fate of only 9% of the papers is affected (meaning that 9% of the papers that were initially
accepted change their fate because of the perturbation) while with δ =2 the percentage is 15%
and with δ =3 (a very large variation) is 22%. In Table 2 we report results for the best results
(lower divergence) and for the worst (higher divergence) in our dataset.
Table 2: Computation of robustness (average standard error is ca. 0, 004)
Granularity () δ = δ =2 δ =3
C1 1,0 0,088 0,150 0,219
C4 0,5 0,178 0,319 0,444
Disagreement
Here, we compute first how much the marks of a reviewer i differ from the marks of the other
(rz – 1) reviewers for a specific criterion j and for a specific contribution z (Definition 2). Then
we compute for a specific criterion j the disagreement of a reviewer i with respect to the
others over the whole set of contributions (Definition 3), and, finally, over all the criteria
(Definition 4).
DEFINITION 2. (Disagreement of a reviewer on a criterion and on a contribution)
Let j be a criterion and j
Mz
i be the mark set by the reviewer i for the criterion j assigned to a
contribution z. Then, a disagreement j
iz among rz reviewers on a contribution z is the
euclidean distance between the mark given by the reviewer i, and the average j
μz
i of those
given by the others rz -1 reviewers:
j
μj
M=j
zi
zi
zi
(1)
with:
z
zik
zk
zz
i
rj
Mr
=j
μ .1
1 (2)
DEFINITION 3. (Disagreement of a review phase on a criterion) Let n be the number of the
contributions and rz the number of reviewers assigned to a contribution z, then the
disagreement over all contributions on a criterion j is the average disagreement:
n
=z
zr
=kz
k
z
j j
rn=Φ
1 1
1..
1 (3)
DEFINITION 4. (Disagreement of a review phase) Let q be the number of criteria in a
review phase, then the disagreement over all the criteria is:
q
=j
jΦ
q=Ψ
1
.1
(4)
The rationale behind these metrics is that in a review process we expect some kind of
agreement between reviewers. While it is natural that reviewers have different opinions on
contributions, however, if the marks given by reviewers are comparable to marks given at
random and have high disagreement, then the results of the review process are also random,
which defeats the purpose. The reason for having reviewers (and specifically for having the
typical 3 reviewers per contribution) is to evaluate based on consensus or majority opinion.
Intuitively, we assume that the ideal ranking is the one that we would obtain by having all
experts review all papers. Then we assigned each contribution to only 3 reviewers to make the
review load manageable. If the disagreement is high on most or all contributions, we cannot
hope that the opinion of 3 reviewers will be a reasonable approximation or estimate for the
ideal ranking.
In Table 3 we depict in the second column the computed average normalized disagreement of
a review phase (Definition 4) for all 10 conferences. We have normalized the disagreement
value in order allow direct comparisons among different conferences. Both for comparison
and to assist in the interpretation of the results, we also report in the same table, the average
disagreement we have obtained in two simulations: (i) reshuffle experiment (third column):
where we have randomly exchanged the actual marks given by the reviewers; (ii) random
experiment (fourth column): where we have generated a new random (uniform) distribution of
marks in the available range of marks unrelated with the actual marks distribution in our data
set. The reshuffle experiment mimics the case in which one reviewer is marking a certain
number of contributions, but her marks are randomly given to other unrelated contributions,
while her reviewed proposals get the marks of other randomly selected reviewers. So we are
sampling from the correct marks distribution function, i.e. the actual one of the analyzed
review phase, but we randomize the association between marks and contributions. We would
have expected these reshuffling disagreements to be much higher than the one computed with
properly assigned marks. However, this does not seem the case for conferences C3, C4 and
C10 (the differences between original and reshuffled disagreements (fifth column in the table
4) are 10.3 %, 15.4% and 18.8% correspondingly, while for other conferences they vary from
23 to 30 %). Indeed, it seems that there is little difference between giving marks to specific
papers and randomly distributing such marks over all the papers. On the other hand, the
average disagreement is constantly lower than the random one, from 33 % to 51 % (column 6
table 3). This is expected since we would hope that a group of experts in a domain would tend
to agree better than a completely random process. Moreover, we applied the Welch‟s test
(1947) to verify if the differences between the computed disagreement value and the one
based on reshuffled marks were statistically significant and the test shows that the differences
are indeed significant.
Table 3: Average disagreement for all conferences sorted on decreasing order of the differences
between computed and reshuffled disagreements (column5). Average standard error is ca. 0,005.
Conference
ID
Computed Reshuffled Random Difference between
computed and
reshuffled
disagreement (%)
Difference between
computed and random
disagreement (%)
C9 0,3 0,43 0,54 30,2 44,4
C6 0,26 0,37 0,52 29,7 50,0
C7 0,25 0,34 0,48 26,5 47,9
C5 0,26 0,35 0,45 25,7 42,2
C2 0,3 0,4 0,49 25,0 38,8
C8 0,34 0,44 0,51 22,7 33,3
C1 0,28 0,36 0,43 22,2 34,9
C10 0,26 0,32 0,48 18,8 45,8
C4 0,22 0,26 0,52 15,4 51,1
C3 0,26 0,29 0,44 10,3 40,9
Band Agreement
Finally, we compute the band agreement. Our goal here is to study the correlation in the
decisions of reviewers on very good and very bad papers. The approach is based on clustering
conference marks in “bands” and measuring the probabilities of giving the mark from a
particular band in condition that a mark from another “band” has already been given. To this
end, all marks were divided into not overlapping bands: (i) strong reject; (ii) weak reject; (iii)
borderline; (iv) weak accept; (v) strong accept. We also computed the overall probability of a
paper to belong to each group. We have analyzed the behavior of reviewers in two different
conferences: conference C1 without threshold of marks for acceptance and conference C3
where such a threshold is present. Results are presented in Figure 7.
We note that for conference C1 (without threshold) if somebody gave a mark from the strong
reject band then other reviewers will give a mark from the weak or strong reject “band” with
higher probability (these probabilities are significantly bigger than the overall probability-
black line in the figure). The same can be said about the “strong accept” band. So, in this case,
we can say that reviewers “strongly” agree on very good and very bad papers.
For conference C3 (with threshold) the situation is different: overall probability is biased in
the direction of “weak accept” band. Here, we could suggest that when there is a mark
threshold reviewers tend not to give very low marks since they know that even a mark from a
“borderline” band and under threshold will eventually “kill” a contribution (they tend to be
polite!). A more detailed analysis shows that if somebody gives a mark from the “strong
reject” band, this increases the probability of giving marks not only from strong and weak
reject bands (by 14% and 63% correspondingly) but also from borderline band (by 11%). In
the “strong accept" set the probability of others giving a “weak accept” mark is 20% higher
than the overall probability. So we can say that we have marks biased towards the “weak
accept” band but reviewers still agree on very bad and very good contributions.
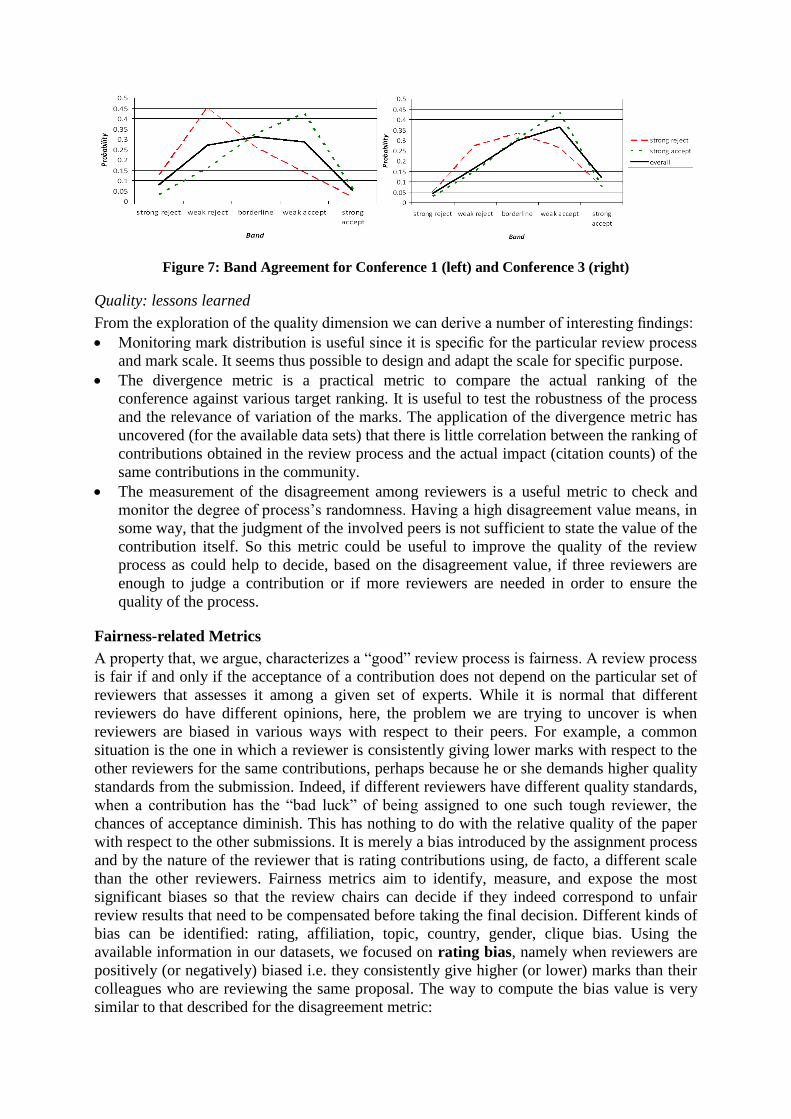
Figure 7: Band Agreement for Conference 1 (left) and Conference 3 (right)
Quality: lessons learned
From the exploration of the quality dimension we can derive a number of interesting findings:
Monitoring mark distribution is useful since it is specific for the particular review process
and mark scale. It seems thus possible to design and adapt the scale for specific purpose.
The divergence metric is a practical metric to compare the actual ranking of the
conference against various target ranking. It is useful to test the robustness of the process
and the relevance of variation of the marks. The application of the divergence metric has
uncovered (for the available data sets) that there is little correlation between the ranking of
contributions obtained in the review process and the actual impact (citation counts) of the
same contributions in the community.
The measurement of the disagreement among reviewers is a useful metric to check and
monitor the degree of process‟s randomness. Having a high disagreement value means, in
some way, that the judgment of the involved peers is not sufficient to state the value of the
contribution itself. So this metric could be useful to improve the quality of the review
process as could help to decide, based on the disagreement value, if three reviewers are
enough to judge a contribution or if more reviewers are needed in order to ensure the
quality of the process.
Fairness-related Metrics
A property that, we argue, characterizes a “good” review process is fairness. A review process
is fair if and only if the acceptance of a contribution does not depend on the particular set of
reviewers that assesses it among a given set of experts. While it is normal that different
reviewers do have different opinions, here, the problem we are trying to uncover is when
reviewers are biased in various ways with respect to their peers. For example, a common
situation is the one in which a reviewer is consistently giving lower marks with respect to the
other reviewers for the same contributions, perhaps because he or she demands higher quality
standards from the submission. Indeed, if different reviewers have different quality standards,
when a contribution has the “bad luck” of being assigned to one such tough reviewer, the
chances of acceptance diminish. This has nothing to do with the relative quality of the paper
with respect to the other submissions. It is merely a bias introduced by the assignment process
and by the nature of the reviewer that is rating contributions using, de facto, a different scale
than the other reviewers. Fairness metrics aim to identify, measure, and expose the most
significant biases so that the review chairs can decide if they indeed correspond to unfair
review results that need to be compensated before taking the final decision. Different kinds of
bias can be identified: rating, affiliation, topic, country, gender, clique bias. Using the
available information in our datasets, we focused on rating bias, namely when reviewers are
positively (or negatively) biased i.e. they consistently give higher (or lower) marks than their
colleagues who are reviewing the same proposal. The way to compute the bias value is very
similar to that described for the disagreement metric:
j
i
j
i
j
iM
This time the sign of the equation is important in order to discover positive or negative biases.
Indeed, if the value of i
j is constantly positive, this means the reviewer tends to give always
higher marks with respect to other reviewers; while if the value of i
j is constantly negative
then the reviewer tends to give always more negative marks than other reviewers. As for the
disagreement metrics, there are several scopes to which we can apply the bias metric. For
example, we can measure the bias for a single reviewer and for a particular criterion, the bias
over a review phase, and the bias over all the criteria. Once biases are identified, the review
chairs can take a number of actions. One could be to compensate for the specific paper under
review with additional reviews. Another action could be to apply automatic or semi-automatic
unbiasing algorithms: a simple one could be to modify the marks by adding or removing the
bias values so that on average the overall bias of the most biased reviewers is reduced. In
particular, if we take all reviewers r that have a bias greater than b and that have done a
number of reviews higher than nr, and subtract b from all marks of r (or from the top-k biased
reviewers), we can obtained a new unbiased ranking. By comparing the obtained unbiased
ranking with the original ranking (for instance using the divergence metrics) we can assess the
overall impact of the unbiasing procedure on the particular review process.
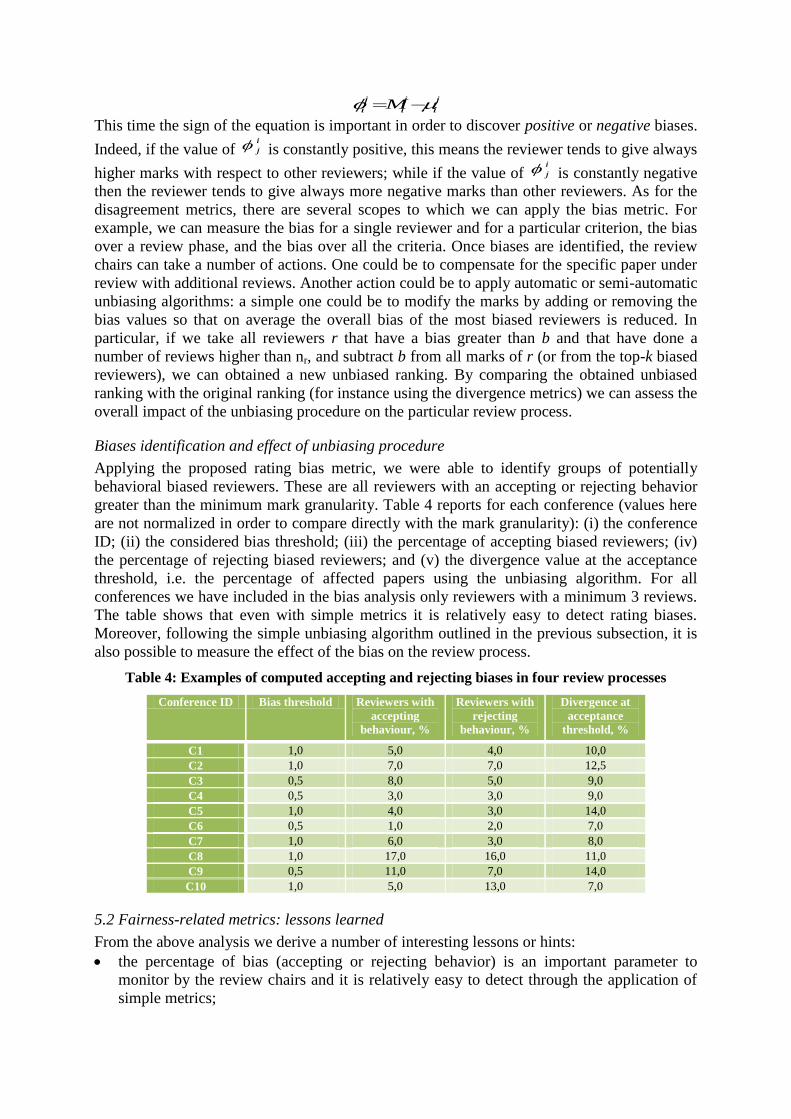
Biases identification and effect of unbiasing procedure
Applying the proposed rating bias metric, we were able to identify groups of potentially
behavioral biased reviewers. These are all reviewers with an accepting or rejecting behavior
greater than the minimum mark granularity. Table 4 reports for each conference (values here
are not normalized in order to compare directly with the mark granularity): (i) the conference
ID; (ii) the considered bias threshold; (iii) the percentage of accepting biased reviewers; (iv)
the percentage of rejecting biased reviewers; and (v) the divergence value at the acceptance
threshold, i.e. the percentage of affected papers using the unbiasing algorithm. For all
conferences we have included in the bias analysis only reviewers with a minimum 3 reviews.
The table shows that even with simple metrics it is relatively easy to detect rating biases.
Moreover, following the simple unbiasing algorithm outlined in the previous subsection, it is
also possible to measure the effect of the bias on the review process.
Table 4: Examples of computed accepting and rejecting biases in four review processes
Conference ID Bias threshold Reviewers with
accepting
behaviour, %
Reviewers with
rejecting
behaviour, %
Divergence at
acceptance
threshold, %
C1 1,0 5,0 4,0 10,0
C2 1,0 7,0 7,0 12,5
C3 0,5 8,0 5,0 9,0
C4 0,5 3,0 3,0 9,0
C5 1,0 4,0 3,0 14,0
C6 0,5 1,0 2,0 7,0
C7 1,0 6,0 3,0 8,0
C8 1,0 17,0 16,0 11,0
C9 0,5 11,0 7,0 14,0
C10 1,0 5,0 13,0 7,0
5.2 Fairness-related metrics: lessons learned
From the above analysis we derive a number of interesting lessons or hints:
the percentage of bias (accepting or rejecting behavior) is an important parameter to
monitor by the review chairs and it is relatively easy to detect through the application of
simple metrics;
it is also possible to device simple and automatic unbiasing procedures; they do not need
to be applied as black boxes, but together with the analysis of the divergence between the
actual ranking and the unbiased one. Divergence can provide quantitative data about the
effect of biases on the final review process. Data that again can be used by the review
chairs to better characterized and monitor their evaluation processes.
Our future work in the dimension of fairness-related metrics includes identifying - with
similar models - other types of biases related to affiliation, topic, country, gender, clique bias
and other aspects rather than limiting the analysis to accepting or rejecting biases. The
challenge here is to collect and have access to the appropriate specific metadata.
Related Work and Conclusion
Peer review has been widely studied in the last years, therefore this section, due to lack of the
space, is far from being complete. Even if peer review has been used as method of evaluation
since Greek time, one of the first journals that was selective in the choice of its manuscripts
was the Philosophical Transaction of the Royal Society of London, founded in 1665 (Spier,
2002).However, the first journal that introduced the peer review process as we know it today
has been the Medical Essays and Observations, first published in 1731 (Spier, 2002).
Peer review has been analyzed and studied by several researchers, however, we notice that
such analysis are not straight comparable, as they refer to review processes coming from
different disciplines and different journals. Indeed, sometime even analysis done in the same
field can lead to contradictory results (Jefferson et al. 2002a). The various studies on peer
review differ in which metric they evaluate and in the kind and amount of data that is
available. Indeed, having precise objectives for the analysis is one of the key and hardest
challenges as it is often unclear and debatable to define what it means for peer review to be
effective (Jefferson et al. 2002b).
Some scientists investigated if peer review is really able to improve the quality of a paper and
correct consistent errors. A study was conducted by Goodman et al. (1994) who tried to
measure the quality of the papers submitted to the Annals of Internal Medicine between
March 1992 and March 1993 before and after the peer review process. They did not find any
substantial difference in the manuscripts before and after publication. Indeed, they state that
peer review was able to detect only small flaws in the papers, such as figures, statistics and
description of the results. An interesting study was carried out by Godlee et al. (1998): they
introduced deliberate errors in papers already accepted by the British Medical Journal(BMJ).
Godlee et al. report that the mean number of major errors detected was 2 out of a total of 8,
while there were 16% of reviewers that did not find any mistake, and 33% of reviewers went
for acceptance despite the introduced mistakes.
Citation count was used as a metric mostly in studies by Bornmann and Daniel (2005b). A
first study reports on whether peer review committees are effective in selecting people that
have higher citation statistics, and finds that there is indeed such a correlation Another very
interesting study concerns preliminary review of papers by staff editors of journals, before
sending the papers through a peer review process. The study observes that “three-quarters of
the manuscripts that were rated negatively at the initial internal evaluation but accepted for
publication after the peer review had far above-average citation counts” (Bornmann and
Daniel, 2010). To the best of our knowledge, none of the prior art uses the same metrics we
define in the process quality section. Many works, such as the interesting work by Bormann
and Daniel, do consider one of them (citations) as a validity metric, but do not consider the
rankings that come out of the peer review process and compare them with citations, which is
one of the main aspect we consider in this paper. Furthermore, our work differs for the scale
of the analysis, in terms of number of papers and reviews taken into consideration. Indeed,

some aspects of peer review remain understudied because it is difficult to have access to data.
However, we succeeded in collecting 10 conference review data, while in other works,
authors are restricted to analyze only 1-2 conferences, grant applications processes or
fellowships as Reinhart (2009) who analyze 496 applications for project-base funding,
Bornmann and Daniel (2005a) who studied the selection process of 1,954 doctoral and 743
post-doctoral applications for fellowships and Bornmann et al.(2008) who analize 668
applications for funding. For what concern studies on bias, there are works that have found
affiliation bias (meaning that researchers from prominent institutions are favored in peer
review) (Ceci and Peters, 1982), bias in favor of US-based researchers (Link, 1998), or
gender bias against female researchers (Wenneras and Wold, 1997). In our work, we compute
the rating bias (reviewers consistently giving higher or lower marks), which is a kind of bias
that appears rather often, that is easy to detect, and that can be corrected with rather simple
procedures.
In conclusion, in this work we have presented and discussed the results of the analysis on two
different dimensions (quality and fairness) on a set of conference data from the computer
science field. We do not claim that these results are general, but we think that the overall
analysis framework proposed here (i) can help to understand better this process, (ii) can give
useful hints in order to improve current peer review process and (iii) can be generalized to
different fields. In the near future we want to extend the analysis to more conferences, also
from fields different from computer science.
Acknowledgement
The LIQUIDPUB project acknowledges the financial support of the Future and Emerging Technologies (FET)
programme within the Seventh Framework Programme for Research of the European Commission, under FET-
Open grant number: 213360
References
Bornmann L., Daniel H.-D. Committee peer review at an international research foundation: predictive validity
and fairness of selection decisions on post-graduate fellowship applications. Research Evaluation, 14(1):15–
20, 2005a.
Bornmann L., Daniel H.-D. Selection of research fellowship recipients by committee peer review: reliability,
fairness and predictive validity of board of trustees‟ decisions. Scientometrics, 63(2):297–320, 2005b.
Bornmann L., Daniel H.-D. The validity of staff editors initial evaluations of manuscripts: a case study of
Angewandte Chemie international edition. Scientometrics 85(3), 681-687, 2010.
Bornmann, L., Wallon, G., Ledin, A. Does the committee peer review select the best applicants for funding? An
investigation of the selection process for two european molecular biology organization programmes. PLoS
ONE, 3, 2008.
Casati F., Marchese M., Mirylenka K., Ragone A. Reviewing peer review: a quantitative analysis of peer review.
Technical Report 1813, University of Trento, Num.1813 - April 2010
Ceci S.J., Peters D.P. Peer review: A study of reliability. Change, 14(6): 44–48, 1982.
Godlee F., Gale C.R., Martyn C.N. Effect on the quality of peer review of blinding reviewers and asking them to
sign their reports a randomized controlled trial. JAMA, 280(3):237–240, 1998.
Goodman S.N., Berlin J., Fletcher S.W., Fletcher R.H. Manuscript quality before and after peer review and
editing at annals of internal medicine. Annals of Internal Medicine, 121(1):11–21, 1994.
Jefferson T., P. Alderson, E. Wager, and F. Davidoff. Effects of editorial peer review: a systematic review.
JAMA, 287(21):2784–2786, 2002a.
Jefferson T., Wager E., Davidoff F. Measuring the quality of editorial peer review. JAMA, 287(21):2786–2790,
2002b.
Kassirer J.P.,Campion E.W. Peer review: Crude and understudied, but indispensable. Journal of American
Medical Association, 272(2):96–97, 1994.
Kendall M.G. A new measure of rank correlation. Biometrika, 30(1-2):81–93, 1938.
Krapivin M., Marchese M., Casati F. Exploring and understanding citation-based scientific metrics. In J. Zhou,
editor, First International Conference Complex 2009, pages 1550–1563, Shanghai, China, February 23-25,
2009.
Lawrence P.A. The politics of publication. Nature, 422(6929):259–261, 2003.
Link A.M. Us and non-us submissions an analysis of reviewer bias. JAMA. 280(3):246-7. 1998.
Reinhart M. Peer review of grant applications in biology and medicine. reliability, fairness,
and validity. Scientometrics, 81(3):789–809, 2009.
Smith R. Peer review: a flawed process at the heart of science and journals. JRSM, 99(4):178, 2006.
Spier, R. The history of the peer-review process. Trends Biotechnol., 20:357–358, 2002.
Welch B. L. The generalization of „student‟s‟ problem when several different population variances are involved.
Biometrika, 34(1/2):28–35, 1947.
Wenneras C.,Wold A. Nepotism and sexism in peer-review. Nature, 387:341–343, 1997.


![Review: Together We Can [TWC] Peer Education Programmeadore.ifrc.org/Download.aspx?FileId=45329&.pdf · Together We Can (TWC) programme using both quantitative and qualitative data](https://img.pdfslide.net/doc/110x75/5f712ca1ef71641d9b4c2c35/review-together-we-can-twc-peer-education-together-we-can-twc-programme-using.jpg)