Embed Size (px)
Citation preview
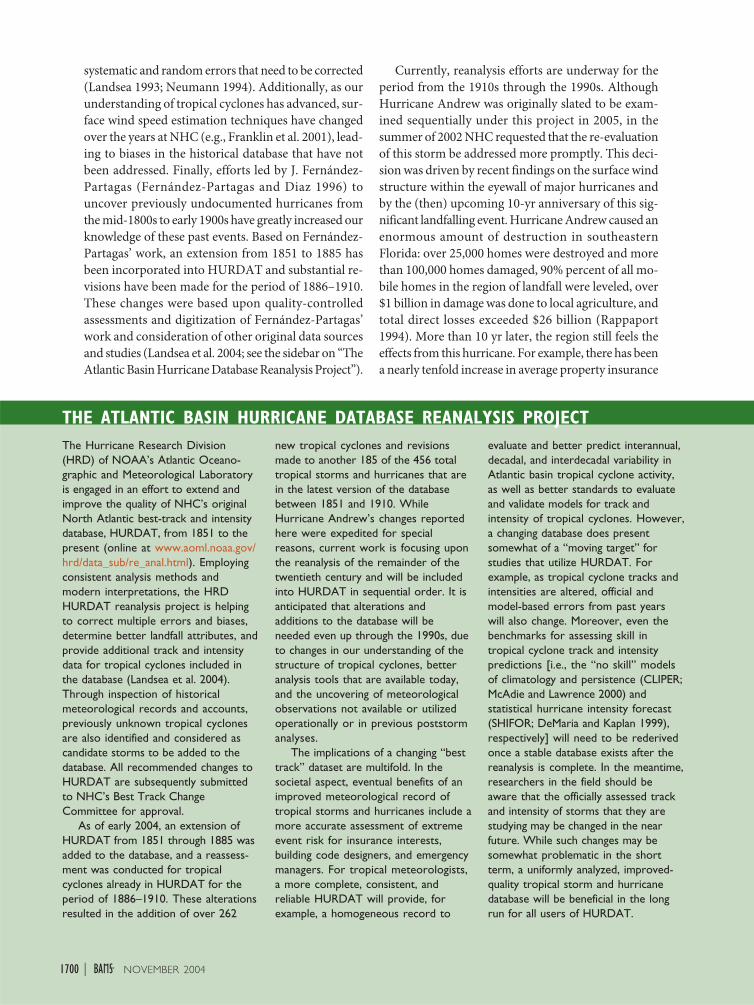
1699NOVEMBER 2004AMERICAN METEOROLOGICAL SOCIETY |
“The sound of the wind, that’s what you never forget.The initial whisper.The growing mewing that turns into a howl.Then the cry of glass shattering.The snap of trees breaking.The grumbling of a roof peeling apart.”
—ANA VECIANA-SUAREZ
September 11, 2004, Miami HeraldRemembering Hurricane Andrew as 2004’s Ivan threatens
he Atlantic basin hurricane database (HURDAT;Jarvinen et al. 1984) reanalysis project is an ongo-ing effort to extend the database back in time, and
to revisit and revise, if necessary, the official tracks and
AFFILIATIONS: LANDSEA AND DODGE—NOAA/AOML/HurricaneResearch Division, Miami, Florida; FRANKLIN, MCADIE, BEVEN, GROSS,JARVINEN, PASCH, AND RAPPAPORT—NOAA/NWS/TPC/NationalHurricane Center, Miami, Florida; DUNION—CIMAS, University ofMiami, and NOAA/AOML/Hurricane Research Division, Miami,Florida
A REANALYSIS OFHURRICANE ANDREW’S
INTENSITYBY CHRISTOPHER W. LANDSEA, JAMES L. FRANKLIN, COLIN J. MCADIE, JOHN L. BEVEN II,
JAMES M. GROSS, BRIAN R. JARVINEN, RICHARD J. PASCH, EDWARD N. RAPPAPORT,JASON P. DUNION, AND PETER P. DODGE
Hurricane Andrew, one of the United States’ worst natural disasters, is upgraded to a
Saffir-Simpson Hurricane Scale category 5—the highest intensity category possible
TCORRESPONDING AUTHOR: Dr. Christopher W. Landsea,NOAA/AOML/Hurricane Research Division, 4301Rickenbacker Causeway, Miami, FL 33149E-mail: [email protected]:10.1175/BAMS-85-11-1699
In final form 2 May 2004©2004 American Meteorological Society
intensities of tropical storms and hurricanes from 1851to the present (Landsea et al. 2004). Wind estimatesfrom Atlantic basin tropical cyclones are recorded inHURDAT in 6-hourly intervals as the maximum 1-minsurface (10 m) wind speed (in 5-kt increments; note that1 kt = 0.515 m s–1) within the circulation of the tropicalcyclone. HURDAT is utilized in a wide variety of ways,including climatic change studies, seasonal forecasting,risk assessment for emergency managers, analysis ofpotential losses for insurance and business interests,and the development and verification of officialNational Hurricane Center (NHC) and computermodel predictions of track and intensity.
While the Atlantic hurricane database has wide-spread and varied uses, HURDAT contains many
1700 NOVEMBER 2004|
systematic and random errors that need to be corrected(Landsea 1993; Neumann 1994). Additionally, as ourunderstanding of tropical cyclones has advanced, sur-face wind speed estimation techniques have changedover the years at NHC (e.g., Franklin et al. 2001), lead-ing to biases in the historical database that have notbeen addressed. Finally, efforts led by J. Fernández-Partagas (Fernández-Partagas and Diaz 1996) touncover previously undocumented hurricanes fromthe mid-1800s to early 1900s have greatly increased ourknowledge of these past events. Based on Fernández-Partagas’ work, an extension from 1851 to 1885 hasbeen incorporated into HURDAT and substantial re-visions have been made for the period of 1886–1910.These changes were based upon quality-controlledassessments and digitization of Fernández-Partagas’work and consideration of other original data sourcesand studies (Landsea et al. 2004; see the sidebar on “TheAtlantic Basin Hurricane Database Reanalysis Project”).
Currently, reanalysis efforts are underway for theperiod from the 1910s through the 1990s. AlthoughHurricane Andrew was originally slated to be exam-ined sequentially under this project in 2005, in thesummer of 2002 NHC requested that the re-evaluationof this storm be addressed more promptly. This deci-sion was driven by recent findings on the surface windstructure within the eyewall of major hurricanes andby the (then) upcoming 10-yr anniversary of this sig-nificant landfalling event. Hurricane Andrew caused anenormous amount of destruction in southeasternFlorida: over 25,000 homes were destroyed and morethan 100,000 homes damaged, 90% percent of all mo-bile homes in the region of landfall were leveled, over$1 billion in damage was done to local agriculture, andtotal direct losses exceeded $26 billion (Rappaport1994). More than 10 yr later, the region still feels theeffects from this hurricane. For example, there has beena nearly tenfold increase in average property insurance
The Hurricane Research Division(HRD) of NOAA’s Atlantic Oceano-graphic and Meteorological Laboratoryis engaged in an effort to extend andimprove the quality of NHC’s originalNorth Atlantic best-track and intensitydatabase, HURDAT, from 1851 to thepresent (online at www.aoml.noaa.gov/hrd/data_sub/re_anal.html). Employingconsistent analysis methods andmodern interpretations, the HRDHURDAT reanalysis project is helpingto correct multiple errors and biases,determine better landfall attributes, andprovide additional track and intensitydata for tropical cyclones included inthe database (Landsea et al. 2004).Through inspection of historicalmeteorological records and accounts,previously unknown tropical cyclonesare also identified and considered ascandidate storms to be added to thedatabase. All recommended changes toHURDAT are subsequently submittedto NHC’s Best Track ChangeCommittee for approval.
As of early 2004, an extension ofHURDAT from 1851 through 1885 wasadded to the database, and a reassess-ment was conducted for tropicalcyclones already in HURDAT for theperiod of 1886–1910. These alterationsresulted in the addition of over 262
new tropical cyclones and revisionsmade to another 185 of the 456 totaltropical storms and hurricanes that arein the latest version of the databasebetween 1851 and 1910. WhileHurricane Andrew’s changes reportedhere were expedited for specialreasons, current work is focusing uponthe reanalysis of the remainder of thetwentieth century and will be includedinto HURDAT in sequential order. It isanticipated that alterations andadditions to the database will beneeded even up through the 1990s, dueto changes in our understanding of thestructure of tropical cyclones, betteranalysis tools that are available today,and the uncovering of meteorologicalobservations not available or utilizedoperationally or in previous poststormanalyses.
The implications of a changing “besttrack” dataset are multifold. In thesocietal aspect, eventual benefits of animproved meteorological record oftropical storms and hurricanes include amore accurate assessment of extremeevent risk for insurance interests,building code designers, and emergencymanagers. For tropical meteorologists,a more complete, consistent, andreliable HURDAT will provide, forexample, a homogeneous record to
evaluate and better predict interannual,decadal, and interdecadal variability inAtlantic basin tropical cyclone activity,as well as better standards to evaluateand validate models for track andintensity of tropical cyclones. However,a changing database does presentsomewhat of a “moving target” forstudies that utilize HURDAT. Forexample, as tropical cyclone tracks andintensities are altered, official andmodel-based errors from past yearswill also change. Moreover, even thebenchmarks for assessing skill intropical cyclone track and intensitypredictions [i.e., the “no skill” modelsof climatology and persistence (CLIPER;McAdie and Lawrence 2000) andstatistical hurricane intensity forecast(SHIFOR; DeMaria and Kaplan 1999),respectively] will need to be rederivedonce a stable database exists after thereanalysis is complete. In the meantime,researchers in the field should beaware that the officially assessed trackand intensity of storms that they arestudying may be changed in the nearfuture. While such changes may besomewhat problematic in the shortterm, a uniformly analyzed, improved-quality tropical storm and hurricanedatabase will be beneficial in the longrun for all users of HURDAT.
THE ATLANTIC BASIN HURRICANE DATABASE REANALYSIS PROJECT
1700 NOVEMBER 2004|
1701NOVEMBER 2004AMERICAN METEOROLOGICAL SOCIETY |
costs for hurricane wind damage in some coastal loca-tions and limited availability of privately underwritteninsurance (Chandler and Charles 2002).
Society needs reliable information as to the fre-quency and severity of past catastrophic events to bestplan for the future. Therefore, it is crucial that accuratehistorical accounts of the characteristics of all tropicalcyclones be obtained. This is of particular importancefor significant landfalling hurricanes like Andrew.Recently, our understanding of the surface wind fieldin hurricanes has advanced dramatically (Franklin et al.2003; Dunion et al. 2003). New global positioning sys-tem (GPS) dropwindsonde observations in hurricaneeyewalls—first collected in the eastern North Pacificfrom Hurricane Guillermo in 1997—suggest that theintensities of all of the hurricanes in the aircraft recon-naissance era up through 1998 should be re-examinedwhen the primary method for estimating surface windswas from flight-level wind adjustments.
In August 2002, NHC’s Best Track Change Com-mittee, chaired by C. J. McAdie, with members J. L.Beven II, J. M. Gross, B. R. Jarvinen, R. J. Pasch, andE. N. Rappaport, with H. Saffir serving as a noncom-mittee observer, met to consider proposed revisionsto the official intensity of Hurricane Andrew both overthe open ocean and at landfall. Complete documenta-tion of the presentations given by E. N. Rappaport, J. L.Franklin, M. D. Powell, P. G. Black, and C. W. Landsea,e-mail exchanges on the issue, the committee’s fulldecision, and the revised database can be found online(www.aoml.noaa.gov/hrd/hurdat/index.html). Thepurpose of this paper is to provide a more permanentsummary of the evidence and issues considered by thecommittee, to record the outcome of the reanalysis, andto discuss some of the implications of these changes.
ASSESSING MAXIMUM SURFACE WINDSIN HURRICANES. The original NHC estimates ofHurricane Andrew’s intensity for most of its over-waterlife cycle were based primarily upon an adjustment ofaircraft reconnaissance flight-level winds to the surface.In particular, Hurricane Andrew’s intensity at landfallin southeastern Florida was largely determined shortlyafter its passage by adjusting the peak U.S. Air Forcereconnaissance aircraft 700-mb flight-level winds of162 kt to 125 kt at the surface—an adjustment factor of77%.1 An analysis of Andrew by Powell and Houston(1996) came to a similar conclusion—that maximum
1-min surface winds of 128 kt impacted the southeast-ern Florida coast. However, two recent studies byFranklin et al. (2003) and Dunion et al. (2003) providestrong evidence that the methodology originally usedto assess the maximum 1-min surface wind in thepoststorm analyses of Hurricane Andrew (Rappaport1994; Mayfield et al. 1994; Powell and Houston 1996)resulted in winds too low for a substantial portion(~5 days) of the lifetime of the storm. (See the sidebaron “New understanding of eyewall structure sinceHurricane Andrew” for details that have led to thesechanges in the methodology for determining intensity,and for discussion about the adjustment factor.)
Aircraft reconnaissance flights have been standardoperating procedure since the 1940s for tropical stormsand hurricanes threatening land in the Atlantic basin.In the absence of contradictory evidence, current op-erational practice at NHC is to estimate the surfacemaximum 1-min wind intensity of a hurricane at about90% of the peak 10-s wind present at the 700-mb level(i.e. the “90% rule,” Franklin et al. 2001, 2003). Such amethodology likely will remain a primary tool for as-sessing intensity in Atlantic basin hurricanes for at leastthe next few years.
ESTIMATING ANDREW’S INTENSITY. Aircraftreconnaissance data. As Hurricane Andrew approachedFlorida in late August 1992, it was monitored almostcontinuously by U.S. Air Force reconnaissance aircraftmeasuring flight-level winds at 700 mb and obtainingminimum sea level pressure data. At 0810 UTC, aboutan hour prior to Andrew’s landfall in mainlandsoutheastern Florida, an Air Force reconnaissanceaircraft at 700 mb measured a 10-s-average wind of162 kt. Application of a 90% adjustment factor to thisflight-level wind produces a surface wind estimate of146 kt. Similarly adjusted 10-s-average flight-level windsat 0809 and 0811 UTC yield surface values of 140 and141 kt, respectively. During the aircraft’s subsequentpass through the hurricane, an additional 10-s reportat 0918 UTC yields a surface value of 137 kt using thesame reduction. The importance of these additionalobservations is that they indicate that the flight-levelobservation at 0810 UTC was not an isolated condition.
Analyses from the current Hurricane Wind Analy-sis System (H*Wind) surface wind algorithm (Dunionand Powell 2002) provide a marine exposure surfacewind estimate of 153 kt, or 94% of the flight-level ob-
1 NHC’s operational estimate of Hurricane Andrew’s intensity at landfall in southeastern Florida was slightly lower—120 kt. Theoperational wind speed and position estimates of all Atlantic basin tropical storms and hurricane are reanalyzed soon after theevent for a poststorm “best track” assessment, which may differ slightly from that given in real time.
NEW UNDERSTANDING OF EYEWALL STRUCTURE SINCE HURRICANE ANDREW
1702 NOVEMBER 2004|
A key issue confronting both operationalestimates and postanalysis assessments ofhurricane intensity is the most appropriateway to adjust flight-level winds typically at700 mb down to surface wind values. Ten-second averages of the flight-level wind inthe inner core of hurricanes are assumed torepresent a 1-min-averaged wind (Powellet al. 1991). Longer averaging of the flight-level winds would tend to underestimatethe true maximum 1-min wind speedsbecause the aircraft does not remain longin the peak gradient region on a radial flighttrack, especially in relatively small hurricaneslike Andrew. The best method for adjustingthese winds to the surface had previouslybeen unclear, because the most thoroughstudy of flight-level winds to surface windobservations (i.e., Powell and Black 1990)contained mainly tropical storm–forcemaximum winds and few observations inthe eyewall region.
A new understanding of the surfacewind structure in hurricanes was madepossible by an advance in technology, theGPS dropwindsonde (Hock and Franklin1999), which provided the first detailedwind profile in a hurricane’s eyewall fromthe flight level to the ocean surface. Near-surface data from individual dropwind-sondes have compared favorably withconcurrent observations from mooredbuoys and C-MAN stations (Houston et al.2000) and collocated Stepped FrequencyMicrowave Radiometer data (Uhlhorn andBlack 2003), although both of these studieshave limited observations from the core ofmajor hurricanes. While individual GPSdropwindsondes provide only a momentaryslice of data (which is not even a verticalprofile because of the inflowing and swirlingflow that the drop encounters in thehurricane eyewall), a judicious partitioningand averaging of the dropwindsondes canprovide useful wind mean wind conditionswithin the hurricane.
Franklin et al. (2003) examined severalhundred over-ocean GPS dropwindsondeprofiles in the hurricane eyewall and haveshown that the mean ratio of surface-to-700-mb winds is about 90% in the eyewallregion. Franklin et al. recommended a set ofadjustment factors for the interpretation oftropical cyclone flight-level data. The resultsfrom the drop profile analyses in Franklin
et al.’s (2003) study provide a way to inferwinds at one level from those at another.This adjustment assumes a similar averagingtime at both levels, but is not constrainedto any particular averaging time. For thestronger (right hand) side of the eyewall,they found that the mean surface-to-700-mb ratio was between 86% and 90%.Thus, without additional information,estimates of the surface maximum 1-minwind intensity of a hurricane at theNational Hurricane Center are assessed tobe about 90%SB1 of the peak 10-s windobserved at the 700-mb level from anaircraft.
Recent work by Dunion and Powell(2002) and Dunion et al. (2003) alsosupports a revised flight-level-to-surface-wind adjustment in the context of theHurricane Research Division’s H*Windsurface wind analyses of tropical cyclones.H*Wind is an analysis tool that canassimilate a variety of observations within atropical cyclone to produce a storm-centered few-hour composite of thesurface wind field (Powell 1980; Powellet al. 1996, 1998). Given sufficientobservations, the analyses can be used tomake estimates of the maximum 1-minwinds, as well as radii of tropical storm–force or hurricane-force winds.
Using information from the GPSdropwindsondes, techniques weredeveloped to improve H*Wind’s adjust-ment of aircraft flight-level winds to thesurface. Dunion and Powell (2002) andDunion et al. (2003) utilized the drop-windsonde data to revise the H*Windalgorithms in a two-step process. First,analyses of the dropwindsondes show thatthe original H*Wind assumption that700-mb flight-level winds were equivalentto mean boundary layer (0–500 m) windsproduced an underestimation of the trueboundary layer winds. Second, thedropwindsondes showed that the over-ocean surface-to-mean-boundary-layer-wind ratio reached a minimum at meanboundary layer wind speeds of 100–110 kt.This ratio was found to increase withstronger winds, in contrast to an assumedsteadily decreasing ratio with strongerboundary layer winds previously utilized inH*Wind (Dunion et al. 2003; Powell et al.2003). The combined effect of these two
new changes to H*Wind producessubstantially higher (10%–20%) analyzedmaximum 1-min surface winds for majorhurricanes, particularly when based onreductions of aircraft reconnaissance datafrom 700 mb. For major hurricanes, thenew H*Wind methodology providessurface wind analyses with marine exposurefrom extrapolated flight-level windobservations that generally agree to within5% of the Franklin et al. (2003) estimates.
Such agreement between the twomethods may not be surprising, becausethey are both based upon new formula-tions from the nearly identical sets ofarchived GPS dropwindsonde data. It isworth noting, however, that bothmethodologies had limited data available inthe extreme high-wind range typical of thatfound in Hurricane Andrew’s eyewall,though both schemes includeddropwindsondes from Hurricane Mitchwhen it was a SSHS Category-5 system.Another consideration is that thedropwindsondes had a higher failure rate inproviding winds near the surface underextreme conditions. This limitation waspartially overcome by filling in the profiledown to 10 m with mean conditions fromhurricane eyewall dropwindsondes that didprovide wind data to the ocean’s surface,as long as the filled-in dropwindsondereported winds down to no higher than30 m (Dunion et al. 2003; Franklin et al.2003). This technique to maximize surfacewind observations was likely conservative inits surface wind estimates because of theobserved tendency for the surface winds toincrease relative to the boundary layeraverage winds in higher wind regimes.
SB1This factor is at the high end of the rangeestablished by the dropwindsondes (86%–90%), in part because of simple roundingof the midpoint of this range, but also toaccount for the likelihood that thecyclone’s highest 700-mb wind speed wasnot sampled during the typical “figure 4”tracks routinely flown through hurricanesby reconnaissance aircraft.
1703NOVEMBER 2004AMERICAN METEOROLOGICAL SOCIETY |
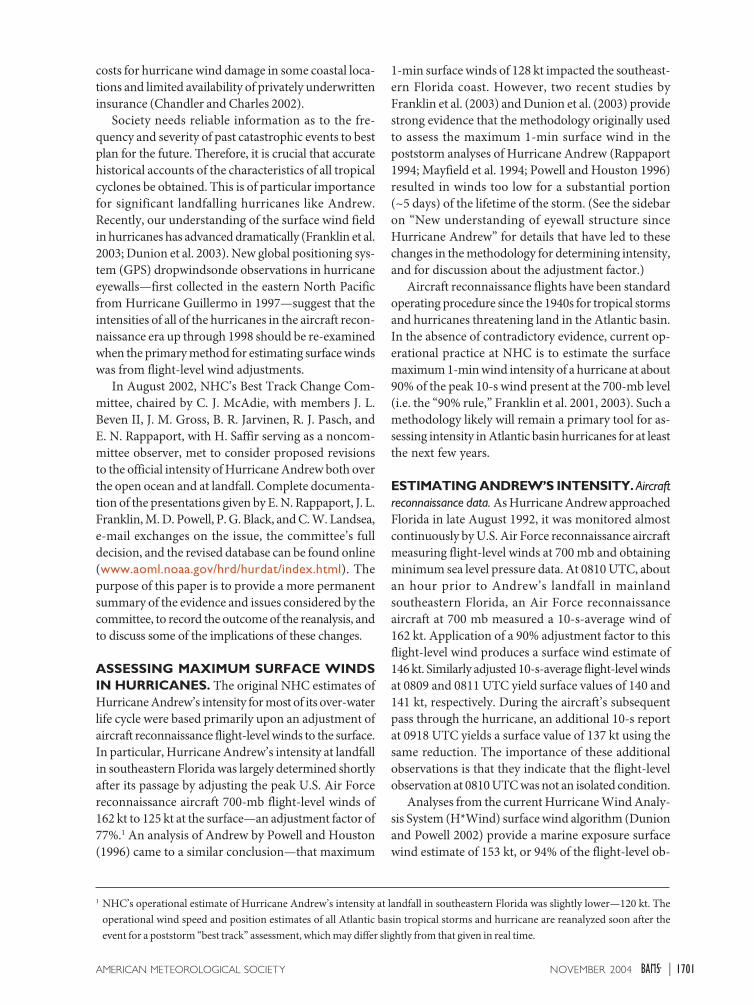
servations from the 0810 UTC reconnaissance data(Fig. 1). This result is in reasonable agreement with therecommended adjustment from the Franklin et al.(2003) methodology.
Assuming that the 162-kt flight-level aircraft windwas representative of the peak 700-mb winds that werepresent in Andrew’s circulation, a surface adjustmentfactor of 77% is required to diagnose Andrew at 125 ktwas originally assessed. Of the 17 hurricanes examinedby Franklin et al. (2003), none were observed with GPSdropwindsondes to have a mean adjustment factor thislow in the eyewall. The lowest observed ratio of 83%was found in Hurricane Bonnie—a weakly convectivestorm with a large eye.2 Furthermore, the adjustmentfactor to provide surface winds appears to increasewhen the boundary layer winds are veryhigh (Dunion et al. 2003; Franklin et al. 2003)and when vertical motions are particularlyvigorous (at least 1.5 m s–1 absolute verticalvelocity between the ocean’s surface to2000 m; Franklin et al. 2003). Andrew likelysatisfied both of these conditions at its land-fall in southeastern Florida. Thus, there islittle evidence from the dropwindsondesdatasets to support Andrew having a lower-than-normal adjustment factor in theeyewall region.
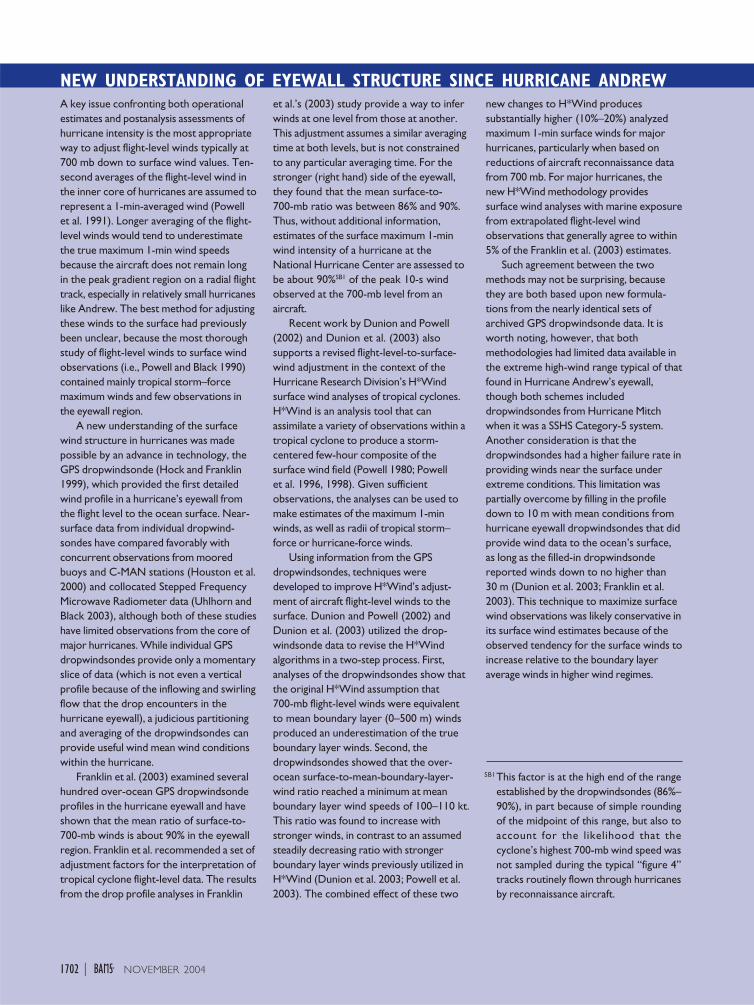
Radar-derived wind vectors. Low-altitude ra-dar feature tracking presented by P. Dodgeto the committee suggested surface windssimilar to those implied by applying a 90%adjustment factor to the flight-level data.Figures 2 and 3 show vectors based onfeature tracking from the Miami, Florida,Weather Surveillance Radar-1957 (WSR-57)outside and within Andrew’s eyewall justprior to landfall in southeastern Florida (seea loop of this radar reflectivity data onlineat www.aoml.noaa.gov/hrd/hurdat/andrew_cells.mpg). This technique hasbeen demonstrated to provide lower-tro-pospheric wind vectors in the circulation ofa hurricane that are comparable to thosemeasured by aircraft. Tuttle and Gall (1999)
reported agreement with 700-mb flight-level winds towithin 10%, though the radar-derived winds have arelatively noisy signal and must be quality controlledbefore use. The three highest feature speeds found inthe Andrew data were 171 kt at 700 m at 0739 UTC,176 kt at 400 m at 0839 UTC, and 180 kt at 1100 m at0730 UTC (Fig. 2), with heights based upon the radartilt and distance from the radar site. The strongest ofthese velocities does not appear consistent with nearbyradar feature tracks. Making the assumption that theaverage of the remaining two observations (174 kt) rep-resents the maximum eyewall winds near the bound-ary layer top (BLT), we can adjust this wind to thesurface using mean dropwindsonde profiles. Applyingthe Franklin et al. (2003) eyewall mean profile for the
FIG. 1. H*Wind 1-min surface wind analysis for Hurricane Andrewat landfall in southeastern Florida around 0900 UTC 24 Aug 1992from the revised methodology of Dunion et al. (2003) and Dunionand Powell (2002), which takes into account the vertical structureof the horizontal winds as demonstrated from recent GPSdropwindsonde data. Winds at the coast show a discontinuity dueto increased roughness length as one goes from over open-oceanconditions to overland open-terrain conditions. Numbers in theupper-left corner indicate quadrant-based radii of 34-, 50-, and 64-kt surface winds.
2 However, hurricanes with stable boundary layersmoving north of the Gulf Stream over cool wa-ters, such as Gloria in 1985 (Powell and Black1990) and Bob in 1991, were analyzed to have sur-face-to-flight-level wind ratios as low as 55%based on buoy observations.
1704 NOVEMBER 2004|
strongest BLT wind speeds in their sample (135–155 kt,their Fig. 12) gives an 82% adjustment factor and a sur-face wind estimate of 143 kt.
The Dunion and Powell (2002) methodology wasalso applied to these new radar-derived wind vectors.Their analysis system suggests that these low-altituderadar feature tracks correspond to winds of 148 kt atthe ocean’s surface, again in close agreement with theestimates from the Franklin et al. (2003) methodology.
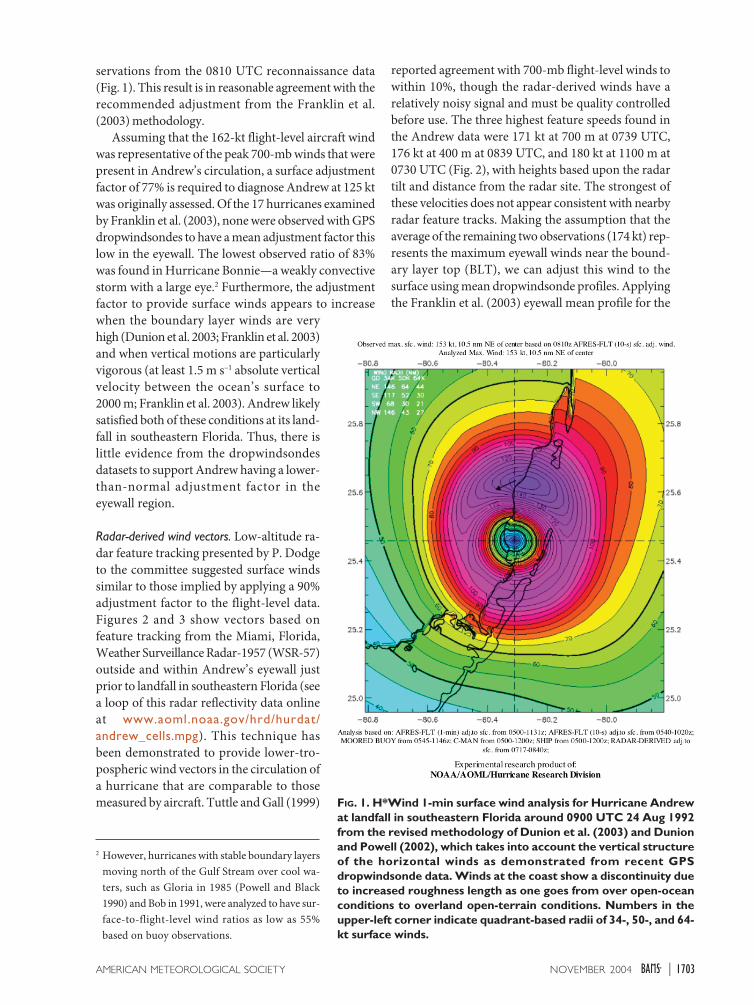
Surface observations. The NHC Best Track ChangeCommittee reviewed the available surface observa-tions from Andrew’s landfall to determine whetherthey were consistent with the dropwindsonde-basedadjustments of flight-level and radar winds discussedin the previous two sections. In particular, they focusedupon two key observations: Fowey Rocks, Florida, andR. Fairbanks (an amateur weather observer located inPerrine, Florida) data (Rappaport 1994; Mayfield et al.1994; Powell et al. 1996). The Fowey Rocks CoastalMarine Automated Network (C-MAN) weather sta-tion (elevation 44 m) reported a peak 2-min mean windof 122 kt at its last hourly transmission before it failedafter 0802 UTC. This adjusts to approximately 111 ktfor a maximum 1-min surface (10 m) wind valid forover open-water exposure. At this station, the windsincreased dramatically in the last hour of reporting.In particular, an 18 kt increase in the 10-min mean windbetween 0749 and 0759 UTC (not shown) in conjunc-
tion with the location of the station relative toAndrew’s eyewall (Fig. 3) provides strong evidence thatthe surface winds at that location had not yet leveledoff and would likely have continued to increase to sub-stantially higher values had it survived for at least afew more minutes. [Typically, the surface radius ofmaximum wind occurs at the inner edge of the eyewallor even just inside the eye when viewed by radar inthe lower troposphere (Marks et al. 1992).] Basedupon the position of the Fowey Rocks station, themovement of Hurricane Andrew, and an estimate ofthe surface radius of maximum wind for that portionof the storm, it is calculated by J. Beven that the sta-tion would likely have encountered the peak winds inthe northern eyewall at about 0820 UTC, about 20 minafter its final report. Assuming a linear increase ofwinds during this time (a conservative estimate), thepeak 10-min mean station wind may have reached145 kt. After adjusting for both station height and av-eraging period, this converts to approximately 148 ktfor a maximum 1-min surface (10 m) wind valid forover open-water exposure.
R. Fairbanks noted a peak gust of 184 kt (correctedto 154 kt after adjusting for the overestimation bias of
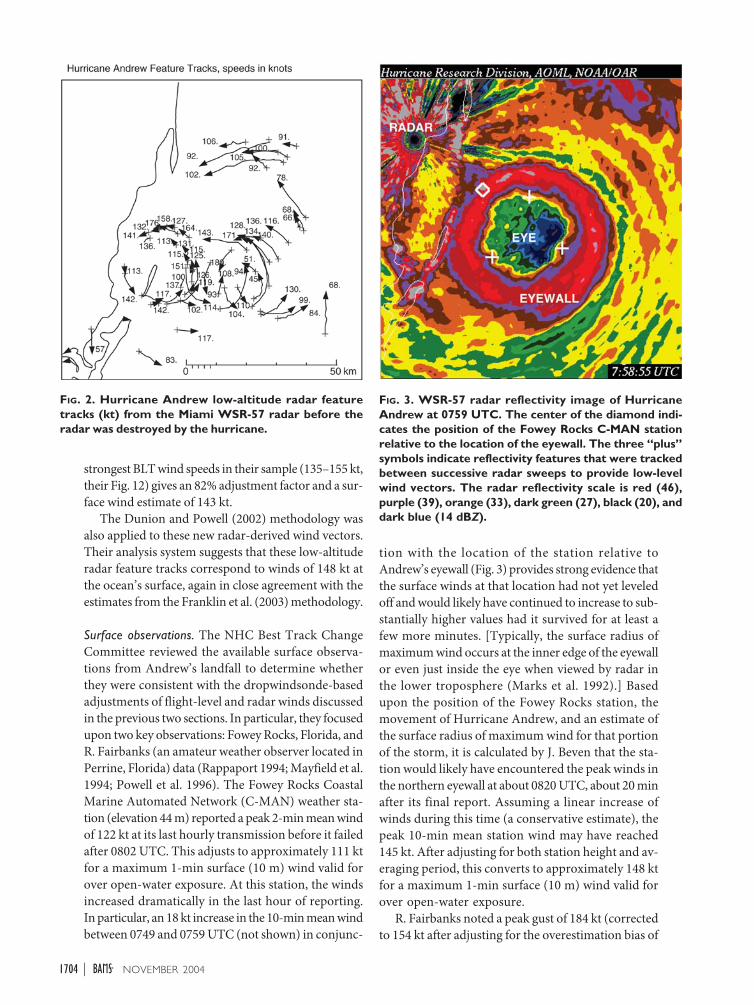
FIG. 2. Hurricane Andrew low-altitude radar featuretracks (kt) from the Miami WSR-57 radar before theradar was destroyed by the hurricane.
FIG. 3. WSR-57 radar reflectivity image of HurricaneAndrew at 0759 UTC. The center of the diamond indi-cates the position of the Fowey Rocks C-MAN stationrelative to the location of the eyewall. The three “plus”symbols indicate reflectivity features that were trackedbetween successive radar sweeps to provide low-levelwind vectors. The radar reflectivity scale is red (46),purple (39), orange (33), dark green (27), black (20), anddark blue (14 dBZ).
1705NOVEMBER 2004AMERICAN METEOROLOGICAL SOCIETY |
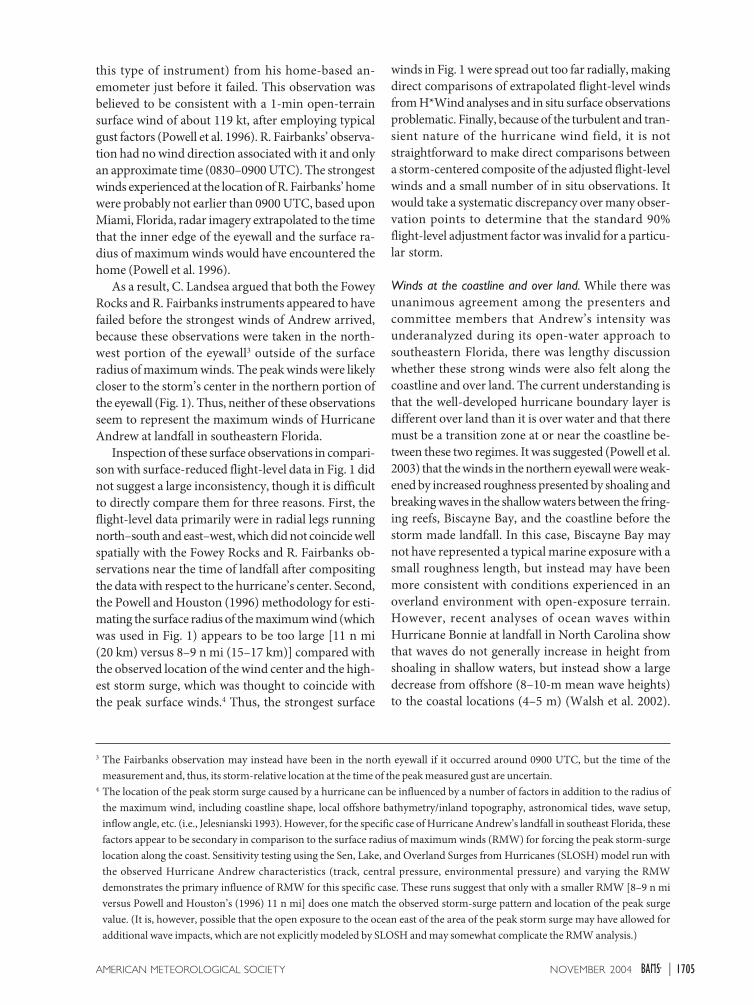
this type of instrument) from his home-based an-emometer just before it failed. This observation wasbelieved to be consistent with a 1-min open-terrainsurface wind of about 119 kt, after employing typicalgust factors (Powell et al. 1996). R. Fairbanks’ observa-tion had no wind direction associated with it and onlyan approximate time (0830–0900 UTC). The strongestwinds experienced at the location of R. Fairbanks’ homewere probably not earlier than 0900 UTC, based uponMiami, Florida, radar imagery extrapolated to the timethat the inner edge of the eyewall and the surface ra-dius of maximum winds would have encountered thehome (Powell et al. 1996).
As a result, C. Landsea argued that both the FoweyRocks and R. Fairbanks instruments appeared to havefailed before the strongest winds of Andrew arrived,because these observations were taken in the north-west portion of the eyewall3 outside of the surfaceradius of maximum winds. The peak winds were likelycloser to the storm’s center in the northern portion ofthe eyewall (Fig. 1). Thus, neither of these observationsseem to represent the maximum winds of HurricaneAndrew at landfall in southeastern Florida.
Inspection of these surface observations in compari-son with surface-reduced flight-level data in Fig. 1 didnot suggest a large inconsistency, though it is difficultto directly compare them for three reasons. First, theflight-level data primarily were in radial legs runningnorth–south and east–west, which did not coincide wellspatially with the Fowey Rocks and R. Fairbanks ob-servations near the time of landfall after compositingthe data with respect to the hurricane’s center. Second,the Powell and Houston (1996) methodology for esti-mating the surface radius of the maximum wind (whichwas used in Fig. 1) appears to be too large [11 n mi(20 km) versus 8–9 n mi (15–17 km)] compared withthe observed location of the wind center and the high-est storm surge, which was thought to coincide withthe peak surface winds.4 Thus, the strongest surface
winds in Fig. 1 were spread out too far radially, makingdirect comparisons of extrapolated flight-level windsfrom H*Wind analyses and in situ surface observationsproblematic. Finally, because of the turbulent and tran-sient nature of the hurricane wind field, it is notstraightforward to make direct comparisons betweena storm-centered composite of the adjusted flight-levelwinds and a small number of in situ observations. Itwould take a systematic discrepancy over many obser-vation points to determine that the standard 90%flight-level adjustment factor was invalid for a particu-lar storm.
Winds at the coastline and over land. While there wasunanimous agreement among the presenters andcommittee members that Andrew’s intensity wasunderanalyzed during its open-water approach tosoutheastern Florida, there was lengthy discussionwhether these strong winds were also felt along thecoastline and over land. The current understanding isthat the well-developed hurricane boundary layer isdifferent over land than it is over water and that theremust be a transition zone at or near the coastline be-tween these two regimes. It was suggested (Powell et al.2003) that the winds in the northern eyewall were weak-ened by increased roughness presented by shoaling andbreaking waves in the shallow waters between the fring-ing reefs, Biscayne Bay, and the coastline before thestorm made landfall. In this case, Biscayne Bay maynot have represented a typical marine exposure with asmall roughness length, but instead may have beenmore consistent with conditions experienced in anoverland environment with open-exposure terrain.However, recent analyses of ocean waves withinHurricane Bonnie at landfall in North Carolina showthat waves do not generally increase in height fromshoaling in shallow waters, but instead show a largedecrease from offshore (8–10-m mean wave heights)to the coastal locations (4–5 m) (Walsh et al. 2002).
3 The Fairbanks observation may instead have been in the north eyewall if it occurred around 0900 UTC, but the time of themeasurement and, thus, its storm-relative location at the time of the peak measured gust are uncertain.
4 The location of the peak storm surge caused by a hurricane can be influenced by a number of factors in addition to the radius ofthe maximum wind, including coastline shape, local offshore bathymetry/inland topography, astronomical tides, wave setup,inflow angle, etc. (i.e., Jelesnianski 1993). However, for the specific case of Hurricane Andrew’s landfall in southeast Florida, thesefactors appear to be secondary in comparison to the surface radius of maximum winds (RMW) for forcing the peak storm-surgelocation along the coast. Sensitivity testing using the Sen, Lake, and Overland Surges from Hurricanes (SLOSH) model run withthe observed Hurricane Andrew characteristics (track, central pressure, environmental pressure) and varying the RMWdemonstrates the primary influence of RMW for this specific case. These runs suggest that only with a smaller RMW [8–9 n miversus Powell and Houston’s (1996) 11 n mi] does one match the observed storm-surge pattern and location of the peak surgevalue. (It is, however, possible that the open exposure to the ocean east of the area of the peak storm surge may have allowed foradditional wave impacts, which are not explicitly modeled by SLOSH and may somewhat complicate the RMW analysis.)
1706 NOVEMBER 2004|
While the bathymetry of the waters offshore of southFlorida where Andrew hit is somewhat different fromNorth Carolina, if such decreased wave heights didoccur, it is not clear what these would imply when com-bined with breaking waves for changes to the roughnesslength relative to the open ocean.
J. Franklin presented the committee with an analy-sis of available GPS dropwindsondes near shore (within10 km) and offshore (10–60 km) in the right eyewall ofhurricanes making landfall in the United States. Thispreliminary study suggested that there could be somereduction in surface winds along the immediate coastalwaters. A very limited sample of 19 dropwinsondes inthe eyewalls of weak to moderate hurricanes shows anapparent 5%–10% reduction of surface wind as thecoastline is approached. Using this alteration to theFranklin et al. (2003) surface wind methodology givesmaximum 1-min winds at the coast of roughly 130 to140 kt. However, given the extremely small sample ofdropwindsondes (i.e., 10 near shore and 9 just offshore)and lack of any major hurricanes in this coastal analy-sis, such results were considered by the Best TrackChange Committee to be too speculative to be appliedat this time.5 Clearly, more dropwindsonde data areneeded both in the transition zone between land andwater, as well as in the hurricane boundary layer overland, to properly assess the degree to which a hurricane’ssurface winds over open water reach the coastline.
Other evidence for Andrew’s intensity.While the primary pieces of evi-dence for altering HurricaneAndrew’s intensity came from re-vised extrapolations of flight-levelwinds and radar feature track data,other information on the intensitywas also available and consideredin the reanalysis. These were thecontinued central pressure dropafter the measurement of the peakaircraft wind report, pressure–wind relationships, surface pres-sure gradients, high-altitude radarreflectivity eyewall core velocities
from the WSR-57 radar in Tampa, satellite intensityestimates, storm-surge modeling runs, and surveys ofwind-caused damage. These measures (discussion ofthese parameters can be found online at www.aoml.noaa.gov/hrd/hurdat/index.html) were mainly consis-tent with the revised surface wind estimates discussedin earlier sections, though they were of secondary im-portance to the final NHC Best Track Change Com-mittee decision.
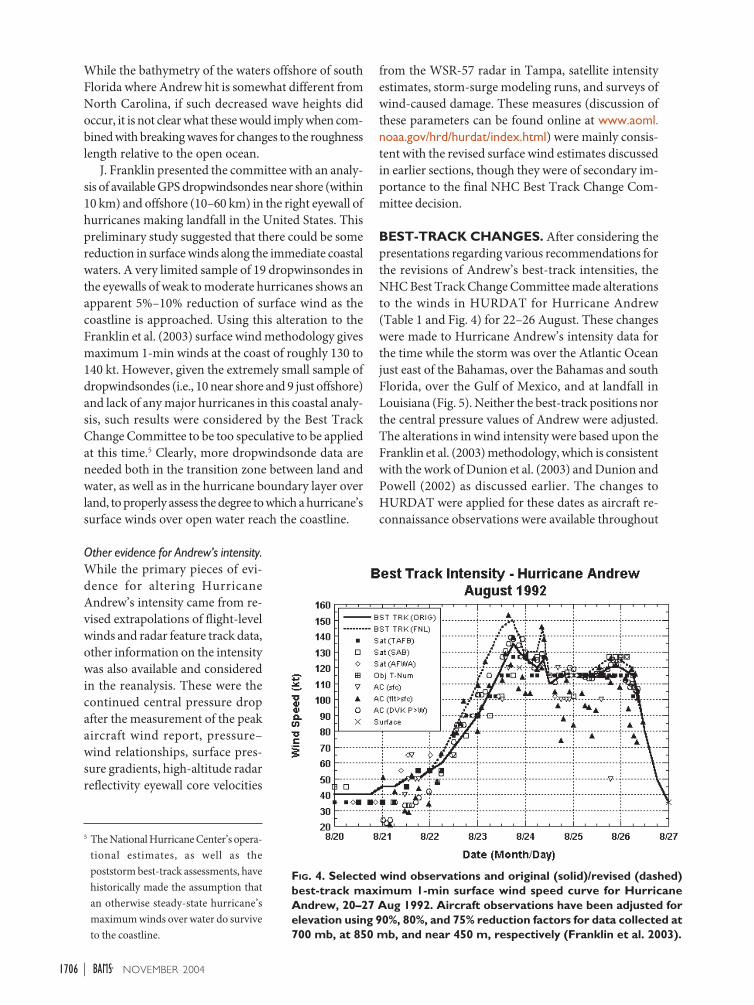
BEST-TRACK CHANGES. After considering thepresentations regarding various recommendations forthe revisions of Andrew’s best-track intensities, theNHC Best Track Change Committee made alterationsto the winds in HURDAT for Hurricane Andrew(Table 1 and Fig. 4) for 22–26 August. These changeswere made to Hurricane Andrew’s intensity data forthe time while the storm was over the Atlantic Oceanjust east of the Bahamas, over the Bahamas and southFlorida, over the Gulf of Mexico, and at landfall inLouisiana (Fig. 5). Neither the best-track positions northe central pressure values of Andrew were adjusted.The alterations in wind intensity were based upon theFranklin et al. (2003) methodology, which is consistentwith the work of Dunion et al. (2003) and Dunion andPowell (2002) as discussed earlier. The changes toHURDAT were applied for these dates as aircraft re-connaissance observations were available throughout
5 The National Hurricane Center’s opera-tional estimates, as well as thepoststorm best-track assessments, havehistorically made the assumption thatan otherwise steady-state hurricane’smaximum winds over water do surviveto the coastline.
FIG. 4. Selected wind observations and original (solid)/revised (dashed)best-track maximum 1-min surface wind speed curve for HurricaneAndrew, 20–27 Aug 1992. Aircraft observations have been adjusted forelevation using 90%, 80%, and 75% reduction factors for data collected at700 mb, at 850 mb, and near 450 m, respectively (Franklin et al. 2003).
1707NOVEMBER 2004AMERICAN METEOROLOGICAL SOCIETY |
16/180017/000017/060017/120017/180018/000018/060018/120018/180019/000019/060019/120019/180020/000020/060020/120020/180021/000021/060021/120021/180022/000022/060022/120022/180023/000023/060023/120023/180024/000024/060024/120024/180025/000025/060025/120025/180026/000026/060026/120026/180027/000027/060027/120027/180028/000028/0600
10.811.211.712.313.113.614.114.615.416.317.218.018.819.820.721.722.523.223.924.424.825.325.625.825.725.625.525.425.425.425.425.625.826.226.627.227.828.529.230.130.931.532.132.833.634.435.4
1010100910081006100310021001100010001001100210051007101110131015101410141010100710041000
994981969961947933922930937951947943948946941937955973991995997998999
10001000
Tropical depression““
Tropical storm““““““““““““““““““
Hurricane“““““““““““““““““
Tropical storm“
Tropical depression““““
25303035354045454545454545404040404545505055
65 (60)80 (70)95 (80)
110 (90)130 (105)145 (120)150 (135)
125130 (120)115 (110)
115115115
120 (115)125 (120)125(120)120 (115)
8050353030252020
35.537.439.642.044.246.248.049.951.853.555.356.958.359.360.060.761.562.463.364.264.965.967.068.369.771.172.574.275.877.579.381.283.185.086.788.289.690.591.391.791.691.190.589.688.486.784.0
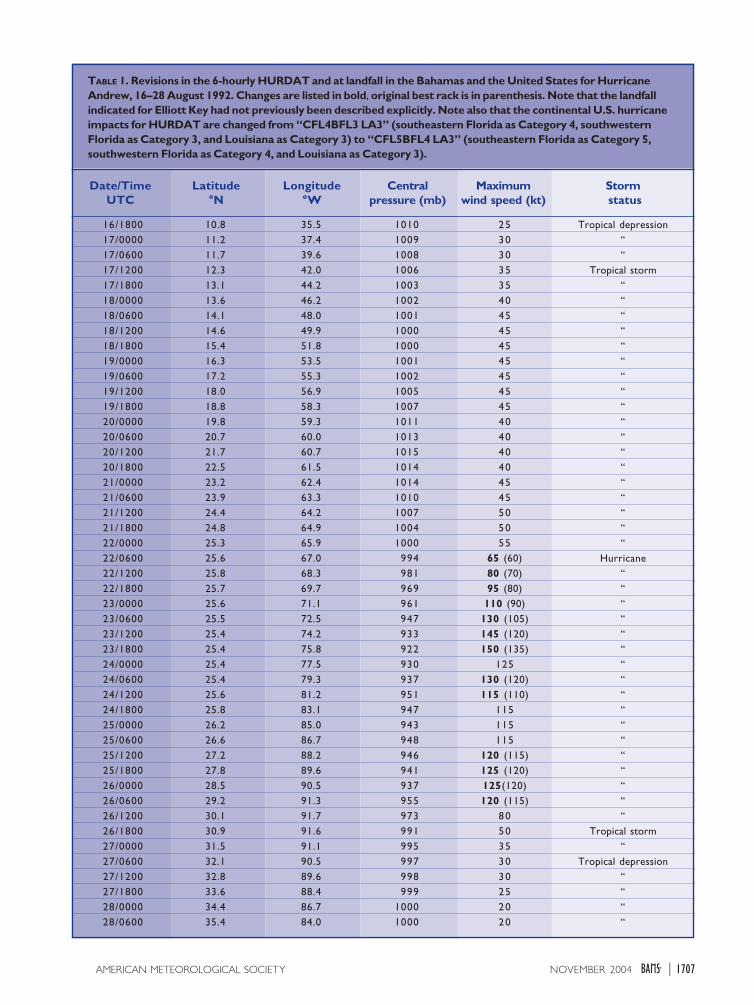
TABLE 1. Revisions in the 6-hourly HURDAT and at landfall in the Bahamas and the United States for HurricaneAndrew, 16–28 August 1992. Changes are listed in bold, original best rack is in parenthesis. Note that the landfallindicated for Elliott Key had not previously been described explicitly. Note also that the continental U.S. hurricaneimpacts for HURDAT are changed from “CFL4BFL3 LA3” (southeastern Florida as Category 4, southwesternFlorida as Category 3, and Louisiana as Category 3) to “CFL5BFL4 LA3” (southeastern Florida as Category 5,southwestern Florida as Category 4, and Louisiana as Category 3).
Date/TimeUTC
Latitude°N
Longitude°W
Centralpressure (mb)
Maximumwind speed (kt)
Storm status
1708 NOVEMBER 2004|
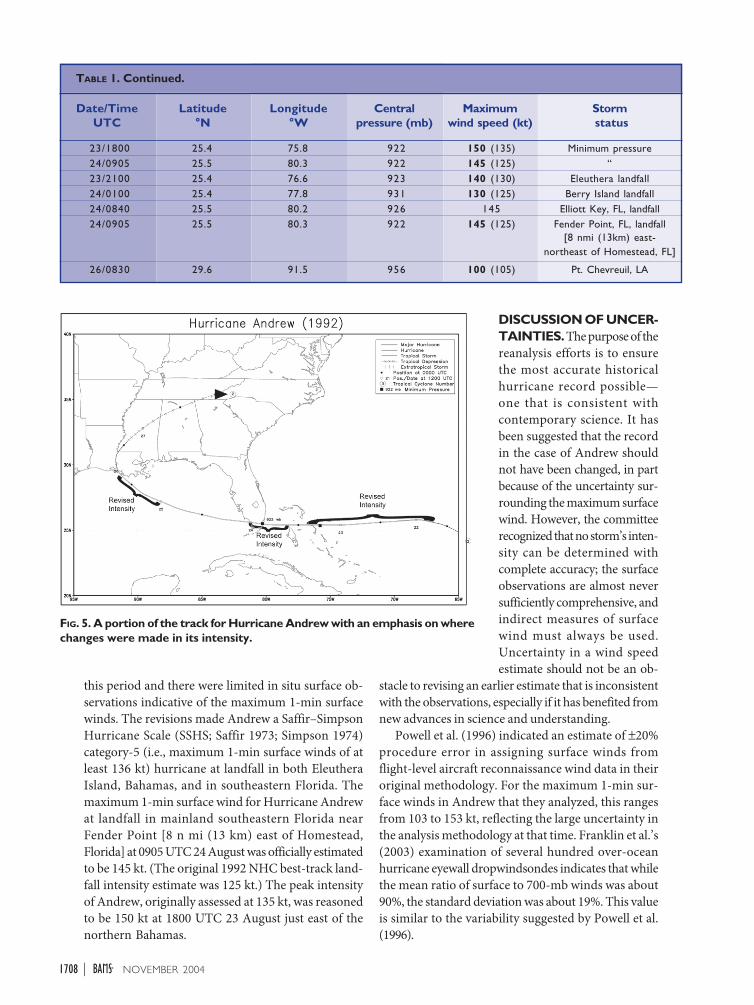
this period and there were limited in situ surface ob-servations indicative of the maximum 1-min surfacewinds. The revisions made Andrew a Saffir–SimpsonHurricane Scale (SSHS; Saffir 1973; Simpson 1974)category-5 (i.e., maximum 1-min surface winds of atleast 136 kt) hurricane at landfall in both EleutheraIsland, Bahamas, and in southeastern Florida. Themaximum 1-min surface wind for Hurricane Andrewat landfall in mainland southeastern Florida nearFender Point [8 n mi (13 km) east of Homestead,Florida] at 0905 UTC 24 August was officially estimatedto be 145 kt. (The original 1992 NHC best-track land-fall intensity estimate was 125 kt.) The peak intensityof Andrew, originally assessed at 135 kt, was reasonedto be 150 kt at 1800 UTC 23 August just east of thenorthern Bahamas.
DISCUSSION OF UNCER-TAINTIES. The purpose of thereanalysis efforts is to ensurethe most accurate historicalhurricane record possible—one that is consistent withcontemporary science. It hasbeen suggested that the recordin the case of Andrew shouldnot have been changed, in partbecause of the uncertainty sur-rounding the maximum surfacewind. However, the committeerecognized that no storm’s inten-sity can be determined withcomplete accuracy; the surfaceobservations are almost neversufficiently comprehensive, andindirect measures of surfacewind must always be used.Uncertainty in a wind speedestimate should not be an ob-
stacle to revising an earlier estimate that is inconsistentwith the observations, especially if it has benefited fromnew advances in science and understanding.
Powell et al. (1996) indicated an estimate of ±20%procedure error in assigning surface winds fromflight-level aircraft reconnaissance wind data in theiroriginal methodology. For the maximum 1-min sur-face winds in Andrew that they analyzed, this rangesfrom 103 to 153 kt, reflecting the large uncertainty inthe analysis methodology at that time. Franklin et al.’s(2003) examination of several hundred over-oceanhurricane eyewall dropwindsondes indicates that whilethe mean ratio of surface to 700-mb winds was about90%, the standard deviation was about 19%. This valueis similar to the variability suggested by Powell et al.(1996).
23/180024/090523/210024/010024/084024/0905
26/0830
25.425.525.425.425.525.5
29.6
922922923931926922
956
Minimum pressure“
Eleuthera landfallBerry Island landfall
Elliott Key, FL, landfallFender Point, FL, landfall
[8 nmi (13km) east-northeast of Homestead, FL]
Pt. Chevreuil, LA
150 (135)145 (125)140 (130)130 (125)
145145 (125)
100 (105)
75.880.376.677.880.280.3
91.5
Date/TimeUTC
Latitude°N
Longitude°W
Centralpressure (mb)
Maximumwind speed (kt)
Storm status
TABLE 1. Continued.
FIG. 5. A portion of the track for Hurricane Andrew with an emphasis on wherechanges were made in its intensity.
1709NOVEMBER 2004AMERICAN METEOROLOGICAL SOCIETY |
However, this does not mean that the uncertaintyin estimating peak surface winds from flight-level datais necessarily about 20%. It is important to distinguishbetween the following two questions: 1) given a windobservation taken at 700 mb somewhere in the hurri-cane eyewall, what is the underlying concurrent windat the surface; and 2) given a storm’s maximum windat 700 mb, what is the storm’s maximum sustained windat the surface? The 19% standard deviation is directlyapplicable only to the first question posed above. Thisvariance is not appropriate for estimating the variabil-ity in the ratio of the storm’s maximum surface tomaximum 700-mb winds. The variance of the latterquantity is not known, but should be less than 19%, asillustrated by the following example.
Imagine a steady-state storm in which the maxi-mum 1-min wind at the surface is 90 kt, while the maxi-mum 1-min wind at 700 mb is 100 kt. Over time, theprecise location of the maxima at both the surface and700 mb may vary, but the peak values present at eachlevel remain constant. By assumption, the variance ofpeak surface to peak 700-mb wind is zero. Even so, ifthe eyewall of this storm was to be sampled by GPSdropwindsondes, the dropwindsonde surface-to-700-mb-wind ratio would still have a large variance,because a) the wind distributions are not necessarilythe same at the two levels, so a dropwindsonde thatsamples the maximum at 700 mb will not necessarilysample the surface maximum, and vice versa; andb) the dropwindsondes do not measure a 1-min wind,but measure whatever turbulence through which theyhappen to fall during a 0.5-s interval. These factorscontribute to the high variance in adjustment-factorratios computed from individual dropwindsondes, butit has very little to do with the relationship betweenpeak winds from level to level. While a precise mea-sure of the procedure error in applying the 90% rulemay not be obtainable currently, mean eyewall pro-files from different storms (Franklin et al. 2003) suggestthat it may be near 10% (i.e., that the actual surface windto 700-mb-flight-level ratio for Hurricane Andrewwould have been between about 80% and 100%).
It is acknowledged that the reanalysis presentedhere of Andrew’s intensity at landfall in southeasternFlorida (and elsewhere in its lifetime) is not known withexact certainty, nor will it ever be. However, it is con-cluded here that Hurricane Andrew’s intensity is verylikely to be in the range of 136–155 kt for the maxi-mum 1-min surface winds that impacted the coast atlandfall in mainland southeastern Florida, with a bestsingle estimate of 145 kt. It is quite unlikely that Andrewwas a 125-kt hurricane at landfall (category 4) as wasoriginally thought, consistent with the uncertainty dis-
cussion above. It should be noted that these category-5 conditions likely occurred on land only in a small re-gion in south Dade County, Florida, close to the coastin Cutler Ridge. Most of the region in the country southof Kendall Drive (25.7°N) received category-4 or cat-egory-3 hurricane conditions. Peak gusts over oceanicconditions and over land were likely to be on the orderof 160–170 kt, based upon typical gust factors utilized(e.g., Powell and Houston 1996). (See the sidebar on“Implications of Hurricane Andrew’s reanalysis in theUnited States.”)
While this reanalysis does not preclude revisitingHurricane Andrew’s intensity in the future if needed, itis the official estimate at this time. We are working withinthe bounds of the state of the science to interpret sur-face wind conditions in hurricanes. The violent inner coreof major hurricanes has always been an area with a dearthof in situ measurements of the peak winds. Numerousuncertainties remain (e.g., how representative was the162-kt flight-level winds of the peak winds in Andrewat 700 mb?; how much intensification to Andrew’s windfield occurred after the reconnaissance plane left thenorth eyewall?; how are surface winds in hurricanesaltered in general at the ocean–coast interface?; howmay further stratifications to the dropwindsonde dataprovide better surface wind estimates for various rightversus left asymmetries and flight-level wind speed,convective, or stability regimes?). Continued data col-lection and research are strongly encouraged to helpclarify these important issues. However, it is realizedthat despite progress in scientific uncertainties, the exactwind speeds caused by Hurricane Andrew in south-eastern Florida and elsewhere will never be knownwith complete accuracy and confidence.
SUMMARY.• Hurricane Andrew in 1992 originally was assessed
to have reached a peak intensity and Bahamian/U.S.landfall intensity of SSHS category 4, based prima-rily upon adjustment of flight-level winds to thesurface.
• Research using GPS dropwindsondes in the late1990s and early 2000s has demonstrated that stron-ger winds exist at the surface in the hurricane eyewallthan originally had been believed.
• A reanalysis of Hurricane Andrew’s intensity,considering this new understanding, indicates thatAndrew’s maximum 1-min surface winds for muchof its lifetime were substantially stronger than wasanalyzed earlier. In particular, Hurricane Andrewis now estimated to have reached category-5 statusat its landfall in both the northern Bahamas and insoutheastern Florida.
1710 NOVEMBER 2004|
• Continued research is needed to better understandthe surface winds in strong hurricanes in a varietyof differing environmental conditions and at theocean–coast boundary, in particular.
• Because of this reclassification, the return period ofcatastrophic hurricanes like Andrew increases fromabout 15 to at least 50 yr for south Florida. Thus,the risk from Andrew-like hurricanes at thatlocation is significantly less than previously had beenestimated.
ACKNOWLEDGMENTS. The first author acknowledgesthe support of NOAA NASA Grant GC02-093—The AtlanticHurricane Database (HURDAT) reanalysis project. The
authors wish to thank Mike Black and Krystal Valde for theircontributions toward better understanding of the hurricane’sviolent inner-core wind structure. Additional thanks go toPete Black and Mark Powell for their presentations of surfacepressure gradients/surveys of wind-caused damage andsurface wind estimation, respectively, for the NHC BestTrack Change Committee’s deliberations. LenworthWoolcock provided support for both figure preparation aswell as Web site development and maintenance. Kindsuggestions and recommendations for this reanalysis andpaper were also provided by several additional people: WilliamBredemeyer, Steve Feuer, John Gamache, Paul Hebert, JeffKepert, Paul Leighton, Charlie Neumann, and HughWilloughby.
One example of a practical aspect of theoutcome of Andrew’s reanalysis is thepotential impact on building codes andinsurance rates. Previously, HurricaneAndrew was estimated to be a SSHScategory-4 hurricane at landfall in southFlorida (comprising Pinellas,Hillsborough, Manatee, Sarasota,Charlotte, Lee, Collier, Monroe,Miami–Dade, Broward, Palm Beach,Martin, St. Lucie, Indian River, andBrevard counties). During the twenti-eth century, there are relativelycomplete records for this region(Landsea et al. 2004). Prior toAndrew’s reclassification, six category-4 and one category-5 hurricanes strucksoutheastern Florida: the 1919 KeyWest hurricane, the 1926 Great Miamihurricane, the 1928 Lake Okeechobeehurricane, the 1935 Labor Day(category 5) hurricane, the 1947Broward hurricane, 1960’s HurricaneDonna in the Florida Keys, andHurricane Andrew (updated fromJarrell et al. 1992). This gave an averagereturn period for “Andrew like”hurricanes (i.e., category 4 or 5) ofabout 15 yr for the south Floridaregion, though these occur ratherunevenly in time during the twentiethcentury. However, with Andrew beingreclassified as a category 5, it becomesone of two such tropical cyclones tostrike the area in 100 yr. Thus, thereturn period is equal to or greaterthan 50 yr for a direct strike on theregion by an Andrew-type hurricane(now upgraded to category 5).
This conclusion may be somewhatcounterintuitive at first, but is moreunderstandable if one puts Andrew intocontext with the other catastrophicsouth Florida hurricanes of thetwentieth century. Previously, withAndrew considered a category-5hurricane at landfall, it was consideredas a strong as, and roughly as damagingas, the 1919, 1926, 1928, 1947, and1960 hurricanes. But elevating Hurri-cane Andrew to a category 5 means thatit is unlikely that these other fivecategory-4 hurricanes could cause thesame type of extreme destruction thatthe 1992 hurricane caused, if thesesystems were to hit today’s southeastFlorida. It is noted though that the1926, 1928, and 1947 hurricanes weresubstantially larger in size than 1992’sAndrew, so that they might cause morewidespread, though locally less severe,damages if they were to hit today.[Moreover, it appears unlikely that anyof these five remaining category-4hurricanes that struck south Floridawill be reanalyzed at a higher categorybased upon Dunion et al. (2003) andother preliminary assessments.] Thus,the new classification alters theassessed odds of having an Andrew-likehurricane impact from being anuncommon occurrence to a rare event.
This rough assessment agrees withspecific calculations from the HurricaneRisk (HURISK) analysis program(Neumann 1987). This programsynthesizes information from the entireHURDAT database to provide detailed
statistics for more localized regions,including average return periods forvarious thresholds of wind speeds ofinterest. For the original and revisedassessed intensities of Andrew atlandfall, the return periods for variousintensity hurricanes passing within50 n mi (93 km) are quite different:36 yr at ≥≥≥≥≥125 kt (original Andrew best-track intensity) and 82 yr at ≥≥≥≥≥145 kt(revised Andrew best-track intensity).However, the return periods forvarious wind speed thresholds do notthemselves change significantly nearMiami–Dade County, with the alter-ation of one data point (i.e., Andrew’sestimated intensity), as one wouldexpect from a large database of over100 yr of tropical storms and hurri-canes to impact this region.
For the public, government agencies,insurance companies, wind engineers,building code designers, and othersinterested in the return period ofextremely devastating hurricanes, thecategory assigned is quite important.The implication of the above calcula-tions is that originally an Andrew-likeimpact could be expected about every35 yr in Miami–Dade County (every15 yr for all of south Florida), while thereclassification means that an Andrew-like event is now expected to strikeMiami–Dade County about once in80 yr (every 50 yr for all of southFlorida). Such information should be ofuse for those involved with long-rangeplanning for the region.
IMPLICATIONS OF HURRICANE ANDREW’S REANALYSIS IN SOUTH FLORIDA
1711NOVEMBER 2004AMERICAN METEOROLOGICAL SOCIETY |
REFERENCESChandler, M., and J. Charles, 2002: Hurricane insurance
stirring a fight. The Miami Herald, 19 February, sec.A, morning edition.
DeMaria, M., and J. Kaplan, 1999: An updatedStatistical Hurricane Intensity Prediction Scheme(SHIPS) for the Atlantic and eastern North Pacificbasins. Wea. Forecasting, 14, 326–337.
Dunion, J. P., and M. D. Powell, 2002: Improvementsto the NOAA Hurricane Research Division’s surfacereduction algorithm for inner core aircraft flight-level winds. Preprints, 25th Conf. on Hurricanes andTropical Meteorology, San Diego, CA, Amer. Meteor.Soc., 581–582.
——, C. W. Landsea, S. H. Houston, and M. D. Powell,2003: A reanalysis of the surface winds forHurricane Donnna of 1960. Mon. Wea. Rev., 131,1992–2001.
Fernández-Partagas, J., and H. F. Diaz, 1996: Atlantichurricanes in the second half of the nineteenthcentury. Bull. Amer. Meteor. Soc., 77, 2899–2906.
Franklin, J. L., L. A. Avila, J. L. Beven, M. B. Lawrence,R. J. Pasch, and S. R. Stewart, 2001: Atlantichurricane season of 2000. Mon. Wea. Rev., 129,3037–3056.
——, M. L. Black, and K. Valde, 2003: GPSdropwindsonde wind profiles in hurricanes and theiroperational implications. Wea. Forecasting, 18, 32–44.
Hock, T. R., and J. L. Franklin, 1999: The NCAR GPSdropwindsonde. Bull. Amer. Meteor. Soc., 80, 407–420.
Houston, S. H., P. P. Dodge, M. D. Powell, M. L. Black,G. M. Barnes, and P. S. Chu, 2000: Surface winds inhurricanes from GPS-sondes: Comparisons withobservations. Preprints, 24th Conf. on Hurricanesand Tropical Meteorology, Ft. Lauderdale, FL, Amer.Meteor. Soc., 339.
Jarrell, J. D., P. J. Hebert, and M. Mayfield, 1992:Hurricane experience levels of coastal countypopulations from Texas to Maine. NOAA Tech.Memo. NWS NHC 46, 152 pp.
Jarvinen, B. R., C. J. Neumann, and M. A. S. Davis, 1984:A tropical cyclone data tape for the North AtlanticBasin, 1886-1983: Contents, limitations, and uses.NOAA Tech. Memo. NWS NHC 22, 21 pp.
Jeslesnianski, C. P., 1993: The habitation layer. GlobalGuide to Tropical Cyclone Forecasting, WorldMeteorological Organization Tech. Doc. 560 4.1–4.29.
Landsea, C. W., 1993: A climatology of intense (ormajor) Atlantic hurricanes. Mon. Wea. Rev., 121,1703–1713.
——, and Coauthors, 2004: The Atlantic hurricanedatabase re-analysis project: Documentation forthe 1851-1910 alterations and additions to theHURDAT database. Hurricanes and Typhoons: Past,Present and Future, R. J. Murnane and K.-B. Liu,Eds., Columbia University Press, in press.
Marks, F. D., R. A. Houze Jr., and J. F. Gamache, 1992:Dual-aircraft investigation of the inner core ofHurricane Norbert. Part I: Kinematic structure. J.Atmos. Sci., 49, 919–942.
Mayfield, M., L. Avila, and E. N. Rappaport, 1994:Atlantic hurricane season of 1992. Mon. Wea. Rev.,122, 517–538.
McAdie, C. J., and M. B. Lawrence, 2000: Improvementsin tropical cyclone track forecasting in the Atlanticbasin, 1970–98. Bull. Amer. Meteor. Soc., 81, 989–998.
Neumann, C. J., 1987: The National Hurricane CenterRisk Analysis Program (HURISK). NOAA Tech.Memo. NWS NHC 38, 56 pp.
——, 1994: An update to the National Hurricane Center“Track Book.” Minutes of the 48th InterdepartmentalConf., Miami, FL, NOAA Office of FederalCoordinator for Meteorological Services andSupporting Research, A-47–A-53.
Powell, M. D., 1980: Evaluations of diagnostic marineboundary layer models applied to hurricanes. Mon.Wea. Rev., 108, 757–766.
——, and P. G. Black, 1990: The relationship of hurricanereconnaissance flight-level measurements to windsmeasured by NOAA’s oceanic platforms. J. WindEng. Ind. Aerodyn., 36, 381–392.
——, and S. H. Houston, 1996: Hurricane Andrew’slandfall in South Florida. Part II: Surface wind fieldsand potential real-time applications. Wea.Forecasting, 11, 329–349.
——, P. P. Dodge, and M. L. Black, 1991: The landfall ofHurricane Hugo in the Carolinas: Surface winddistribution. Wea. Forecasting, 6, 379–399.
——, S. H. Houston, and T. A. Reinhold, 1996: Hurri-cane Andrew’s landfall in South Florida. Part I:Standardizing measurements for documentation ofsurface wind fields. Wea. Forecasting, 11, 304–328.
——, ——, L. R. Amat, and N. Morisseau-Leroy, 1998:The HRD real-time surface wind analysis system. J.Wind Eng. Indust. Aerodyn., 77–78, 53–64.
——, P. J. Vickery, and T. A. Reinhold, 2003: Reduceddrag-coefficient for high wind speeds in tropicalcyclones. Nature, 422, 279–283.
Rappaport, E. N., 1994: Hurricane Andrew. Weather,49, 51–61.
Saffir, H. S., 1973: Hurricane wind and storm surge. Mil.Eng., 423, 4–5.
1712 NOVEMBER 2004|
Simpson, R. H., 1974: The hurricanedisaster potential scale.Weatherwise, 27, 169, 186.
Tuttle, J., and R. Gall, 1999: A single-radar technique for estimatingthe winds in tropical cyclones.Bull. Amer. Meteor. Soc., 80, 653–668.
Ulhorn, E. W., and P. G. Black, 2003:Verification of remotely sensedsea surface winds in hurricanes.J. Atmos. Oceanic Technol., 20,99–116.
Walsh, E. J., and Coauthors, 2002:Hurricane directional wavespectrum spatial variation atlandfall. J. Phys. Oceanogr., 32,1667–1684.