Embed Size (px)
Citation preview
A report by WorldatWork
and MercerJuly 2010
Total Rewards Implementation and Integration
rese
arch
Contact:
WorldatWork Customer Relations
14040 N. Northsight Blvd.
Scottsdale, Arizona USA
85260-3601
Toll free: 877-951-9191
Fax: 480-483-8352
WorldatWork and MercerTotal Rewards Implementation and Integration Survey
1
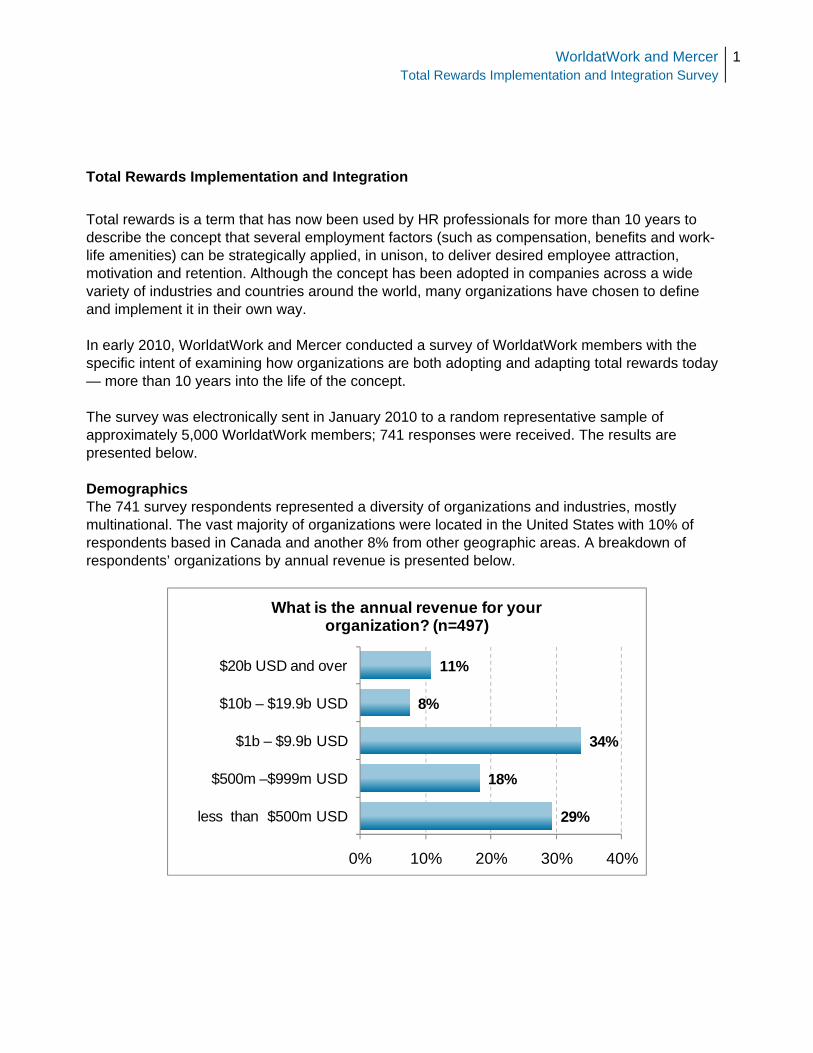
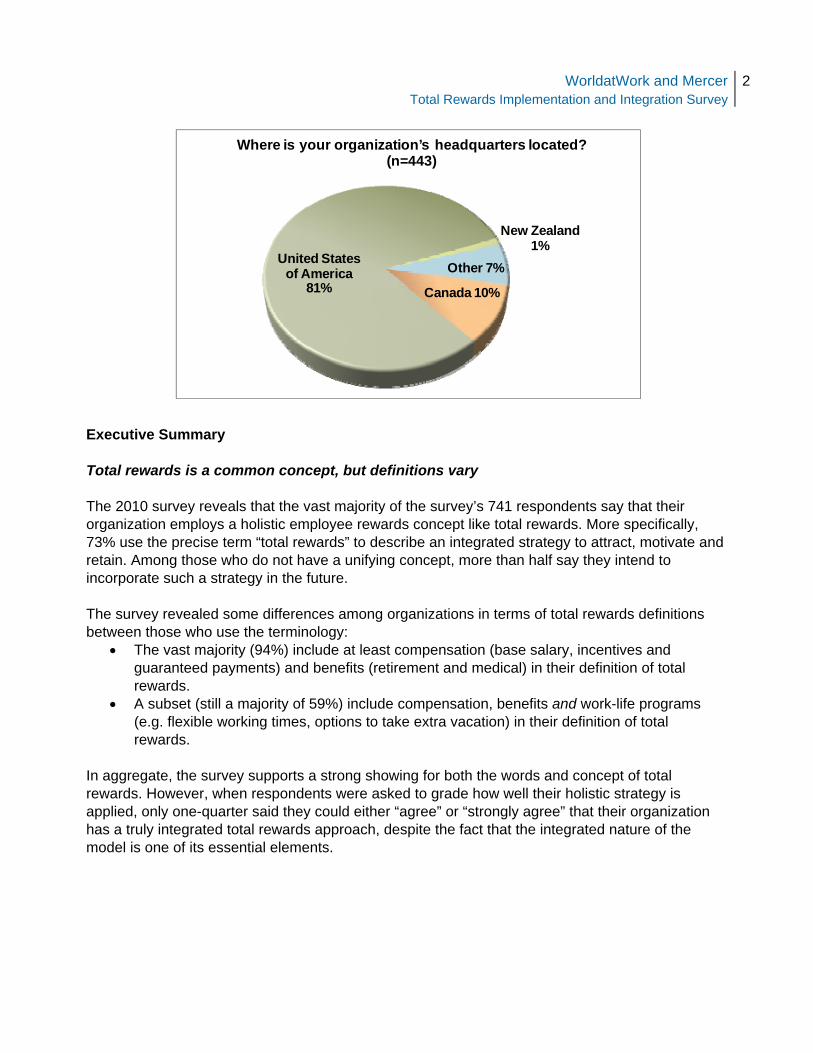
Total Rewards Implementation and Integration Total rewards is a term that has now been used by HR professionals for more than 10 years to describe the concept that several employment factors (such as compensation, benefits and work-life amenities) can be strategically applied, in unison, to deliver desired employee attraction, motivation and retention. Although the concept has been adopted in companies across a wide variety of industries and countries around the world, many organizations have chosen to define and implement it in their own way. In early 2010, WorldatWork and Mercer conducted a survey of WorldatWork members with the specific intent of examining how organizations are both adopting and adapting total rewards today — more than 10 years into the life of the concept. The survey was electronically sent in January 2010 to a random representative sample of approximately 5,000 WorldatWork members; 741 responses were received. The results are presented below. Demographics The 741 survey respondents represented a diversity of organizations and industries, mostly multinational. The vast majority of organizations were located in the United States with 10% of respondents based in Canada and another 8% from other geographic areas. A breakdown of respondents’ organizations by annual revenue is presented below.
29%
18%
34%
8%
11%
0% 10% 20% 30% 40%
less than $500m USD
$500m –$999m USD
$1b – $9.9b USD
$10b – $19.9b USD
$20b USD and over
What is the annual revenue for your organization? (n=497)
WorldatWork and MercerTotal Rewards Implementation and Integration Survey
2
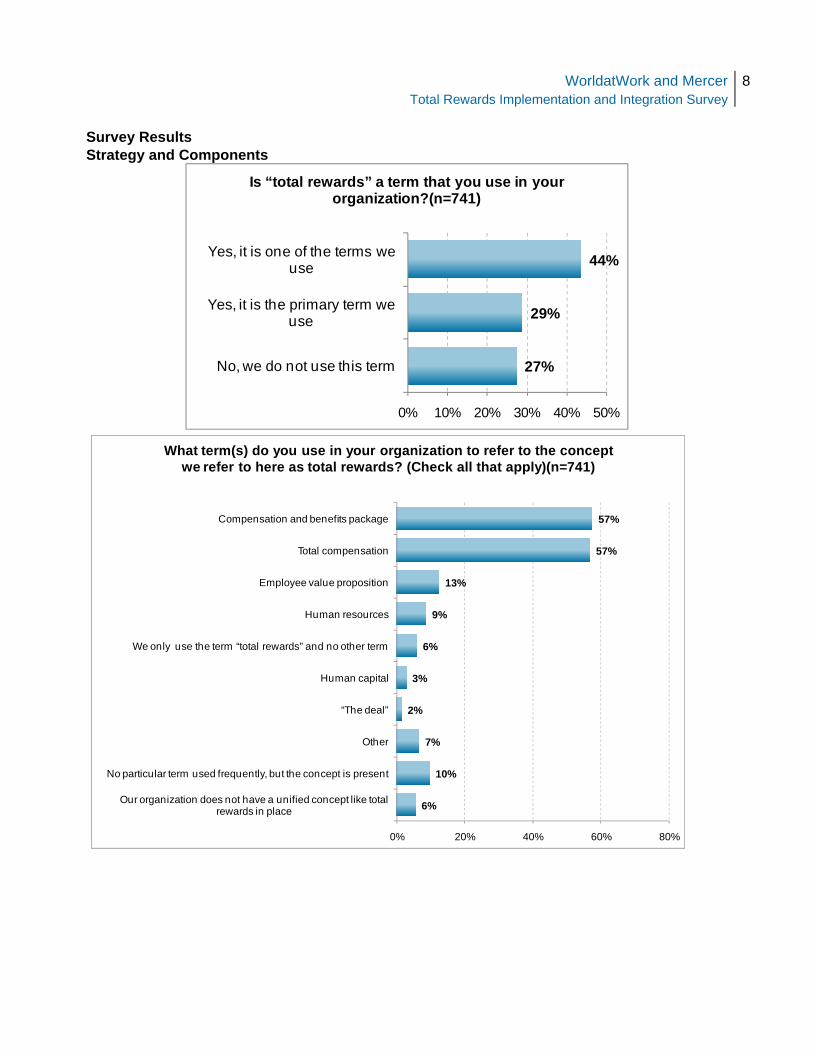
Executive Summary Total rewards is a common concept, but definitions vary The 2010 survey reveals that the vast majority of the survey’s 741 respondents say that their organization employs a holistic employee rewards concept like total rewards. More specifically, 73% use the precise term “total rewards” to describe an integrated strategy to attract, motivate and retain. Among those who do not have a unifying concept, more than half say they intend to incorporate such a strategy in the future. The survey revealed some differences among organizations in terms of total rewards definitions between those who use the terminology:
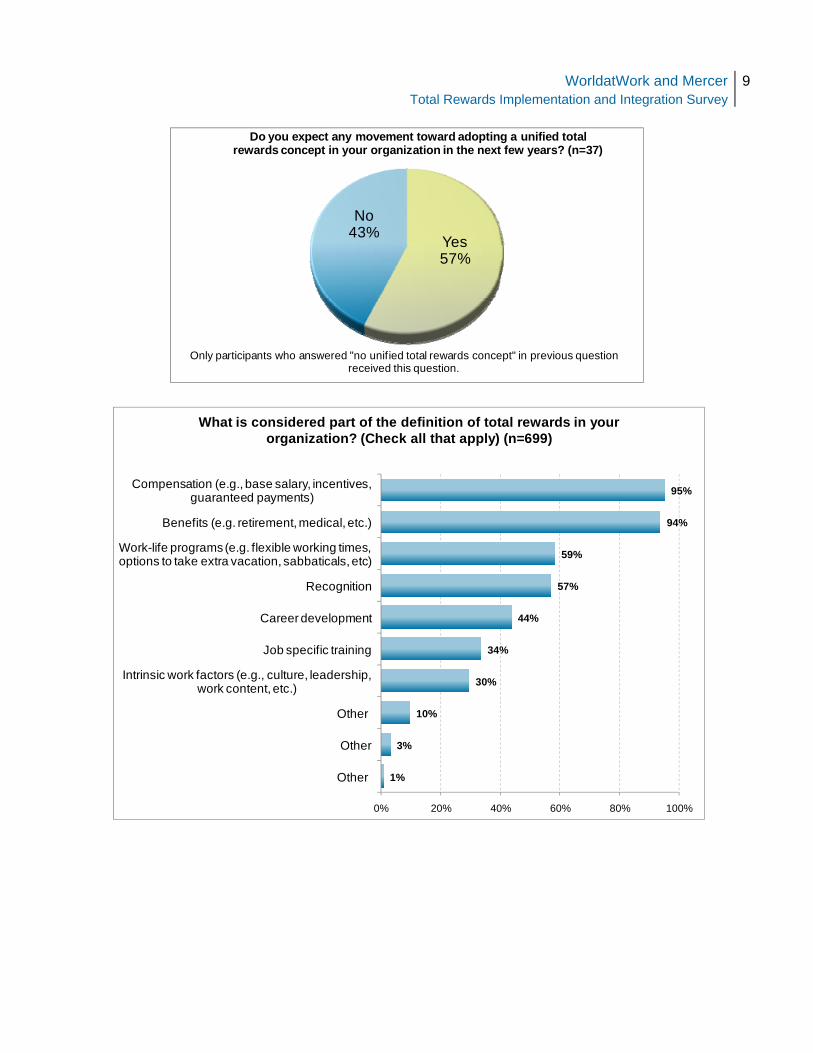
• The vast majority (94%) include at least compensation (base salary, incentives and guaranteed payments) and benefits (retirement and medical) in their definition of total rewards.
• A subset (still a majority of 59%) include compensation, benefits and work-life programs (e.g. flexible working times, options to take extra vacation) in their definition of total rewards.
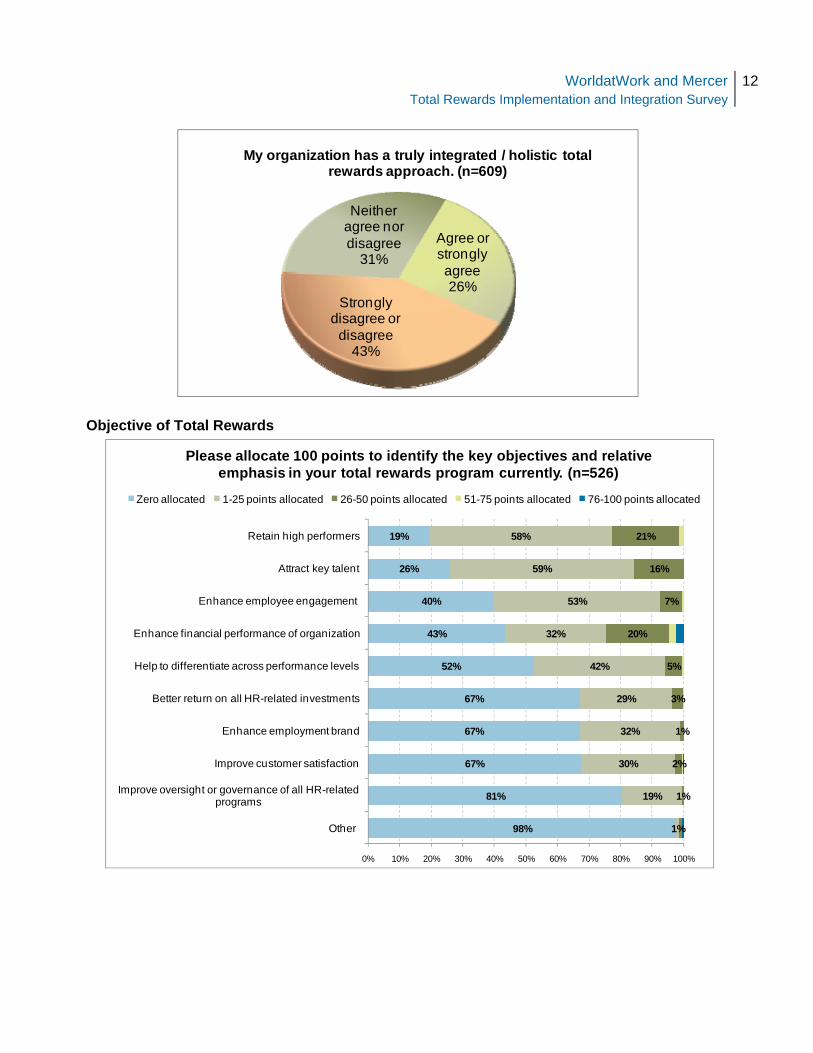
In aggregate, the survey supports a strong showing for both the words and concept of total rewards. However, when respondents were asked to grade how well their holistic strategy is applied, only one-quarter said they could either “agree” or “strongly agree” that their organization has a truly integrated total rewards approach, despite the fact that the integrated nature of the model is one of its essential elements.
Canada 10%
United States of America
81%
New Zealand 1%
Other 7%
Where is your organization’s headquarters located? (n=443)
WorldatWork and MercerTotal Rewards Implementation and Integration Survey
3
Total rewards is primarily about retaining employees and financial performance Why do organizations implement a total rewards program? Survey participants cited the following business objectives most often:
1. Retain high performers 2. Enhance the organization’s financial performance 3. Attract key talent
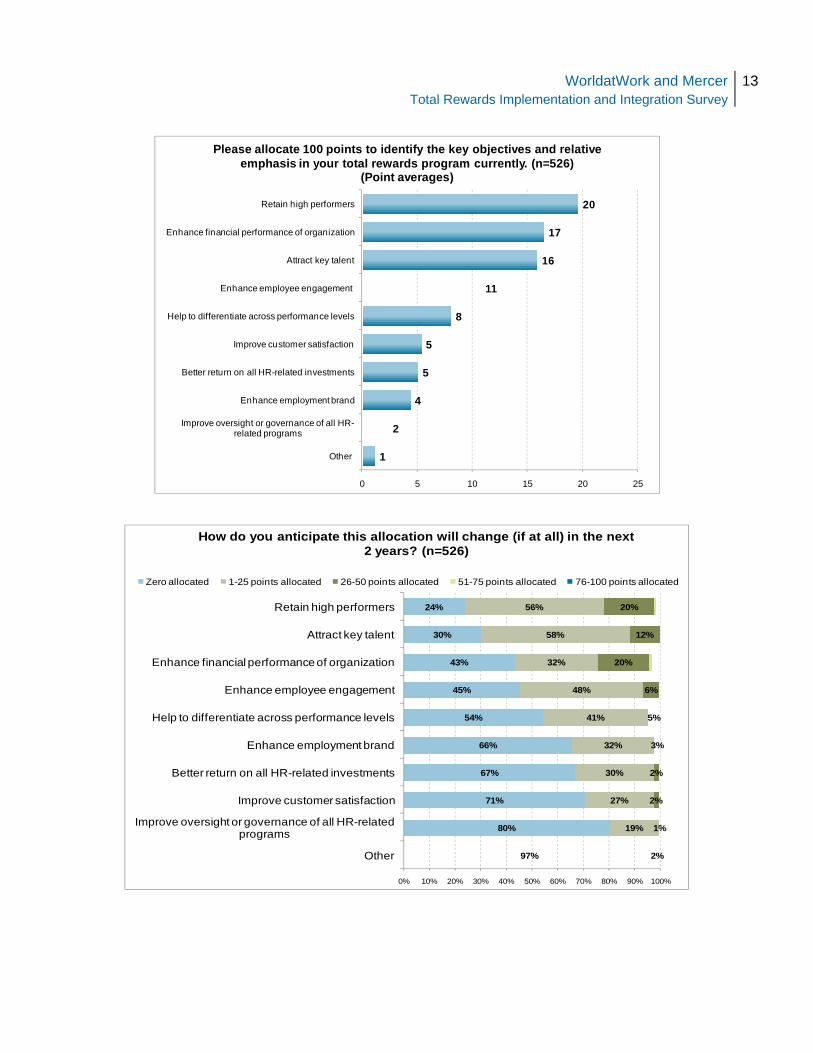
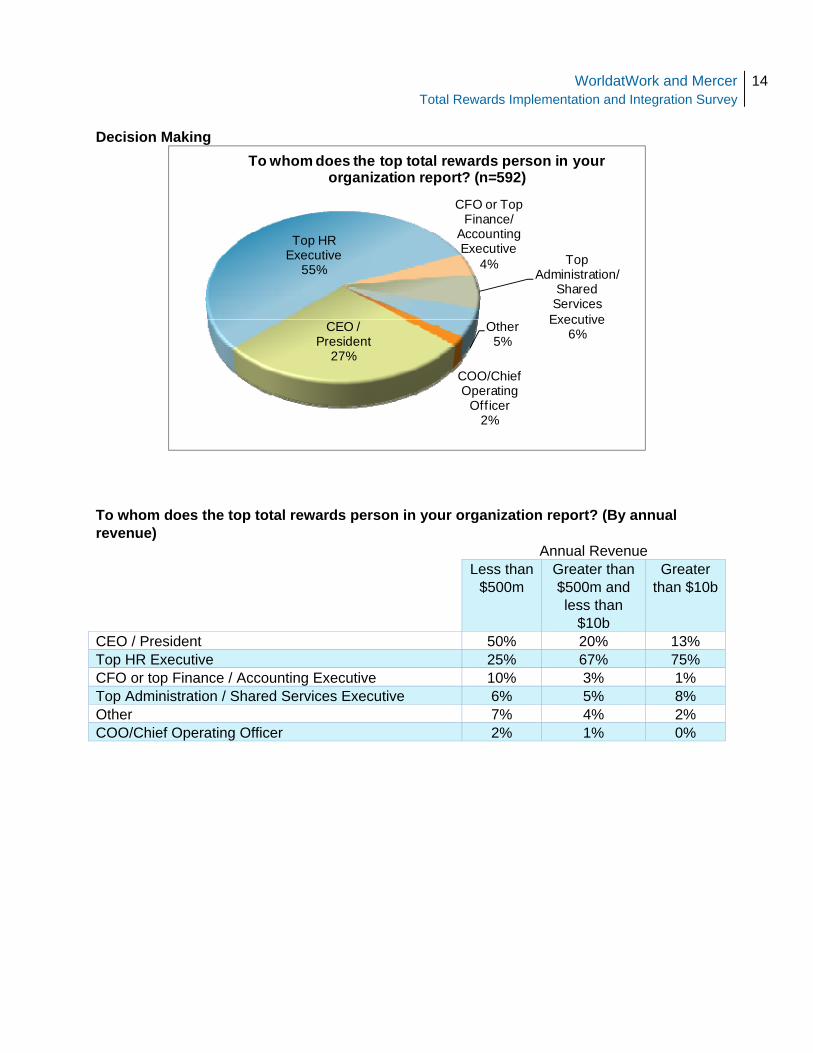
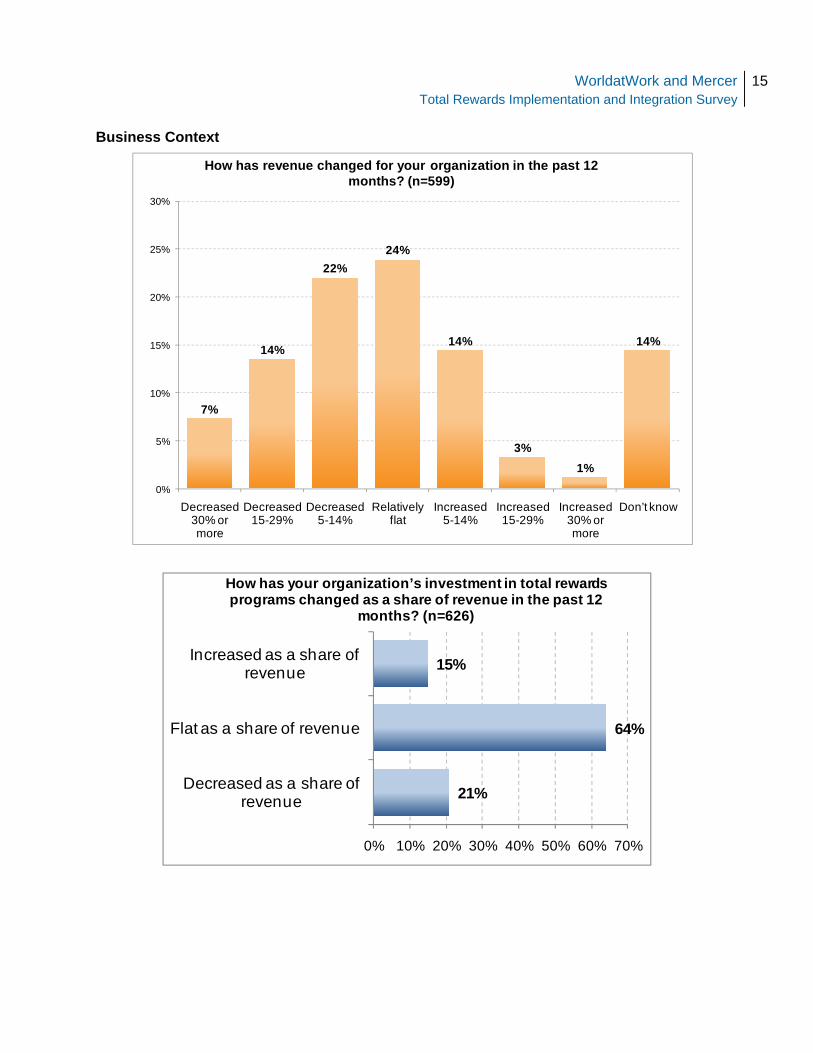
These objectives generally correlate with what many organizations have described as key attributes for digging out of the recent economic downturn and successfully competing in a future business environment. When participants were further asked about the objectives for their total rewards program in the next two years, these three objectives remained unchanged at the top of the list. Most organizations have a senior executive responsible for total rewards In order to achieve these key objectives, how do organizations make decisions about their total rewards programs, and who makes the decisions? The majority of respondents reported that their organization has a senior executive responsible for total rewards. Further, in more than half of responding organizations, the executive responsible for total rewards reports directly to the top HR professional, while 27% report directly to the organization’s chief executive or CEO. The top total rewards person is more likely to report to the CEO in smaller (less than $500 million in revenue) organizations and to the top HR executive in larger (greater than $10 billion in revenue) organizations. Most respondents indicated that they draw on both internal analyses and reports and external practices to make informed decisions about changes to their organizations’ total rewards mix. Organizations primarily use cost and affordability measures (especially as more senior leadership is involved), as well as business strategy documents to make these decisions. In smaller organizations, the top total rewards person is more likely to also be involved in business strategy development. Total rewards concept has stayed constant in the face of economic turmoil Despite 43% of respondents reporting a decline in organizational revenue during the past 12 months, investments in total rewards have stayed the same overall: 15% reported their organization increased its total rewards investment, while 21% reported a decrease. Even with investments in total rewards programs staying mostly neutral, organizations changed the levers they were pulling and mixed up the allocations of their total rewards spend. For example, 38% of organizations reduced their annual bonus pool funding, and 67% reduced merit budgets. Forty percent reported enhancing or adding wellness programs.
WorldatWork and MercerTotal Rewards Implementation and Integration Survey
4
The top three factors influencing changes to total rewards programs over the past 12 months were:
1. Cost/affordability 2. Business performance/economy 3. Attraction and retention of key talent
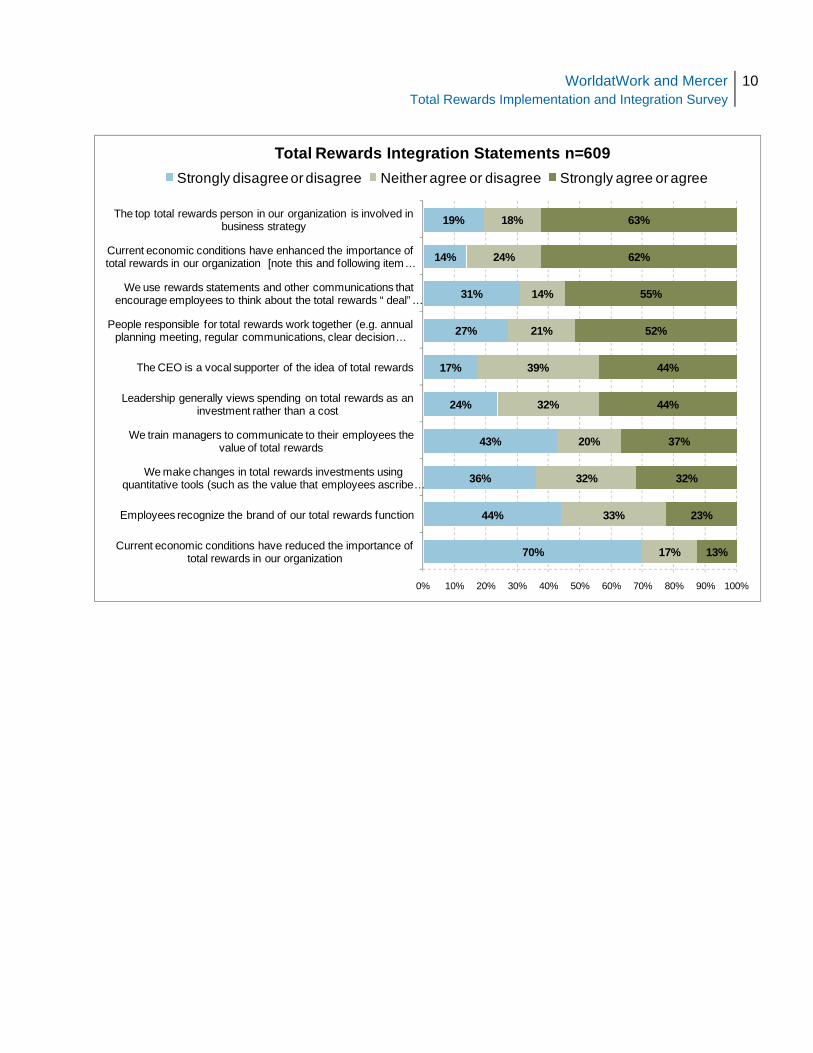
There is a relationship between total rewards integration and organizational resilience To test the extent of total rewards thinking throughout the responding organizations, the survey presented eight statements, the results of which were formulated into a “total rewards integration index.” The eight statements that created the index were:
• We use rewards statements and other communications that encourage employees to think about the total rewards “deal” in an integrated way.
• Employees recognize the brand of our total rewards function. • The top total rewards person in our organization is involved in business strategy. • Leadership generally views spending on total rewards as an investment rather than a cost. • We train managers to communicate to their employees the value of total rewards. • People responsible for total rewards work together (e.g. annual planning meeting, regular
communications, clear decision making process, etc.). • We make changes in total rewards investments using quantitative tools (such as the value
that employees ascribe to different rewards aspects compared to costs). • The CEO is a vocal supporter of the idea of total rewards.
Participants rated these statements on a five-point scale from “strongly disagree” to “strongly agree.” A rating of “strongly agree” received five points, while a rating of “strongly disagree” received one point. The highest score possible for an organization is 40. Organizations were then divided into two groups:
• Low-to-mid total rewards integration (1 – 24 points acquired) • Mid-to-high total rewards integration (25 – 40 points acquired)
WorldatWork and MercerTotal Rewards Implementation and Integration Survey
5
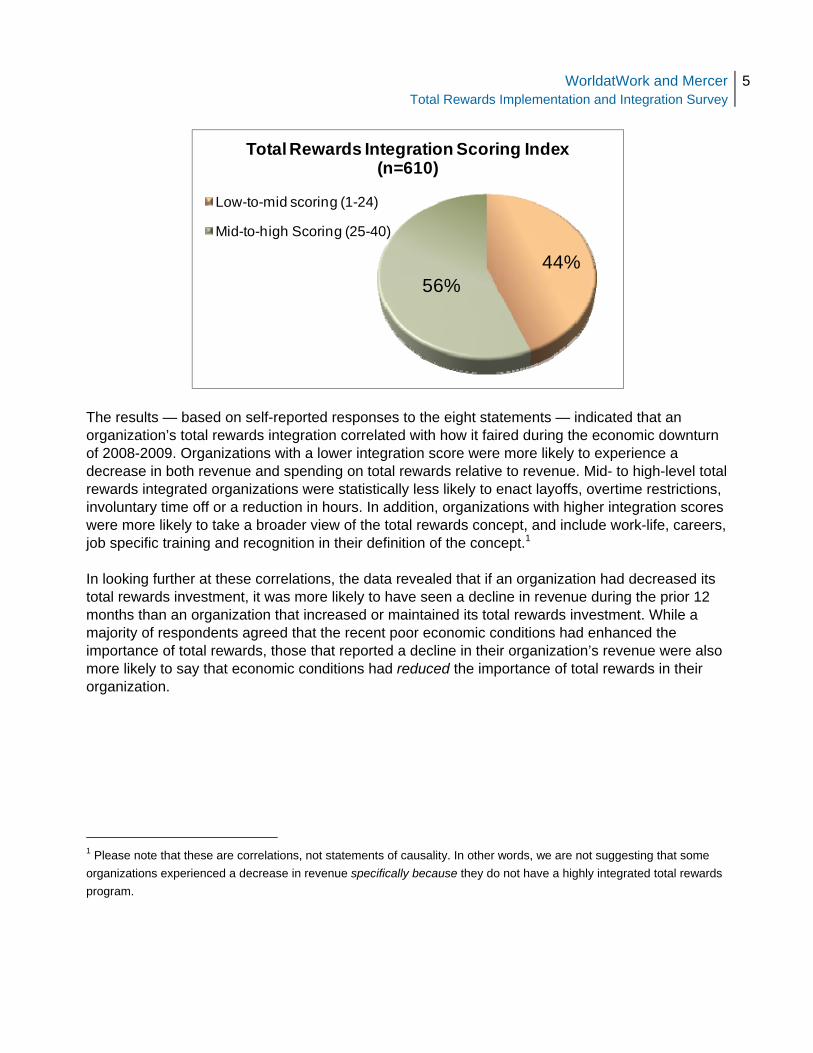
44%56%
Total Rewards Integration Scoring Index(n=610)
Low-to-mid scoring (1-24)
Mid-to-high Scoring (25-40)
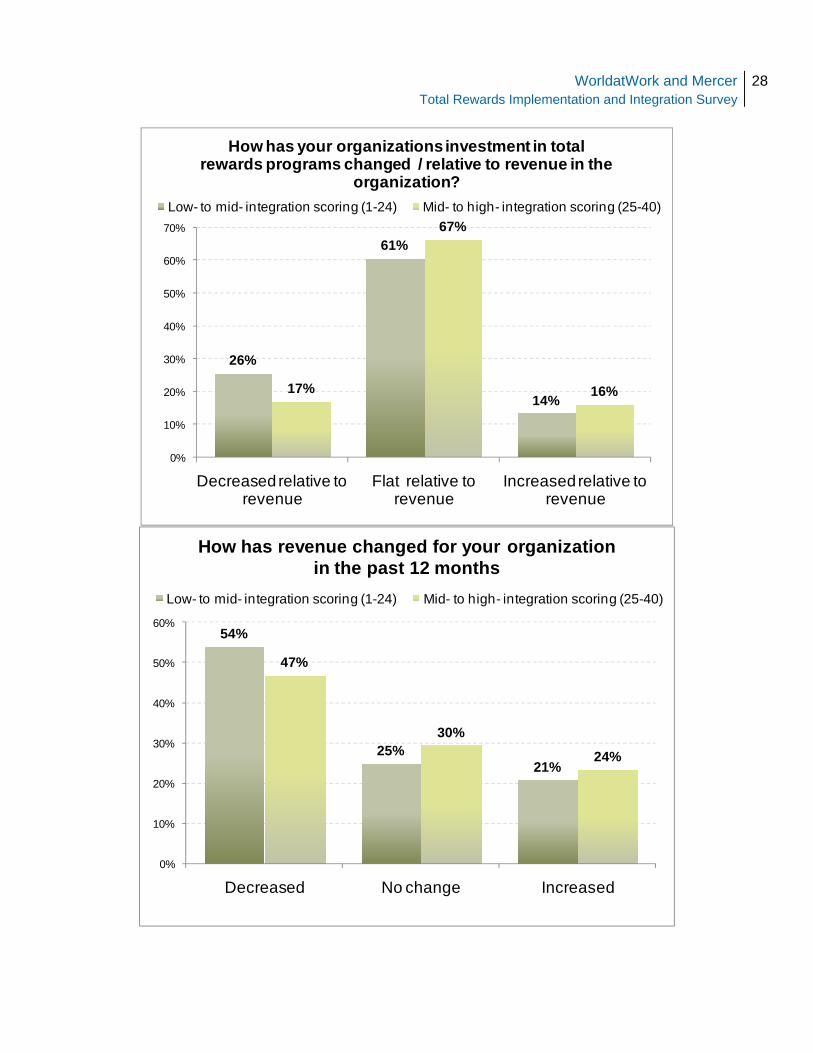
The results — based on self-reported responses to the eight statements — indicated that an organization’s total rewards integration correlated with how it faired during the economic downturn of 2008-2009. Organizations with a lower integration score were more likely to experience a decrease in both revenue and spending on total rewards relative to revenue. Mid- to high-level total rewards integrated organizations were statistically less likely to enact layoffs, overtime restrictions, involuntary time off or a reduction in hours. In addition, organizations with higher integration scores were more likely to take a broader view of the total rewards concept, and include work-life, careers, job specific training and recognition in their definition of the concept.1 In looking further at these correlations, the data revealed that if an organization had decreased its total rewards investment, it was more likely to have seen a decline in revenue during the prior 12 months than an organization that increased or maintained its total rewards investment. While a majority of respondents agreed that the recent poor economic conditions had enhanced the importance of total rewards, those that reported a decline in their organization’s revenue were also more likely to say that economic conditions had reduced the importance of total rewards in their organization.
1 Please note that these are correlations, not statements of causality. In other words, we are not suggesting that some organizations experienced a decrease in revenue specifically because they do not have a highly integrated total rewards program.
WorldatWork and MercerTotal Rewards Implementation and Integration Survey
6
The direction of organizational revenue during the prior 12 months had a major impact on the types of changes made to the various components of total rewards. Specifically, organizations that indicated a decline in revenue during the prior year were much more likely to:
• Eliminate or reduce annual bonus pool funding, merit budget and spot bonuses • Provide non-monetary recognition • Reduce health insurance • Reduce retirement funding/matching • Reduce training budgets.
Conversely, organizations that reported an increase in revenue during the prior 12 months were more likely to enhance annual bonus pool funding, merit budgets, health insurance and training. Those employers that experienced a decline in revenue during the prior 12 months were more likely to indicate that their employees do not recognize the brand of their total rewards program and generally feel that leadership views spending for total rewards as an organizational cost, rather than an investment. An organization’s size (employee count) also seemed to impact total rewards strategy. More large organizations indicated that the economic turmoil had enhanced the importance of total rewards in their organizations. However, larger employers were also more likely than smaller employers to report they had implemented layoffs. Smaller organizations, on the other hand, were more likely to reduce or eliminate annual bonus pool funding, encourage voluntary unpaid time off and implement a reduction in hours paid. To measure the success of these total rewards actions taken during the downturn, participants reported that they will first examine the impact on costs, and secondarily examine employee survey data. Larger employers were more likely to use feedback from executives to measure the impact of these changes. Organizations that saw no change or an increase in revenue over the past 12 months were more likely to measure the success of change in total rewards investments using quantitative tools. What does the future hold for total rewards? This question might be answered by seeing where the concept has come during the past 10 years. When compared to results of a Mercer snapshot survey conducted in 20052, it seems evident that organizations have taken their application of and views on total rewards to another level. Specifically, in 2005 the focus of a majority of respondents seemed to be on aligning an organization’s business strategy and its compensation, whereas in 2010 the emphasis seems to be on linking performance management and rewards not just to the business’ strategy, but to business results.
2 Mercer Human Resource Consulting, “Measuring the Return on Total Rewards: 2005 Update”.
WorldatWork and MercerTotal Rewards Implementation and Integration Survey
7
With regard to communicating total rewards with employees, the emphasis in 2005 was to ensure employees understood the various elements of the rewards programs and the associated costs. Today, the goal is to motivate employees through personalization of communications in relation to the total rewards programs. In summary, the overarching objectives of total rewards programs today and in the future will likely continue to be: to retain high performers, to attract key talent and to enhance the financial performance of organizations. In the view of 2010 survey respondents, organizations that can successfully achieve one or more of these goals via their total rewards program will need to:
• Better integrate their total rewards components • Seek out quantitative decision making and program design tools • More effectively communicate program attributes to participants • Better engage front-line managers • Secure the buy-in of organizational leadership.
As the research shows, the pay-offs are many, including being positioned to reap a better return on the total rewards investment and weather economic fluctuations.
WorldatWork and MercerTotal Rewards Implementation and Integration Survey
8
Survey Results Strategy and Components
27%
29%
44%
0% 10% 20% 30% 40% 50%
No, we do not use this term
Yes, it is the primary term we use
Yes, it is one of the terms we use
Is “total rewards” a term that you use in your organization?(n=741)
6%
10%
7%
2%
3%
6%
9%
13%
57%
57%
0% 20% 40% 60% 80%
Our organization does not have a unified concept like total rewards in place
No particular term used frequently, but the concept is present
Other
“The deal”
Human capital
We only use the term “total rewards” and no other term
Human resources
Employee value proposition
Total compensation
Compensation and benefits package
What term(s) do you use in your organization to refer to the concept we refer to here as total rewards? (Check all that apply)(n=741)
WorldatWork and MercerTotal Rewards Implementation and Integration Survey
9
Yes57%
No43%
Do you expect any movement toward adopting a unified total rewards concept in your organization in the next few years? (n=37)
Only participants who answered "no unified total rewards concept" in previous question received this question.
1%
3%
10%
30%
34%
44%
57%
59%
94%
95%
0% 20% 40% 60% 80% 100%
Other
Other
Other
Intrinsic work factors (e.g., culture, leadership, work content, etc.)
Job specific training
Career development
Recognition
Work-life programs (e.g. flexible working times, options to take extra vacation, sabbaticals, etc)
Benefits (e.g. retirement, medical, etc.)
Compensation (e.g., base salary, incentives, guaranteed payments)
What is considered part of the definition of total rewards in your organization? (Check all that apply) (n=699)
WorldatWork and MercerTotal Rewards Implementation and Integration Survey
10
70%
44%
36%
43%
24%
17%
27%
31%
14%
19%
17%
33%
32%
20%
32%
39%
21%
14%
24%
18%
13%
23%
32%
37%
44%
44%
52%
55%
62%
63%
0% 10% 20% 30% 40% 50% 60% 70% 80% 90% 100%
Current economic conditions have reduced the importance of total rewards in our organization
Employees recognize the brand of our total rewards function
We make changes in total rewards investments using quantitative tools (such as the value that employees ascribe …
We train managers to communicate to their employees the value of total rewards
Leadership generally views spending on total rewards as an investment rather than a cost
The CEO is a vocal supporter of the idea of total rewards
People responsible for total rewards work together (e.g. annual planning meeting, regular communications, clear decision …
We use rewards statements and other communications that encourage employees to think about the total rewards “ deal” …
Current economic conditions have enhanced the importance of total rewards in our organization [note this and following item …
The top total rewards person in our organization is involved in business strategy
Total Rewards Integration Statements n=609Strongly disagree or disagree Neither agree or disagree Strongly agree or agree
WorldatWork and MercerTotal Rewards Implementation and Integration Survey
11
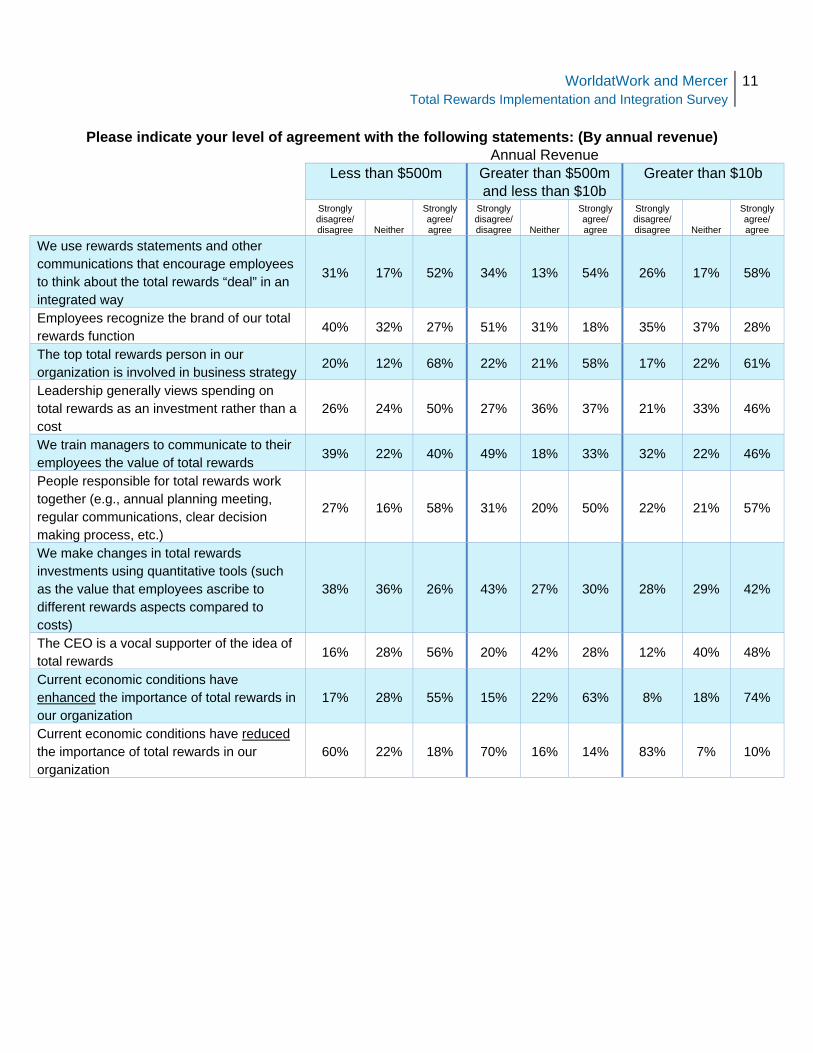
Please indicate your level of agreement with the following statements: (By annual revenue)
Annual Revenue Less than $500m Greater than $500m
and less than $10b Greater than $10b
Strongly disagree/ disagree Neither
Strongly agree/ agree
Strongly disagree/ disagree Neither
Strongly agree/ agree
Strongly disagree/ disagree Neither
Strongly agree/ agree
We use rewards statements and other communications that encourage employees to think about the total rewards “deal” in an integrated way
31% 17% 52% 34% 13% 54% 26% 17% 58%
Employees recognize the brand of our total rewards function
40% 32% 27% 51% 31% 18% 35% 37% 28%
The top total rewards person in our organization is involved in business strategy
20% 12% 68% 22% 21% 58% 17% 22% 61%
Leadership generally views spending on total rewards as an investment rather than a cost
26% 24% 50% 27% 36% 37% 21% 33% 46%
We train managers to communicate to their employees the value of total rewards
39% 22% 40% 49% 18% 33% 32% 22% 46%
People responsible for total rewards work together (e.g., annual planning meeting, regular communications, clear decision making process, etc.)
27% 16% 58% 31% 20% 50% 22% 21% 57%
We make changes in total rewards investments using quantitative tools (such as the value that employees ascribe to different rewards aspects compared to costs)
38% 36% 26% 43% 27% 30% 28% 29% 42%
The CEO is a vocal supporter of the idea of total rewards
16% 28% 56% 20% 42% 28% 12% 40% 48%
Current economic conditions have enhanced the importance of total rewards in our organization
17% 28% 55% 15% 22% 63% 8% 18% 74%
Current economic conditions have reduced the importance of total rewards in our organization
60% 22% 18% 70% 16% 14% 83% 7% 10%
WorldatWork and MercerTotal Rewards Implementation and Integration Survey
12
Strongly disagree or
disagree43%
Neither agree nor disagree
31%Agree or strongly agree26%
My organization has a truly integrated / holistic total rewards approach. (n=609)
Objective of Total Rewards
98%
81%
67%
67%
67%
52%
43%
40%
26%
19%
1%
19%
30%
32%
29%
42%
32%
53%
59%
58%
1%
2%
1%
3%
5%
20%
7%
16%
21%
0% 10% 20% 30% 40% 50% 60% 70% 80% 90% 100%
Other
Improve oversight or governance of all HR-related programs
Improve customer satisfaction
Enhance employment brand
Better return on all HR-related investments
Help to differentiate across performance levels
Enhance financial performance of organization
Enhance employee engagement
Attract key talent
Retain high performers
Please allocate 100 points to identify the key objectives and relative emphasis in your total rewards program currently. (n=526)
Zero allocated 1-25 points allocated 26-50 points allocated 51-75 points allocated 76-100 points allocated
WorldatWork and MercerTotal Rewards Implementation and Integration Survey
13
1
2
4
5
5
8
11
16
17
20
0 5 10 15 20 25
Other
Improve oversight or governance of all HR-related programs
Enhance employment brand
Better return on all HR-related investments
Improve customer satisfaction
Help to differentiate across performance levels
Enhance employee engagement
Attract key talent
Enhance financial performance of organization
Retain high performers
Please allocate 100 points to identify the key objectives and relative emphasis in your total rewards program currently. (n=526)
(Point averages)
97%
80%
71%
67%
66%
54%
45%
43%
30%
24%
2%
19%
27%
30%
32%
41%
48%
32%
58%
56%
1%
2%
2%
3%
5%
6%
20%
12%
20%
0% 10% 20% 30% 40% 50% 60% 70% 80% 90% 100%
Other
Improve oversight or governance of all HR-related programs
Improve customer satisfaction
Better return on all HR-related investments
Enhance employment brand
Help to differentiate across performance levels
Enhance employee engagement
Enhance financial performance of organization
Attract key talent
Retain high performers
How do you anticipate this allocation will change (if at all) in the next 2 years? (n=526)
Zero allocated 1-25 points allocated 26-50 points allocated 51-75 points allocated 76-100 points allocated
WorldatWork and MercerTotal Rewards Implementation and Integration Survey
14
Decision Making
CEO / President
27%
Top HR Executive
55%
CFO or Top Finance/
Accounting Executive
4% Top Administration/
Shared Services
Executive6%Other
5%
COO/Chief Operating
Officer2%
To whom does the top total rewards person in your organization report? (n=592)
To whom does the top total rewards person in your organization report? (By annual revenue) Annual Revenue Less than
$500m Greater than $500m and less than
$10b
Greater than $10b
CEO / President 50% 20% 13% Top HR Executive 25% 67% 75% CFO or top Finance / Accounting Executive 10% 3% 1% Top Administration / Shared Services Executive 6% 5% 8% Other 7% 4% 2% COO/Chief Operating Officer 2% 1% 0%
WorldatWork and MercerTotal Rewards Implementation and Integration Survey
15
Business Context
7%
14%
22%24%
14%
3%1%
14%
0%
5%
10%
15%
20%
25%
30%
Decreased 30% or more
Decreased 15-29%
Decreased 5-14%
Relatively flat
Increased 5-14%
Increased 15-29%
Increased 30% or more
Don’t know
How has revenue changed for your organization in the past 12 months? (n=599)
21%
64%
15%
0% 10% 20% 30% 40% 50% 60% 70%
Decreased as a share of revenue
Flat as a share of revenue
Increased as a share of revenue
How has your organization’s investment in total rewards programs changed as a share of revenue in the past 12
months? (n=626)
WorldatWork and MercerTotal Rewards Implementation and Integration Survey
16
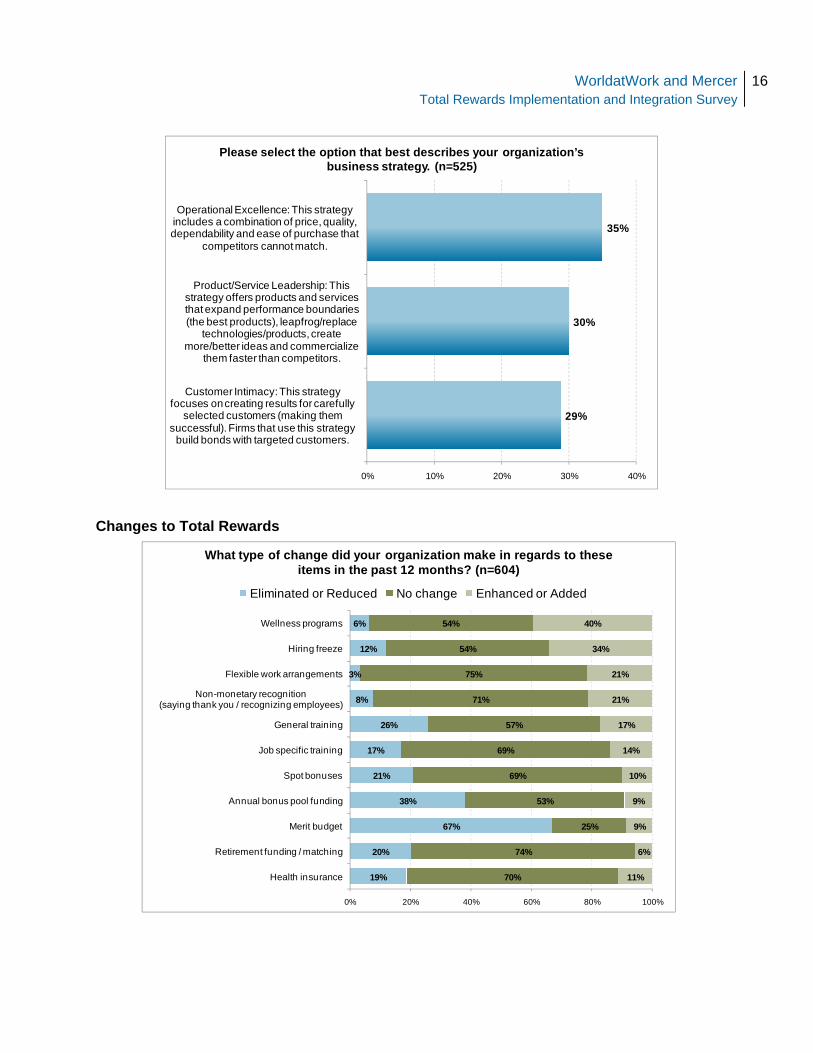
29%
30%
35%
0% 10% 20% 30% 40%
Customer Intimacy: This strategy focuses on creating results for carefully
selected customers (making them successful). Firms that use this strategy
build bonds with targeted customers.
Product/Service Leadership: This strategy offers products and services that expand performance boundaries (the best products), leapfrog/replace
technologies/products, create more/better ideas and commercialize
them faster than competitors.
Operational Excellence: This strategy includes a combination of price, quality, dependability and ease of purchase that
competitors cannot match.
Please select the option that best describes your organization’s business strategy. (n=525)
Changes to Total Rewards
19%
20%
67%
38%
21%
17%
26%
8%
3%
12%
6%
70%
74%
25%
53%
69%
69%
57%
71%
75%
54%
54%
11%
6%
9%
9%
10%
14%
17%
21%
21%
34%
40%
0% 20% 40% 60% 80% 100%
Health insurance
Retirement funding / matching
Merit budget
Annual bonus pool funding
Spot bonuses
Job specific training
General training
Non-monetary recognition(saying thank you / recognizing employees)
Flexible work arrangements
Hiring freeze
Wellness programs
What type of change did your organization make in regards to these items in the past 12 months? (n=604)
Eliminated or Reduced No change Enhanced or Added
WorldatWork and MercerTotal Rewards Implementation and Integration Survey
17
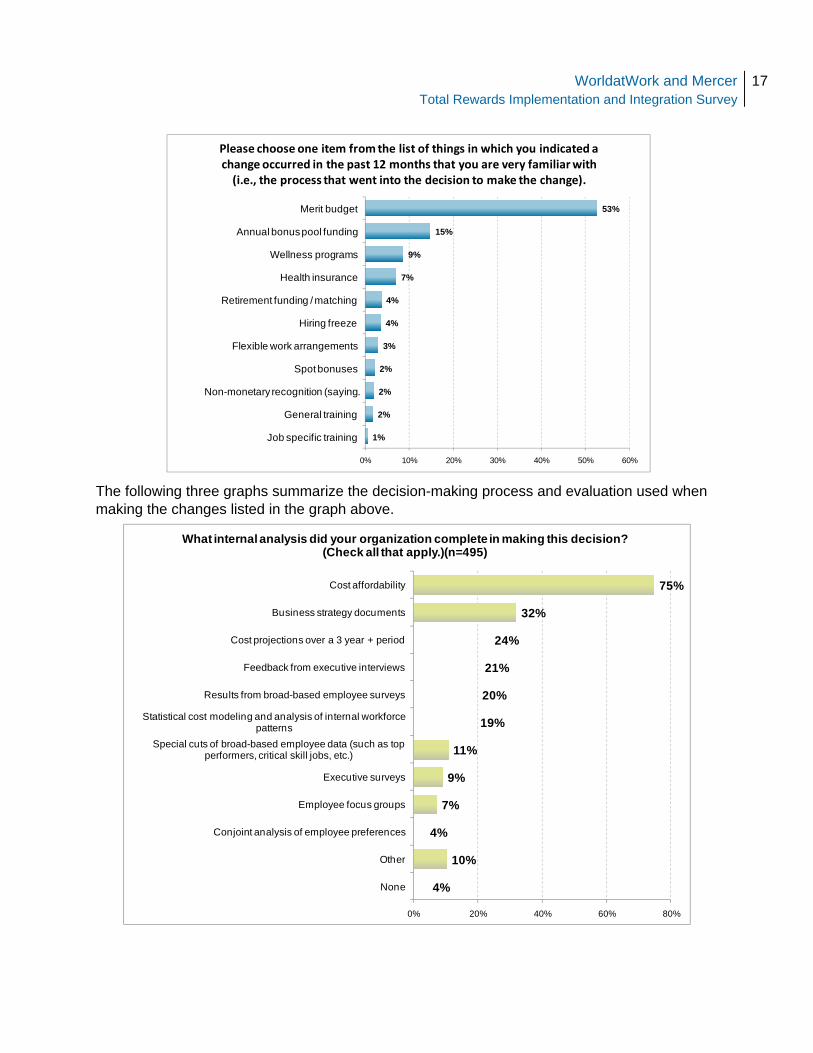
1%
2%
2%
2%
3%
4%
4%
7%
9%
15%
53%
0% 10% 20% 30% 40% 50% 60%
Job specific training
General training
Non-monetary recognition (saying …
Spot bonuses
Flexible work arrangements
Hiring freeze
Retirement funding / matching
Health insurance
Wellness programs
Annual bonus pool funding
Merit budget
Please choose one item from the list of things in which you indicated a change occurred in the past 12 months that you are very familiar with (i.e., the process that went into the decision to make the change).
The following three graphs summarize the decision-making process and evaluation used when making the changes listed in the graph above.
4%
10%
4%
7%
9%
11%
19%
20%
21%
24%
32%
75%
0% 20% 40% 60% 80%
None
Other
Conjoint analysis of employee preferences
Employee focus groups
Executive surveys
Special cuts of broad-based employee data (such as top performers, critical skill jobs, etc.)
Statistical cost modeling and analysis of internal workforce patterns
Results from broad-based employee surveys
Feedback from executive interviews
Cost projections over a 3 year + period
Business strategy documents
Cost affordability
What internal analysis did your organization complete in making this decision? (Check all that apply.)(n=495)
WorldatWork and MercerTotal Rewards Implementation and Integration Survey
18
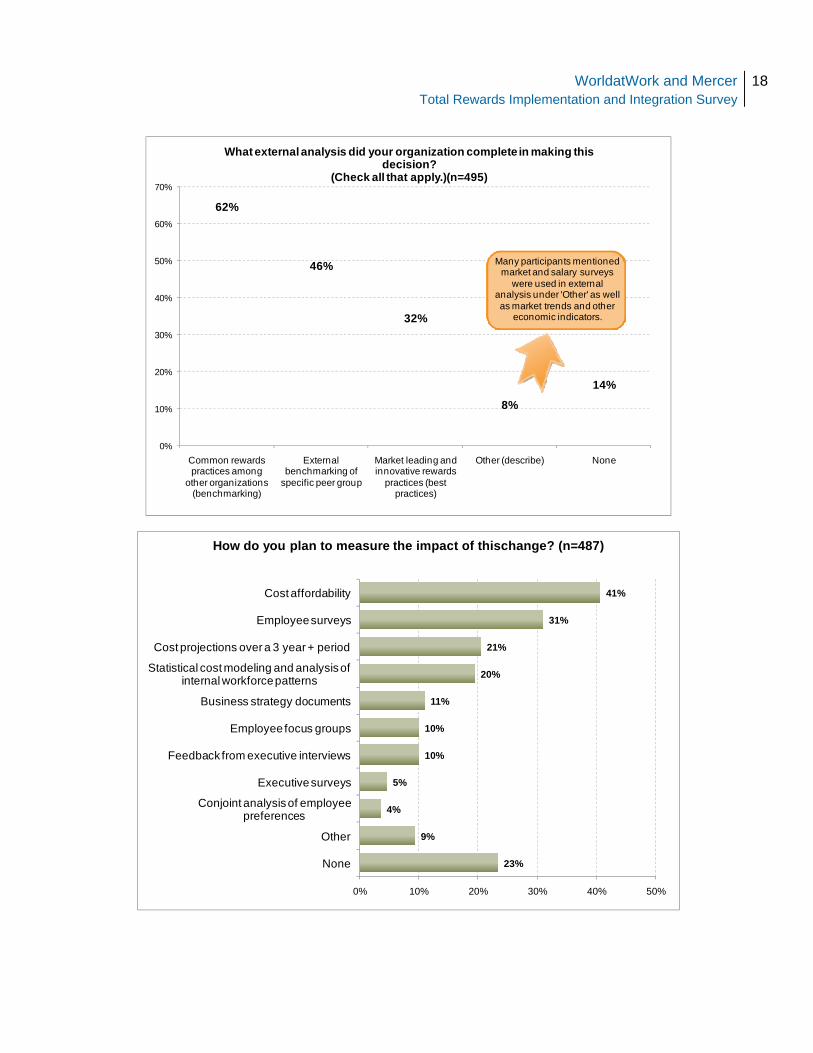
62%
46%
32%
8%
14%
0%
10%
20%
30%
40%
50%
60%
70%
Common rewards practices among
other organizations (benchmarking)
External benchmarking of
specific peer group
Market leading and innovative rewards
practices (best practices)
Other (describe) None
What external analysis did your organization complete in making this decision?
(Check all that apply.)(n=495)
Many participants mentioned market and salary surveys
were used in external analysis under 'Other' as well as market trends and other
economic indicators.
23%
9%
4%
5%
10%
10%
11%
20%
21%
31%
41%
0% 10% 20% 30% 40% 50%
None
Other
Conjoint analysis of employee preferences
Executive surveys
Feedback from executive interviews
Employee focus groups
Business strategy documents
Statistical cost modeling and analysis of internal workforce patterns
Cost projections over a 3 year + period
Employee surveys
Cost affordability
How do you plan to measure the impact of thischange? (n=487)
WorldatWork and MercerTotal Rewards Implementation and Integration Survey
19
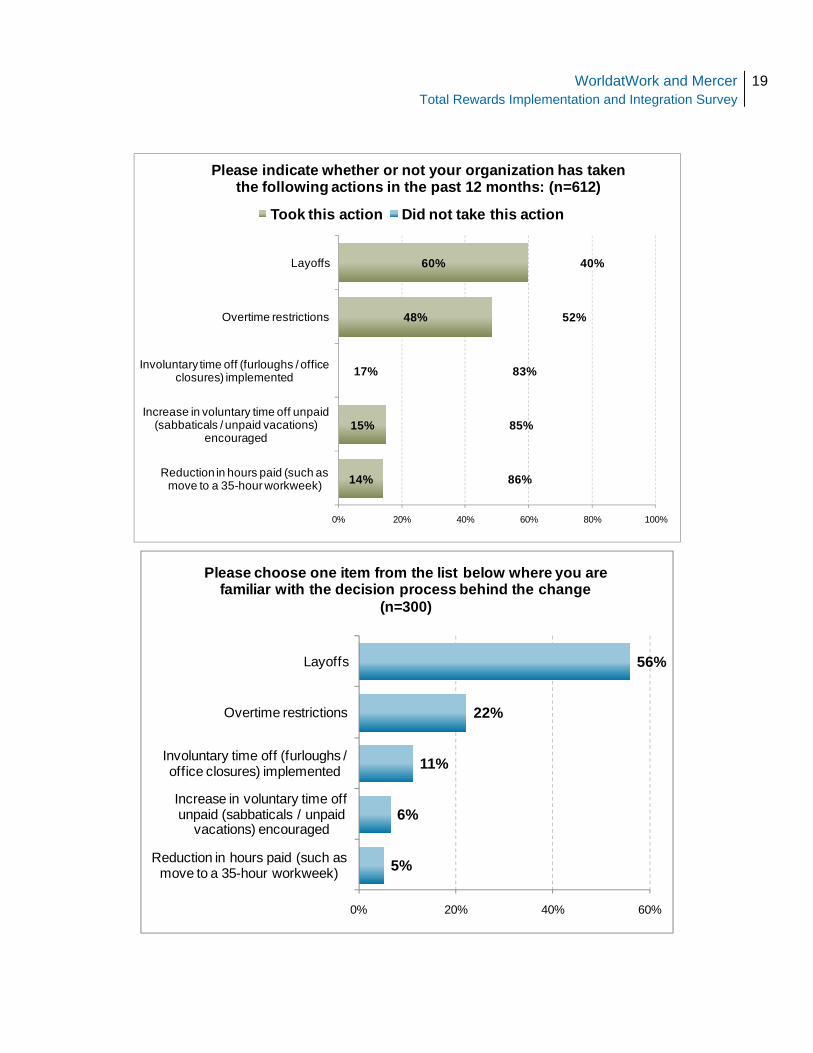
14%
15%
17%
48%
60%
86%
85%
83%
52%
40%
0% 20% 40% 60% 80% 100%
Reduction in hours paid (such as move to a 35-hour workweek)
Increase in voluntary time off unpaid (sabbaticals / unpaid vacations)
encouraged
Involuntary time off (furloughs / office closures) implemented
Overtime restrictions
Layoffs
Please indicate whether or not your organization has taken the following actions in the past 12 months: (n=612)
Took this action Did not take this action
5%
6%
11%
22%
56%
0% 20% 40% 60%
Reduction in hours paid (such as move to a 35-hour workweek)
Increase in voluntary time off unpaid (sabbaticals / unpaid
vacations) encouraged
Involuntary time off (furloughs / office closures) implemented
Overtime restrictions
Layoffs
Please choose one item from the list below where you are familiar with the decision process behind the change
(n=300)
WorldatWork and MercerTotal Rewards Implementation and Integration Survey
20
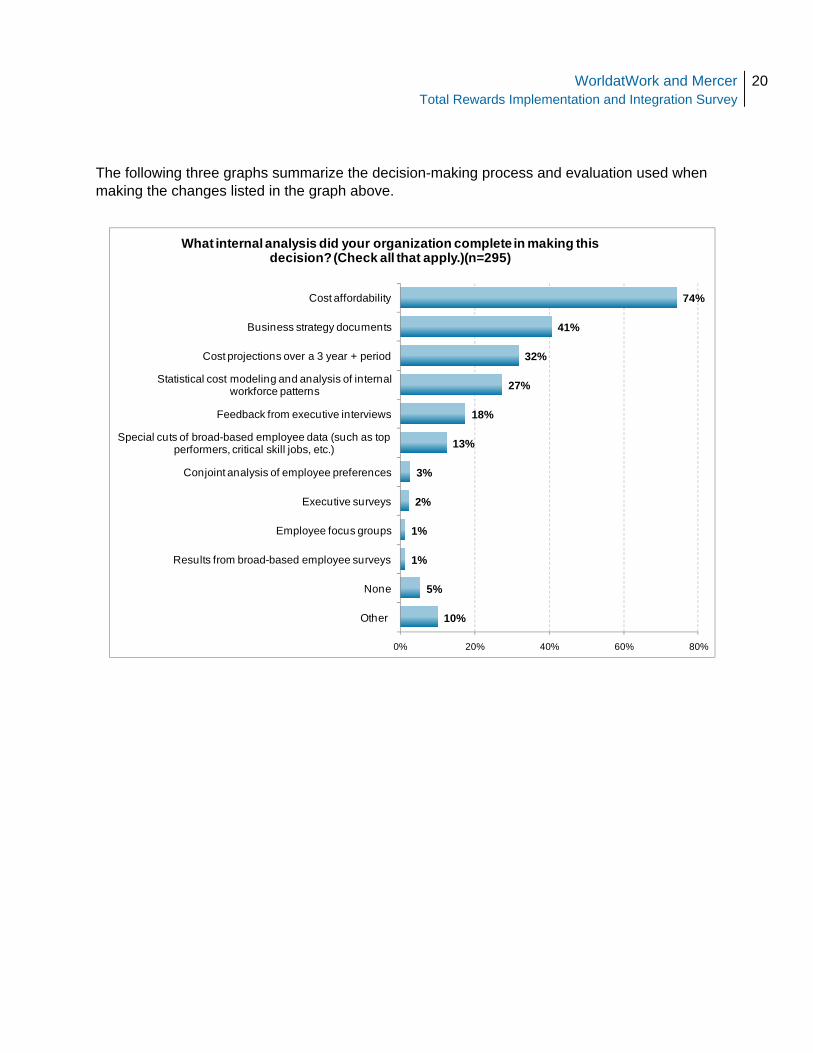
The following three graphs summarize the decision-making process and evaluation used when making the changes listed in the graph above.
10%
5%
1%
1%
2%
3%
13%
18%
27%
32%
41%
74%
0% 20% 40% 60% 80%
Other
None
Results from broad-based employee surveys
Employee focus groups
Executive surveys
Conjoint analysis of employee preferences
Special cuts of broad-based employee data (such as top performers, critical skill jobs, etc.)
Feedback from executive interviews
Statistical cost modeling and analysis of internal workforce patterns
Cost projections over a 3 year + period
Business strategy documents
Cost affordability
What internal analysis did your organization complete in making this decision? (Check all that apply.)(n=295)
WorldatWork and MercerTotal Rewards Implementation and Integration Survey
21
10%
9%
18%
20%
56%
0% 10% 20% 30% 40% 50% 60%
Other
Market leading and innovative rewards practices (best practices)
External benchmarking of specific peer group
Common rewards practices among other organizations (benchmarking)
None
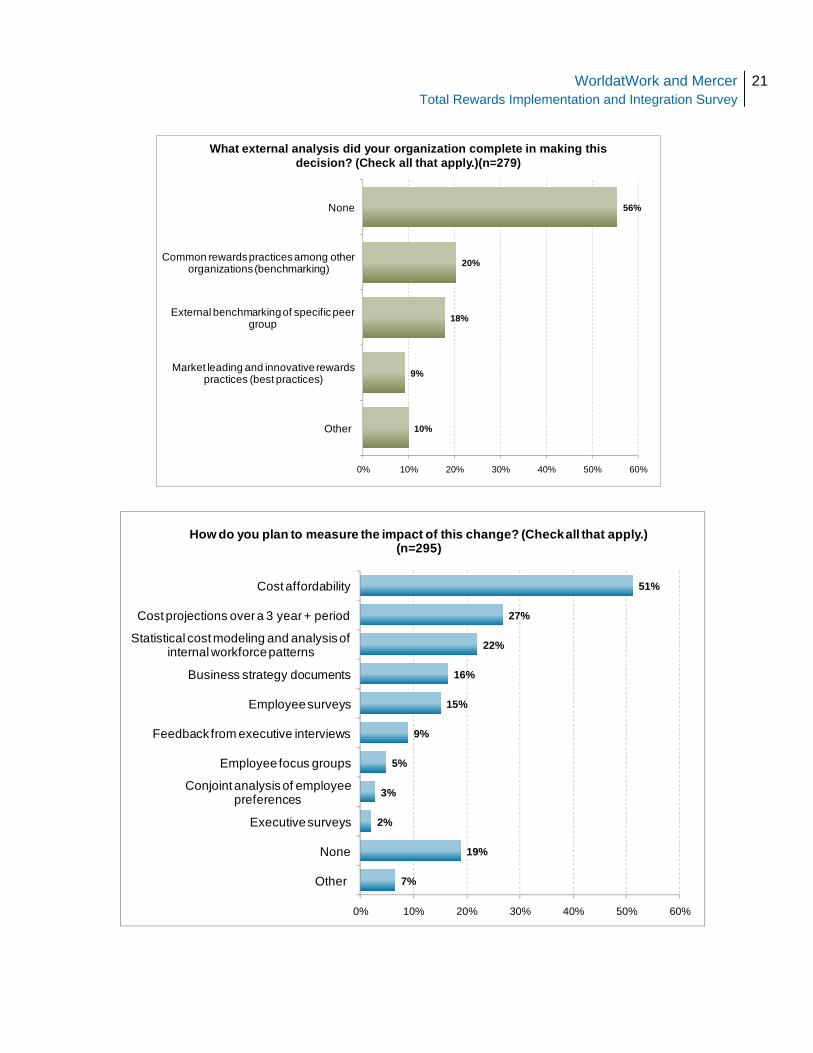
What external analysis did your organization complete in making this decision? (Check all that apply.)(n=279)
7%
19%
2%
3%
5%
9%
15%
16%
22%
27%
51%
0% 10% 20% 30% 40% 50% 60%
Other
None
Executive surveys
Conjoint analysis of employee preferences
Employee focus groups
Feedback from executive interviews
Employee surveys
Business strategy documents
Statistical cost modeling and analysis of internal workforce patterns
Cost projections over a 3 year + period
Cost affordability
How do you plan to measure the impact of this change? (Check all that apply.) (n=295)
WorldatWork and MercerTotal Rewards Implementation and Integration Survey
22
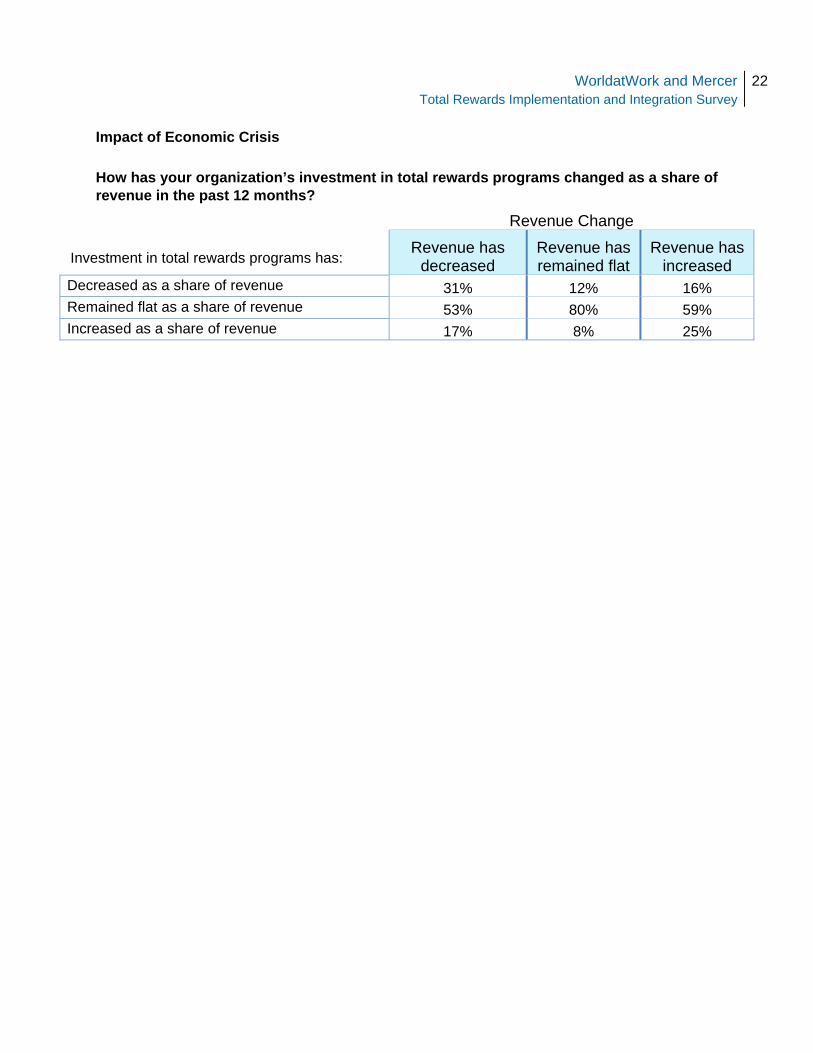
Impact of Economic Crisis How has your organization’s investment in total rewards programs changed as a share of revenue in the past 12 months?
Revenue Change
Investment in total rewards programs has: Revenue has
decreased Revenue has remained flat
Revenue has increased
Decreased as a share of revenue 31% 12% 16% Remained flat as a share of revenue 53% 80% 59% Increased as a share of revenue 17% 8% 25%
WorldatWork and MercerTotal Rewards Implementation and Integration Survey
23
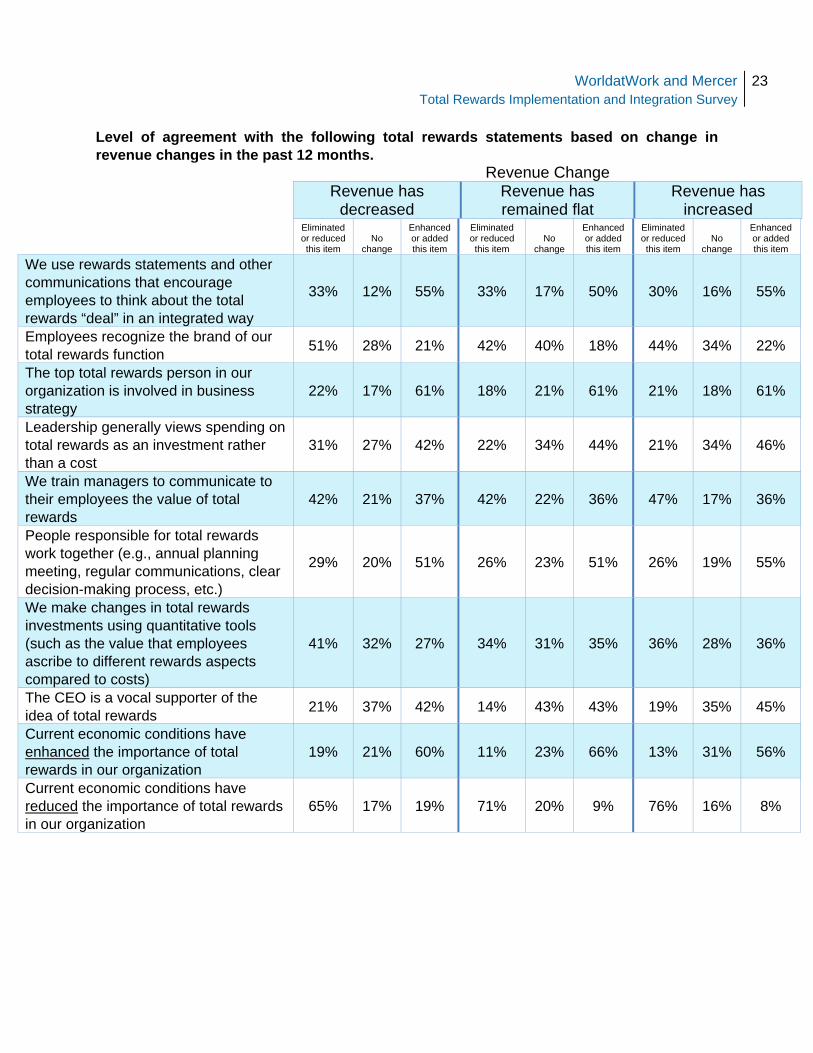
Level of agreement with the following total rewards statements based on change in revenue changes in the past 12 months.
Revenue Change Revenue has
decreased Revenue has remained flat
Revenue has increased
Eliminated or reduced this item
No change
Enhanced or added this item
Eliminated or reduced this item
No change
Enhanced or added this item
Eliminated or reduced this item
No change
Enhanced or added this item
We use rewards statements and other communications that encourage employees to think about the total rewards “deal” in an integrated way
33% 12% 55% 33% 17% 50% 30% 16% 55%
Employees recognize the brand of our total rewards function 51% 28% 21% 42% 40% 18% 44% 34% 22%
The top total rewards person in our organization is involved in business strategy
22% 17% 61% 18% 21% 61% 21% 18% 61%
Leadership generally views spending on total rewards as an investment rather than a cost
31% 27% 42% 22% 34% 44% 21% 34% 46%
We train managers to communicate to their employees the value of total rewards
42% 21% 37% 42% 22% 36% 47% 17% 36%
People responsible for total rewards work together (e.g., annual planning meeting, regular communications, clear decision-making process, etc.)
29% 20% 51% 26% 23% 51% 26% 19% 55%
We make changes in total rewards investments using quantitative tools (such as the value that employees ascribe to different rewards aspects compared to costs)
41% 32% 27% 34% 31% 35% 36% 28% 36%
The CEO is a vocal supporter of the idea of total rewards 21% 37% 42% 14% 43% 43% 19% 35% 45%
Current economic conditions have enhanced the importance of total rewards in our organization
19% 21% 60% 11% 23% 66% 13% 31% 56%
Current economic conditions have reduced the importance of total rewards in our organization
65% 17% 19% 71% 20% 9% 76% 16% 8%
WorldatWork and MercerTotal Rewards Implementation and Integration Survey
24
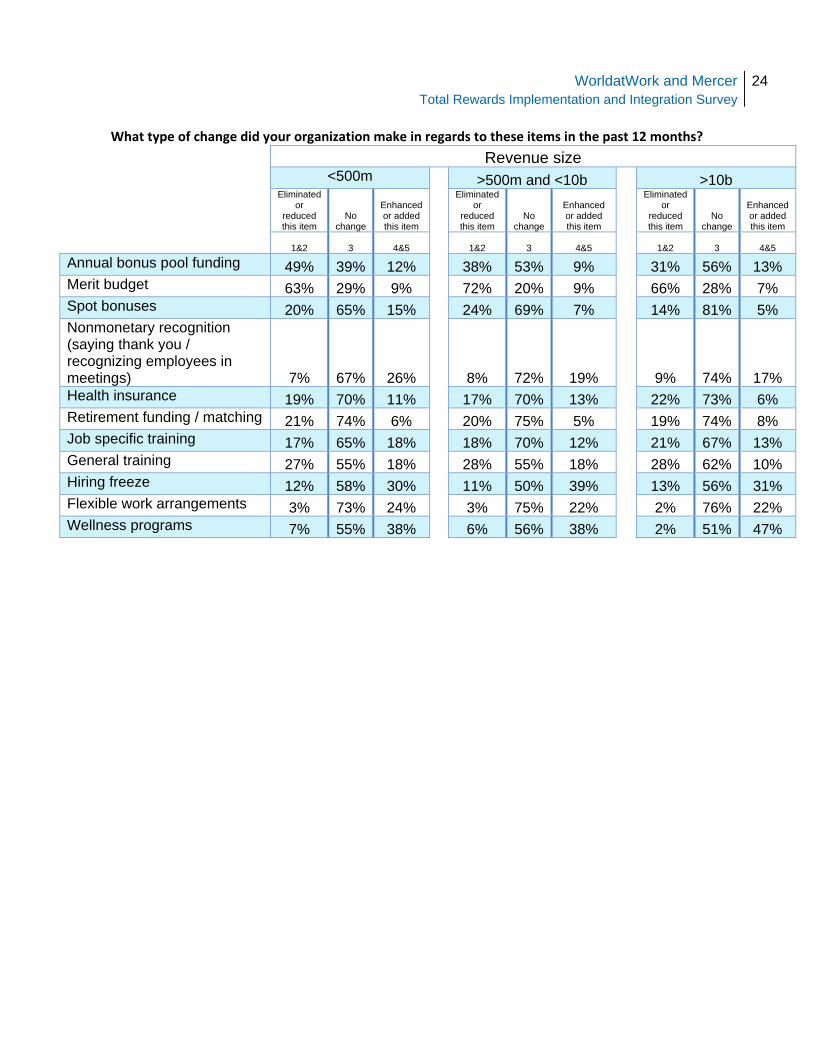
What type of change did your organization make in regards to these items in the past 12 months?
Revenue size <500m >500m and <10b >10b
Eliminated or
reduced this item
No change
Enhanced or added this item
Eliminated or
reduced this item
No change
Enhanced or added this item
Eliminated or
reduced this item
No change
Enhanced or added this item
1&2 3 4&5 1&2 3 4&5 1&2 3 4&5
Annual bonus pool funding 49% 39% 12% 38% 53% 9% 31% 56% 13% Merit budget 63% 29% 9% 72% 20% 9% 66% 28% 7% Spot bonuses 20% 65% 15% 24% 69% 7% 14% 81% 5% Nonmonetary recognition (saying thank you / recognizing employees in meetings) 7% 67% 26% 8% 72% 19% 9% 74% 17% Health insurance 19% 70% 11% 17% 70% 13% 22% 73% 6% Retirement funding / matching 21% 74% 6% 20% 75% 5% 19% 74% 8% Job specific training 17% 65% 18% 18% 70% 12% 21% 67% 13% General training 27% 55% 18% 28% 55% 18% 28% 62% 10% Hiring freeze 12% 58% 30% 11% 50% 39% 13% 56% 31% Flexible work arrangements 3% 73% 24% 3% 75% 22% 2% 76% 22% Wellness programs 7% 55% 38% 6% 56% 38% 2% 51% 47%
WorldatWork and MercerTotal Rewards Implementation and Integration Survey
25
Total Rewards Integration Analysis Low- to mid-scoring organizations vs. mid- to high-scoring organizations
A total rewards integration index was calculated using the following integration statements:
• We use rewards statements and other communications that encourage employees to think about the total rewards “ deal” in an integrated way
• Employees recognize the brand of our total rewards function • The top total rewards person in our organization is involved in business
strategy • Leadership generally views spending on total rewards as an investment
rather than a cost • We train managers to communicate to their employees the value of total
rewards • People responsible for total rewards work together (e.g., annual planning
meeting, regular communications, clear decision-making process, etc.) • We make changes in total rewards investments using quantitative tools
(such as the value that employees ascribe to different rewards aspects compared to costs)
• The CEO is a vocal supporter of the idea of total rewards.
Participants rated statements on a 5-point scale from strongly disagree to strongly agree. A rating of strongly agree received 5 points while a rating of strongly disagree received 1 point. The highest score possible for an organization is 40. Organizations were then divided into two groups,
• Low- to mid-total rewards integration (1-24 points acquired) • Mid- to high-total rewards integration (25-40 points acquired).
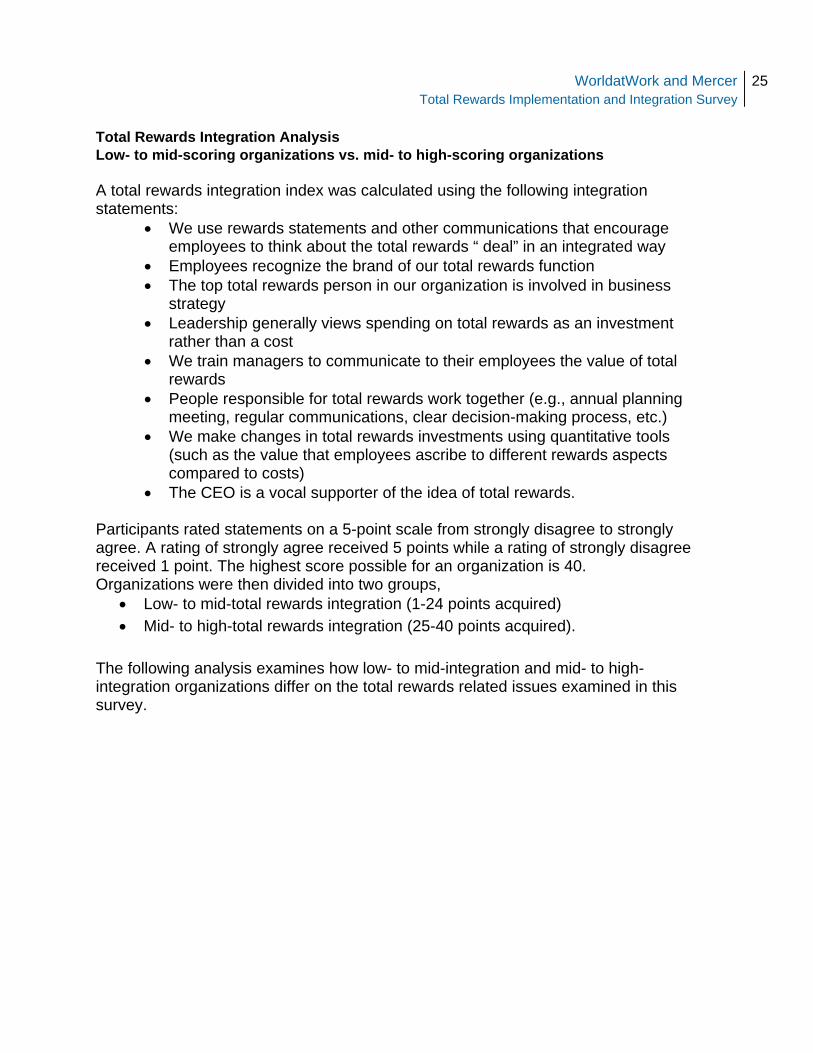
The following analysis examines how low- to mid-integration and mid- to high-integration organizations differ on the total rewards related issues examined in this survey.
WorldatWork and MercerTotal Rewards Implementation and Integration Survey
26
41%
42%
17%
15%
52%
33%
0% 10% 20% 30% 40% 50% 60%
Yes, it is the primary term we use
Yes, it is one of the terms we use
No, we do not use this term
Is “total rewards” a term that you use in your organization?
Low- to mid- integration scoring (1-24) Mid- to high- integration scoring (25-40)
3
6%
2%
4%
9%
9%
15%
6%
63%
60%
6%
2%
3%
3%
10%
13%
15%
63%
69%
0% 10% 20% 30% 40% 50% 60% 70% 80%
Other
“The Deal”
Human Capital
We only use the term “total rewards” and no other term
Human Resources
Employee Value Proposition
No particular term used frequently, but the concept is present
Total Compensation
Compensation & Benefits Package
What term(s) do you use in your organization to refer to the concept we refer to here as total rewards? (Check all that apply.)
Low- to mid- integration scoring (1-24) Mid- to high- integration scoring (25-40)
3 Mid- to high-scoring organizations were statistically more likely to report that the term “total rewards” was the primary term used in their organization (41%).
WorldatWork and MercerTotal Rewards Implementation and Integration Survey
27
4%
13%
37%
42%
53%
70%
65%
99%
100%
3%
9%
26%
27%
38%
50%
53%
98%
99%
0% 20% 40% 60% 80% 100% 120%
Other
Other
Intrinsic work factors (e.g., culture, leadership, work content, etc.)
Job specific training
Career development
Work-life programs (e.g. flexible working times, options to take extra vacation, sabbaticals, etc)
Recognition
Benefits (e.g. retirement, medical, etc.)
Compensation (e.g., base salary, incentives, guaranteed payments)
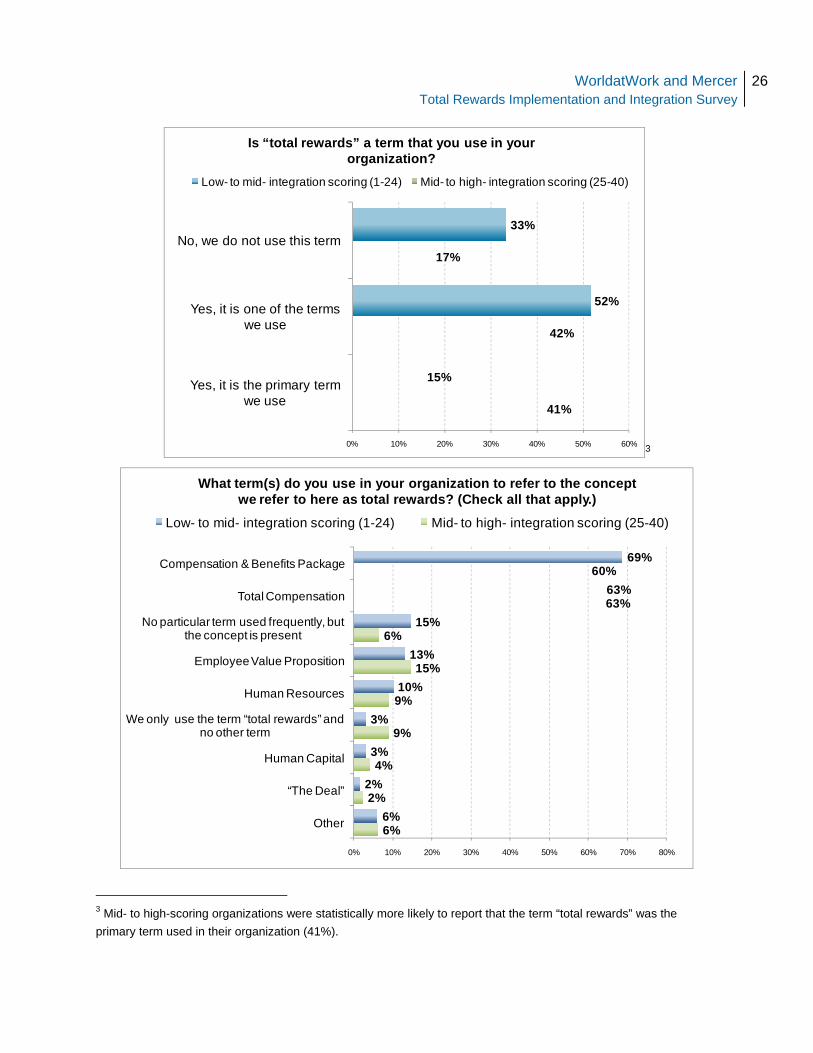
What is considered part of the definition of total rewards in your organization? (Check all that apply.)
Low- to mid- integration scoring (1-24) Mid- to high- integration scoring (25-40)
4
4 Mid- to high-scoring organizations are statistically more likely to include recognition, work-life programs, career development and job specific training in their total rewards definition.
WorldatWork and MercerTotal Rewards Implementation and Integration Survey
28
26%
61%
14%17%
67%
16%
0%
10%
20%
30%
40%
50%
60%
70%
Decreased relative to revenue
Flat relative to revenue
Increased relative to revenue
How has your organizations investment in total rewards programs changed / relative to revenue in the
organization?Low- to mid- integration scoring (1-24) Mid- to high- integration scoring (25-40)
54%
25%21%
47%
30%
24%
0%
10%
20%
30%
40%
50%
60%
Decreased No change Increased
How has revenue changed for your organization in the past 12 months
Low- to mid- integration scoring (1-24) Mid- to high- integration scoring (25-40)
WorldatWork and MercerTotal Rewards Implementation and Integration Survey
29
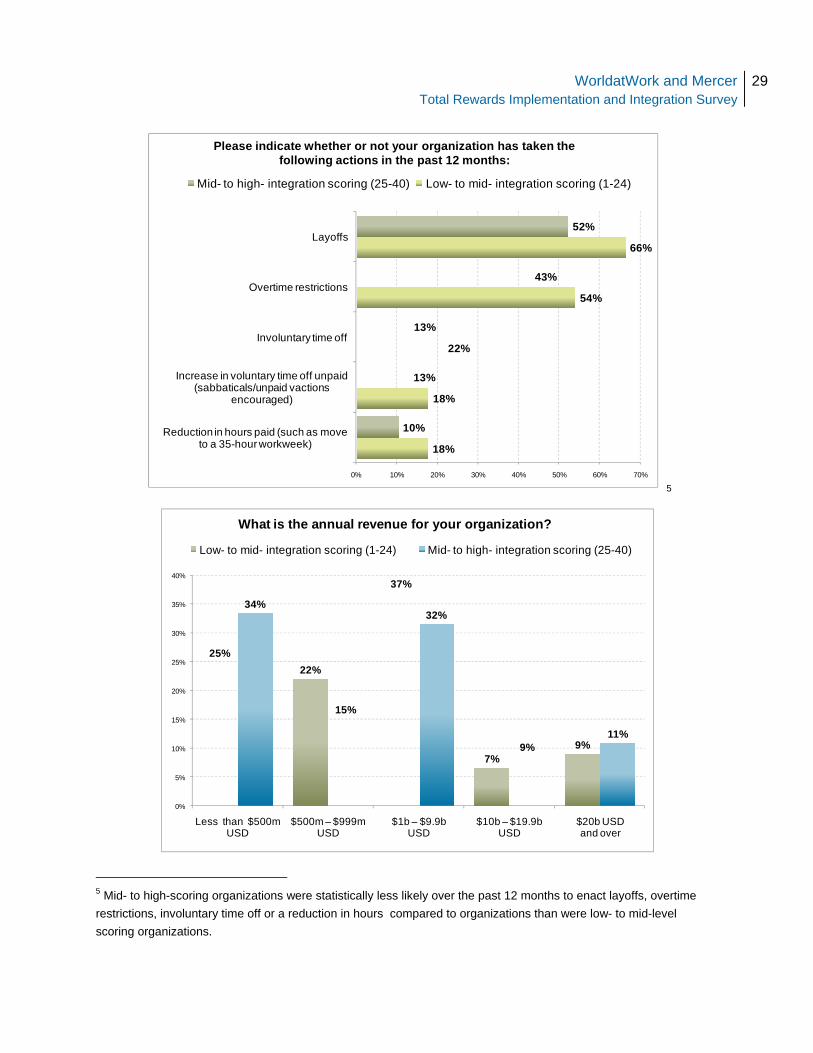
18%
18%
22%
54%
66%
10%
13%
13%
43%
52%
0% 10% 20% 30% 40% 50% 60% 70%
Reduction in hours paid (such as move to a 35-hour workweek)
Increase in voluntary time off unpaid (sabbaticals/unpaid vactions
encouraged)
Involuntary time off
Overtime restrictions
Layoffs
Please indicate whether or not your organization has taken the following actions in the past 12 months:
Mid- to high- integration scoring (25-40) Low- to mid- integration scoring (1-24)
5
25%22%
37%
7%9%
34%
15%
32%
9%11%
0%
5%
10%
15%
20%
25%
30%
35%
40%
Less than $500m USD
$500m – $999m USD
$1b – $9.9b USD
$10b – $19.9bUSD
$20b USD and over
What is the annual revenue for your organization?
Low- to mid- integration scoring (1-24) Mid- to high- integration scoring (25-40)
5 Mid- to high-scoring organizations were statistically less likely over the past 12 months to enact layoffs, overtime restrictions, involuntary time off or a reduction in hours compared to organizations than were low- to mid-level scoring organizations.