Embed Size (px)
Citation preview
A Research On Consumers’ Attitudes Towards Marketing The case of Vietnam
Authors: Phan Nguyen Thien Thanh Tran Quynh Mai
Supervisor: Gert-Olof Boström
Student Umeå School of Business Spring semester 2011 Master thesis, one-year, 15 hp
Umeå School of Business Author: Thanh Phan & Mai Tran Umeå University, Sweden Supervisor: Gert-Olof Boström Master thesis in Business Administration Spring Semester, 2011
i
ACKNOWLEDGMENT
We would like to give our greatest appreciation for the people who have supported us making this research possible. Without their encouragements we could not be successfully with our thesis.
First, we are profoundly thankful to our thesis supervisor, Gert-Olof Boström, who provided us with tremendous valuable advices. We are very lucky to have him as our supervisor as he always filling us with confidence from very primary time of the research till the end of the thesis process.
The second group of people that we want to acknowledge is our families and friends in Vietnam. During the data collection process, we have had put a heavy burden on them as they have to take full responsibility. Without their helps, we cannot have the study complete with accuracy and in time. And for that, we would like to show them the deepest gratitude from our hearts.
Next, special thanks to all our friends in Umeå for all the fruitful discussions from academic issues to daily life topics, helping us to constantly improve our paper and making our time in Umeå much more enjoyable.
And at last but not least, we desire to express the grateful to Umea School of Business (USBE) for providing us a crucial base of knowledge on the field of marketing and business development. The knowledge that we already achieved through several course at USBE contributed a crucial part for the whole thesis working process. .
Phan Nguyen Thien Thanh Tran Quynh Mai
Umeå, May-2011
Umeå School of Business Author: Thanh Phan & Mai Tran Umeå University, Sweden Supervisor: Gert-Olof Boström Master thesis in Business Administration Spring Semester, 2011
ii
Abstract
The purpose of this paper is to present an alternative perspective of marketing, which is looking at the concept from a macro point of view, with a chosen country-Vietnam. There are three main goals that this investigation strives to achieve. In specific, it aims first to observe whether the Vietnamese consumers have favorable or unfavorable attitudes towards the marketing system that currently operating nationally. This is reached through an application of ICSM model, which based very much on the famous marketing mix paradigm (4Ps).
The second purpose of this thesis is to test whether Vietnam market exist the relationships between consumers’ sentiment toward marketing practices and customer satisfaction. The applied models in this case are Kano Model and ACSI model where it proposed that the relationship exits. Thirdly, as Vietnam is a developing country, the role of government is expected to have an effect on the issue of marketing practice, which implicitly can influence the variables of consumer attitude and consumer satisfaction. Therefore, we took this opportunity to determine whether it is the case and reflects that with results from previous studies.
And above all, demographic factors including age, gender, education background, and occupation are tested against the three main variables of attitude, satisfaction, and government.
To achieve all the three main goals, we adopt quantitative research strategy with self-completed questionnaires. A total sample of 445 respondents is obtained from two biggest cities of Vietnam- Hanoi and Ho Chi Minh City. The analyzed results show that Vietnamese consumers are much more favorable to the current marketing activities, in comparison to other countries with well-developed economic situation. Moreover, the results also proved that there is positive relationship between the two pairs of variable: attitude - satisfaction, and government regulations - satisfaction; while between government and attitude, a negative correlation is found. Finally, the statistics also shows that demographic factors do have correlation on the variables though some are more influential than others.
Key words: consumer sentiment, macro marketing, Vietnam
Umeå School of Business Author: Thanh Phan & Mai Tran Umeå University, Sweden Supervisor: Gert-Olof Boström Master thesis in Business Administration Spring Semester, 2011
iii
Table of contents
1 INTRODUCTION ......................................................................................................................1
1.1 CHOICE OF SUBJECT ................................................................................................................... 1 1.2 BACKGROUND ............................................................................................................................. 2 1.3 PROBLEM FORMULATION ........................................................................................................... 4 1.4 PURPOSE ..................................................................................................................................... 4
1.5 RESEARCH SCOPE ....................................................................................................................... 5 1.6 THESIS STRUCTURE OUTLINE ..................................................................................................... 5
1.7 COUNTRY BACKGROUND ............................................................................................................ 6 1.7.1 COUNTRY FACTS ...................................................................................................................... 7
1.7.2 ECONOMIC OVERVIEW .............................................................................................................. 7
1.7.3 SETTING THE SCENE: DIFFERENCES BETWEEN TWO CITIES – HOCHIMINH VS. HANOI ................. 8
2 RESEARCH METHODOLOGY .....................................................................................................9
2.1 RESEARCH PHILOSOPHY ........................................................................................................... 10 2.1.1 EPISTEMOLOGY .......................................................................................................................... 10
2.1.2 ONTOLOGY ............................................................................................................................... 11
2.2 RESEARCH STRATEGY .............................................................................................................. 12 2.3 DATA COLLECTION METHOD .................................................................................................... 14
2.3.1 PRIMARY DATA COLLECTION .......................................................................................................... 15
2.3.2 SECONDARY DATA COLLECTION ...................................................................................................... 16
2.4 QUALITY CRITERIA ................................................................................................................... 16 2.4.1 RELIABILITY ............................................................................................................................... 17
2.4.2 VALIDITY .................................................................................................................................. 17
2.5 ETHICAL CONSIDERATIONS ...................................................................................................... 17
2.6 METHODOLOGICAL LIMITATION ............................................................................................. 18
3 LITERATURE REVIEW ............................................................................................................. 19
3.1 DEFINITION OF MARKETING .................................................................................................... 20
3.2 THE MARKETING M IX .............................................................................................................. 21 3.3 CONSUMER ATTITUDE , AND CONSUMER SATISFACTION TOWARD MARKETING ..................... 24 3.3.1 CUSTOMER BEHAVIOR ................................................................................................................. 26
3.3.2 CUSTOMER ATTITUDE TOWARD MARKETING BROUGHT UP IN PREVIOUS STUDIES ....................................... 27
3.3.3 CUSTOMER SATISFACTION ............................................................................................................ 28
3.3.4 CUSTOMER VALUES AND SATISFACTION ........................................................................................... 30
3.3.5 MONITORING SATISFACTION ......................................................................................................... 31
3.4 GOVERNMENT REGULATIONS ................................................................................................... 32
Umeå School of Business Author: Thanh Phan & Mai Tran Umeå University, Sweden Supervisor: Gert-Olof Boström Master thesis in Business Administration Spring Semester, 2011
iv
3.5 SUMMARY FINDINGS FROM LITERATURE REVIEW ................................................................... 33
4 RESEARCH METHOD (II) ......................................................................................................... 34
4.1 HYPOTHESIS CONSTRUCTION ................................................................................................... 34
4.2 THE INSTRUMENT ..................................................................................................................... 36 4.2.1 QUESTIONNAIRE DESIGN .............................................................................................................. 36
4.2.2 COMPUTATION OF SENTIMENT SCORE ............................................................................................. 37
4.3 PRACTICAL DATA COLLECTION ............................................................................................... 38
4.4 DATA PROCESS AND ANALYSIS ................................................................................................. 39
4.4.1 CODING ................................................................................................................................... 39
4.4.2 STATISTICAL PROCESSING ............................................................................................................. 39
5 EMPIRICAL FINDINGS ............................................................................................................ 41
5.1 SAMPLE STRUCTURE ................................................................................................................. 41 5.2 RELIABILITY OF CONSUMER SENTIMENT SCALE ...................................................................... 42
6 ANALYSIS AND DISCUSSION .................................................................................................. 44
6.1 V IETNAMESE CONSUMER INDEX TOWARDS MARKETING ......................................................... 44 6.1.1 THE MEAN OF IMPORTANCE FOR EACH CATEGORY .............................................................................. 44
6.1.2 COMPUTING OF THE INDEX ........................................................................................................... 45
6.2 THE RELATIONSHIP BETW EEN CONSUMER ATTITUDE AND CONSUMER SATISFACTION ........... 47 6.3 THE ATTITUDE ON GOVERNMENT ROLE ................................................................................... 49
6.3.1 DESCRIPTIVE STATISTICS ON GOVERNMENT INTERVENTION ................................................................... 50
6.3.2 THE RELATIONSHIP BETWEEN CUSTOMER ATTITUDE TOWARDS MARKETING AND THE EXPECTATION ON
GOVERNMENT INTERVENTION ....................................................................................................................... 51
6.3.3 DIFFERENCES ACROSS DEMOGRAPHIC GROUPS .................................................................................. 53
6.4 RESULT SUMMARY .................................................................................................................... 55 6.5 COMPARING FINDINGS WITH THEORIES IN LITERATURE REVIE W ........................................... 55
7 CONCLUSION ........................................................................................................................ 58
7.1 GENERAL CONCLUSION ............................................................................................................ 58 7.2 THEORETICAL CONTRIBUTIONS OF THE STUDY ....................................................................... 58 7.3 RECOMMENDATIONS FOR MANAGERS AND GOVERNMENT ...................................................... 59 7.4 FURTHER STUDIES .................................................................................................................... 60
REFERENCE LIST ........................................................................................................................ 61
Umeå School of Business Author: Thanh Phan & Mai Tran Umeå University, Sweden Supervisor: Gert-Olof Boström Master thesis in Business Administration Spring Semester, 2011
v
List of figures Figure 1 - The thesis structure outline (Own production) ......................................................................... 6
Figure 2 - Key differences between Hanoi & Ho Chi Minh City (Source: Government Statistical Yearbook
of Vietnam ; Nielsen Vietnam Surveys and Nielsen Vietnam Omnibus and gso.gov.vn) ............................ 8
Figure 3 - The research onion (Sauders et al. 2007, p. 124) ...................................................................... 9
Figure 4 - Quantitative Research Methods (Source: Shiu et al., 2008, p.171) .......................................... 13
Figure 5 - Quantitative strategy of Inquiries (Adopted & Summarized from Creswell, 2007, p.35 & 41) .. 14
Figure 6 - Summary of research methodology process (Own production) .............................................. 14
Figure 7 - Concept Map of Literature Review (Own production) ............................................................. 19
Figure 2 - The Marketing Mix (Kotler, 2005, p.63) .................................................................................. 23
Figure 3 - The ACSI model (www.theacsi.org) ........................................................................................ 25
Figure 10 - The Kano Model of Customer satisfaction (Source: Lighter D.E, 2011, p.38) ......................... 30
Figure 11 - The conceptual framework of hypothesis construction ........................................................ 35
Figure 12 - Factor analysis of Government variables .............................................................................. 51
List of equation(s)
Equation 1 – Formulation calculating Index of Consumer Sentiment (Tsang-Sing & Geng, 2004) ............ 38
Umeå School of Business Author: Thanh Phan & Mai Tran Umeå University, Sweden Supervisor: Gert-Olof Boström Master thesis in Business Administration Spring Semester, 2011
vi
List of tables Table 2 - Comparison of sentiment Index scores across countries (Source: Ahmed S. F., Batul T., 2008,
p.487) .................................................................................................................................................... 28
Table 3 - Coding of items in SPSS ........................................................................................................... 39
Table 4a - Sample structure on location ................................................................................................. 41
Table 5 - Measure of reliability for components after purification.......................................................... 43
Table 6- Mean value of importance weight ............................................................................................ 44
Table 7- The national consumer attitude index towards marketing between different countries ........... 46
Table 8 - Overall index and comparison across demographic variables .................................................. 46
Table 9 - Factor Analysis (Satisfaction) ................................................................................................... 48
Table 10 - Factor Analysis (Attitude) ...................................................................................................... 48
Table 11 - Coefficients between consumer attitude towards marketing and consumer satisfaction ....... 49
Table 12 - Model summary .................................................................................................................... 49
Table 13 - Model summary of consumer attitude towards marketing and consumer satisfaction........... 49
Table 14 - The mean value of Vietnamese consumer expectation on government role .......................... 50
Table 15 - Independent T-test for Government regulation between two locations ................................. 51
Table 16–Total variances Explained by ................................................................................................... 51
Table 17 - Correlation analysis between Government and Attitude ....................................................... 52
Table 18 - Correlation between customer satisfaction and government intervention............................. 52
Table 19 - ANOVA table for testing differences between education background groups ........................ 53
Table 20 - ANOVA table for testing differences between occupation groups .......................................... 54
Table 21 - ANOVA table for testing differences between age group ....................................................... 54
Table 22 - Independent T-test for differences between Hanoi & Ho Chi Minh City ................................. 54
Table 23 - Independent T-test for differences between male & female .................................................. 55
Table 24 - Summary of key findings ....................................................................................................... 55
Table 25 - Descriptive statistics for Occupation .................................................................................. www
Table 26 - Descriptive statistics for location ....................................................................................... www
Table 27 - Cross tabs between age groups ............................................................................................ xxx
Table 28 - F- test and Independent Samples Test (T-test) for group differences in variable GOV ........... xxx
Umeå School of Business Author: Thanh Phan & Mai Tran Umeå University, Sweden Supervisor: Gert-Olof Boström Master thesis in Business Administration Spring Semester, 2011
1
1. Introduction In the first chapter, the authors intend to provide readers with a brief introduction to the thesis. The background and the motivations for the authors to take up the topic are outlined. Next, readers will find the descriptions of the thesis’s goals, purposes, and delimitations. Concluding the chapter is the outline of the chosen paper structure.
1.1 Choice of subject First of all, as business students, it is natural to set our interests on understanding the driving forces and movements within a market, especially developing ones as they tend to be in rapid change. When it comes down to the choice of country, Vietnam has captured our intention. Since the opening for the development of market-economy, Vietnam has been overwhelmed with foreign investments, resulting in an annual growth of 5% (Nielson Pocket Research Book, 2010). According to the market research studies by Nielson (Consumer Index in 2009 & 2010), Vietnamese consumer confidence was plummeting. Businesses would see this as a great opportunity to increase customers’ consumption level. In order to promote further products’ purchasing, there are different strategies that can be adopted by each and individual companies and marketing is among the vital tool. Thus, getting the right perception on customers’ mind are important from the practical point of view.
Secondly, from the theoretical point of view, there have been different studies regarding consumers’ attitudes on the reality of marketing practices in many developed countries. In America, longitudinal studies are done to track changes over time; and thus, keep businesses up-to-date, and enable them to constantly revise their marketing strategies to keep up with the trends. However, few researches have been taken place in transitional economy or less developed countries and even among transitional economies, many researchers have focused on China and Middle East. However, according to Tsang-Sing and Geng, (2004, p.13) transitional economies possess very distinctive and vulnerable characteristics even when compared to one another. Therefore, it would not be sufficient to make the research findings in one area generalized to another (Tsang-Sing and Geng, 2004, p.12). Thus, it drives us to the question of whether there is a distinct difference(s) in consumer attitudes towards marketing between developed and developing countries. As the question has not been confirmed yet by any primary research; a theoretical contribution would be made by adopting the topic.
Besides all these objective rationales for making the research out of this idea, we admit the fact that being born and raised in Vietnam was the “hidden” driving force for us to carry out a project towards our homeland market.
Umeå School of Business Author: Thanh Phan & Mai Tran Umeå University, Sweden Supervisor: Gert-Olof Boström Master thesis in Business Administration Spring Semester, 2011
2
The discussion above was set to urge the authors to expand the geographical scope of this study type to a developing or transitional economy, which chosen to be Vietnam.
1.2 Background The marketing discipline, for a period of over half a century, has been influenced by a paradigm that can be condensed into two words: micro and managerial. In fact, within an expanding body of literature, the majority of researches focus on specific products or companies, e.g. aiming at determine any hidden dissatisfaction of customers. Actually, out of approximately 200 journals working with marketing (Data extracted from American Marketing Association, 2010), only one uses the word “macro” in its title and only some others approach marketing from a broader public policy or societal point of view (see, for example, Journal of Public Policy and Marketing, Journal of Macro-marketing). According to Wilkie and Moore (2006, p.217), macro-marketing involves the comprehension, explanation and prediction of the effects that the marketing system can have, and is having, on the world. Few researchers have strived to make an effort on filling in the missing; yet the sufficiency of it is still arguable (Peterson & Ekici., 2007; Gaski, 2008).
Therefore, this has evoked the sense of absolute lacking for studies on macro or system levels as according to Rosenbloom and Dimitrova (2011, p.55). Thus, the same authors suggested that a different marketing system should be adopted in parallel in order to obtain better rounded view of marketing. Yet, the term “macro” is as wide as people can image, require researcher(s) to narrow down for a more specific and feasible investigating topic. Looking closer at the limited existing span of literature on macro-marketing, it is also divided into different research trends. One of the common types of research is to investigate and measure the consumer attitude towards marketing, which in many paper referred to as the index of consumers’ sentiment towards national marketing activities (Barkslade & Darden, 1972; Gaski & Etzel, 1986). Dated back in time, the marketing and consumers’ behavior literature has marked number of efforts to develop a global measuring scale of consumers’ satisfaction with business world in general. The US is an exemplified country who is pioneer in this sphere. The country even maintains the study as a longitudinal research, tracking down market information annually (Barkslade & Darden, 1972; Hustad & Pessemier, 1973; Lundstrom & Lamont, 1976; Gaski & Etzel, 1986, 2005). Other countries that pursuit similar studies include England, Australia, Canada, Norway, etc., which mainly in industrialized countries and emerging nations (Barksdale & Darden, 1972; Gaski & Etzel, 1986, 2005, 2008; Wee & Chan, 1989; Chan et al., 1990; Lysonski et al., 2003; Tsang-Sing and Geng, 2004).
All of these examples of previous studies suggest the importance and usefulness of this area. It is now a fact that the world has become a place where marketing systems in the developing world matter more and more to marketers, especially in the period of increasing globalization, where market, nation states, and technologies integrated Rosenbloom and Dimitrova (2011, p.53). Yet, Douglas and Craig (2006, p.218) note that the role of marketing in developing countries is sadly
Umeå School of Business Author: Thanh Phan & Mai Tran Umeå University, Sweden Supervisor: Gert-Olof Boström Master thesis in Business Administration Spring Semester, 2011
3
neglected. On account of the lower incomes, lack of consumer information, and poorly developed marketing infrastructure, the same scholar suggested that relevant issues may be strikingly different between different country sets.
In fact, extremely few have been done in the other areas of the world except two exemplified ones on India market (Varadarajan & Thirunarayana, 1990) and a recent one from Bangladesh market (Ahmed & Batul, 2008). Both of the studies suggest a varied in results comparing to similar researches done in industrialized countries. In this case, the expected difference would be the “Index of customers’ sentiment towards marketing”. As we understand the importance of this study, the first part of this thesis will focus on adding to the list of another country of interest and to compare with other nations who in different economic state. This raise as our first alert of theoretical contribution as this thesis will make as we set ourselves to investigate on the marketing system based in a developing/transitional country.
However, it would be limited if we only take a snapshot of the current situation while neglecting the surrounding factors that considerably shape the consumerism movement. This leads us to the second section of this thesis. From the previous studies on consumers’ attitudes toward marketing, it has been found that there is a distinguishable change in sentiments (Lysonski et al., 2003; Gaski and Etzel, 2005) which somehow has led to the change in consumer satisfaction over the purchased merchandises. However, the link between those has not yet been proven with much empirical results. Tsang-Sing and Geng (2004, p.13) suggest that economic development and governmental reforms are the two vital factors that bring about the emerging of consumers’ market and increasing in consumers’ power. Regarding the second factor, it is said that the magnitude of change in consumers attitude, whether significant or nominal, has much to do with the stage of industrialization of the country in-query is experiencing and the role of government on the issue of consumerism (Ahmed & Batul, 2008, p.483). Even though with some developments in governmental activities, consumers in developing countries are still largely left unprotected as the existing laws of consumers’ protection are yet to be considered as based on “let the buyer beware” (Ahmed & Batul, 2008, p.482; Suk-ching, 2001, p.65).
In like manner, the Vietnamese market is operating under the philosophy of “let the buyer beware”. With such operating philosophy, it is rather common to observe false claims by manufacturers and marketers; while consumers are left legally unprotected and usually with no remedy from the companies for faulty or misrepresented products. Several reasons including a lack of customers’ knowledge, lack of governmental control, and low importance of consumers’ satisfaction towards companies can be accounted for this. In Vietnam, though increasing in number of multinationals company, most firms remain limited on their operating scope and mostly focus on retail sales. Apart from multinational firms, a huge proportion of Vietnamese companies are not much concerned with their reputation being tarnished by consumers’ complaints. Moreover, the lack of strict government control has “encouraged” companies to be
Umeå School of Business Author: Thanh Phan & Mai Tran Umeå University, Sweden Supervisor: Gert-Olof Boström Master thesis in Business Administration Spring Semester, 2011
4
able to take customers for a ride. As the result, consumers’ frustration and dissatisfaction have been rising and companies start to realize that they can no longer take consumers’ goodwill for granted any more (Tuoi tre News at tuoitre.vn, Thanh Nien Newspaper at thanhnien.com.vn).
Thus, our goal is to first determine whether the Vietnamese consumers are satisfied with the current marketing system, the offering product range. Second, we aim to test the linkage between consumers’ attitude towards marketing and their satisfaction level if any correlations exit. And finally, the variable of consumers’ attitude is tested for relationship with expectation on government role on the issue of marketing activity regulation. With large population and growing affluence, a burgeoning economy like Vietnam has made it all important for local and international players to understand how consumers in this society perceive marketing and what the related factors are. Thereafter, obtaining the results would give a chance to make certain practical contributions towards the Vietnamese market and theoretical contribution to the field of macro-marketing.
1.3 Problem formulation From the discussed background, the authors realize that there is a gap between academic research and practical realities. Thus, we are urged to proceed with the main research question: “What is the difference(s) between developing countries with transitional economy (such as Vietnam), and other countries in terms of consumers’ attitude on marketing practices?”
In order to answer this main research problem, the following questions are needed to be unzipped:
- Firstly, what is the Vietnamese national consumers’ attitudes regarding the four areas of marketing mix, namely price, product, promotion and place?
- Secondly, what is the difference(s), if any, between Vietnamese consumers’ groups when it comes to sentiment towards marketing??
- Thirdly, what is the connection level, if any, between three factors, namely consumers’ attitude, consumers’ satisfaction, and consumers’ expectations on government regulations?
1.4 Purpose As there seems to be a dearth of studies focusing on consumers’ attitude towards the functioning of marketing system in transitional countries like Vietnam; hence, this project attempts to achieve that. The overall objective and significance of this study is hoped to provide multinational as well as local firms operating in Vietnam with strategic marketing intelligence in terms of in depth understanding of different consumers’ group towards various marketing practices undertaken in the context of transitional economy
Umeå School of Business Author: Thanh Phan & Mai Tran Umeå University, Sweden Supervisor: Gert-Olof Boström Master thesis in Business Administration Spring Semester, 2011
5
Secondly, through the use of quantitative research, the authors are interested in identifying the attitudes of Vietnamese customers in terms of their national marketing practices and customers’ satisfaction regarding the four marketing elements (i.e. product, price, promotion, and place).
The last purpose of this paper is to examine if there is any association between consumers’ attitudes, satisfaction of the marketing mix and perceptions of government role in Vietnam. Finally, the results obtained from the quantitative research, namely the average index of consumers’ sentiment towards marketing, will be compared with figures of similar studies from different geographic areas to observe if any differences.
1.5 Research scope Regarding the scope of this study, it focuses only on two cities of Vietnam, which is Hanoi and Ho Chi Minh City. Thus, the total surveyed respondents are proportionally smaller than the country population. Eventually, the result can likely be in a non-fully representative set of findings based on the data gathered.
Therefore, one of the limitation found is that there is slightly more respondents collected from Ho Chi Minh City than Hanoi. Though it was because the data collection process was easier in the prior city; we acknowledge the bias effect it will have on our findings.
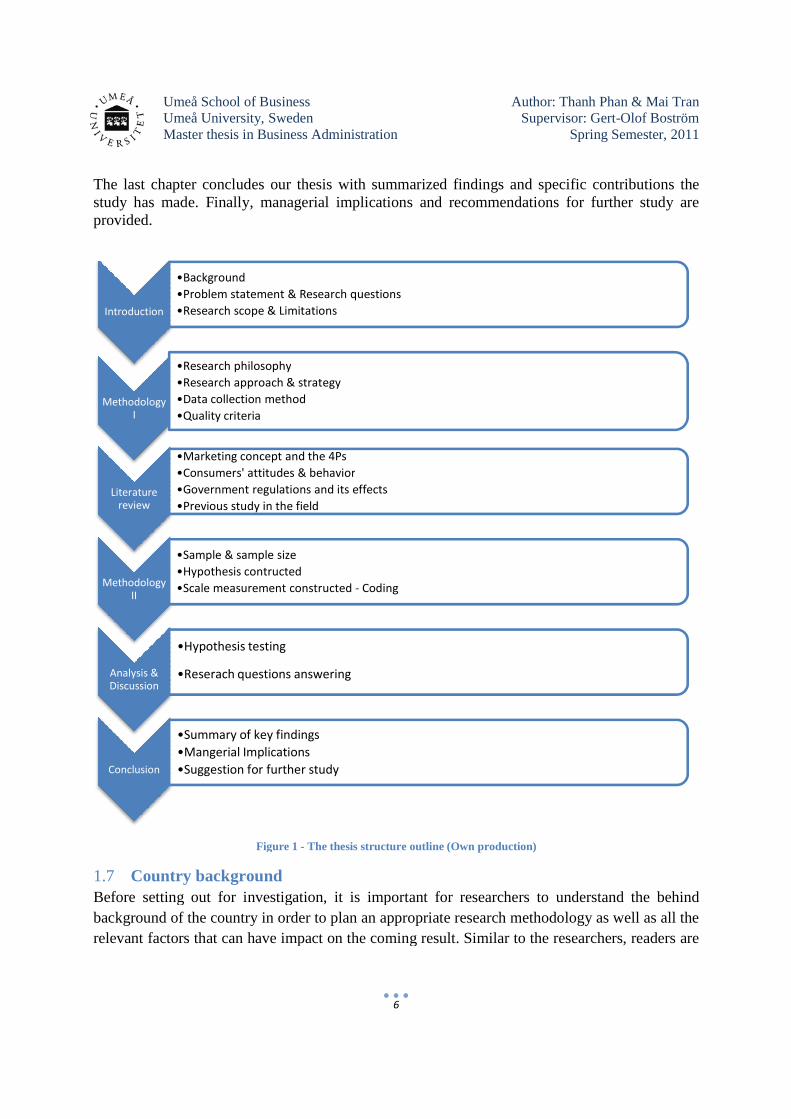
1.6 Thesis structure outline The first chapter provides an overview background of our study. Within the chapter, we discuss the rationales behind our chosen topic of customers’ attitudes in a developing country. The research purpose, problem formulation, research scope, and limitations are further described within this chapter. The second chapter illustrates the fundamental theoretical methodology. In specific, it outlines widely the research philosophy, strategy, design, data collection method, quality criteria, and ethical considerations. In the third chapter, related literature including theories, models, and previous studies on the field of marketing, consumer behavior, customer attitude, customer satisfaction, and government regulations. The forth chapter goes back to the issue of methodology though focusing more on the practical aspects, including questionnaire-item design, measuring scale development, hypothesis construction, and the actual collectable sample. The next chapter, chapter V, presents the data analysis procedures. The major findings are brought up. The model of cause-and-effect on customer attitude is tested with statistical techniques. As the result, we managed to answer all our research questions.
Umeå School of Business Umeå University, Sweden Master thesis in Business Administration
The last chapter concludes our thesis with summarized findings and specific contributions the study has made. Finally, managerial implications and recommendations for further study are provided.
Figure
1.7 Country backgroundBefore setting out for investigation, it is important for researchers to understand the behind background of the country in order to plan an appropriate research methodology as well as allrelevant factors that can have impact on the coming result. Similar to the researchers, readers are
Introduction
•Background
•Problem statement & Research questions
•Research scope & Limitations
Methodology I
•Research philosophy
•Research approach & strategy
•Data collection method
•Quality criteria
Literature review
•Marketing concept and the 4Ps
•Consumers' attitudes & behavior
•Government regulations and its effects
•Previous study in the field
Methodology II
•Sample & sample size
•Hypothesis contructed
•Scale measurement constructed
Analysis & Discussion
•Hypothesis testing
•Reserach questions answering
Conclusion
•Summary of key findings
•Mangerial Implications
•Suggestion for further study
Umeå School of Business Author: Thanh Phan & Mai TranUmeå University, Sweden SupervisorMaster thesis in Business Administration
6
udes our thesis with summarized findings and specific contributions the study has made. Finally, managerial implications and recommendations for further study are
Figure 1 - The thesis structure outline (Own production)
Country background Before setting out for investigation, it is important for researchers to understand the behind background of the country in order to plan an appropriate research methodology as well as allrelevant factors that can have impact on the coming result. Similar to the researchers, readers are
Problem statement & Research questions
Research scope & Limitations
Research philosophy
Research approach & strategy
Data collection method
Marketing concept and the 4Ps
Consumers' attitudes & behavior
Government regulations and its effects
Previous study in the field
Sample & sample size
Hypothesis contructed
Scale measurement constructed - Coding
Hypothesis testing
Reserach questions answering
Summary of key findings
Mangerial Implications
Suggestion for further study
Author: Thanh Phan & Mai Tran Supervisor: Gert-Olof Boström
Spring Semester, 2011
udes our thesis with summarized findings and specific contributions the study has made. Finally, managerial implications and recommendations for further study are
Before setting out for investigation, it is important for researchers to understand the behind background of the country in order to plan an appropriate research methodology as well as all the relevant factors that can have impact on the coming result. Similar to the researchers, readers are
Umeå School of Business Author: Thanh Phan & Mai Tran Umeå University, Sweden Supervisor: Gert-Olof Boström Master thesis in Business Administration Spring Semester, 2011
7
required to have the background as a reference material for evaluating different aspects of the investigation
1.7.1 Country facts According to the data on CIA Fact Book (www.cia.gov) Vietnam is located in South East Asia, and has a total area of 331,210 sq km. The country total population is estimated at 90,549,390 (July 2011 est.) and placed as the fourteenth most populous country in the world. The vast majority of the population is Vietnamese with a minute proportion of Chinese. The country age structure (2011 est.) is:
• 0-14 years: 25.2% (male 11,945,354/female 10,868,610) • 15-64 years: 69.3% (male 31,301,879/female 31,419,306) • 65 years and over: 5.5% (male 1,921,652/female 3,092,589)
For administrative purposes, the country is divided into 58 cities and provinces. Among those, Hanoi and HCMC are the two biggest ones with growing urbanization and population migration rapidly degrading places.
1.7.2 Economic overview Lyster (1997, p.52) mentioned in one of his article magazine about Vietnam: “the country holds great potential growth due to its inner-resources, geographical position, and relation to other neighboring countries”. Vietnam is a member within the South East Asia grouping country, considering as the world’s leading emerging market with the recorded collective GDP value is of nearly $1 trillion dollars.
The country, since normalization established with the United States -by 1995), has substantially accrued and boosted the economic development; hence, attracting significant interests for foreign direct investment. While remain struggling due to inescapable issues attached to the transnational process (e.g. dense population, ill-literacy…etc.), the Vietnamese economy has been strengthened since 1990s with a steady growth rate of 8 to 10% (Le, 1999, p.42). According to the Vietnam Living Standards survey (1997-1998), the proportion of the poor has declined from 58 to 37 percent, between the period of 1993 and 1998 (Quan Xuan D., 2000, p.360). Between 1993 and 1997, the number of private companies grew by 40% per year, which consequently improved the private sector employment. Of significant fact is that the majority of private sector comprise of retail shops or small manufacturing enterprises which entail from expansion of house-entrepreneurs and new entries. For a long time, Vietnam has had yet developed any formal program for privatization
When the financial crisis hit in 1997, the Vietnamese economy marked a great challenge and the GDP dropped by 2% in 1998 and another 1% in 1999; though, in 2000-02, the economy grew its way back to 6-7% and continued to keep constant. For the 1st quarter of 2011, the economic growth has marked at 6.8% (Tuoitre News, 2011 at tuoitre.vn).
Umeå School of Business Umeå University, Sweden Master thesis in Business Administration
Population: 7.1 million 3.4 Mil Male 3.7 Mil Female 20-24 age group = 13% of population 13% of people have AirCon &/or heaters in their home 19% use internet every day 51% Mobile ownership 20% total Vietnam GDP from Ho Chi Minh City $368 – Average Monthly Household income
Many international firms have found their potential in middlehighly exposed to Western products and lifestyleshows a rather resembling factglobalization of business takes place in Vietnam, researchers sense the need to focus their investigation on cultural differences and changing of behaviors that are emerging in this transitional economy (Maheswaran &&Woodruff (2002, p.156) is one exemplified case whom case as the country lacks of formal market
1.7.3 Setting the scene: Differences between two As mentioned above, there are two biggest cities in Vietnam, attracting most firm operationwithin the territories. This proposes the appropriation when choosing these two cities to conduct our survey on. However, due to theyield results can be slightly dissimilar. This, though, will be one of the issues that thesis will aim to explore, i.e. whether or not the differences exit
Figure 2 - Key differences between Hanoi & Nielsen Vietnam Surveys and Nielsen Vietnam Omnibus
Umeå School of Business Author: Thanh Phan & Mai TranUmeå University, Sweden SupervisorMaster thesis in Business Administration
8
Hanoi
Hochiminh
Population:
Many international firms have found their potential in middle-class consumers as this group is highly exposed to Western products and lifestyle (Nielson Pocket Research Book, 2010)shows a rather resembling fact from a study of Cui & Liu (2001) on the Chinese marketglobalization of business takes place in Vietnam, researchers sense the need to focus their investigation on cultural differences and changing of behaviors that are emerging in this
Maheswaran &Shavit, 2000, p.64). Like other scholars, is one exemplified case whom considers Vietnam as an interesting
case as the country lacks of formal market-supporting institutions.
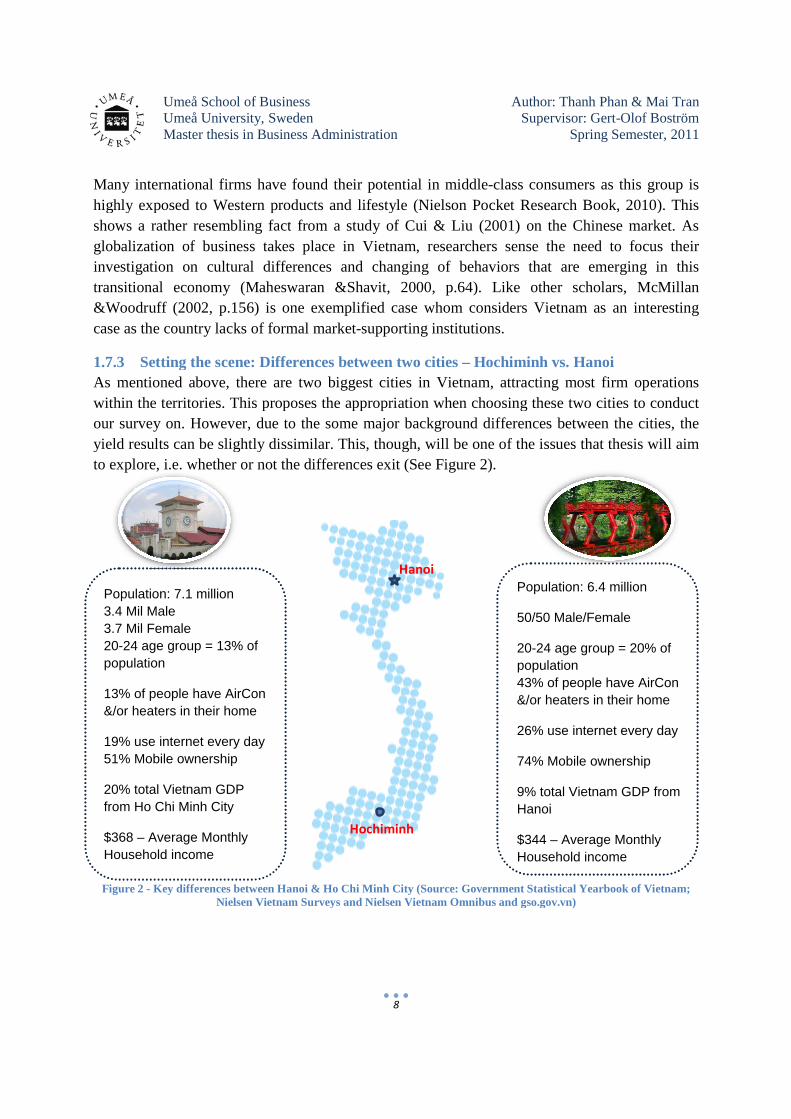
Setting the scene: Differences between two cities – Hochiminh vs. HanoiAs mentioned above, there are two biggest cities in Vietnam, attracting most firm operationwithin the territories. This proposes the appropriation when choosing these two cities to conduct our survey on. However, due to the some major background differences between the cities, the yield results can be slightly dissimilar. This, though, will be one of the issues that thesis will aim to explore, i.e. whether or not the differences exit (See Figure 2).
Key differences between Hanoi & Ho Chi Minh City (Source: Government StatisticNielsen Vietnam Surveys and Nielsen Vietnam Omnibus and gso.gov.vn
Author: Thanh Phan & Mai Tran Supervisor: Gert-Olof Boström
Spring Semester, 2011
class consumers as this group is (Nielson Pocket Research Book, 2010). This
& Liu (2001) on the Chinese market. As globalization of business takes place in Vietnam, researchers sense the need to focus their investigation on cultural differences and changing of behaviors that are emerging in this
Like other scholars, McMillan Vietnam as an interesting
Hochiminh vs. Hanoi As mentioned above, there are two biggest cities in Vietnam, attracting most firm operations within the territories. This proposes the appropriation when choosing these two cities to conduct
some major background differences between the cities, the yield results can be slightly dissimilar. This, though, will be one of the issues that thesis will aim
Statistical Yearbook of Vietnam; and gso.gov.vn)
Population: 7.1 million3.4 Mil Male3.7 Mil Female20-24 age group = 13% ofpopulation
13% of people have AirCon&/or heaters in their home
19% use internet every day51% Mobile ownership
20% total Vietnam GDPfrom Ho Chi Minh City
$368 – Average MonthlyHousehold income
Population: 6.4 million
50/50 Male/Female
20-24 age group = 20% ofpopulation43% of people have AirCon&/or heaters in their home
26% use internet every day
74% Mobile ownership
9% total Vietnam GDP fromHanoi
$344 – Average MonthlyHousehold income
Umeå School of Business Author: Thanh Phan & Mai Tran Umeå University, Sweden Supervisor: Gert-Olof Boström Master thesis in Business Administration Spring Semester, 2011
9
2. Research Methodology
In the chapter of introduction, research purpose and research problem are denoted. With this chapter, we wish to discuss in detail the research method that we applied. The main objective of this chapter is to outline the structure and assumptions of our chosen methodology (including research philosophy, approach, and strategy), in order to construct our argumentations and direct readers towards better understanding, as well as appropriate expectations. The chapter is finally concluded with ethical considerations and quality criteria.
From the very beginning chapter, Creswell (2009) talks in his book about how and why it is important to make an appropriate choice on research methodological plan. According to him, research design is considered as plans and procedures applied in a research with decisions goes from comprehensive problem background to narrowed data collection method and concrete analysis (Creswell, 2009, p.22). Those choices often involve founding steps, namely worldview assumption that researcher carry on to the project, “procedure of inquiries (commonly known as research strategy), explicit data collection method, analysis & reading (Creswell, 2009, p.23).
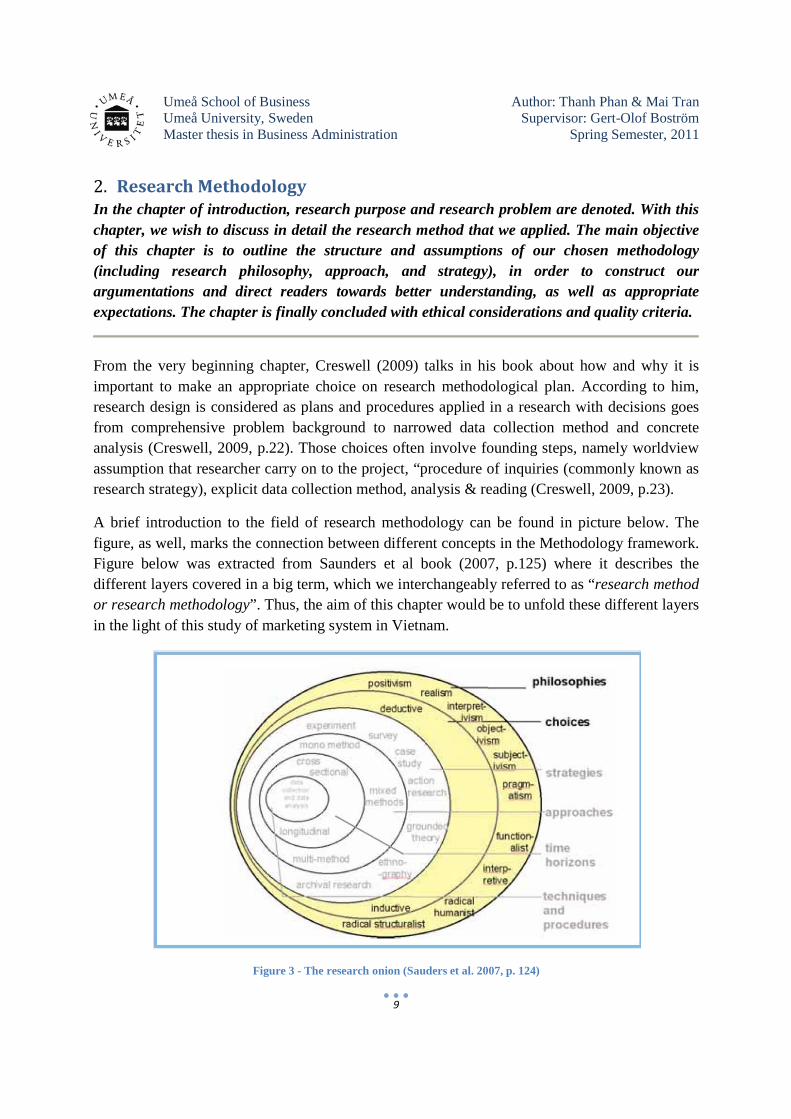
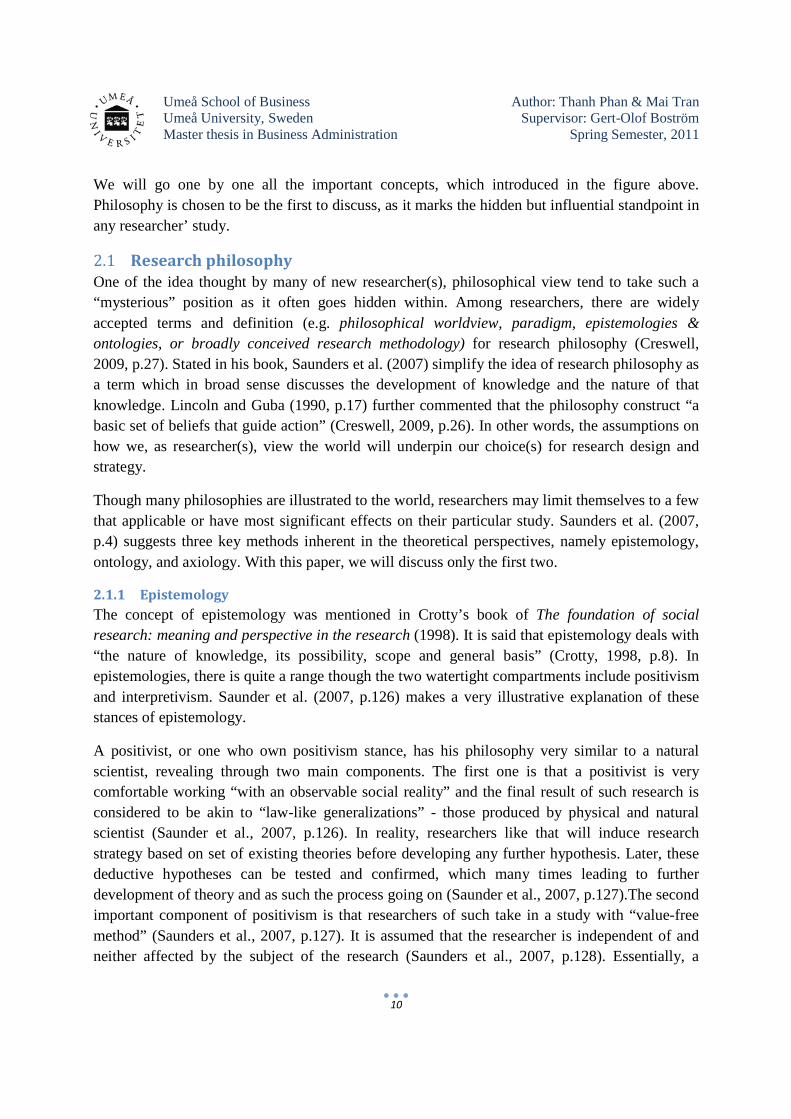
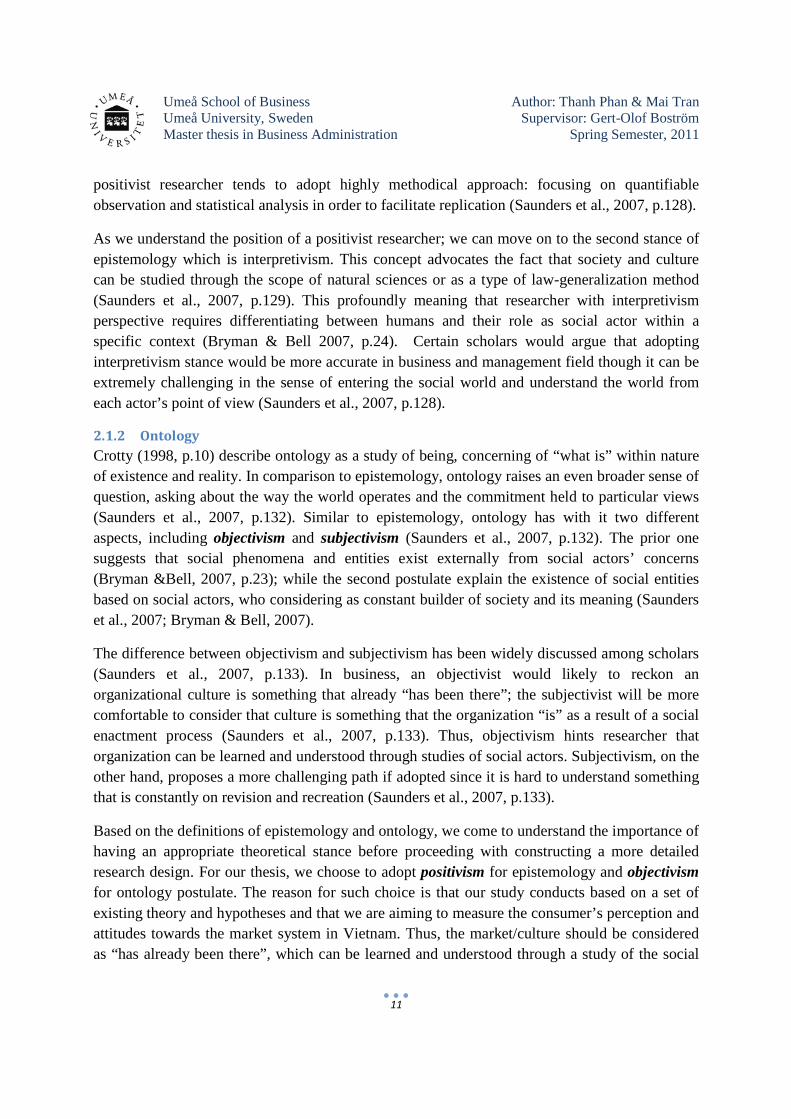
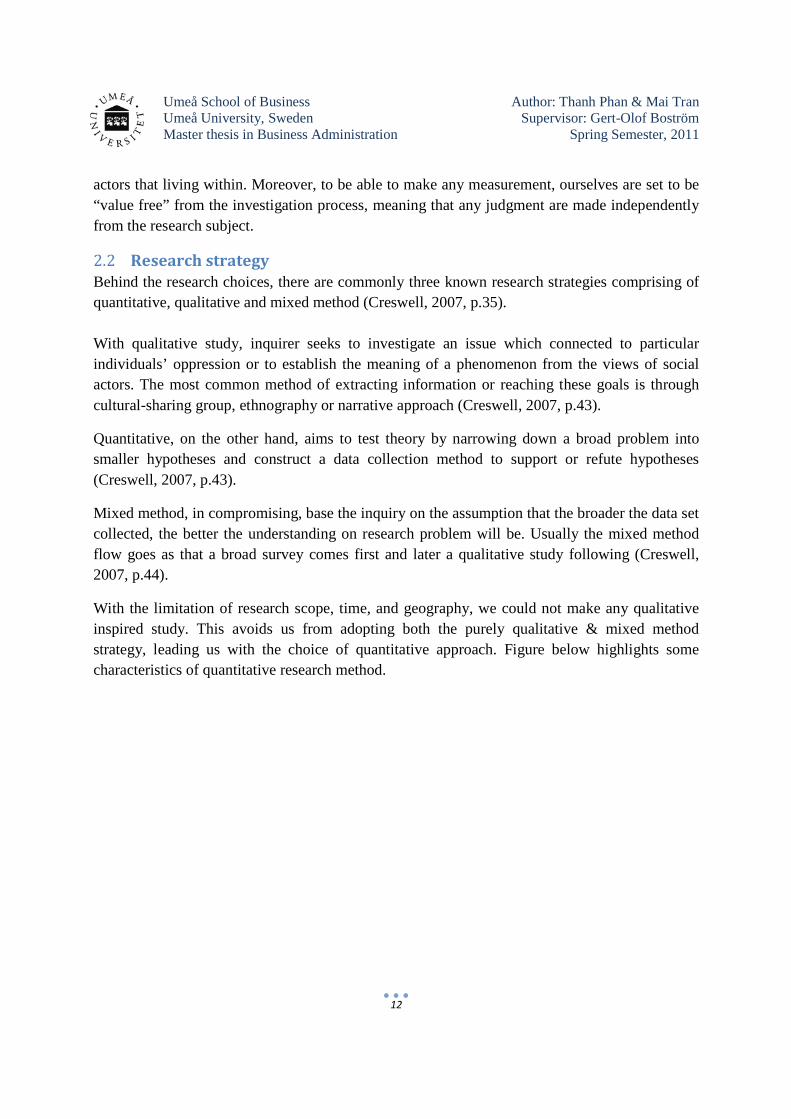
A brief introduction to the field of research methodology can be found in picture below. The figure, as well, marks the connection between different concepts in the Methodology framework. Figure below was extracted from Saunders et al book (2007, p.125) where it describes the different layers covered in a big term, which we interchangeably referred to as “research method or research methodology”. Thus, the aim of this chapter would be to unfold these different layers in the light of this study of marketing system in Vietnam.
Figure 3 - The research onion (Sauders et al. 2007, p. 124)
Umeå School of Business Author: Thanh Phan & Mai Tran Umeå University, Sweden Supervisor: Gert-Olof Boström Master thesis in Business Administration Spring Semester, 2011
10
We will go one by one all the important concepts, which introduced in the figure above. Philosophy is chosen to be the first to discuss, as it marks the hidden but influential standpoint in any researcher’ study.
2.1 Research philosophy
One of the idea thought by many of new researcher(s), philosophical view tend to take such a “mysterious” position as it often goes hidden within. Among researchers, there are widely accepted terms and definition (e.g. philosophical worldview, paradigm, epistemologies & ontologies, or broadly conceived research methodology) for research philosophy (Creswell, 2009, p.27). Stated in his book, Saunders et al. (2007) simplify the idea of research philosophy as a term which in broad sense discusses the development of knowledge and the nature of that knowledge. Lincoln and Guba (1990, p.17) further commented that the philosophy construct “a basic set of beliefs that guide action” (Creswell, 2009, p.26). In other words, the assumptions on how we, as researcher(s), view the world will underpin our choice(s) for research design and strategy.
Though many philosophies are illustrated to the world, researchers may limit themselves to a few that applicable or have most significant effects on their particular study. Saunders et al. (2007, p.4) suggests three key methods inherent in the theoretical perspectives, namely epistemology, ontology, and axiology. With this paper, we will discuss only the first two.
2.1.1 Epistemology
The concept of epistemology was mentioned in Crotty’s book of The foundation of social research: meaning and perspective in the research (1998). It is said that epistemology deals with “the nature of knowledge, its possibility, scope and general basis” (Crotty, 1998, p.8). In epistemologies, there is quite a range though the two watertight compartments include positivism and interpretivism. Saunder et al. (2007, p.126) makes a very illustrative explanation of these stances of epistemology.
A positivist, or one who own positivism stance, has his philosophy very similar to a natural scientist, revealing through two main components. The first one is that a positivist is very comfortable working “with an observable social reality” and the final result of such research is considered to be akin to “law-like generalizations” - those produced by physical and natural scientist (Saunder et al., 2007, p.126). In reality, researchers like that will induce research strategy based on set of existing theories before developing any further hypothesis. Later, these deductive hypotheses can be tested and confirmed, which many times leading to further development of theory and as such the process going on (Saunder et al., 2007, p.127).The second important component of positivism is that researchers of such take in a study with “value-free method” (Saunders et al., 2007, p.127). It is assumed that the researcher is independent of and neither affected by the subject of the research (Saunders et al., 2007, p.128). Essentially, a
Umeå School of Business Author: Thanh Phan & Mai Tran Umeå University, Sweden Supervisor: Gert-Olof Boström Master thesis in Business Administration Spring Semester, 2011
11
positivist researcher tends to adopt highly methodical approach: focusing on quantifiable observation and statistical analysis in order to facilitate replication (Saunders et al., 2007, p.128).
As we understand the position of a positivist researcher; we can move on to the second stance of epistemology which is interpretivism. This concept advocates the fact that society and culture can be studied through the scope of natural sciences or as a type of law-generalization method (Saunders et al., 2007, p.129). This profoundly meaning that researcher with interpretivism perspective requires differentiating between humans and their role as social actor within a specific context (Bryman & Bell 2007, p.24). Certain scholars would argue that adopting interpretivism stance would be more accurate in business and management field though it can be extremely challenging in the sense of entering the social world and understand the world from each actor’s point of view (Saunders et al., 2007, p.128).
2.1.2 Ontology
Crotty (1998, p.10) describe ontology as a study of being, concerning of “what is” within nature of existence and reality. In comparison to epistemology, ontology raises an even broader sense of question, asking about the way the world operates and the commitment held to particular views (Saunders et al., 2007, p.132). Similar to epistemology, ontology has with it two different aspects, including objectivism and subjectivism (Saunders et al., 2007, p.132). The prior one suggests that social phenomena and entities exist externally from social actors’ concerns (Bryman &Bell, 2007, p.23); while the second postulate explain the existence of social entities based on social actors, who considering as constant builder of society and its meaning (Saunders et al., 2007; Bryman & Bell, 2007).
The difference between objectivism and subjectivism has been widely discussed among scholars (Saunders et al., 2007, p.133). In business, an objectivist would likely to reckon an organizational culture is something that already “has been there”; the subjectivist will be more comfortable to consider that culture is something that the organization “is” as a result of a social enactment process (Saunders et al., 2007, p.133). Thus, objectivism hints researcher that organization can be learned and understood through studies of social actors. Subjectivism, on the other hand, proposes a more challenging path if adopted since it is hard to understand something that is constantly on revision and recreation (Saunders et al., 2007, p.133).
Based on the definitions of epistemology and ontology, we come to understand the importance of having an appropriate theoretical stance before proceeding with constructing a more detailed research design. For our thesis, we choose to adopt positivism for epistemology and objectivism for ontology postulate. The reason for such choice is that our study conducts based on a set of existing theory and hypotheses and that we are aiming to measure the consumer’s perception and attitudes towards the market system in Vietnam. Thus, the market/culture should be considered as “has already been there”, which can be learned and understood through a study of the social
Umeå School of Business Author: Thanh Phan & Mai Tran Umeå University, Sweden Supervisor: Gert-Olof Boström Master thesis in Business Administration Spring Semester, 2011
12
actors that living within. Moreover, to be able to make any measurement, ourselves are set to be “value free” from the investigation process, meaning that any judgment are made independently from the research subject.
2.2 Research strategy
Behind the research choices, there are commonly three known research strategies comprising of quantitative, qualitative and mixed method (Creswell, 2007, p.35). With qualitative study, inquirer seeks to investigate an issue which connected to particular individuals’ oppression or to establish the meaning of a phenomenon from the views of social actors. The most common method of extracting information or reaching these goals is through cultural-sharing group, ethnography or narrative approach (Creswell, 2007, p.43).
Quantitative, on the other hand, aims to test theory by narrowing down a broad problem into smaller hypotheses and construct a data collection method to support or refute hypotheses (Creswell, 2007, p.43).
Mixed method, in compromising, base the inquiry on the assumption that the broader the data set collected, the better the understanding on research problem will be. Usually the mixed method flow goes as that a broad survey comes first and later a qualitative study following (Creswell, 2007, p.44).
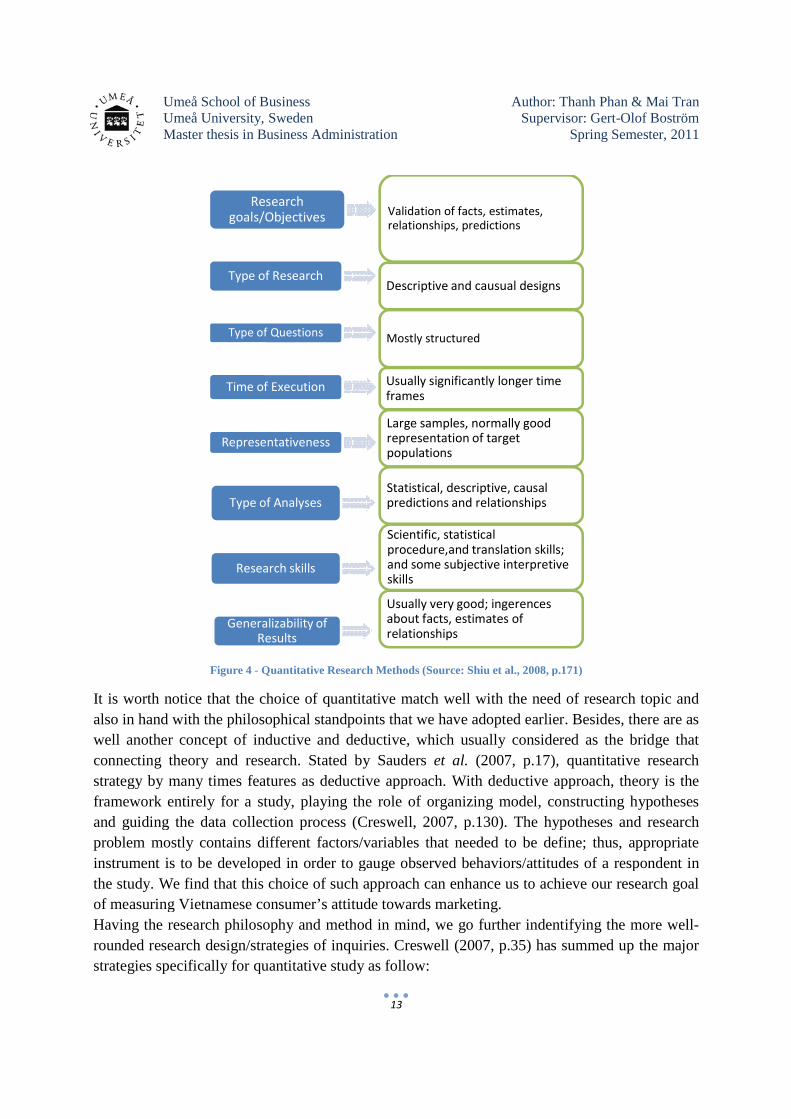
With the limitation of research scope, time, and geography, we could not make any qualitative inspired study. This avoids us from adopting both the purely qualitative & mixed method strategy, leading us with the choice of quantitative approach. Figure below highlights some characteristics of quantitative research method.
Umeå School of Business Umeå University, Sweden Master thesis in Business Administration
Figure 4 - Quantitative Research Methods (Source: Shiu et al., 2008
It is worth notice that the choice of quantitative match well with the need of research topic and also in hand with the philosophical standpoints that we have adopted earlier. Besides, therewell another concept of inductive and deductive, which usually considered as the bridge that connecting theory and research. Stated by strategy by many times features as deductive approach. With deframework entirely for a study, playing the role of organizing model, constructing hypotheses and guiding the data collection process (Creswell, 2007, p.130). The hypotheses and research problem mostly contains different facinstrument is to be developed in order to gauge observed behaviors/attitudes of a respondent inthe study. We find that this choice of of measuring Vietnamese consumer’Having the research philosophy and method in mind, we go further indentifying the more wellrounded research design/strategies of inquiries. strategies specifically for quantitative study as follow:
Research goals/Objectives
Type of Research
Type of Questions
Time of Execution
Representativeness
Type of Analyses
Research skills
Generalizability of Results
Umeå School of Business Author: Thanh Phan & Mai TranUmeå University, Sweden SupervisorMaster thesis in Business Administration
13
Quantitative Research Methods (Source: Shiu et al., 2008, p.
It is worth notice that the choice of quantitative match well with the need of research topic and also in hand with the philosophical standpoints that we have adopted earlier. Besides, therewell another concept of inductive and deductive, which usually considered as the bridge that connecting theory and research. Stated by Sauders et al. (2007, p.17),strategy by many times features as deductive approach. With deductive approach, theory is the framework entirely for a study, playing the role of organizing model, constructing hypotheses and guiding the data collection process (Creswell, 2007, p.130). The hypotheses and research problem mostly contains different factors/variables that needed to be define; thus, appropriate instrument is to be developed in order to gauge observed behaviors/attitudes of a respondent in
this choice of such approach can enhance us to achieve our research goal measuring Vietnamese consumer’s attitude towards marketing.
Having the research philosophy and method in mind, we go further indentifying the more wellrounded research design/strategies of inquiries. Creswell (2007, p.35) has summed up the major
es specifically for quantitative study as follow:
Research goals/Objectives
Type of Research
Type of Questions
Time of Execution
Representativeness
Type of Analyses
Research skills
Generalizability of Results
Validation of facts, estimates, relationships, predictions
Descriptive and causual designs
Mostly structured
Usually significantly longer time frames
Large samples, normally good representation of target populations
Statistical, descriptive, causal predictions and relationships
Scientific, statistical procedure,and translation skills; and some subjective interpretive skills
Usually very good; ingerences about facts, estimates of relationships
Author: Thanh Phan & Mai Tran Supervisor: Gert-Olof Boström
Spring Semester, 2011
, p.171)
It is worth notice that the choice of quantitative match well with the need of research topic and also in hand with the philosophical standpoints that we have adopted earlier. Besides, there are as well another concept of inductive and deductive, which usually considered as the bridge that
(2007, p.17), quantitative research ductive approach, theory is the
framework entirely for a study, playing the role of organizing model, constructing hypotheses and guiding the data collection process (Creswell, 2007, p.130). The hypotheses and research
tors/variables that needed to be define; thus, appropriate instrument is to be developed in order to gauge observed behaviors/attitudes of a respondent in
to achieve our research goal
Having the research philosophy and method in mind, we go further indentifying the more well-has summed up the major
Descriptive and causual designs
Usually significantly longer time
procedure,and translation skills; and some subjective interpretive
Umeå School of Business Umeå University, Sweden Master thesis in Business Administration
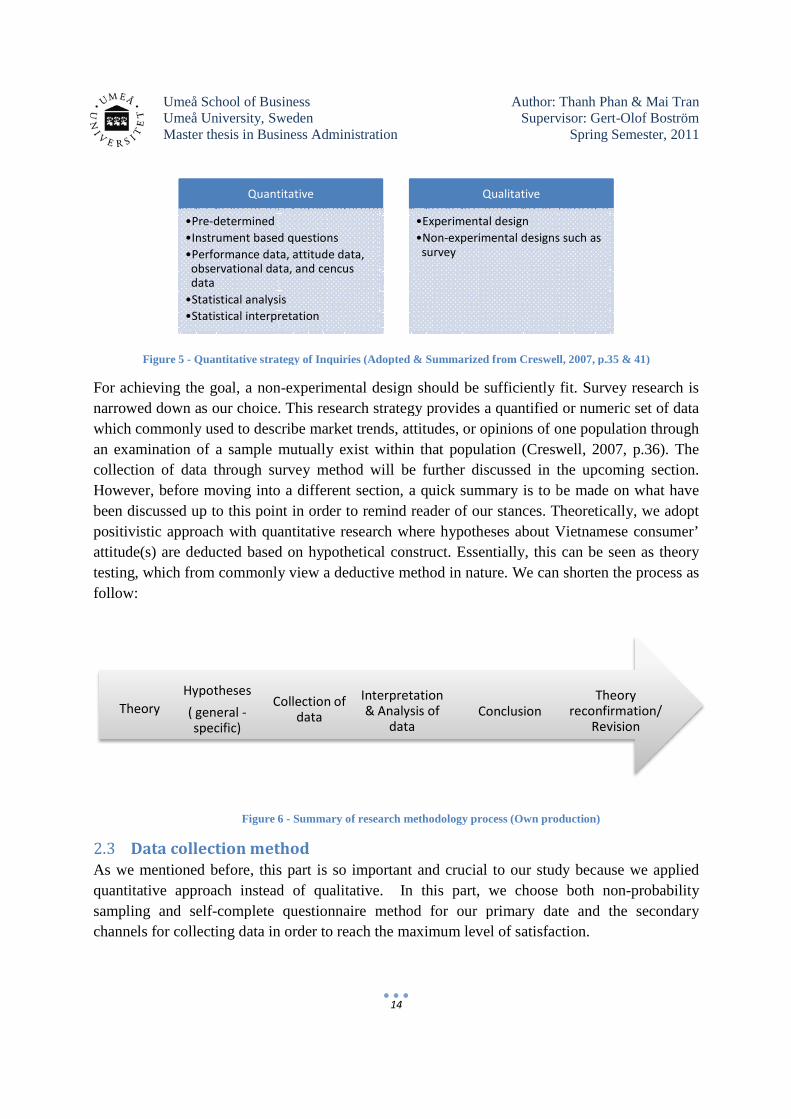
Figure 5 - Quantitative strategy of Inquiries (Adopted
For achieving the goal, a nonnarrowed down as our choice. This research strategy provides a quantified or numeric set of data which commonly used to describe market trends, attitudes, or oan examination of a sample mutually exist within that population collection of data through survey method will be further discussed in the upcoming section. However, before moving into a differebeen discussed up to this point in order to remind reader of our stances. Theoretically, we adopt positivistic approach with quantitative research where hypotheses about Vietnamese consumer’ attitude(s) are deducted based on hypothetical construct. Essentially, this can be seen as theory testing, which from commonly view a deductive method in nature. We can shorten the process as follow:
Figure 6
2.3 Data collection method
As we mentioned before, this part is so important and crucial to our study because we applied quantitative approach instead of qualitative. In this part, we choose both nonsampling and self-complete questionnaire method for our primary date and the secondary channels for collecting data in order to reach the maximum level of satisfaction.
Quantitative
•Pre-determined
•Instrument based questions
•Performance data, attitude data, observational data, and cencus data
•Statistical analysis
•Statistical interpretation
Collection of Hypotheses
( general -specific)
Theory
Umeå School of Business Author: Thanh Phan & Mai TranUmeå University, Sweden SupervisorMaster thesis in Business Administration
14
Quantitative strategy of Inquiries (Adopted & Summarized from Creswell, 2007, p.35 & 41)
For achieving the goal, a non-experimental design should be sufficiently fit. Survey research is narrowed down as our choice. This research strategy provides a quantified or numeric set of data which commonly used to describe market trends, attitudes, or opinions of one population through an examination of a sample mutually exist within that population (Creswell, 2007, p.36). collection of data through survey method will be further discussed in the upcoming section. However, before moving into a different section, a quick summary is to be made on what have been discussed up to this point in order to remind reader of our stances. Theoretically, we adopt positivistic approach with quantitative research where hypotheses about Vietnamese consumer’
) are deducted based on hypothetical construct. Essentially, this can be seen as theory testing, which from commonly view a deductive method in nature. We can shorten the process as
6 - Summary of research methodology process (Own production)
Data collection method
As we mentioned before, this part is so important and crucial to our study because we applied quantitative approach instead of qualitative. In this part, we choose both non
complete questionnaire method for our primary date and the secondary channels for collecting data in order to reach the maximum level of satisfaction.
Quantitative
Instrument based questions
Performance data, attitude data, observational data, and cencus
Statistical analysis
Statistical interpretation
Qualitative
•Experimental design
•Non-experimental designs such as survey
ConclusionInterpretation & Analysis of
data
Collection of data
Author: Thanh Phan & Mai Tran Supervisor: Gert-Olof Boström
Spring Semester, 2011
from Creswell, 2007, p.35 & 41)
experimental design should be sufficiently fit. Survey research is narrowed down as our choice. This research strategy provides a quantified or numeric set of data
pinions of one population through (Creswell, 2007, p.36). The
collection of data through survey method will be further discussed in the upcoming section. nt section, a quick summary is to be made on what have
been discussed up to this point in order to remind reader of our stances. Theoretically, we adopt positivistic approach with quantitative research where hypotheses about Vietnamese consumer’
) are deducted based on hypothetical construct. Essentially, this can be seen as theory testing, which from commonly view a deductive method in nature. We can shorten the process as
esearch methodology process (Own production)
As we mentioned before, this part is so important and crucial to our study because we applied quantitative approach instead of qualitative. In this part, we choose both non-probability
complete questionnaire method for our primary date and the secondary channels for collecting data in order to reach the maximum level of satisfaction.
experimental designs such as
Theory reconfirmation/
Revision
Umeå School of Business Author: Thanh Phan & Mai Tran Umeå University, Sweden Supervisor: Gert-Olof Boström Master thesis in Business Administration Spring Semester, 2011
15
2.3.1 Primary data collection
Our research studies about the relationship between costumer attitude toward marketing and customer satisfaction and government regulation in Vietnam 2011; hence, collecting precise data is very necessary to our result. Primary data collection that including convenient sampling and self- completed question characteristics is appropriated to our research.
First, for this thesis, we apply a convenience sampling approach, which is categorized in the non-probability sampling (Bryman & Bell, 2007, p.197). This method is quite popular among researchers due to the virtue of its accessibility. One of the most important advantages of this convenience sampling comes from the possibility of researchers to receive the questionnaire simultaneously; while the crucial disadvantage attached to this method must be its non-representative characteristic on the whole population (Saunders et al., 2000, p.147; Bryman & Bell, 2007, p.198). In this study, we collected randomly 446 objects from two cities Hanoi and Ho Chi Minh City in Vietnam. It surely is not representative for the whole Vietnamese customer opinions; however, our study is desirable to pilot as research instrument before studying a real research.
Acknowledging the weakness of convenience sampling, we choose to incorporate it with the method of simple quota. In essence, the aim of quota sampling is to produce a sample which reflects a population by choosing a relative equal proportion of people in different categories, e.g. age group, ethnicity, gender, region of residence…etc. (Bryman & Bell, 2007, p.201). With our study, we strive to have not only equal amount of male and female but also residents from with different educational backgrounds, age groups, and region of residence (both in Hanoi & Ho Chi Minh City). The reason why we can know the equality in numbers of respondents because my family members and friends do the research directly in specific area, i.e. they came to universities or single apartment and house to make sure the accuracy of data. Besides, the dominant participants will come from the city center as we believe this group is the most effected by marketing practices.
Due to the fact that both the authors were working from distance, the actual data collection method is not carried out by ourselves but by members of our families and friends (with high trustful level). As we understand that it can create biases and increase sampling errors, we work our best to limit them. In specific, the family members and friends those who hand out questionnaires are fully understood the survey as well as the quota strategy (covering different groups) and act accordingly. In this case, we believe the sample would be considerably increases in its representativeness on the population.
Secondly, the convenience sampling is taken place under the type of self-completed questionnaire which belongs to the survey strategy (mentioned in section 2.2). With self-completed questionnaire, the respondents are asked to fill in the survey by themselves (Bryman
Umeå School of Business Author: Thanh Phan & Mai Tran Umeå University, Sweden Supervisor: Gert-Olof Boström Master thesis in Business Administration Spring Semester, 2011
16
& Bell, 2007, p.240). To realize the option with random sampling, the questionnaire will be distributed at places like supermarkets, parks, universities, and partially in the neighboring areas. As we are not the direct force who to bring the questionnaire, we make sure that each person, who helping us in this task understands the research goal and logic of each questions, which enabling them in explaining for the respondents for better result.
2.3.2 Secondary data collection
Weighing the pros and cons makes we believe that this type of collection method suits our research best as the aim is towards macro scope of an issue rather than understanding in-depth of each individual within a society
Different from the primary data, secondary data was collected from the previous researches that have been already collected by and readily available from other sources. This kind of analysis is not necessarily be accumulated by the researchers, company or another type of organizations' data also was accepted (Bryman & Bell, 2007, p.325). According to Dale & Arber & Proctor (1988, p. 15), secondary analysis was defined as "the analysis of data by researchers who will probably not have been involved in the collection of those data, for purposes that in all likelihood were not envisaged by those responsible for the data". Started by the convenience of it features, secondary analysis is more and more popular use in many researches and projects. As we can see, normally, the process of collecting and searching data gets many troubles for the researchers because many techniques and surveys had to apply during the period of gathering data. Moreover, the researchers might be not qualified in the process of purifying the data. Yet there are an amount of qualitative data for business and management specifically and other fields in general that are gathered by scientists and marketing research companies, and other sources. Therefore, the idea of re-using the collected data from previous researches has applied widely since 1960 (Bryman &Bell, 2007, p.326) besides using primary data all together.
In this study, the author used ranges of articles and books about management, marketing, statistics fields, and websites as base for model’s construction; all utilized for authors' purpose. The used materials are ensured to e up-to-date and relevant to the studying field.
2.4 Quality criteria
In the qualitative research, the criteria measuring the quality of the research are very necessary that including multiple-indicators and single indicators measure. In the book by Leedy & Ormrod (2010, p.20), it is stated that most of the quantitative researches were relied on both single and multi-indicator of concepts, while the most common one has to be valid and reliable. Nevertheless, the main issue of quantitative research is how the data reliable or valid representation of the concept or not. Therefore, we have to understand the meaning of this measure.
Umeå School of Business Author: Thanh Phan & Mai Tran Umeå University, Sweden Supervisor: Gert-Olof Boström Master thesis in Business Administration Spring Semester, 2011
17
2.4.1 Reliability
According to Leedy & Ormrod (2010, p.29) the reliability of the research refers to ”the consistency with which a measuring instrument yields a certain result when the entity being measured has not changed". The aim of estimating the reliability of a measure is decrease error in the measurement process. Kimberline & Winterstein, (2008, p.2277) also discuss that reliability are used to measure two main objects, "the stability of measures administered at different times to the same individuals or using the same standard" and " the equivalence of sets of items from the same test (internal consistency) or of different observers scoring a behavior or events using the same instrument (inter rater reliability) ". Usually, the reliability coefficients score ranges from 0.00 to 1.00, with higher coefficients showing higher reliability level. In this study, we use two criteria for evaluating the reliability lever are stability and internal reliability. The stability level is measured through testing T-method and internal reliability level is tested through Cronbach's alpha in order to estimate the equivalence of sets of objects from the same tests. Both criteria are crucial for our study; therefore, in following chapter, the authors will measure Cronbach's alpha and T-test of all criteria in our survey in order to make sure the reliability of factors (Ibid).
2.4.2 Validity
The definition of this measure refers to "the issue of whether or not an indicator (or set of indicator) that is devised to gauge a concept really measures that concept" (Bryman & Bell, 2007). Validity demands that an instrument is reliable without being valid (Kimberline & Winterstei, 2008, p.2278). Normally, when taking consideration validity measurement, the researchers tackle with four dimensions, i.e. measurement validity, internal validity, external validity and ecology validity. However, in this research, two criteria are applied are measurement validity and internal validity (Ibid). In this study, we examine the relationship between customer sentiment toward marketing and customer satisfaction, government regulations and demographic factors in Vietnam. The reason for choosing this topic is because Vietnam economic is still a potential market for many investors and either representative of transition market's characteristics. The findings from such a research can be more unlimited and external validity can be better assumed.
2.5 Ethical considerations
According to Murphy (2005, p.xvii), “marketing ethics is the systematic study of how moral standards are applied to marketing decisions, behaviors, and institutions”. Within the marketing field, researchers generally receive more academic training, especially in methodological and statistical techniques. This presumes that a higher degree of professionalism exists within the research field. However, this does not imply a free of ethical issues when it comes to marketing research. In contrast, a range of ethical dilemmas does arise quite often, confronting market research practitioners. Murphy et al. (2005, p.49) states that one of the reasons why such problem occur is because marketing research usually involves contact with the general public,
Umeå School of Business Author: Thanh Phan & Mai Tran Umeå University, Sweden Supervisor: Gert-Olof Boström Master thesis in Business Administration Spring Semester, 2011
18
and commonly through the use of survey method. For this activity to be fruitful in results, heavy public information is required - often including sensitive personal information, which can easily be misused or abused by researchers. As researchers, we owe our respondents with responsibilities for ethics. There are generally three major ethical concerns in the research-respondents relationship, comprising of “deceptive practices”, “invasion of privacy”, and “lack of concern for subjects or respondents”. During the entire investigating process, we have made ourselves respecting these key ethical standards. All personal data of the respondents will be kept confidential. Our respondents are protected from being deceiving in any kind. As well as the results presented in this paper reflects only the truth from the market research itself.
2.6 Methodological limitation
Though our choice of methodology is for the best for the research topic, it has to be admitted that the choice do exist some limitations. The scope of research is not coverable all Vietnam market, i.e. in this study, the authors just studied customer behavior sentiment and other dimensions in only two big cities: Ho chi minh and Hanoi. These leads to the result of our research is not exactly and precise. The reason why the authors just did research on two these cities causing they are living in these cities. Moreover, the sample size seems to be quite small when study a market research in Vietnam. In this research, the authors only collected 445 respondents, but authors expect to be pilot such a research instrument for experienced researcher for further study.
Umeå School of Business Author: Thanh Phan & Mai Tran Umeå University, Sweden Supervisor: Gert-Olof Boström Master thesis in Business Administration Spring Semester, 2011
19
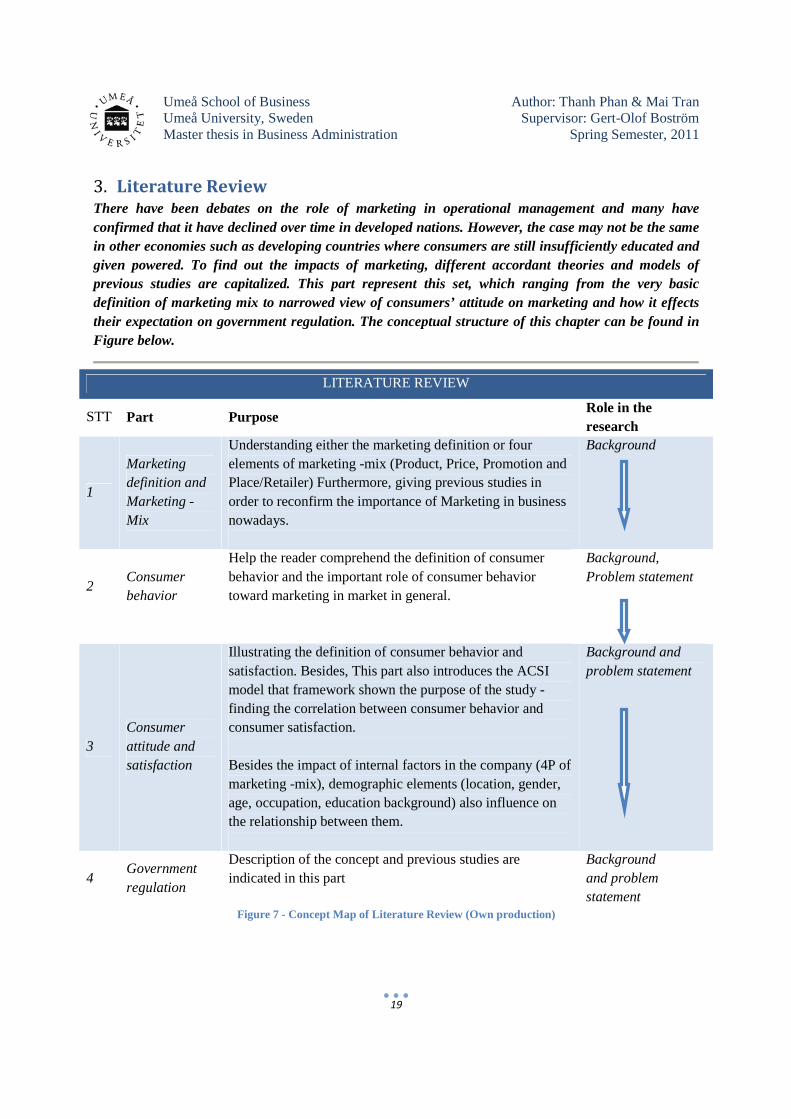
3. Literature Review There have been debates on the role of marketing in operational management and many have confirmed that it have declined over time in developed nations. However, the case may not be the same in other economies such as developing countries where consumers are still insufficiently educated and given powered. To find out the impacts of marketing, different accordant theories and models of previous studies are capitalized. This part represent this set, which ranging from the very basic definition of marketing mix to narrowed view of consumers’ attitude on marketing and how it effects their expectation on government regulation. The conceptual structure of this chapter can be found in Figure below.
LITERATURE REVIEW
STT Part Purpose Role in the research
1
Marketing definition and Marketing - Mix
Understanding either the marketing definition or four elements of marketing -mix (Product, Price, Promotion and Place/Retailer) Furthermore, giving previous studies in order to reconfirm the importance of Marketing in business nowadays.
Background
2 Consumer behavior
Help the reader comprehend the definition of consumer behavior and the important role of consumer behavior toward marketing in market in general.
Background, Problem statement
3 Consumer attitude and satisfaction
Illustrating the definition of consumer behavior and satisfaction. Besides, This part also introduces the ACSI model that framework shown the purpose of the study - finding the correlation between consumer behavior and consumer satisfaction. Besides the impact of internal factors in the company (4P of marketing -mix), demographic elements (location, gender, age, occupation, education background) also influence on the relationship between them.
Background and problem statement
4 Government regulation
Description of the concept and previous studies are indicated in this part
Background and problem statement
Figure 7 - Concept Map of Literature Review (Own production)
Umeå School of Business Author: Thanh Phan & Mai Tran Umeå University, Sweden Supervisor: Gert-Olof Boström Master thesis in Business Administration Spring Semester, 2011
20
3.1 Definition of Marketing
“Marketing is still an art, and the marketing manager, as head chef, must creatively marshal all his marketing activities to advance the short and long term interests of his firm”.
(Borden N., 1984, p.7)
-- As the thesis field concerned, marketing definition is one of the core knowledge leading us throughout the thesis process. Thus, it feels a need to introduce the concept at the very first of this chapter, embracing as the base for this entire text. The definition of marketing existed in many different versions and kept on changing as a phenomenon for the past 25 years (Grönroos, 2006). Besides, another definition that is one chosen to adopt here comes from the range American Marketing Association, which states that "Marketing refers to the acts of buying and selling in a market. It is an exchange activity, which brings together suppliers and users of goods and services” (Rosenbloom B. & Dimitrova B., 2011, p.56). In this scope of study, we only do the research about marketing activities in terms of buying and selling actions relevant to the famous 4P elements in marketing mix, i.e. product, promotion, price and place. While many people normally refer to marketing activities comprise only of advertising and sales activities, these just appear like the "tip of the iceberg" that the marketing activities want to aim at. In general, marketing is comprehended of all the activities that can "satisfy customer needs". This, automatically pushes the practicing of marketing strategy to an extremely complex level.
In developed countries such as the United States or Europeans, the credibility and function of marketing are in decline. This can be account for the emerging of new marketing fields – pressing more effects on top management, and at the same time, magnified by the fact that the importance of customers’ voice on corporate decision making has also been lessening (Webster et al., 2005, p.135). On the other hand, Grönroos (2006, p.395) claimed that this deterioration does not occur similarly to all firms in all countries. In the case of developing countries, product sale volume is depending extensively on the amount of marketing activities which consumers are exposed to. Two main reasons explaining the importance of marketing still in developing should be that (1) numerous amount of company exist on the market with a high rate of turnover, and (2) the average rate of literacy in developing countries is quite low, resulting in difficulties for consumers to make purchasing choices in case of lack of information (Ibid).
The concept of marketing sets only the foundation for marketing management in order to put the goal of “value-creation” into practices. There are different toolkits that built as pillars for organizational marketing management framework. One of them is the world famous Marketing Mix (4Ps), which normally considered as governable framework to influence the consumer buying process and decisions (Kotler, 2003; Brassington& Pettit, 2003). The 4Ps has even
Umeå School of Business Author: Thanh Phan & Mai Tran Umeå University, Sweden Supervisor: Gert-Olof Boström Master thesis in Business Administration Spring Semester, 2011
21
became a synonym to the very term Marketing, formulated by the American Marketing Association and since enjoying constant large-scale endorsement (Constantinides, 2006, p.408). In the coming section, this Mix paradigm will be brought out to be our main focus.
3.2 The Marketing Mix
There is no doubt that few topics of the commercial theory have so intensively inspired and divided the marketing academia as the Marketing Mix-4Ps (Constantinides, 2006, p.408). Originating in the 60’s when Neil Borden identified twelve administrable marketing elements that could result to a “profitable business operation” if properly managed. Later on, Jerome McCarthy simplified Borden’s work into a four-element framework of marketing: Place, Promotion, Product, and Price (Rosenbloom & Dimitrova, 2011, p.63). The Mix paradigm was promptly embraced by practitioners and academics which soon became the popular and indispensable element of marketing theory as well as operational marketing management (Constantinides E., 2006, p.408).
The formal definition of Marketing Mix stated by Kotler (2005, p.57) is "the set of controllable tactical marketing tools that the firms blends on produce the response it wants in the target market". The breakdown of each element can be found below and
Figure 8 summarizes the text. Hence, marketing- mix factors can be listed as Product, Price, Promotion and Place (Retailers).
Place (Retail)
Place includes all the company projects and activities that make the conveniences to the target customers (Koter, 2005, p.58). For example, the locations or the channels of the product have to suitable for the customer that they can access the product in the easiest way. The retailing decisions usually complicate and get involved directly into other areas of marketing activities. Nowadays, more and more firms pay attention to the retailing activities as a useful variable in order to create competitive advantages in long-term toward other companies in the market. Hence, firms make a lot of affords to administrate and operate the retailing activities to satisfy the current and potential customers via the distribution channels. However, the marketing manager also takes account of choosing the appropriated distribution channel in the term of features of product, market or intermediary. Therefore, company can choose many distribution channels as they manage, so that ability of exploiting the target market can be maximized for the product.
Product
Product is something that can fulfill the needs and the wants of customer. It can be physical objects, services, persons, places, organization, or ideas. Therefore, deciding what kind of product to sell is the considerable issue that they have to make. The firm can produce the
Umeå School of Business Author: Thanh Phan & Mai Tran Umeå University, Sweden Supervisor: Gert-Olof Boström Master thesis in Business Administration Spring Semester, 2011
22
physical object classically like iPod, iPhone, MacBook- the product of Apple; Otherwise, services, i.e. intangible goods that including the activities, rights or satisfactions that every customer can use them not belong to specific customers, can be also popular for the customer. TNT express company is a typical example. In addition, companies can have some main products that occupy mass productions, however, besides these they sometime produce some products for niche market that also contribute to the total revenue of one company. For example, recently, the niche market of Vietnam industry besides mass market like producing rice, cereals is coffee product (Jolliffe L. & Bui, 2006, p.125). In the applied scope of this study, the product element of marketing mix is related to the quality of the product which can be certainly close to the customer attitude and satisfaction factors. Quality is "totality of features and characteristic of a product or service that bear on its ability to satisfy stated or implied needs" (Kotler & Keller, 2009, p.129). We can be easily noticed that product quality, customer satisfaction, and company profitability are closely linked, i.e. the higher levels of quality show in higher levels of consumer satisfaction that provides higher prices and (normally) low costs.
Promotion
Promotion factor can be linked to the communication of one firm to the target customers. From most people’ understanding, promotion is considered as the heart of marketing. According to Kotler (2005, p.919), Promotion refers to any activities that “communicate the merits of the product and persuade target customers to buy it". In the broad term, promotion can be generally viewed to include sales promotions, advertising, personal sales, retailing, telemarketing, public relations, and publicity. Conjointly, these activities form a complex relationship between marketers and customers whose different components impact customers (and non-customers) in a variety of ways. Among different promotional activities, some are quite direct, including advertisements, commercials, and flyers. They are aiming at bringing customers’ attention towards a specific product, i.e. informing them about the product and attempting to persuade them to purchase the product. Other indirect methods can be taken in form of placing product(s) in movies or on television programs so that the product(s) can deliberately win people’ favorable view. Eventually in any of those cases, promotion involves bringing both cognitive and motivational appeals to bear upon customers.
The company should not focus too much on target customers beside the current one because all kinds of customers bring the benefits to the company. Consequently, the firms should raise the promotion campaigns to get the highest benefits.
Price
Price is an element that affects directly to the cost to the customer. It is the amount of money that the customer has to pay to gain or use the product. Besides, if the products are service, the customer can obtain the fulfill benefits of using them. Moreover, Price is the only factor in the
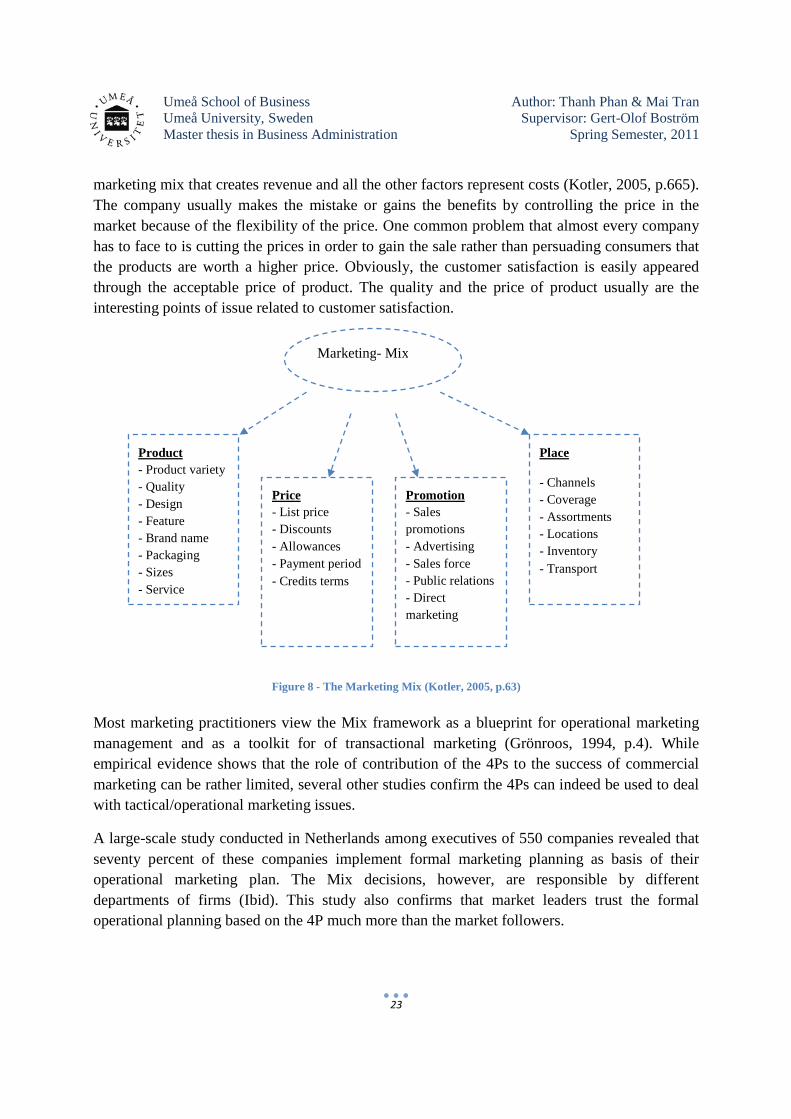
Umeå School of Business Author: Thanh Phan & Mai Tran Umeå University, Sweden Supervisor: Gert-Olof Boström Master thesis in Business Administration Spring Semester, 2011
23
marketing mix that creates revenue and all the other factors represent costs (Kotler, 2005, p.665). The company usually makes the mistake or gains the benefits by controlling the price in the market because of the flexibility of the price. One common problem that almost every company has to face to is cutting the prices in order to gain the sale rather than persuading consumers that the products are worth a higher price. Obviously, the customer satisfaction is easily appeared through the acceptable price of product. The quality and the price of product usually are the interesting points of issue related to customer satisfaction.
Figure 8 - The Marketing Mix (Kotler, 2005, p.63)
Most marketing practitioners view the Mix framework as a blueprint for operational marketing management and as a toolkit for of transactional marketing (Grönroos, 1994, p.4). While empirical evidence shows that the role of contribution of the 4Ps to the success of commercial marketing can be rather limited, several other studies confirm the 4Ps can indeed be used to deal with tactical/operational marketing issues.
A large-scale study conducted in Netherlands among executives of 550 companies revealed that seventy percent of these companies implement formal marketing planning as basis of their operational marketing plan. The Mix decisions, however, are responsible by different departments of firms (Ibid). This study also confirms that market leaders trust the formal operational planning based on the 4P much more than the market followers.
Marketing- Mix
Product - Product variety - Quality - Design - Feature - Brand name - Packaging - Sizes - Service
Price - List price - Discounts - Allowances - Payment period - Credits terms
Promotion - Sales promotions - Advertising - Sales force - Public relations - Direct marketing
Place
- Channels - Coverage - Assortments - Locations - Inventory - Transport
Umeå School of Business Author: Thanh Phan & Mai Tran Umeå University, Sweden Supervisor: Gert-Olof Boström Master thesis in Business Administration Spring Semester, 2011
24
It is an unavoidable fact that the wide acceptance of the Mix by marketers must have resulted from their extensive exposure to the concept during college year as most marketing manual embrace the Mix as “the heart of their structure” (Constantinides E, 2006, p.409). Moreover, Jobber D. (2001, p.549) confirms the strong asset of this parameter is that “the approach represents a memorable and practical framework for marketing decision-making and has proved useful for case study analysis in business schools for many years”. Moreover, an additional asset of the mix comes from its easy-to-remember and easy-to-use characteristics.
As the Marketing Mix has been around for so long, one may raise concerns over the usefulness and applicability of the paradigm in nowadays context. Thus, despite the popular background, the 4Ps have attracted academics concerns with significant expression of doubts and even objection. Constantinides (2006, p.413), shown a range of opinions about the failure of the Marketing Mix and should not be judged as the foundation of Consumer Marketing management focus on three main areas , internal orientation, lack of strategic elements and lack of consumer interactivity. Though many suggestions have been proposed for the Mix framework development, none yet receive much wide exception enough to replace the 4Ps (Grönroos, 2006, p. 396). Moreover, in the context of developing countries where commercial landscape and consumers/organizational attitude are yet only on changing, the 4Ps is expected to still part of the companies’ strategic game. With such reason, the use of 4Ps as foundation for the survey construction in this case should be considered appropriate.
3.3 Consumer attitude, and Consumer Satisfaction toward Marketing
After the definitions and the impacts of marketing mix on our study are explained in the pervious, the research also indicates knowledge about the customer attitude and consumer satisfaction toward marketing practices is required. Adding to such, there would be some illustrations some crucial models, including American customer satisfaction Index (ACSI) and Kano model that are supported to the content of this chapter.
As a constantly revising process, marketers need to understand what their target consumers perceive as positive (or negative) in order to establish the most appropriate marketing program. Moreover, the marketing strategies are tended to alter any undesired attitudes from the customers’ point of view. These changes of attitude would result in later change of individual behaviors, for instance picking a certain brand. Consequently, to measure the behavior of consumer specifically, the administrators have been applied many models and methods and among them, ACSI model is the most popular and understanding model. The University of Michigan's Claes Fornell has been in process about the American Customer Satisfaction Index (ACSI) that is defined as: "The ACSI model is a cause-and-effect model with indices for drivers of satisfaction on the left side (customer expectations, perceived quality, and perceived value), satisfaction in the center, and outcomes of satisfaction on the right side (customer complaints
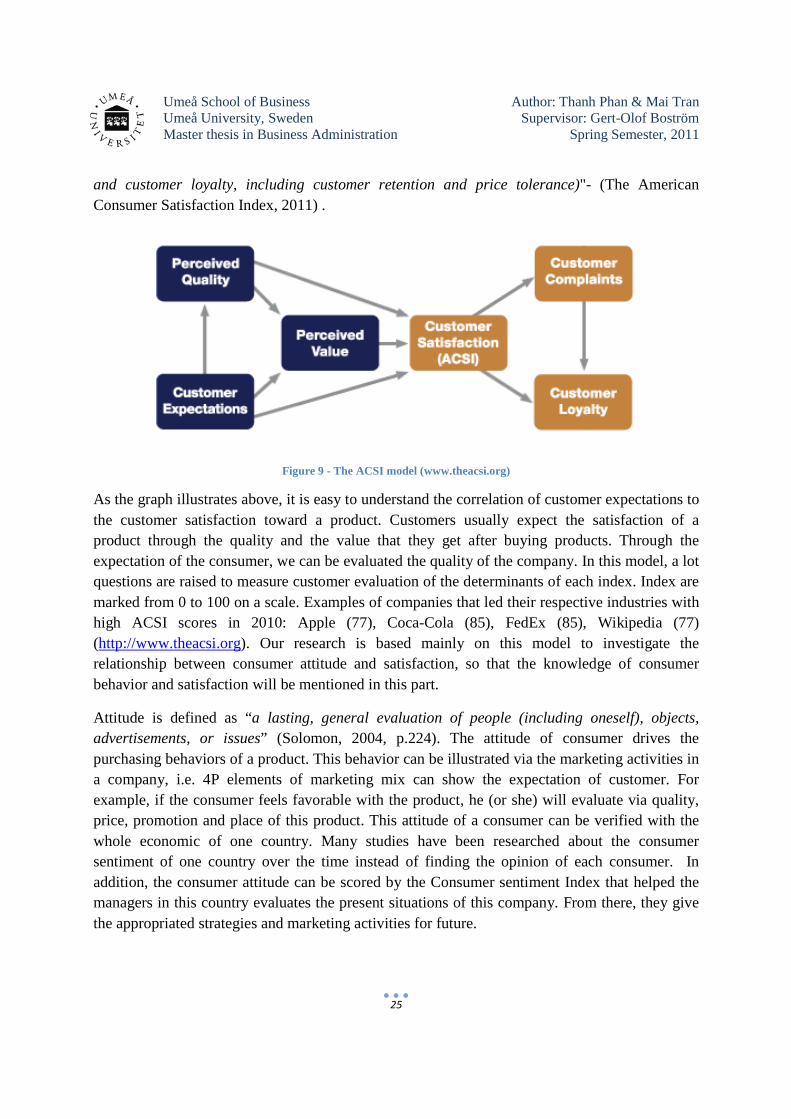
Umeå School of Business Author: Thanh Phan & Mai Tran Umeå University, Sweden Supervisor: Gert-Olof Boström Master thesis in Business Administration Spring Semester, 2011
25
and customer loyalty, including customer retention and price tolerance)"- (The American Consumer Satisfaction Index, 2011) .
Figure 9 - The ACSI model (www.theacsi.org)
As the graph illustrates above, it is easy to understand the correlation of customer expectations to the customer satisfaction toward a product. Customers usually expect the satisfaction of a product through the quality and the value that they get after buying products. Through the expectation of the consumer, we can be evaluated the quality of the company. In this model, a lot questions are raised to measure customer evaluation of the determinants of each index. Index are marked from 0 to 100 on a scale. Examples of companies that led their respective industries with high ACSI scores in 2010: Apple (77), Coca-Cola (85), FedEx (85), Wikipedia (77) (http://www.theacsi.org). Our research is based mainly on this model to investigate the relationship between consumer attitude and satisfaction, so that the knowledge of consumer behavior and satisfaction will be mentioned in this part.
Attitude is defined as “a lasting, general evaluation of people (including oneself), objects, advertisements, or issues” (Solomon, 2004, p.224). The attitude of consumer drives the purchasing behaviors of a product. This behavior can be illustrated via the marketing activities in a company, i.e. 4P elements of marketing mix can show the expectation of customer. For example, if the consumer feels favorable with the product, he (or she) will evaluate via quality, price, promotion and place of this product. This attitude of a consumer can be verified with the whole economic of one country. Many studies have been researched about the consumer sentiment of one country over the time instead of finding the opinion of each consumer. In addition, the consumer attitude can be scored by the Consumer sentiment Index that helped the managers in this country evaluates the present situations of this company. From there, they give the appropriated strategies and marketing activities for future.
Umeå School of Business Author: Thanh Phan & Mai Tran Umeå University, Sweden Supervisor: Gert-Olof Boström Master thesis in Business Administration Spring Semester, 2011
26
3.3.1 Customer behavior
Consumer behavior is considered as one of the most important part of marketing activities and the successful company must have to understand fully about the attitudes of consumer in order to satisfy them and get the maximum degree of benefits. In developed countries, the impact of customer on business has been gradually rising over time in the past few decades (Kotler et al., 2005, p.338). Therefore, many studies and researches have discussed about customer behavior in general and consumer attitudes toward marketing specifically. The consumer-decision process has been affected by many factors in the market such as the customer satisfaction or government regulation (Ahmed & Batul 2008, p.484).
In general, the consumption can be the combination of personal, internal, psychological motivations that support for the buying behavior actions. If we put the consumption in the Maslow's methodology, we can easily distinguish between consumer behaviors in developed countries and developing countries. This difference can be seen as a function of the average consumer's position in the hierarchy of needs: just locate in two first levels (physiological and safety needs) or moving upwards to the satisfaction of the higher-level needs (affiliation, esteem, self- actualizations).
Consumer behavior or consumer attitude are not only be affected by internal factors in the company, i.e. marketing mix elements, but also be driven by the external factors like demographic factors, i.e. gender, age, education factors or occupation background. In this study, demographic factors also support for our topic that whether demographic factors have impact on consumer attitude toward marketing practices.
Education factors
A country's education system is a remarkable part of social fabric. Its impact seems to be increasing, both the people are being educated and to a higher level, and the economic situation of these country. The person who has been educated and educated shows diversity with each other, show a different reaction with the products from uneducated people; i.e. the attitude toward marketing or government regulation also control the consumer behavior of them. In many developed countries, there are additional subculture to influence customer behavior, depended on the nationality, race and social stratification.
Gender factors
There are over 30 research studies on the compulsive buying that women are dominant effect amount (Dittman H., 2005, p.467). In the studies that study about compulsive buying scale, women mainly score magnificently higher than men (Dittman H., 2005, p.468); however, recently some studies pointed that women in late twenties measure a slightly higher than men (Ibid), and a study research about young generation hard to find any different between boys and
Umeå School of Business Author: Thanh Phan & Mai Tran Umeå University, Sweden Supervisor: Gert-Olof Boström Master thesis in Business Administration Spring Semester, 2011
27
girls (Roberts & Tanner, 2000, p.1260). Hence, woman, in general, are high percentage of vulnerability in compulsive buying.
Age
Our study is researching about the consumer attitude toward marketing to customer satisfaction and government regulation so that the object we tend to study is the household age from 35 to above or the student age area, Especially, the person who already has income will obviously spend their money differently to person who still are student or searching occupation. This reason leading to the fact that age also affects to the consumer attitude toward marketing, the expectation of each group also is also varied from each other.
3.3.2 Customer attitude toward marketing brought up in previous studies
There are many cross-national studies such as Ahmed & Batul (2008); Wee, C. H., & Chan, M. (1989) have studied about the reaction of customer attitude toward the marketing, consumerism and government regulation in developed countries); notwithstanding, developing countries situation in general and Vietnam's situation (more developing and least developed country) specifically are still gloomy imagines. Eventually, scholars have put many arguments that the consumer attitude to the marketing, consumerism and government regulation indicates good performance in firms in the degree of satisfying the customer needs (Tsang-Sing and Geng, 2008, p.81). Generally, customer attitude divides into two trends, possible opinion and opposite opinion about the consumerism and government regulation. If the consumers content with business practice, they will have favorable opinion on the consumerism and government movement or inverse situation. Normally, consumers are not favorable with business practice because they are uncertain about consumerism and government regulation can control the business activities in market (Barksdale et al., 1982; Fornell, 1992; Ger & Belk, 1996; Varadarajan et al, 1994).
The measurement of consumers’ attitude towards marketing has attracted many attentions from the academic to the commercial research world for many years. Dated back in time, the marketing and consumers’ behavior literature has marked number of efforts to develop a global measuring scale of consumers’ satisfaction with business world in general. Among all that have made it to the academic, there are notable ones including Barkslade & Darden (1972); Hustad & Pessemier (1973); Lundstrom & Lamont (1976); and later on Gaski & Etzel (1986; 2005). Respectively, the terms of “consumer sentiment” and “consumer confidence index” of the University of Michigan Survey Center and The Conference Board have received attention and are familiarized to even the general public. Initiated in 1946, the Michigan Survey measure consumer sentiment using random digit telephone interview on a rotating monthly national probability sample of roughly 800 households. A five-item instrument was adopted trying to tap different dimensions of individual finances, economic prospects, and buying. Working on the same issue, The Conference Board, collected data through National Family Opinion Inc. from a
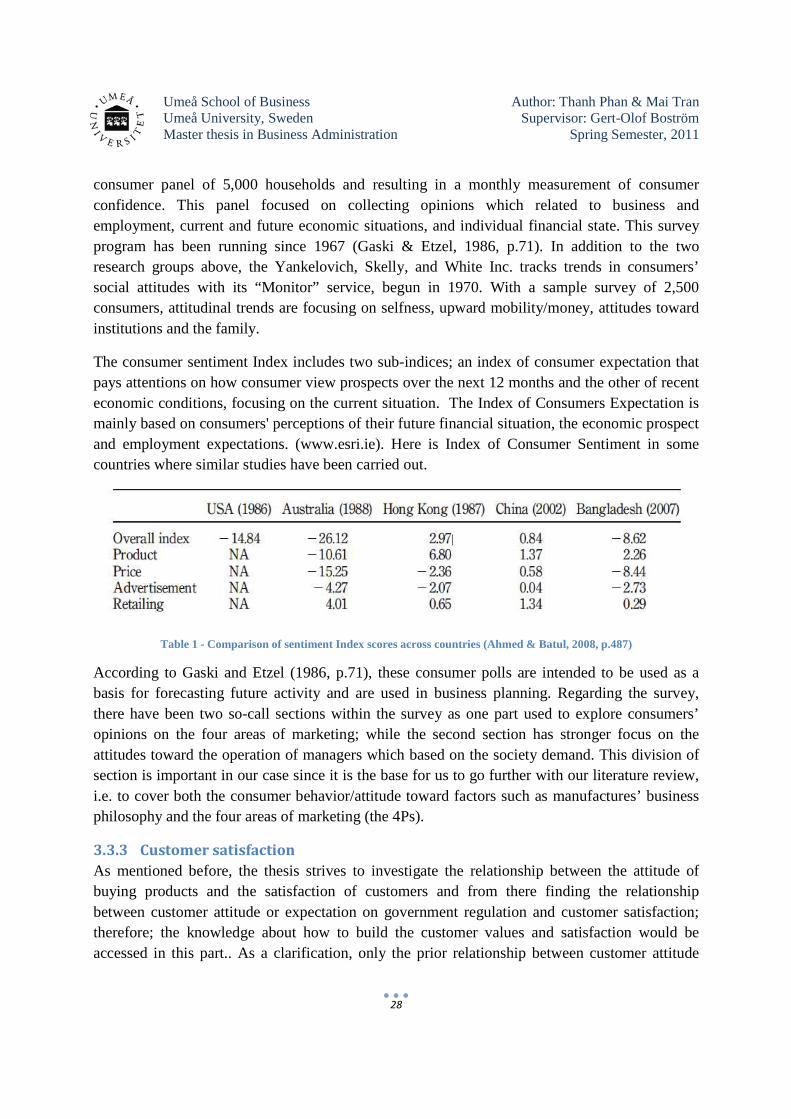
Umeå School of Business Author: Thanh Phan & Mai Tran Umeå University, Sweden Supervisor: Gert-Olof Boström Master thesis in Business Administration Spring Semester, 2011
28
consumer panel of 5,000 households and resulting in a monthly measurement of consumer confidence. This panel focused on collecting opinions which related to business and employment, current and future economic situations, and individual financial state. This survey program has been running since 1967 (Gaski & Etzel, 1986, p.71). In addition to the two research groups above, the Yankelovich, Skelly, and White Inc. tracks trends in consumers’ social attitudes with its “Monitor” service, begun in 1970. With a sample survey of 2,500 consumers, attitudinal trends are focusing on selfness, upward mobility/money, attitudes toward institutions and the family.
The consumer sentiment Index includes two sub-indices; an index of consumer expectation that pays attentions on how consumer view prospects over the next 12 months and the other of recent economic conditions, focusing on the current situation. The Index of Consumers Expectation is mainly based on consumers' perceptions of their future financial situation, the economic prospect and employment expectations. (www.esri.ie). Here is Index of Consumer Sentiment in some countries where similar studies have been carried out.
Table 1 - Comparison of sentiment Index scores across countries (Ahmed & Batul, 2008, p.487)
According to Gaski and Etzel (1986, p.71), these consumer polls are intended to be used as a basis for forecasting future activity and are used in business planning. Regarding the survey, there have been two so-call sections within the survey as one part used to explore consumers’ opinions on the four areas of marketing; while the second section has stronger focus on the attitudes toward the operation of managers which based on the society demand. This division of section is important in our case since it is the base for us to go further with our literature review, i.e. to cover both the consumer behavior/attitude toward factors such as manufactures’ business philosophy and the four areas of marketing (the 4Ps).
3.3.3 Customer satisfaction
As mentioned before, the thesis strives to investigate the relationship between the attitude of buying products and the satisfaction of customers and from there finding the relationship between customer attitude or expectation on government regulation and customer satisfaction; therefore; the knowledge about how to build the customer values and satisfaction would be accessed in this part.. As a clarification, only the prior relationship between customer attitude
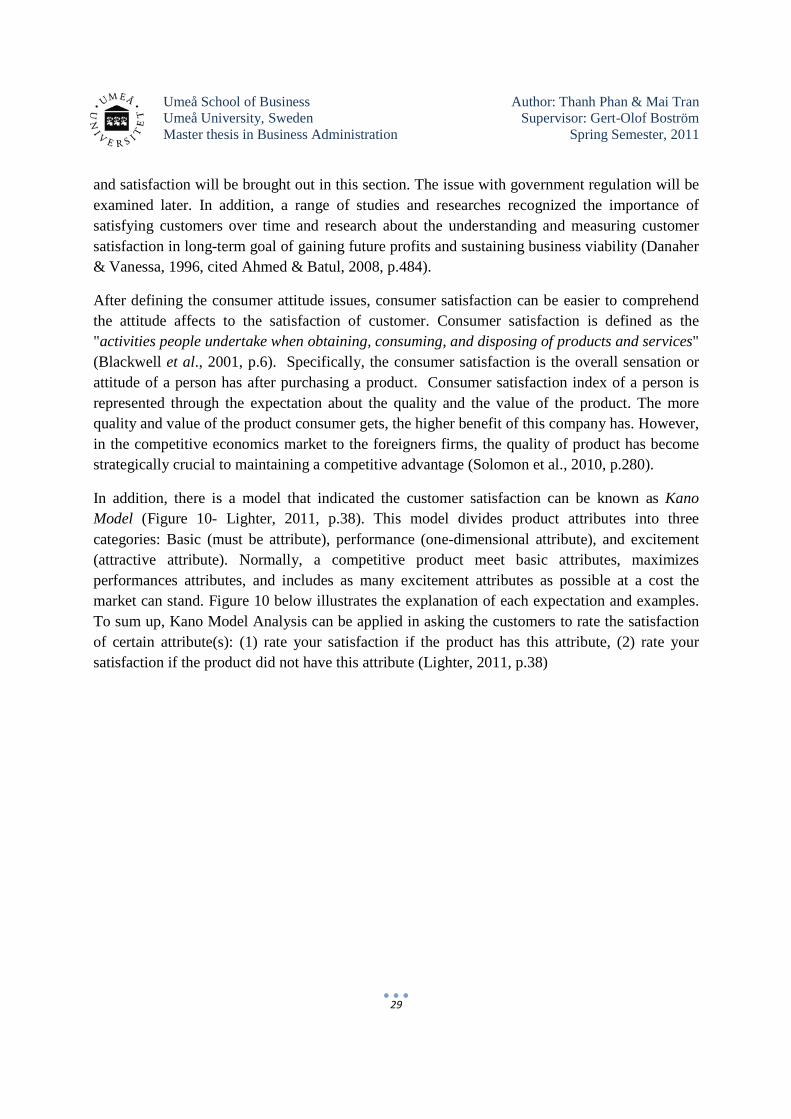
Umeå School of Business Author: Thanh Phan & Mai Tran Umeå University, Sweden Supervisor: Gert-Olof Boström Master thesis in Business Administration Spring Semester, 2011
29
and satisfaction will be brought out in this section. The issue with government regulation will be examined later. In addition, a range of studies and researches recognized the importance of satisfying customers over time and research about the understanding and measuring customer satisfaction in long-term goal of gaining future profits and sustaining business viability (Danaher & Vanessa, 1996, cited Ahmed & Batul, 2008, p.484).
After defining the consumer attitude issues, consumer satisfaction can be easier to comprehend the attitude affects to the satisfaction of customer. Consumer satisfaction is defined as the "activities people undertake when obtaining, consuming, and disposing of products and services" (Blackwell et al., 2001, p.6). Specifically, the consumer satisfaction is the overall sensation or attitude of a person has after purchasing a product. Consumer satisfaction index of a person is represented through the expectation about the quality and the value of the product. The more quality and value of the product consumer gets, the higher benefit of this company has. However, in the competitive economics market to the foreigners firms, the quality of product has become strategically crucial to maintaining a competitive advantage (Solomon et al., 2010, p.280).
In addition, there is a model that indicated the customer satisfaction can be known as Kano Model (Figure 10- Lighter, 2011, p.38). This model divides product attributes into three categories: Basic (must be attribute), performance (one-dimensional attribute), and excitement (attractive attribute). Normally, a competitive product meet basic attributes, maximizes performances attributes, and includes as many excitement attributes as possible at a cost the market can stand. Figure 10 below illustrates the explanation of each expectation and examples. To sum up, Kano Model Analysis can be applied in asking the customers to rate the satisfaction of certain attribute(s): (1) rate your satisfaction if the product has this attribute, (2) rate your satisfaction if the product did not have this attribute (Lighter, 2011, p.38)
Umeå School of Business Author: Thanh Phan & Mai Tran Umeå University, Sweden Supervisor: Gert-Olof Boström Master thesis in Business Administration Spring Semester, 2011
30
Figure 10 - The Kano Model of Customer satisfaction (Source: Lighter, 2011, p.38)
Furthermore, many researches also shown that product experience is very important for consumer satisfaction because the more experience in purchasing goods, the more expectation they give into the products. Then, when the consumer reaches to the certain level of experience, they will become the experts and this makes the purchasing easier and more realistic expectation.
In addition, satisfaction degrees are identified not only by the product purchased but also by the expectation about the quality of "alternatives" that were not purchased (Solomon et al., 2010, p.333). More detail, the higher of expectation about the unselected goods, the lower the degree of satisfaction with the purchased products. Hence, managers still try to find more and more strategies and appropriated decisions in order to get knowledge about the customer satisfaction and expectation. Our study also either serves for this purpose by finding the correlation between consumer attitude toward marketing activities and consumer satisfaction and government regulation.
3.3.4 Customer values and satisfaction
Nowadays, every company successful in the business market always takes the customer in a high appreciation of the business activities. Consequently, creating the trusted customers is considered to the heart of every business. Many companies have researches in how to understand the attitude of consumer and how to maximum the consumer satisfaction about their products. Eventually, the model of Customer-oriented-organization has been appeared as the current trend of marketing strategy. Normally, the chart presents top-management at the top, and then middle management, frontline people and customers at the bottom. Nevertheless, in this modern, the role of important things is converted. Serving and satisfy customer is the first target of company following this model. As the result, the "Customer perceived value" (CPV) originated to evaluate
Umeå School of Business Author: Thanh Phan & Mai Tran Umeå University, Sweden Supervisor: Gert-Olof Boström Master thesis in Business Administration Spring Semester, 2011
31
the level of customer satisfaction in the company. It was defined as "The difference between the prospective customer's evaluation of all the benefits and all the costs of an offering and the perceived alternatives". Simplistically, customer perceived value is based on the distinction between what the consumer gets and what he or she pays for different viable choices; and so, the company can easier increase the value of customer offering just by some composite of raising the determinants of customer perceived value. Via this tool, the consumers can verify the companies' claim and find out the optimal alternatives for their buying process.
In addition to, many companies also try to investigate the degree of satisfaction of the customer toward their products. It is so vital that how the customer satisfies after chase can be affected to the buyer's expectations and the total costs of production. Theoretically, satisfaction is "a person felling of pleasure or disappointment that result from comparing a product's perceived performance (or outcome) to their expectations" in the business field. The level of satisfaction factor of consumer normally depends on many factors, especially the brand of product. Specifically, when purchasing a product, the consumer usually has a habit and pays more attentions to the product that he or she feels familiar with or has positive about the brand (Kotler & Keller, 2009, p.164). Notwithstanding, increasing the degree of customer satisfaction is not an easy action for many companies, causing this affect directly to the benefits of companies. If the company only focuses on the request of customer satisfaction and pays less attention to other matter, it is also tough to increase the total revenues of the company.
3.3.5 Monitoring satisfaction
From the importance of how to satisfy the customer's view, many companies have done researches or systematically measurements about how well they deal with the customer satisfaction matter. Each company can have their own evaluation method to measure; i.e. doing the surveys about the customer satisfaction in every year or every quarter of year; or hiring the market research companies for a comprehensive view. Nonetheless, medium-sized firms or uppers usually have the research market company to investigated customer satisfaction through many methods.
From the point of view of customer-centered companies, customer satisfaction is not only a target but also a marketing tool. Once the consumer satisfy with your products, he or she will stays loyal longer and buys more products from your company, and even he or she will become a informative bridge between your products to his or her friends and relationship networking unintentionally the advertised and promoted products in the market. Moreover, greater customer satisfaction has also been connected to higher returns and lower risk in the stock market (Kotler & Keller, 2009, p.165).
In addition, when the company gets the high level of customer satisfaction, they should make sure that the target customers know about this information. For example, when Dell computer
Umeå School of Business Author: Thanh Phan & Mai Tran Umeå University, Sweden Supervisor: Gert-Olof Boström Master thesis in Business Administration Spring Semester, 2011
32
achieved the number- one rank in customer satisfaction in IT field base on the Customer Satisfaction rating from J.D. Power and Associates, they quickly advertised to their target markets. There are also a number of other methods to measure the customer satisfaction for example the Periodic survey, the customer loss rate, or the mystery shoppers etc. though this quantitative survey seems to be the most appropriate one for our case.
3.4 Government regulations
Besides the costumer behavior influents to their satisfaction of one product, government interventions also impact on buying decision of consumers. In brief, government has their strongest impact on the movement of consumerism. In Kotler (1972, p.49), he has defined consumerism as "a social movement designed to augment the rights and powers of buyers in relations to sellers". The consumer movement has affected by many organization and government regulations for example establishing oversee consumer-related activities. Other, including Varadarajan et al. (1990, p.21) confirms that consumer movement is considered as a prominent force within LDCs, which we believe to be the Vietnamese case as well. However, government tends to face themselves in difficult situation whereas conflicts in interests exist (Varadarajan et al., 1990, p.22). This comes from the two co-existing roles of government: consumer protector and industry/business protector (Kaynak, 1995, p.19). If government restrict the area of one product, the consumer will be tough to access this product. Similarly, government propose some sanctions or laws in order to limit the ability buying of customers, for example, they forbid consumer under 18 year old to buy cigarettes in many countries.
Recently, many countries have made a lot of attempt on making the companies more responsibilities for the complaints of consumers as well as making consumers well-educated and high awareness about their rights. Because the fact that manufactures try to maximize the profits while the consumers want to maximize utility, and these will make less revenue for the producers (Kaynak, 1985, p.17). This, nevertheless, refer mainly to the case of developed countries rather in developing or LDCS. Perception of consumers on government intervention is much less skeptical in LDCs or transitional countries in comparison to developed one (Darley and Johnson, 1993, p.53).
In fact, the study of Darley and Johnson (1993) shows that in the developed countries, the role of government intervention in protecting consumer rights has no power to control the consumer movement. In addition to the other matters such as political orientation, level of inflation, standard of living, the strength of consumer movement and attitude toward business may affect on the government regulation of business. The list below demonstrated main targets of EU community about the consumer strategy in the period of 2007-2013.
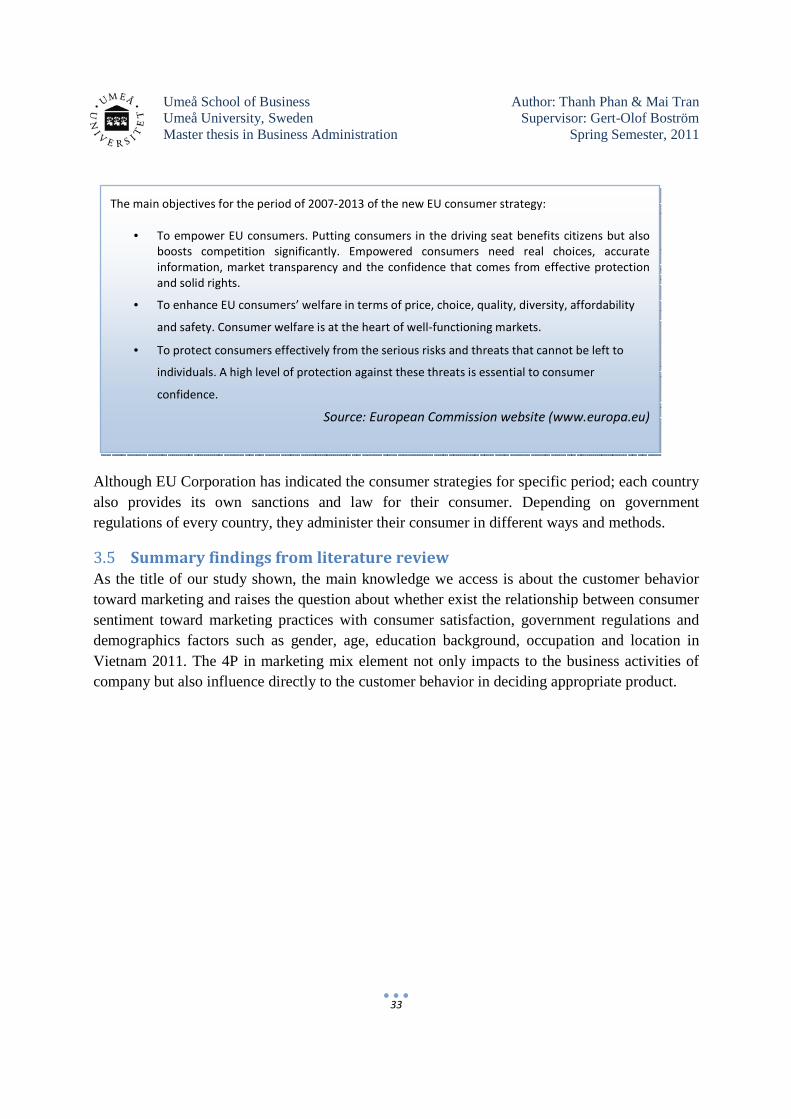
Umeå School of Business Author: Thanh Phan & Mai Tran Umeå University, Sweden Supervisor: Gert-Olof Boström Master thesis in Business Administration Spring Semester, 2011
33
Although EU Corporation has indicated the consumer strategies for specific period; each country also provides its own sanctions and law for their consumer. Depending on government regulations of every country, they administer their consumer in different ways and methods.
3.5 Summary findings from literature review
As the title of our study shown, the main knowledge we access is about the customer behavior toward marketing and raises the question about whether exist the relationship between consumer sentiment toward marketing practices with consumer satisfaction, government regulations and demographics factors such as gender, age, education background, occupation and location in Vietnam 2011. The 4P in marketing mix element not only impacts to the business activities of company but also influence directly to the customer behavior in deciding appropriate product.
The main objectives for the period of 2007-2013 of the new EU consumer strategy:
• To empower EU consumers. Putting consumers in the driving seat benefits citizens but also
boosts competition significantly. Empowered consumers need real choices, accurate
information, market transparency and the confidence that comes from effective protection
and solid rights.
• To enhance EU consumers’ welfare in terms of price, choice, quality, diversity, affordability
and safety. Consumer welfare is at the heart of well-functioning markets.
• To protect consumers effectively from the serious risks and threats that cannot be left to
individuals. A high level of protection against these threats is essential to consumer
confidence.
Source: European Commission website (www.europa.eu)
Umeå School of Business Author: Thanh Phan & Mai Tran Umeå University, Sweden Supervisor: Gert-Olof Boström Master thesis in Business Administration Spring Semester, 2011
34
4. Research Method (II) As a continuation of chapter II - Research methodology, this section presents the construction of hypotheses, questions in the surveys, and measurement scales. In sum, it aims to reveal the practical process, which supposedly deducted from the chosen methodological theoretical standpoint and the field theories - a combined result of both previous chapters.
4.1 Hypothesis construction
Customer attitude toward satisfaction:
Have been transforming from developing into a least-developed-economy country recently, Vietnam has to face with competitive and robustly developing market, especially within the two biggest cities of Vietnam, Hanoi and Ho Chi Minh City. Thus, understanding consumer attitudes and sentiment are very crucial for marketing researchers. However, a range of previous studies have only shown examples of Hong Kong (Chu & Mabel 2007) and Middle East countries such as Bangladesh (Ahemed & Batul, 2008). The researchers studied about the customer behaviors usually base on the experience in the marketplace; notwithstanding, consumer attitude toward marketing (through the four elements of marketing mix) should have a notable impact on satisfaction (Gaski & Etzel, 1986, p.72). Moreover, according to Tsang-Sing and Geng (2004, p.22), the consumer attitude toward marketing mix elements had a remarkable influence on consumers’ satisfaction level, especially in a transitional economy. Whether a consumer attitude towards marketing impact satisfaction in Vietnam is to be ascertained, the following hypotheses are suggested:
H1: In Vietnam, the consumer attitudes towards marketing mix have an impact on consumer satisfaction.
Customer attitude towards marketing and government regulation:
From previous studies, there seems to be a link between customer satisfactions with government regulations in some developed economies in the world, yet left unproven for transitional or less developing countries. It is suggested that the level of government intervention affecting consumer movement in developed countries is less than in developing those (Kaynak, 1993, p.17). More specifically, in the case of developed countries, the consumer movements are usually following the government regulation and they tend to be satisfied with the status quo of the marketing activities; whereas, the situation of developing or least developed countries are opposite (Kaynak, 1993; Varadarajan et al., 1990; Darley & Johnson, 1993). In addition, Barksdale (1982, p.71) pointed out that aside from the political orientation of a country; the encouragement for the consumer movement and consumers' attitude toward marketing may affect the judgments of government regulation on business in that country. Therefore, what trend of consumer attitude toward marketing in Vietnam, a least developed country, is following? Or
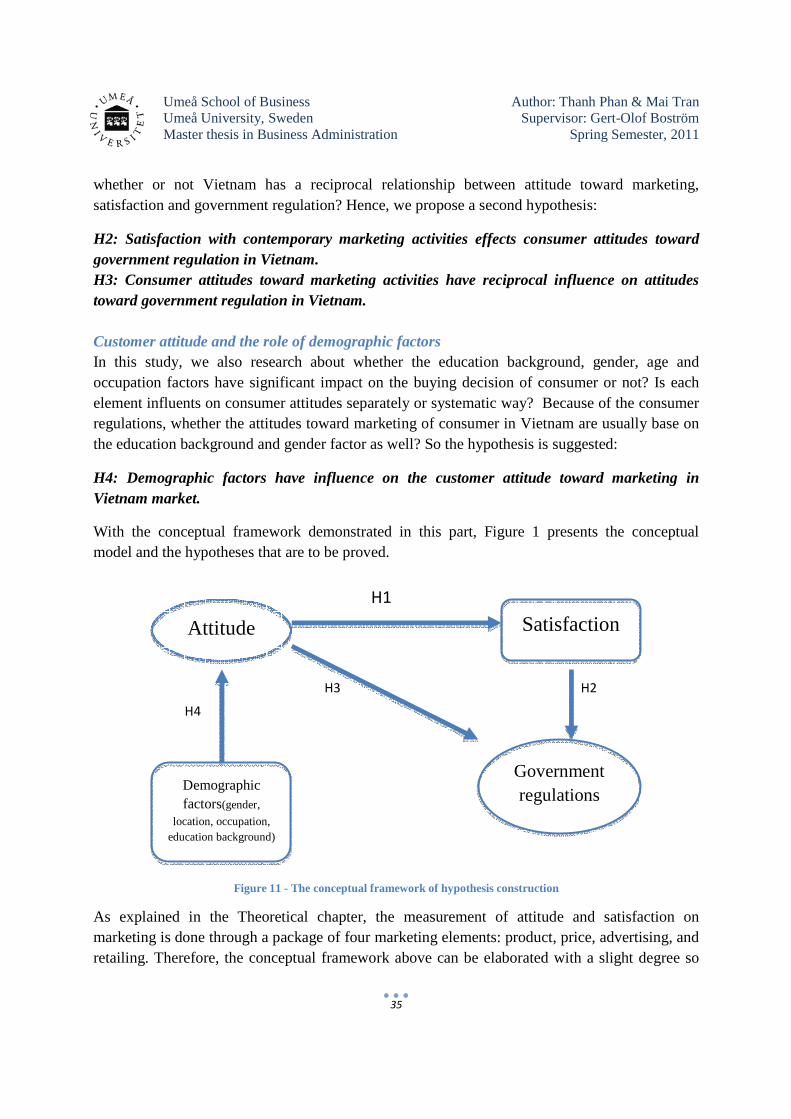
Umeå School of Business Author: Thanh Phan & Mai Tran Umeå University, Sweden Supervisor: Gert-Olof Boström Master thesis in Business Administration Spring Semester, 2011
35
whether or not Vietnam has a reciprocal relationship between attitude toward marketing, satisfaction and government regulation? Hence, we propose a second hypothesis:
H2: Satisfaction with contemporary marketing activities effects consumer attitudes toward government regulation in Vietnam. H3: Consumer attitudes toward marketing activities have reciprocal influence on attitudes toward government regulation in Vietnam. Customer attitude and the role of demographic factors In this study, we also research about whether the education background, gender, age and occupation factors have significant impact on the buying decision of consumer or not? Is each element influents on consumer attitudes separately or systematic way? Because of the consumer regulations, whether the attitudes toward marketing of consumer in Vietnam are usually base on the education background and gender factor as well? So the hypothesis is suggested:
H4: Demographic factors have influence on the customer attitude toward marketing in Vietnam market.
With the conceptual framework demonstrated in this part, Figure 1 presents the conceptual model and the hypotheses that are to be proved.
Figure 11 - The conceptual framework of hypothesis construction
As explained in the Theoretical chapter, the measurement of attitude and satisfaction on marketing is done through a package of four marketing elements: product, price, advertising, and retailing. Therefore, the conceptual framework above can be elaborated with a slight degree so
Government regulations
Satisfaction
Demographic factors(gender,
location, occupation, education background)
Attitude
H1
H2 H3
H4
Umeå School of Business Author: Thanh Phan & Mai Tran Umeå University, Sweden Supervisor: Gert-Olof Boström Master thesis in Business Administration Spring Semester, 2011
36
that readers can grasp the authors’ conceptual model of correlation findings. However, this later model focuses on the three main variables of this thesis, which is Attitude, Satisfaction, and Government regulation; the factors of demographic are temporarily skipped.
4.2 The Instrument
As mentioned in the introductory chapter as well as the literature review, this type of macro-level of marketing system measurement was initiated in the US. At first, the study was conducted through multi-item scale and a national mail sample to measure the sentiment towards various transactional dimensions of business (Barksdale et al. 1976; Barksdale & Perreault 1980; “BDP” hereafter). The later on developed model of was by Fornell et al. (1996), called the American Customer Satisfaction Index (ACSI) which managed to help recorded a longitudinal decline value in the US market (Spencer and Albergotti, 2004). In 2008, Gaski’s publication (2008) introduced the refined version of an instrument which as well used to gauge consumer attitude in large quantity. The instrument is named Index of Consumer Sentiment toward Marketing (ICSM) (Ibid).
In this project, we decide to apply this ICSM instrument as the main technique besides other several statistic techniques. ICSM not only measures consumer sentiment but also many others unique and constructive features for our statistic and summary part. In real world, the primary channels which consumers come into contact with marketing are Product, Price, Advertising, and Retailers. Normally, the last P element of the marketing mix: Place - usually known as retailer activities of firms so that 4 elements in the marketing management, product, price, promotion and place are pointed. Stated by the same scholar, other elements including physical distribution and marketing research had proven to have little connection to customers and therefore are excluded. Scilicet, the most common mean distribution is embodied to the customer is through the advertising element of marketing and spilled over to the interaction with retailers. Though this instrument does not present as a perfect scale which respondent one-to-one with the four marketing functional element, they are substantially covered nonetheless (Gaski and Etzel 1986; Gaski, 2008). With instrument, there are two main components that make this investigation possible: questionnaire and the formulation for Index calculation. We will discuss them thoroughly in the coming section.
4.2.1 Questionnaire design
By applying the method of which originated by Barksdale et al. (1976); Barksdale and Perreault (1980); “BDP” hereafter, and later refined by Gaski & Etzel (1986), and Gaski (2005), we also adopt their pre-designed questionnaire. The original questionnaire consists of 8 sections, with a total of 44 items.
For this thesis, we have applied the questionnaire with refinements. Compare to Gaski (1986) version, the questionnaire was shorten to 6 sections (with the aid of one extra on government
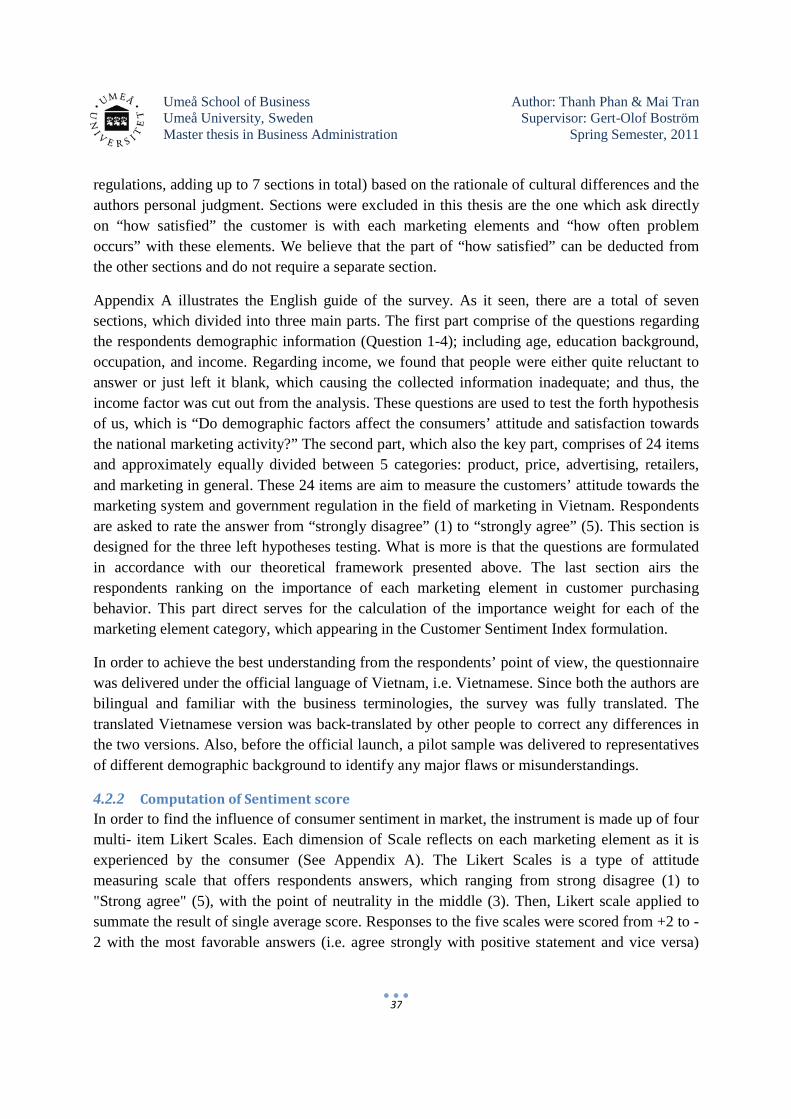
Umeå School of Business Author: Thanh Phan & Mai Tran Umeå University, Sweden Supervisor: Gert-Olof Boström Master thesis in Business Administration Spring Semester, 2011
37
regulations, adding up to 7 sections in total) based on the rationale of cultural differences and the authors personal judgment. Sections were excluded in this thesis are the one which ask directly on “how satisfied” the customer is with each marketing elements and “how often problem occurs” with these elements. We believe that the part of “how satisfied” can be deducted from the other sections and do not require a separate section.
Appendix A illustrates the English guide of the survey. As it seen, there are a total of seven sections, which divided into three main parts. The first part comprise of the questions regarding the respondents demographic information (Question 1-4); including age, education background, occupation, and income. Regarding income, we found that people were either quite reluctant to answer or just left it blank, which causing the collected information inadequate; and thus, the income factor was cut out from the analysis. These questions are used to test the forth hypothesis of us, which is “Do demographic factors affect the consumers’ attitude and satisfaction towards the national marketing activity?” The second part, which also the key part, comprises of 24 items and approximately equally divided between 5 categories: product, price, advertising, retailers, and marketing in general. These 24 items are aim to measure the customers’ attitude towards the marketing system and government regulation in the field of marketing in Vietnam. Respondents are asked to rate the answer from “strongly disagree” (1) to “strongly agree” (5). This section is designed for the three left hypotheses testing. What is more is that the questions are formulated in accordance with our theoretical framework presented above. The last section airs the respondents ranking on the importance of each marketing element in customer purchasing behavior. This part direct serves for the calculation of the importance weight for each of the marketing element category, which appearing in the Customer Sentiment Index formulation.
In order to achieve the best understanding from the respondents’ point of view, the questionnaire was delivered under the official language of Vietnam, i.e. Vietnamese. Since both the authors are bilingual and familiar with the business terminologies, the survey was fully translated. The translated Vietnamese version was back-translated by other people to correct any differences in the two versions. Also, before the official launch, a pilot sample was delivered to representatives of different demographic background to identify any major flaws or misunderstandings.
4.2.2 Computation of Sentiment score In order to find the influence of consumer sentiment in market, the instrument is made up of four multi- item Likert Scales. Each dimension of Scale reflects on each marketing element as it is experienced by the consumer (See Appendix A). The Likert Scales is a type of attitude measuring scale that offers respondents answers, which ranging from strong disagree (1) to "Strong agree" (5), with the point of neutrality in the middle (3). Then, Likert scale applied to summate the result of single average score. Responses to the five scales were scored from +2 to -2 with the most favorable answers (i.e. agree strongly with positive statement and vice versa)
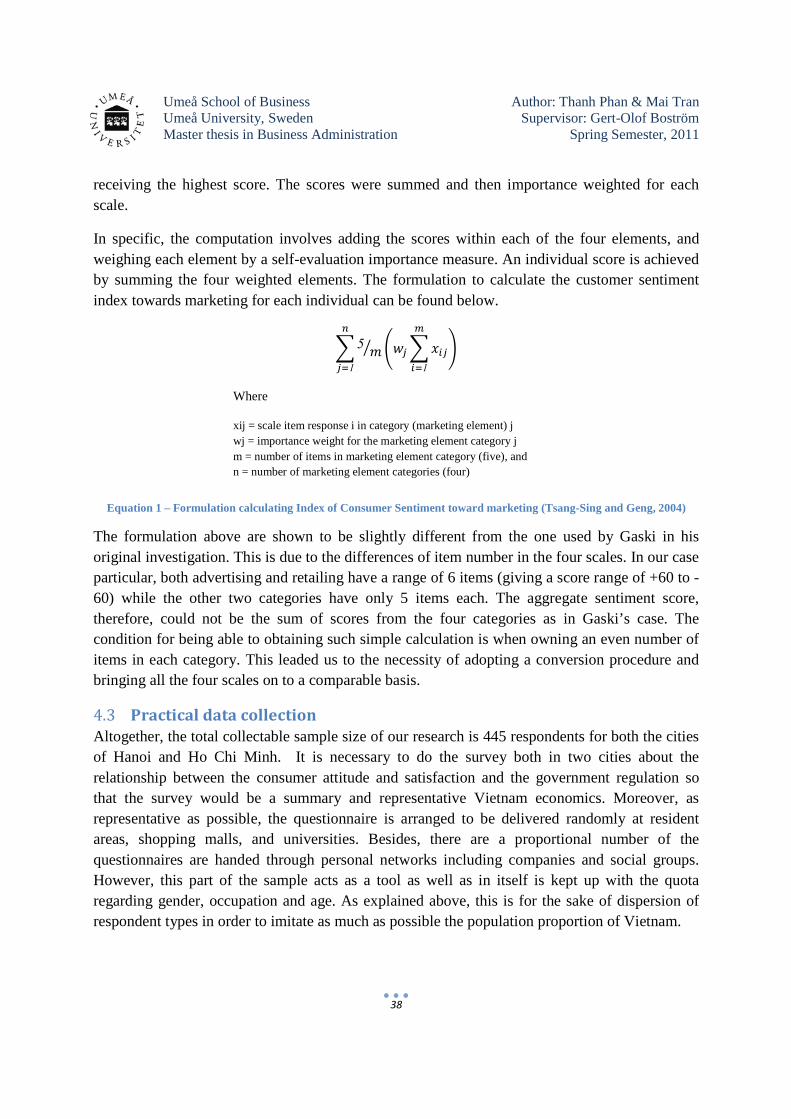
Umeå School of Business Author: Thanh Phan & Mai Tran Umeå University, Sweden Supervisor: Gert-Olof Boström Master thesis in Business Administration Spring Semester, 2011
38
receiving the highest score. The scores were summed and then importance weighted for each scale.
In specific, the computation involves adding the scores within each of the four elements, and weighing each element by a self-evaluation importance measure. An individual score is achieved by summing the four weighted elements. The formulation to calculate the customer sentiment index towards marketing for each individual can be found below.
� 5 �� �������
�1�
�
�1
Where
xij = scale item response i in category (marketing element) j wj = importance weight for the marketing element category j m = number of items in marketing element category (five), and n = number of marketing element categories (four)
Equation 1 – Formulation calculating Index of Consumer Sentiment toward marketing (Tsang-Sing and Geng, 2004)
The formulation above are shown to be slightly different from the one used by Gaski in his original investigation. This is due to the differences of item number in the four scales. In our case particular, both advertising and retailing have a range of 6 items (giving a score range of +60 to -60) while the other two categories have only 5 items each. The aggregate sentiment score, therefore, could not be the sum of scores from the four categories as in Gaski’s case. The condition for being able to obtaining such simple calculation is when owning an even number of items in each category. This leaded us to the necessity of adopting a conversion procedure and bringing all the four scales on to a comparable basis.
4.3 Practical data collection
Altogether, the total collectable sample size of our research is 445 respondents for both the cities of Hanoi and Ho Chi Minh. It is necessary to do the survey both in two cities about the relationship between the consumer attitude and satisfaction and the government regulation so that the survey would be a summary and representative Vietnam economics. Moreover, as representative as possible, the questionnaire is arranged to be delivered randomly at resident areas, shopping malls, and universities. Besides, there are a proportional number of the questionnaires are handed through personal networks including companies and social groups. However, this part of the sample acts as a tool as well as in itself is kept up with the quota regarding gender, occupation and age. As explained above, this is for the sake of dispersion of respondent types in order to imitate as much as possible the population proportion of Vietnam.
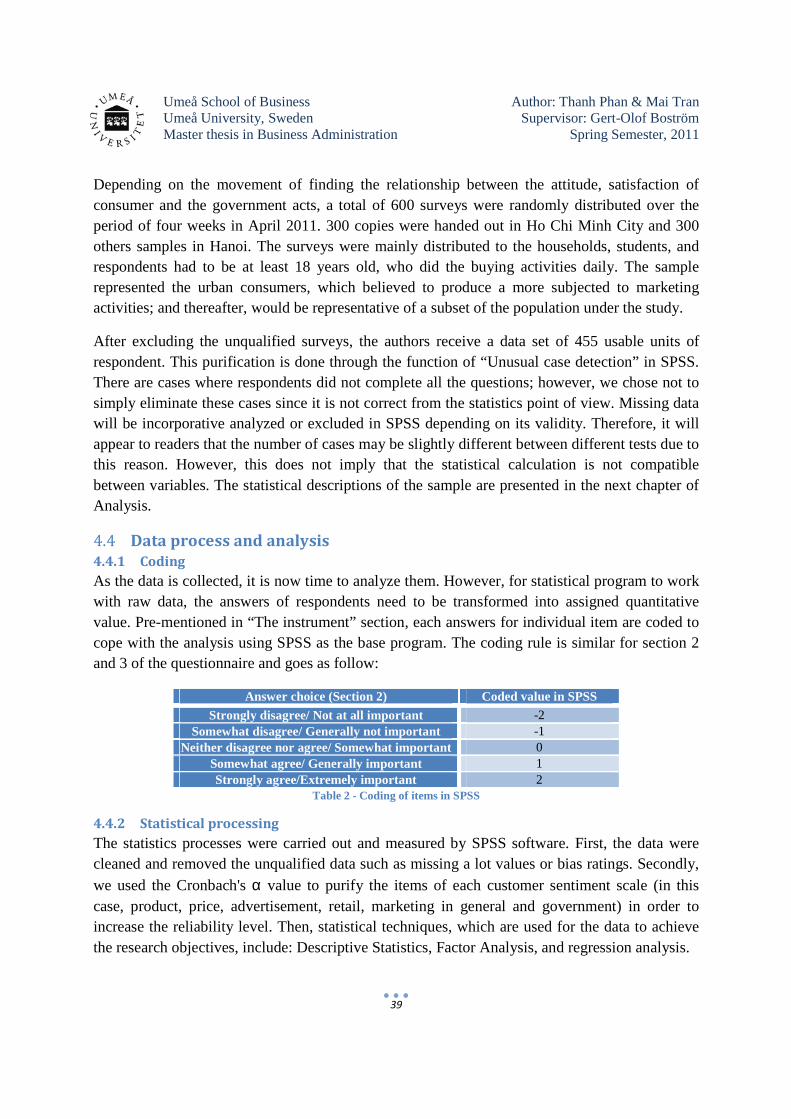
Umeå School of Business Author: Thanh Phan & Mai Tran Umeå University, Sweden Supervisor: Gert-Olof Boström Master thesis in Business Administration Spring Semester, 2011
39
Depending on the movement of finding the relationship between the attitude, satisfaction of consumer and the government acts, a total of 600 surveys were randomly distributed over the period of four weeks in April 2011. 300 copies were handed out in Ho Chi Minh City and 300 others samples in Hanoi. The surveys were mainly distributed to the households, students, and respondents had to be at least 18 years old, who did the buying activities daily. The sample represented the urban consumers, which believed to produce a more subjected to marketing activities; and thereafter, would be representative of a subset of the population under the study.
After excluding the unqualified surveys, the authors receive a data set of 455 usable units of respondent. This purification is done through the function of “Unusual case detection” in SPSS. There are cases where respondents did not complete all the questions; however, we chose not to simply eliminate these cases since it is not correct from the statistics point of view. Missing data will be incorporative analyzed or excluded in SPSS depending on its validity. Therefore, it will appear to readers that the number of cases may be slightly different between different tests due to this reason. However, this does not imply that the statistical calculation is not compatible between variables. The statistical descriptions of the sample are presented in the next chapter of Analysis.
4.4 Data process and analysis
4.4.1 Coding
As the data is collected, it is now time to analyze them. However, for statistical program to work with raw data, the answers of respondents need to be transformed into assigned quantitative value. Pre-mentioned in “The instrument” section, each answers for individual item are coded to cope with the analysis using SPSS as the base program. The coding rule is similar for section 2 and 3 of the questionnaire and goes as follow:
Answer choice (Section 2) Coded value in SPSS
Strongly disagree/ Not at all important -2 Somewhat disagree/ Generally not important -1
Neither disagree nor agree/ Somewhat important 0 Somewhat agree/ Generally important 1 Strongly agree/Extremely important 2
Table 2 - Coding of items in SPSS
4.4.2 Statistical processing
The statistics processes were carried out and measured by SPSS software. First, the data were cleaned and removed the unqualified data such as missing a lot values or bias ratings. Secondly, we used the Cronbach's α value to purify the items of each customer sentiment scale (in this case, product, price, advertisement, retail, marketing in general and government) in order to increase the reliability level. Then, statistical techniques, which are used for the data to achieve the research objectives, include: Descriptive Statistics, Factor Analysis, and regression analysis.
Umeå School of Business Author: Thanh Phan & Mai Tran Umeå University, Sweden Supervisor: Gert-Olof Boström Master thesis in Business Administration Spring Semester, 2011
40
Cronbach's Alpha test
It is usually used to test the internal consistency reliability of measurements that are in formats of continuous variables (5- point Likert measurement in our study). This test summarized statically the consistency of specific sample of respondents across a set of questions or variables. In the other words, it helps the statistician estimate the reliability of participants' responses to the measurements (Helms, Henze, Sass & Mifsud, 2006, p.633). Normally, Cronbach's alpha test is applied in social and behavioral researches as an indicator of reliability (Liu, Wu & Zumbo, 2010, p.5). As such, the Cronbach's Alpha test is totally appropriated for this study because the questionnaires consist of 5- point Likert measurements and the research is in consumer behavior. In this study, the authors used Cronbach's alpha to test the reliability of the measurements included in the factors that are formed before using other statistics techniques.
Nunnally (1978, p.245) proposed that Cronbach's alpha should be at least 0.7 to make sure that the measurements are reliable. Nevertheless, many statisticians indicated that it could be acceptable if the Cronbach's alpha is over 0.6 (Shelby, 2011, p.143). This research the overall Cronbach's alpha id 0.6999 with individual scale is all approximately 0.5.
Descriptive Statistics
Descriptive statistics (mode, median, mean, variance, standard deviation, F- test and T-test) are used to describe the impact level of behavioral variables on the consumer satisfaction and government regulations in Vietnam. However, in this research, only mean, standard deviations, F- test and T-test are put into the consideration of description. This descriptions help to prove the hypothesis H1, H2, Ho3 and H4 which are referred in research method of chapter 4.
Factor Analysis
This analyzing technique aims to define the core structure in a matrix of data. It helps to analyze the structure of correlations among many variables by identifying a set of core dimensions, called factors (Ghauri & Gronhaug, 2010, p.198). In this analysis, variables of the questionnaire are included in homogeneous domains that constituted the similar characteristics (O' brien, 2007, p. 143). There are two main typed of factor analysis: EFA (exploratory factor analysis) and CFA (confirmatory factor analysis). In this research, we applied the EFA approach that attempted to explore the underlying structure of a fairly large number of variables (Liua & Salvend, 2009, p.506). Applying in this study, EFA is used to explore the factors that variables of consumer behavior and consumer satisfaction, government regulation and demographic factors as well of the questionnaire belong to. EFA is used to decrease the number of item in the questionnaires that did not meet the requirement of the analysis (O' brien, 2007, p.142).
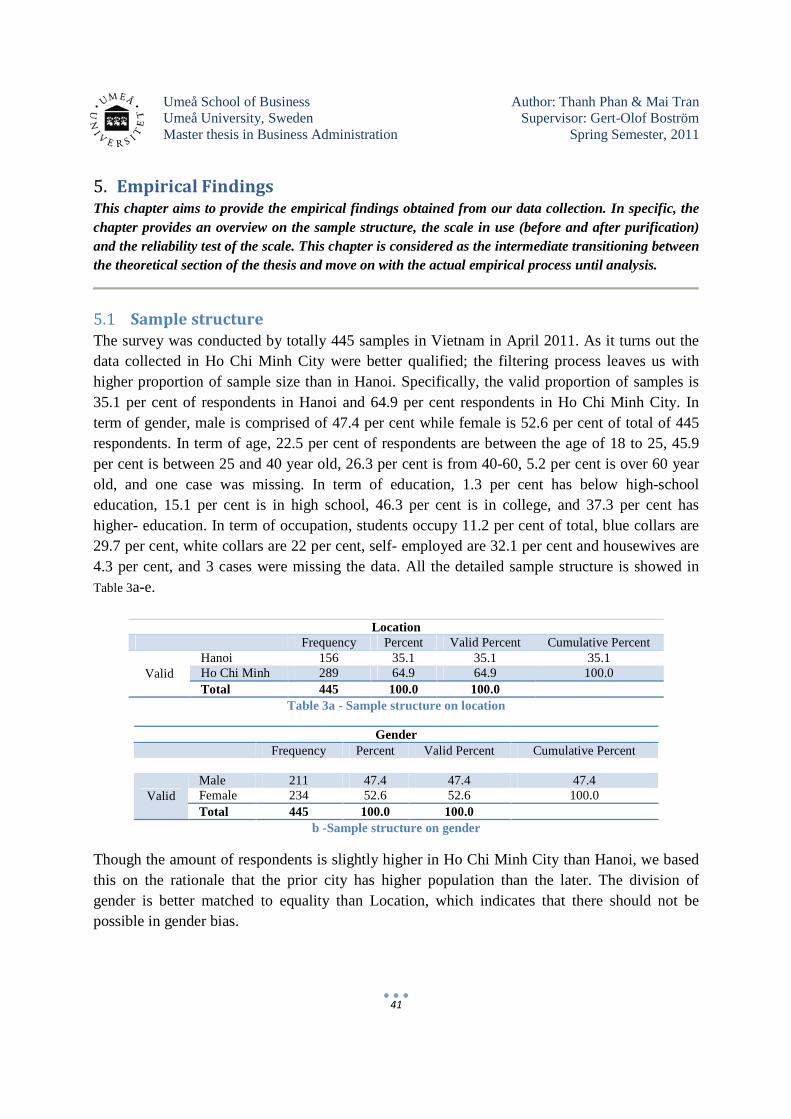
Umeå School of Business Author: Thanh Phan & Mai Tran Umeå University, Sweden Supervisor: Gert-Olof Boström Master thesis in Business Administration Spring Semester, 2011
41
5. Empirical Findings This chapter aims to provide the empirical findings obtained from our data collection. In specific, the chapter provides an overview on the sample structure, the scale in use (before and after purification) and the reliability test of the scale. This chapter is considered as the intermediate transitioning between the theoretical section of the thesis and move on with the actual empirical process until analysis.
5.1 Sample structure
The survey was conducted by totally 445 samples in Vietnam in April 2011. As it turns out the data collected in Ho Chi Minh City were better qualified; the filtering process leaves us with higher proportion of sample size than in Hanoi. Specifically, the valid proportion of samples is 35.1 per cent of respondents in Hanoi and 64.9 per cent respondents in Ho Chi Minh City. In term of gender, male is comprised of 47.4 per cent while female is 52.6 per cent of total of 445 respondents. In term of age, 22.5 per cent of respondents are between the age of 18 to 25, 45.9 per cent is between 25 and 40 year old, 26.3 per cent is from 40-60, 5.2 per cent is over 60 year old, and one case was missing. In term of education, 1.3 per cent has below high-school education, 15.1 per cent is in high school, 46.3 per cent is in college, and 37.3 per cent has higher- education. In term of occupation, students occupy 11.2 per cent of total, blue collars are 29.7 per cent, white collars are 22 per cent, self- employed are 32.1 per cent and housewives are 4.3 per cent, and 3 cases were missing the data. All the detailed sample structure is showed in Table 3a-e.
Location Frequency Percent Valid Percent Cumulative Percent
Valid Hanoi 156 35.1 35.1 35.1 Ho Chi Minh 289 64.9 64.9 100.0 Total 445 100.0 100.0
Table 3a - Sample structure on location
Gender Frequency Percent Valid Percent Cumulative Percent
Valid Male 211 47.4 47.4 47.4 Female 234 52.6 52.6 100.0 Total 445 100.0 100.0
b -Sample structure on gender
Though the amount of respondents is slightly higher in Ho Chi Minh City than Hanoi, we based this on the rationale that the prior city has higher population than the later. The division of gender is better matched to equality than Location, which indicates that there should not be possible in gender bias.
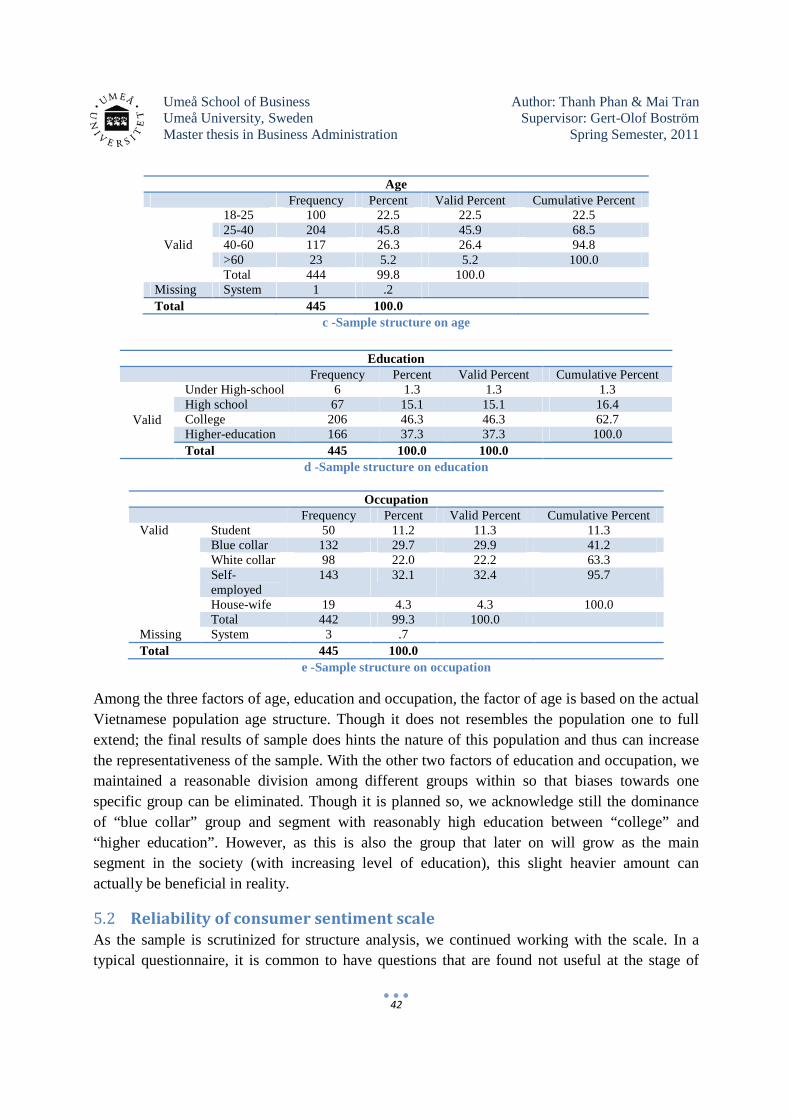
Umeå School of Business Author: Thanh Phan & Mai Tran Umeå University, Sweden Supervisor: Gert-Olof Boström Master thesis in Business Administration Spring Semester, 2011
42
Age Frequency Percent Valid Percent Cumulative Percent
Valid
18-25 100 22.5 22.5 22.5 25-40 204 45.8 45.9 68.5 40-60 117 26.3 26.4 94.8 >60 23 5.2 5.2 100.0 Total 444 99.8 100.0
Missing System 1 .2 Total 445 100.0
c -Sample structure on age
d -Sample structure on education
e -Sample structure on occupation
Among the three factors of age, education and occupation, the factor of age is based on the actual Vietnamese population age structure. Though it does not resembles the population one to full extend; the final results of sample does hints the nature of this population and thus can increase the representativeness of the sample. With the other two factors of education and occupation, we maintained a reasonable division among different groups within so that biases towards one specific group can be eliminated. Though it is planned so, we acknowledge still the dominance of “blue collar” group and segment with reasonably high education between “college” and “higher education”. However, as this is also the group that later on will grow as the main segment in the society (with increasing level of education), this slight heavier amount can actually be beneficial in reality.
5.2 Reliability of consumer sentiment scale
As the sample is scrutinized for structure analysis, we continued working with the scale. In a typical questionnaire, it is common to have questions that are found not useful at the stage of
Education Frequency Percent Valid Percent Cumulative Percent
Valid
Under High-school 6 1.3 1.3 1.3 High school 67 15.1 15.1 16.4 College 206 46.3 46.3 62.7 Higher-education 166 37.3 37.3 100.0 Total 445 100.0 100.0
Occupation Frequency Percent Valid Percent Cumulative Percent
Valid Student 50 11.2 11.3 11.3 Blue collar 132 29.7 29.9 41.2 White collar 98 22.0 22.2 63.3 Self-employed
143 32.1 32.4 95.7
House-wife 19 4.3 4.3 100.0 Total 442 99.3 100.0
Missing System 3 .7 Total 445 100.0
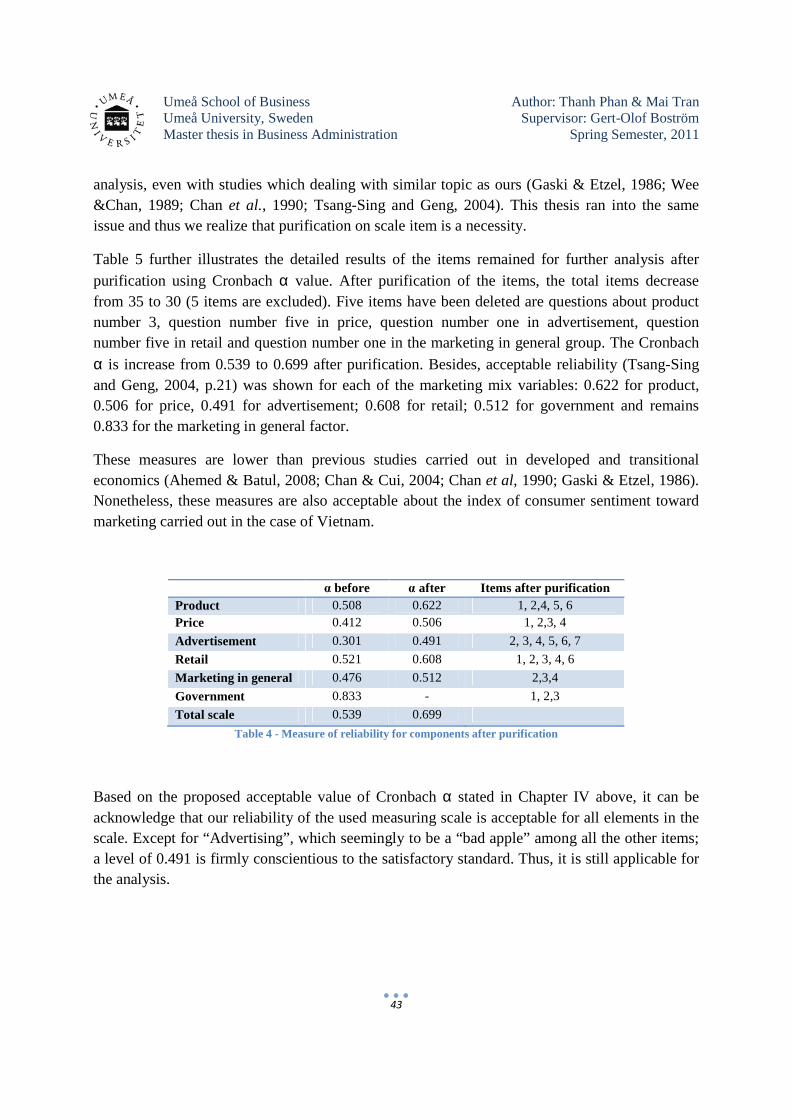
Umeå School of Business Author: Thanh Phan & Mai Tran Umeå University, Sweden Supervisor: Gert-Olof Boström Master thesis in Business Administration Spring Semester, 2011
43
analysis, even with studies which dealing with similar topic as ours (Gaski & Etzel, 1986; Wee &Chan, 1989; Chan et al., 1990; Tsang-Sing and Geng, 2004). This thesis ran into the same issue and thus we realize that purification on scale item is a necessity.
Table 5 further illustrates the detailed results of the items remained for further analysis after purification using Cronbach α value. After purification of the items, the total items decrease from 35 to 30 (5 items are excluded). Five items have been deleted are questions about product number 3, question number five in price, question number one in advertisement, question number five in retail and question number one in the marketing in general group. The Cronbach
α is increase from 0.539 to 0.699 after purification. Besides, acceptable reliability (Tsang-Sing and Geng, 2004, p.21) was shown for each of the marketing mix variables: 0.622 for product, 0.506 for price, 0.491 for advertisement; 0.608 for retail; 0.512 for government and remains 0.833 for the marketing in general factor.
These measures are lower than previous studies carried out in developed and transitional economics (Ahemed & Batul, 2008; Chan & Cui, 2004; Chan et al, 1990; Gaski & Etzel, 1986). Nonetheless, these measures are also acceptable about the index of consumer sentiment toward marketing carried out in the case of Vietnam.
α before α after Items after purification Product 0.508 0.622 1, 2,4, 5, 6 Price 0.412 0.506 1, 2,3, 4
Advertisement 0.301 0.491 2, 3, 4, 5, 6, 7
Retail 0.521 0.608 1, 2, 3, 4, 6
Marketing in general 0.476 0.512 2,3,4
Government 0.833 - 1, 2,3
Total scale 0.539 0.699
Table 4 - Measure of reliability for components after purification
Based on the proposed acceptable value of Cronbach α stated in Chapter IV above, it can be acknowledge that our reliability of the used measuring scale is acceptable for all elements in the scale. Except for “Advertising”, which seemingly to be a “bad apple” among all the other items; a level of 0.491 is firmly conscientious to the satisfactory standard. Thus, it is still applicable for the analysis.
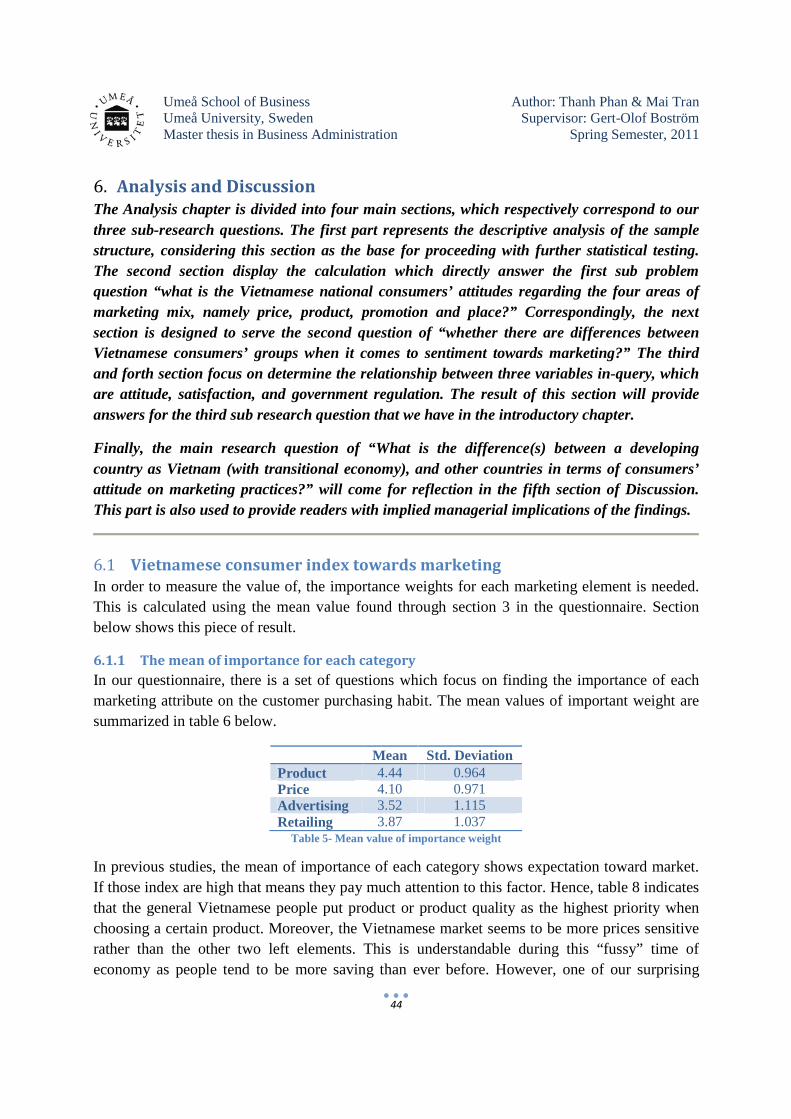
Umeå School of Business Author: Thanh Phan & Mai Tran Umeå University, Sweden Supervisor: Gert-Olof Boström Master thesis in Business Administration Spring Semester, 2011
44
6. Analysis and Discussion
The Analysis chapter is divided into four main sections, which respectively correspond to our three sub-research questions. The first part represents the descriptive analysis of the sample structure, considering this section as the base for proceeding with further statistical testing. The second section display the calculation which directly answer the first sub problem question “what is the Vietnamese national consumers’ attitudes regarding the four areas of marketing mix, namely price, product, promotion and place?” Correspondingly, the next section is designed to serve the second question of “whether there are differences between Vietnamese consumers’ groups when it comes to sentiment towards marketing?” The third and forth section focus on determine the relationship between three variables in-query, which are attitude, satisfaction, and government regulation. The result of this section will provide answers for the third sub research question that we have in the introductory chapter.
Finally, the main research question of “What is the difference(s) between a developing country as Vietnam (with transitional economy), and other countries in terms of consumers’ attitude on marketing practices?” will come for reflection in the fifth section of Discussion. This part is also used to provide readers with implied managerial implications of the findings.
6.1 Vietnamese consumer index towards marketing
In order to measure the value of, the importance weights for each marketing element is needed. This is calculated using the mean value found through section 3 in the questionnaire. Section below shows this piece of result.
6.1.1 The mean of importance for each category
In our questionnaire, there is a set of questions which focus on finding the importance of each marketing attribute on the customer purchasing habit. The mean values of important weight are summarized in table 6 below.
Mean Std. Deviation Product 4.44 0.964 Price 4.10 0.971 Advertising 3.52 1.115 Retailing 3.87 1.037
Table 5- Mean value of importance weight
In previous studies, the mean of importance of each category shows expectation toward market. If those index are high that means they pay much attention to this factor. Hence, table 8 indicates that the general Vietnamese people put product or product quality as the highest priority when choosing a certain product. Moreover, the Vietnamese market seems to be more prices sensitive rather than the other two left elements. This is understandable during this “fussy” time of economy as people tend to be more saving than ever before. However, one of our surprising
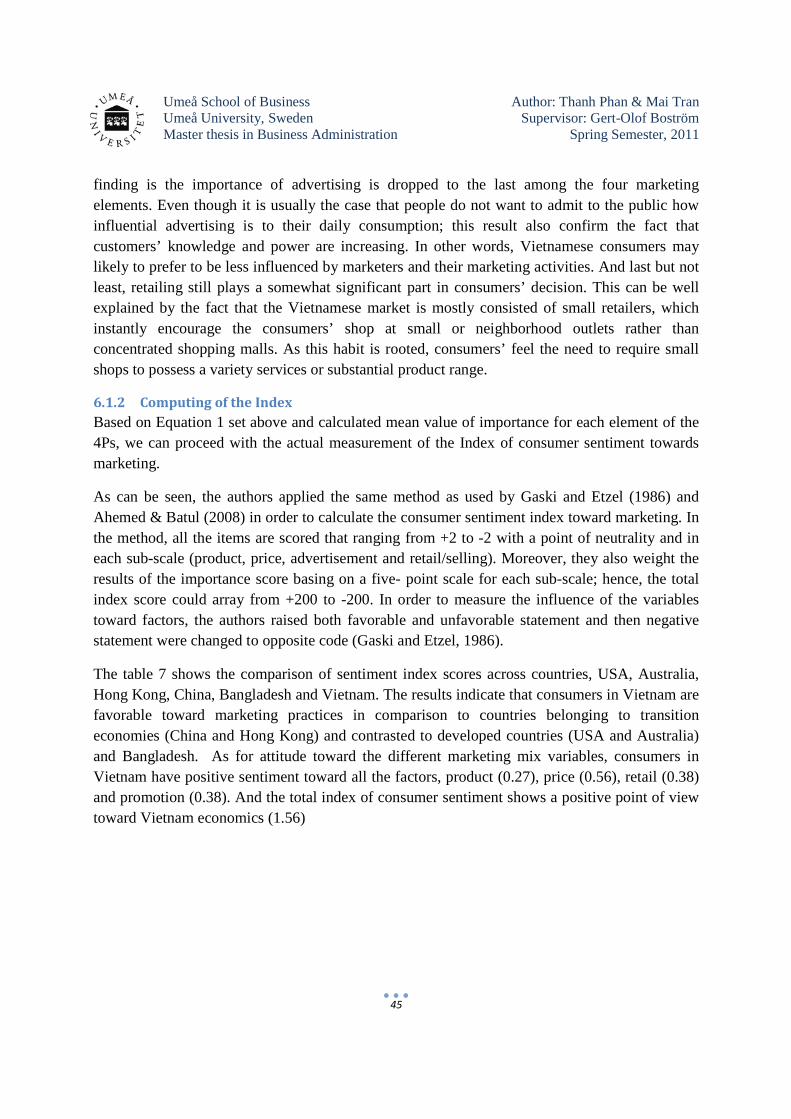
Umeå School of Business Author: Thanh Phan & Mai Tran Umeå University, Sweden Supervisor: Gert-Olof Boström Master thesis in Business Administration Spring Semester, 2011
45
finding is the importance of advertising is dropped to the last among the four marketing elements. Even though it is usually the case that people do not want to admit to the public how influential advertising is to their daily consumption; this result also confirm the fact that customers’ knowledge and power are increasing. In other words, Vietnamese consumers may likely to prefer to be less influenced by marketers and their marketing activities. And last but not least, retailing still plays a somewhat significant part in consumers’ decision. This can be well explained by the fact that the Vietnamese market is mostly consisted of small retailers, which instantly encourage the consumers’ shop at small or neighborhood outlets rather than concentrated shopping malls. As this habit is rooted, consumers’ feel the need to require small shops to possess a variety services or substantial product range.
6.1.2 Computing of the Index
Based on Equation 1 set above and calculated mean value of importance for each element of the 4Ps, we can proceed with the actual measurement of the Index of consumer sentiment towards marketing.
As can be seen, the authors applied the same method as used by Gaski and Etzel (1986) and Ahemed & Batul (2008) in order to calculate the consumer sentiment index toward marketing. In the method, all the items are scored that ranging from +2 to -2 with a point of neutrality and in each sub-scale (product, price, advertisement and retail/selling). Moreover, they also weight the results of the importance score basing on a five- point scale for each sub-scale; hence, the total index score could array from +200 to -200. In order to measure the influence of the variables toward factors, the authors raised both favorable and unfavorable statement and then negative statement were changed to opposite code (Gaski and Etzel, 1986).
The table 7 shows the comparison of sentiment index scores across countries, USA, Australia, Hong Kong, China, Bangladesh and Vietnam. The results indicate that consumers in Vietnam are favorable toward marketing practices in comparison to countries belonging to transition economies (China and Hong Kong) and contrasted to developed countries (USA and Australia) and Bangladesh. As for attitude toward the different marketing mix variables, consumers in Vietnam have positive sentiment toward all the factors, product (0.27), price (0.56), retail (0.38) and promotion (0.38). And the total index of consumer sentiment shows a positive point of view toward Vietnam economics (1.56)
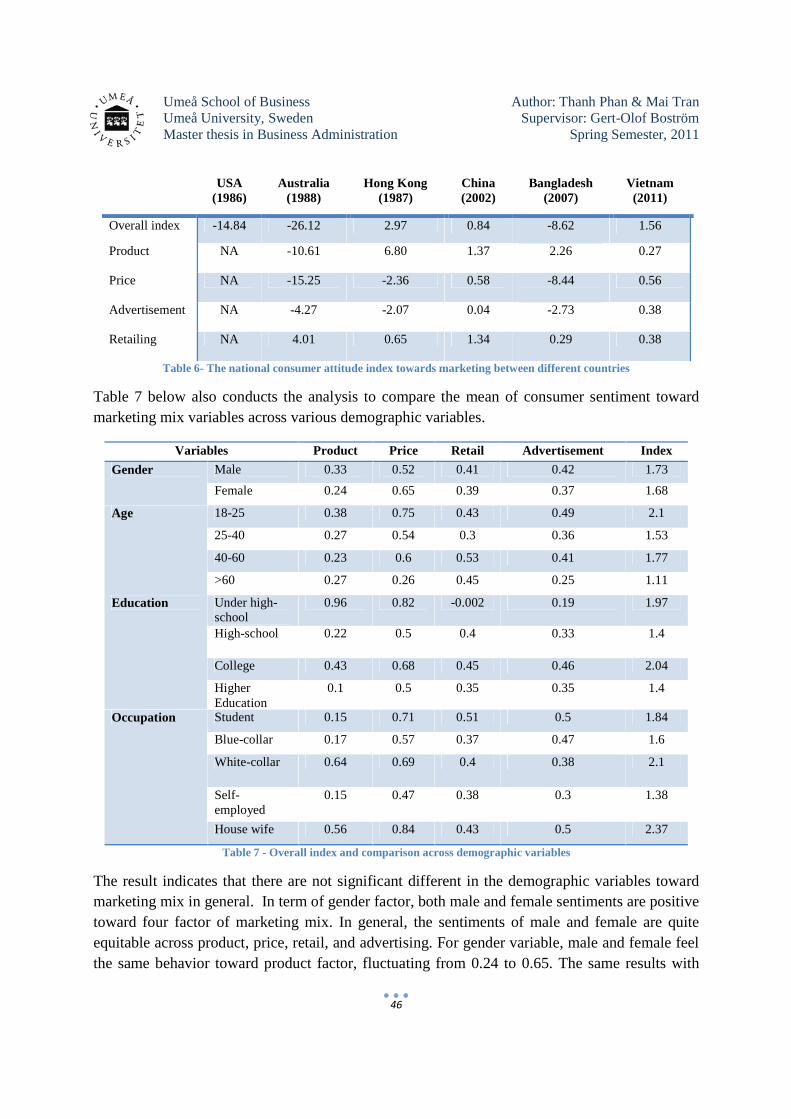
Umeå School of Business Author: Thanh Phan & Mai Tran Umeå University, Sweden Supervisor: Gert-Olof Boström Master thesis in Business Administration Spring Semester, 2011
46
USA (1986)
Australia (1988)
Hong Kong (1987)
China (2002)
Bangladesh (2007)
Vietnam (2011)
Overall index -14.84 -26.12 2.97 0.84 -8.62
1.56
Product NA -10.61 6.80 1.37 2.26
0.27
Price NA -15.25 -2.36 0.58 -8.44
0.56
Advertisement NA -4.27 -2.07 0.04 -2.73
0.38
Retailing NA 4.01 0.65 1.34 0.29 0.38
Table 6- The national consumer attitude index towards marketing between different countries
Table 7 below also conducts the analysis to compare the mean of consumer sentiment toward marketing mix variables across various demographic variables.
Variables Product Price Retail Advertisement Index
Gender Male 0.33 0.52 0.41 0.42 1.73
Female 0.24 0.65 0.39 0.37 1.68
Age 18-25 0.38 0.75 0.43 0.49 2.1
25-40 0.27 0.54 0.3 0.36 1.53
40-60 0.23 0.6 0.53 0.41 1.77
>60 0.27 0.26 0.45 0.25 1.11
Education Under high-school
0.96 0.82 -0.002 0.19 1.97
High-school 0.22 0.5 0.4 0.33 1.4
College 0.43 0.68 0.45 0.46 2.04
Higher Education
0.1 0.5 0.35 0.35 1.4
Occupation Student 0.15 0.71 0.51 0.5 1.84
Blue-collar 0.17 0.57 0.37 0.47 1.6
White-collar 0.64 0.69 0.4 0.38 2.1
Self- employed
0.15 0.47 0.38 0.3 1.38
House wife 0.56 0.84 0.43 0.5 2.37
Table 7 - Overall index and comparison across demographic variables
The result indicates that there are not significant different in the demographic variables toward marketing mix in general. In term of gender factor, both male and female sentiments are positive toward four factor of marketing mix. In general, the sentiments of male and female are quite equitable across product, price, retail, and advertising. For gender variable, male and female feel the same behavior toward product factor, fluctuating from 0.24 to 0.65. The same results with
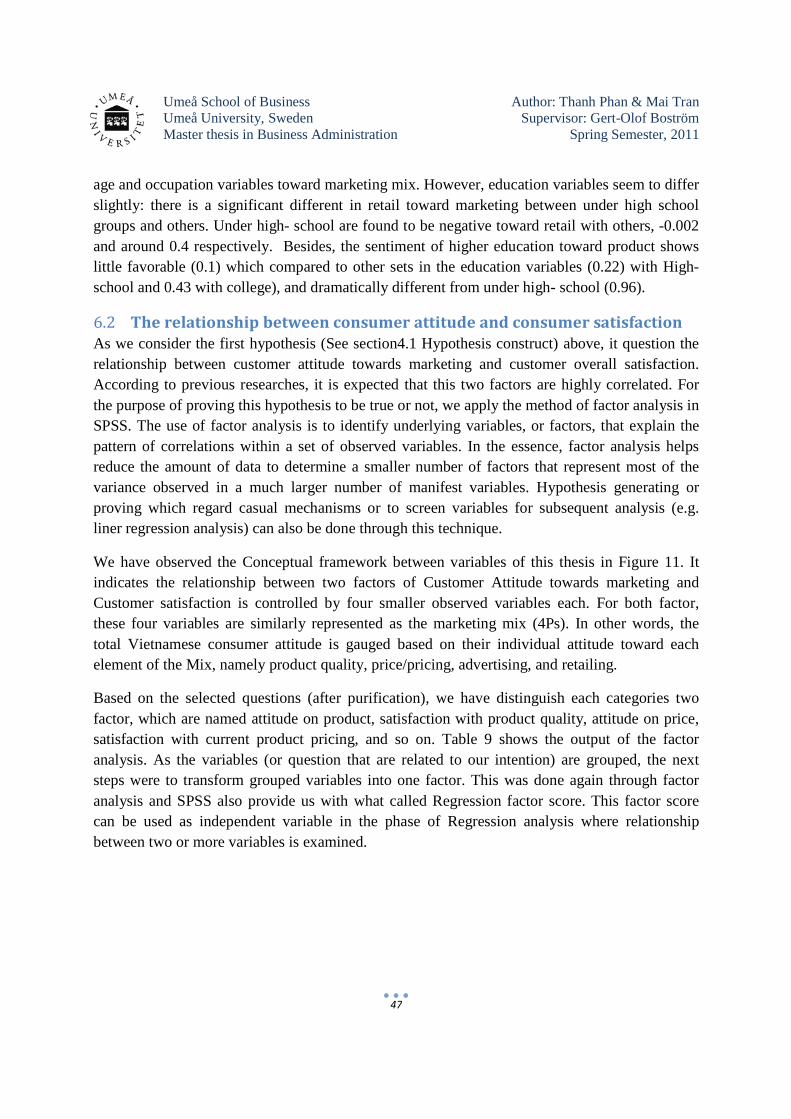
Umeå School of Business Author: Thanh Phan & Mai Tran Umeå University, Sweden Supervisor: Gert-Olof Boström Master thesis in Business Administration Spring Semester, 2011
47
age and occupation variables toward marketing mix. However, education variables seem to differ slightly: there is a significant different in retail toward marketing between under high school groups and others. Under high- school are found to be negative toward retail with others, -0.002 and around 0.4 respectively. Besides, the sentiment of higher education toward product shows little favorable (0.1) which compared to other sets in the education variables (0.22) with High-school and 0.43 with college), and dramatically different from under high- school (0.96).
6.2 The relationship between consumer attitude and consumer satisfaction
As we consider the first hypothesis (See section4.1 Hypothesis construct) above, it question the relationship between customer attitude towards marketing and customer overall satisfaction. According to previous researches, it is expected that this two factors are highly correlated. For the purpose of proving this hypothesis to be true or not, we apply the method of factor analysis in SPSS. The use of factor analysis is to identify underlying variables, or factors, that explain the pattern of correlations within a set of observed variables. In the essence, factor analysis helps reduce the amount of data to determine a smaller number of factors that represent most of the variance observed in a much larger number of manifest variables. Hypothesis generating or proving which regard casual mechanisms or to screen variables for subsequent analysis (e.g. liner regression analysis) can also be done through this technique.
We have observed the Conceptual framework between variables of this thesis in Figure 11. It indicates the relationship between two factors of Customer Attitude towards marketing and Customer satisfaction is controlled by four smaller observed variables each. For both factor, these four variables are similarly represented as the marketing mix (4Ps). In other words, the total Vietnamese consumer attitude is gauged based on their individual attitude toward each element of the Mix, namely product quality, price/pricing, advertising, and retailing.
Based on the selected questions (after purification), we have distinguish each categories two factor, which are named attitude on product, satisfaction with product quality, attitude on price, satisfaction with current product pricing, and so on. Table 9 shows the output of the factor analysis. As the variables (or question that are related to our intention) are grouped, the next steps were to transform grouped variables into one factor. This was done again through factor analysis and SPSS also provide us with what called Regression factor score. This factor score can be used as independent variable in the phase of Regression analysis where relationship between two or more variables is examined.
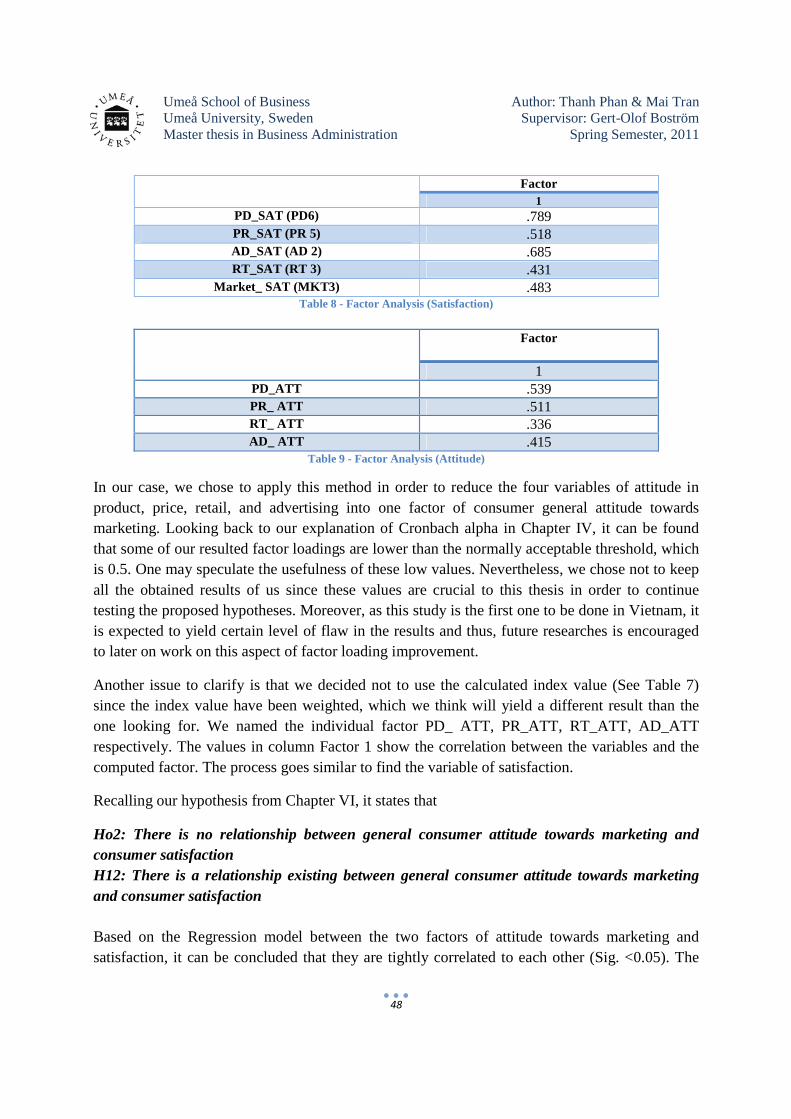
Umeå School of Business Author: Thanh Phan & Mai Tran Umeå University, Sweden Supervisor: Gert-Olof Boström Master thesis in Business Administration Spring Semester, 2011
48
Factor 1
PD_SAT (PD6) .789 PR_SAT (PR 5) .518 AD_SAT (AD 2) .685 RT_SAT (RT 3) .431
Market_ SAT (MKT3) .483 Table 8 - Factor Analysis (Satisfaction)
Factor
1 PD_ATT .539 PR_ ATT .511 RT_ ATT .336 AD_ ATT .415
Table 9 - Factor Analysis (Attitude)
In our case, we chose to apply this method in order to reduce the four variables of attitude in product, price, retail, and advertising into one factor of consumer general attitude towards marketing. Looking back to our explanation of Cronbach alpha in Chapter IV, it can be found that some of our resulted factor loadings are lower than the normally acceptable threshold, which is 0.5. One may speculate the usefulness of these low values. Nevertheless, we chose not to keep all the obtained results of us since these values are crucial to this thesis in order to continue testing the proposed hypotheses. Moreover, as this study is the first one to be done in Vietnam, it is expected to yield certain level of flaw in the results and thus, future researches is encouraged to later on work on this aspect of factor loading improvement.
Another issue to clarify is that we decided not to use the calculated index value (See Table 7) since the index value have been weighted, which we think will yield a different result than the one looking for. We named the individual factor PD_ ATT, PR_ATT, RT_ATT, AD_ATT respectively. The values in column Factor 1 show the correlation between the variables and the computed factor. The process goes similar to find the variable of satisfaction.
Recalling our hypothesis from Chapter VI, it states that
Ho2: There is no relationship between general consumer attitude towards marketing and consumer satisfaction H12: There is a relationship existing between general consumer attitude towards marketing and consumer satisfaction Based on the Regression model between the two factors of attitude towards marketing and satisfaction, it can be concluded that they are tightly correlated to each other (Sig. <0.05). The
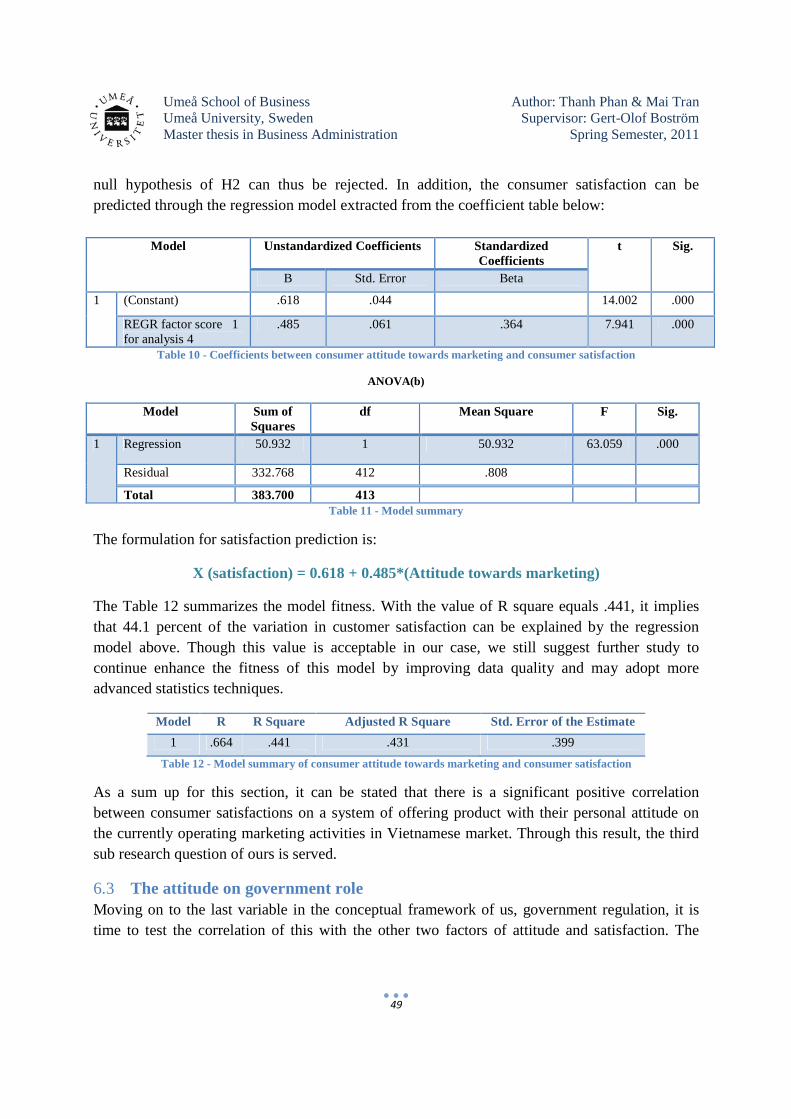
Umeå School of Business Author: Thanh Phan & Mai Tran Umeå University, Sweden Supervisor: Gert-Olof Boström Master thesis in Business Administration Spring Semester, 2011
49
null hypothesis of H2 can thus be rejected. In addition, the consumer satisfaction can be predicted through the regression model extracted from the coefficient table below:
Model Unstandardized Coefficients Standardized Coefficients
t Sig.
B Std. Error Beta
1 (Constant) .618 .044 14.002 .000
REGR factor score 1 for analysis 4
.485 .061 .364 7.941 .000
Table 10 - Coefficients between consumer attitude towards marketing and consumer satisfaction
ANOVA(b)
Model Sum of Squares
df Mean Square F Sig.
1 Regression 50.932 1 50.932 63.059 .000
Residual 332.768 412 .808
Total 383.700 413 Table 11 - Model summary
The formulation for satisfaction prediction is:
X (satisfaction) = 0.618 + 0.485*(Attitude towards marketing)
The Table 12 summarizes the model fitness. With the value of R square equals .441, it implies that 44.1 percent of the variation in customer satisfaction can be explained by the regression model above. Though this value is acceptable in our case, we still suggest further study to continue enhance the fitness of this model by improving data quality and may adopt more advanced statistics techniques.
Model R R Square Adjusted R Square Std. Error of the Estimate
1 .664 .441 .431 .399
Table 12 - Model summary of consumer attitude towards marketing and consumer satisfaction
As a sum up for this section, it can be stated that there is a significant positive correlation between consumer satisfactions on a system of offering product with their personal attitude on the currently operating marketing activities in Vietnamese market. Through this result, the third sub research question of ours is served.
6.3 The attitude on government role Moving on to the last variable in the conceptual framework of us, government regulation, it is time to test the correlation of this with the other two factors of attitude and satisfaction. The
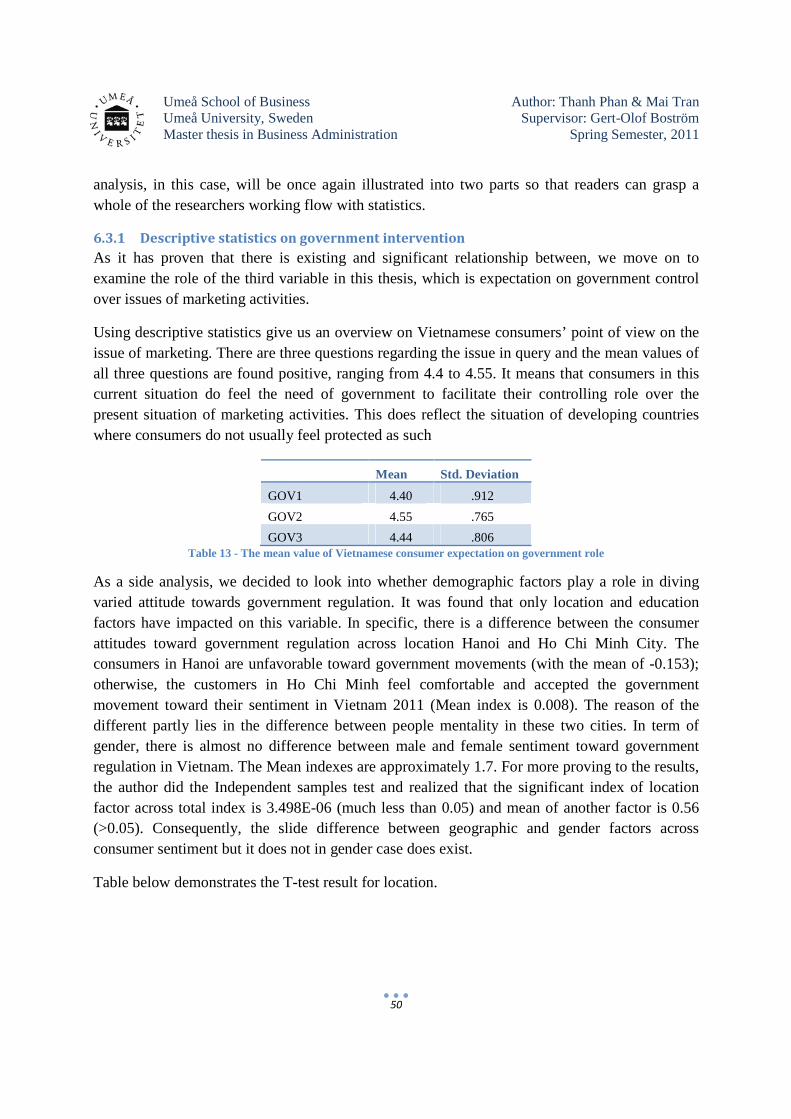
Umeå School of Business Author: Thanh Phan & Mai Tran Umeå University, Sweden Supervisor: Gert-Olof Boström Master thesis in Business Administration Spring Semester, 2011
50
analysis, in this case, will be once again illustrated into two parts so that readers can grasp a whole of the researchers working flow with statistics.
6.3.1 Descriptive statistics on government intervention
As it has proven that there is existing and significant relationship between, we move on to examine the role of the third variable in this thesis, which is expectation on government control over issues of marketing activities.
Using descriptive statistics give us an overview on Vietnamese consumers’ point of view on the issue of marketing. There are three questions regarding the issue in query and the mean values of all three questions are found positive, ranging from 4.4 to 4.55. It means that consumers in this current situation do feel the need of government to facilitate their controlling role over the present situation of marketing activities. This does reflect the situation of developing countries where consumers do not usually feel protected as such
Mean Std. Deviation
GOV1 4.40 .912
GOV2 4.55 .765
GOV3 4.44 .806 Table 13 - The mean value of Vietnamese consumer expectation on government role
As a side analysis, we decided to look into whether demographic factors play a role in diving varied attitude towards government regulation. It was found that only location and education factors have impacted on this variable. In specific, there is a difference between the consumer attitudes toward government regulation across location Hanoi and Ho Chi Minh City. The consumers in Hanoi are unfavorable toward government movements (with the mean of -0.153); otherwise, the customers in Ho Chi Minh feel comfortable and accepted the government movement toward their sentiment in Vietnam 2011 (Mean index is 0.008). The reason of the different partly lies in the difference between people mentality in these two cities. In term of gender, there is almost no difference between male and female sentiment toward government regulation in Vietnam. The Mean indexes are approximately 1.7. For more proving to the results, the author did the Independent samples test and realized that the significant index of location factor across total index is 3.498E-06 (much less than 0.05) and mean of another factor is 0.56 (>0.05). Consequently, the slide difference between geographic and gender factors across consumer sentiment but it does not in gender case does exist.
Table below demonstrates the T-test result for location.
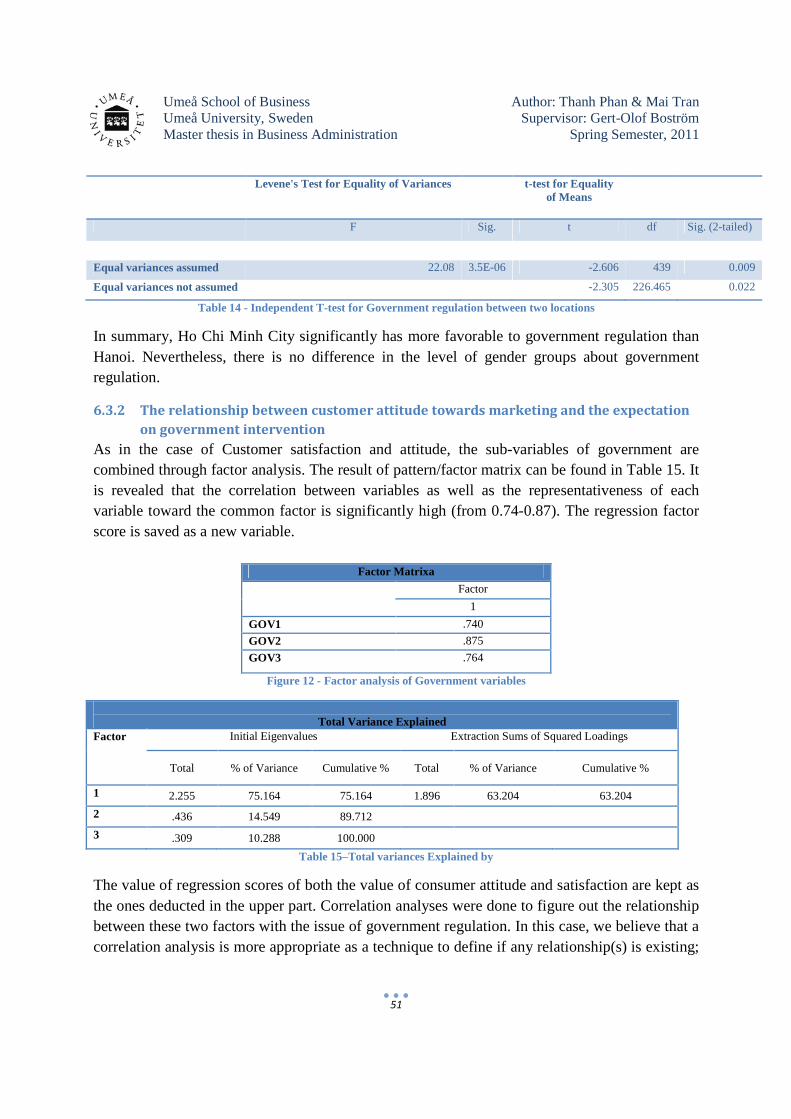
Umeå School of Business Author: Thanh Phan & Mai Tran Umeå University, Sweden Supervisor: Gert-Olof Boström Master thesis in Business Administration Spring Semester, 2011
51
Levene's Test for Equality of Variances t-test for Equality of Means
F Sig. t df Sig. (2-tailed)
Equal variances assumed 22.08 3.5E-06 -2.606 439 0.009
Equal variances not assumed -2.305 226.465 0.022
Table 14 - Independent T-test for Government regulation between two locations
In summary, Ho Chi Minh City significantly has more favorable to government regulation than Hanoi. Nevertheless, there is no difference in the level of gender groups about government regulation.
6.3.2 The relationship between customer attitude towards marketing and the expectation
on government intervention
As in the case of Customer satisfaction and attitude, the sub-variables of government are combined through factor analysis. The result of pattern/factor matrix can be found in Table 15. It is revealed that the correlation between variables as well as the representativeness of each variable toward the common factor is significantly high (from 0.74-0.87). The regression factor score is saved as a new variable.
Factor Matrixa
Factor
1
GOV1 .740
GOV2 .875
GOV3 .764
Figure 12 - Factor analysis of Government variables
Total Variance Explained
Factor Initial Eigenvalues Extraction Sums of Squared Loadings
Total % of Variance Cumulative % Total % of Variance Cumulative %
1 2.255 75.164 75.164 1.896 63.204 63.204
2 .436 14.549 89.712 3 .309 10.288 100.000
Table 15–Total variances Explained by
The value of regression scores of both the value of consumer attitude and satisfaction are kept as the ones deducted in the upper part. Correlation analyses were done to figure out the relationship between these two factors with the issue of government regulation. In this case, we believe that a correlation analysis is more appropriate as a technique to define if any relationship(s) is existing;
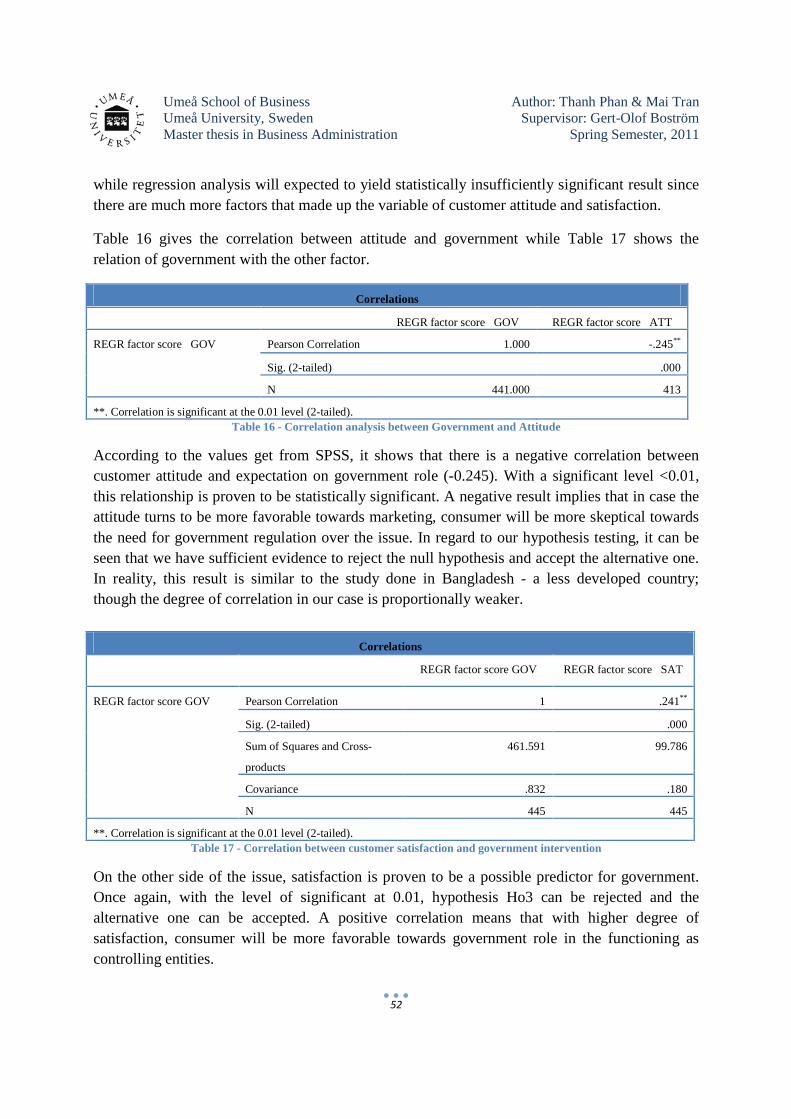
Umeå School of Business Author: Thanh Phan & Mai Tran Umeå University, Sweden Supervisor: Gert-Olof Boström Master thesis in Business Administration Spring Semester, 2011
52
while regression analysis will expected to yield statistically insufficiently significant result since there are much more factors that made up the variable of customer attitude and satisfaction.
Table 16 gives the correlation between attitude and government while Table 17 shows the relation of government with the other factor.
Correlations
REGR factor score GOV REGR factor score ATT
REGR factor score GOV Pearson Correlation 1.000 -.245**
Sig. (2-tailed) .000
N 441.000 413
**. Correlation is significant at the 0.01 level (2-tailed).
Table 16 - Correlation analysis between Government and Attitude
According to the values get from SPSS, it shows that there is a negative correlation between customer attitude and expectation on government role (-0.245). With a significant level <0.01, this relationship is proven to be statistically significant. A negative result implies that in case the attitude turns to be more favorable towards marketing, consumer will be more skeptical towards the need for government regulation over the issue. In regard to our hypothesis testing, it can be seen that we have sufficient evidence to reject the null hypothesis and accept the alternative one. In reality, this result is similar to the study done in Bangladesh - a less developed country; though the degree of correlation in our case is proportionally weaker.
Correlations
REGR factor score GOV REGR factor score SAT
REGR factor score GOV Pearson Correlation 1 .241**
Sig. (2-tailed) .000
Sum of Squares and Cross-
products
461.591 99.786
Covariance .832 .180
N 445 445
**. Correlation is significant at the 0.01 level (2-tailed).
Table 17 - Correlation between customer satisfaction and government intervention
On the other side of the issue, satisfaction is proven to be a possible predictor for government. Once again, with the level of significant at 0.01, hypothesis Ho3 can be rejected and the alternative one can be accepted. A positive correlation means that with higher degree of satisfaction, consumer will be more favorable towards government role in the functioning as controlling entities.
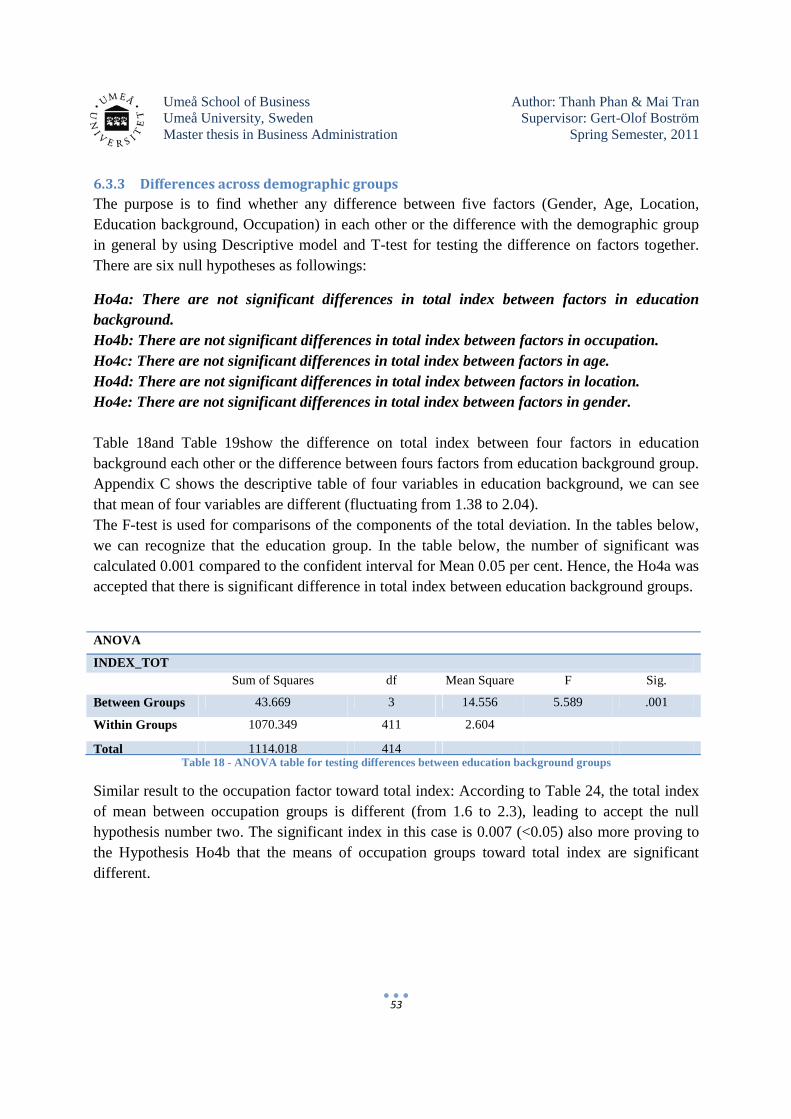
Umeå School of Business Author: Thanh Phan & Mai Tran Umeå University, Sweden Supervisor: Gert-Olof Boström Master thesis in Business Administration Spring Semester, 2011
53
6.3.3 Differences across demographic groups
The purpose is to find whether any difference between five factors (Gender, Age, Location, Education background, Occupation) in each other or the difference with the demographic group in general by using Descriptive model and T-test for testing the difference on factors together. There are six null hypotheses as followings:
Ho4a: There are not significant differences in total index between factors in education background. Ho4b: There are not significant differences in total index between factors in occupation. Ho4c: There are not significant differences in total index between factors in age. Ho4d: There are not significant differences in total index between factors in location. Ho4e: There are not significant differences in total index between factors in gender. Table 18and Table 19show the difference on total index between four factors in education background each other or the difference between fours factors from education background group. Appendix C shows the descriptive table of four variables in education background, we can see that mean of four variables are different (fluctuating from 1.38 to 2.04). The F-test is used for comparisons of the components of the total deviation. In the tables below, we can recognize that the education group. In the table below, the number of significant was calculated 0.001 compared to the confident interval for Mean 0.05 per cent. Hence, the Ho4a was accepted that there is significant difference in total index between education background groups.
ANOVA
INDEX_TOT Sum of Squares df Mean Square F Sig.
Between Groups 43.669 3 14.556 5.589 .001
Within Groups 1070.349 411 2.604
Total 1114.018 414 Table 18 - ANOVA table for testing differences between education background groups
Similar result to the occupation factor toward total index: According to Table 24, the total index of mean between occupation groups is different (from 1.6 to 2.3), leading to accept the null hypothesis number two. The significant index in this case is 0.007 (<0.05) also more proving to the Hypothesis Ho4b that the means of occupation groups toward total index are significant different.
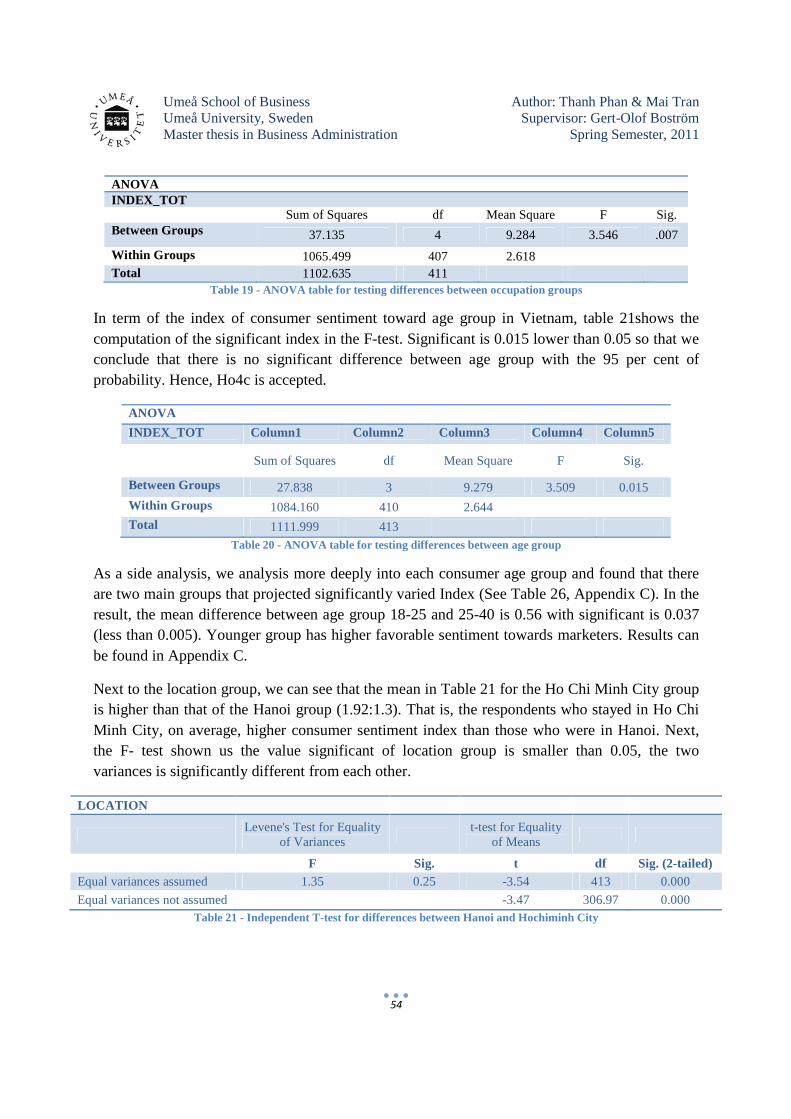
Umeå School of Business Author: Thanh Phan & Mai Tran Umeå University, Sweden Supervisor: Gert-Olof Boström Master thesis in Business Administration Spring Semester, 2011
54
ANOVA INDEX_TOT
Sum of Squares df Mean Square F Sig. Between Groups 37.135 4 9.284 3.546 .007
Within Groups 1065.499 407 2.618 Total 1102.635 411
Table 19 - ANOVA table for testing differences between occupation groups
In term of the index of consumer sentiment toward age group in Vietnam, table 21shows the computation of the significant index in the F-test. Significant is 0.015 lower than 0.05 so that we conclude that there is no significant difference between age group with the 95 per cent of probability. Hence, Ho4c is accepted.
ANOVA
INDEX_TOT Column1 Column2 Column3 Column4 Column5
Sum of Squares df Mean Square F Sig.
Between Groups 27.838 3 9.279 3.509 0.015
Within Groups 1084.160 410 2.644 Total 1111.999 413
Table 20 - ANOVA table for testing differences between age group
As a side analysis, we analysis more deeply into each consumer age group and found that there are two main groups that projected significantly varied Index (See Table 26, Appendix C). In the result, the mean difference between age group 18-25 and 25-40 is 0.56 with significant is 0.037 (less than 0.005). Younger group has higher favorable sentiment towards marketers. Results can be found in Appendix C.
Next to the location group, we can see that the mean in Table 21 for the Ho Chi Minh City group is higher than that of the Hanoi group (1.92:1.3). That is, the respondents who stayed in Ho Chi Minh City, on average, higher consumer sentiment index than those who were in Hanoi. Next, the F- test shown us the value significant of location group is smaller than 0.05, the two variances is significantly different from each other.
LOCATION
Levene's Test for Equality
of Variances
t-test for Equality of Means
F Sig. t df Sig. (2-tailed) Equal variances assumed 1.35 0.25 -3.54 413 0.000
Equal variances not assumed -3.47 306.97 0.000 Table 21 - Independent T-test for differences between Hanoi and Hochiminh City
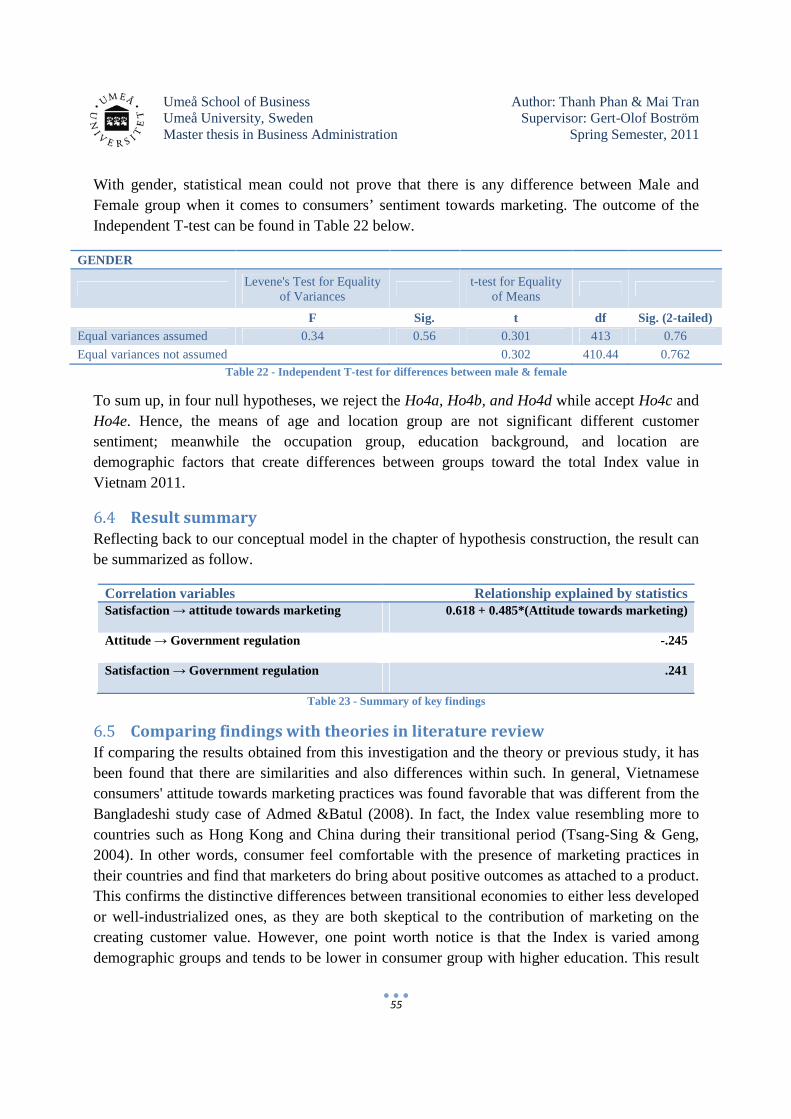
Umeå School of Business Author: Thanh Phan & Mai Tran Umeå University, Sweden Supervisor: Gert-Olof Boström Master thesis in Business Administration Spring Semester, 2011
55
With gender, statistical mean could not prove that there is any difference between Male and Female group when it comes to consumers’ sentiment towards marketing. The outcome of the Independent T-test can be found in Table 22 below.
GENDER
Levene's Test for Equality
of Variances
t-test for Equality of Means
F Sig. t df Sig. (2-tailed) Equal variances assumed 0.34 0.56 0.301 413 0.76
Equal variances not assumed 0.302 410.44 0.762 Table 22 - Independent T-test for differences between male & female
To sum up, in four null hypotheses, we reject the Ho4a, Ho4b, and Ho4d while accept Ho4c and Ho4e. Hence, the means of age and location group are not significant different customer sentiment; meanwhile the occupation group, education background, and location are demographic factors that create differences between groups toward the total Index value in Vietnam 2011.
6.4 Result summary
Reflecting back to our conceptual model in the chapter of hypothesis construction, the result can be summarized as follow.
Correlation variables Relationship explained by statistics Satisfaction → attitude towards marketing 0.618 + 0.485*(Attitude towards marketing)
Attitude → Government regulation -.245
Satisfaction → Government regulation .241
Table 23 - Summary of key findings
6.5 Comparing findings with theories in literature review
If comparing the results obtained from this investigation and the theory or previous study, it has been found that there are similarities and also differences within such. In general, Vietnamese consumers' attitude towards marketing practices was found favorable that was different from the Bangladeshi study case of Admed &Batul (2008). In fact, the Index value resembling more to countries such as Hong Kong and China during their transitional period (Tsang-Sing & Geng, 2004). In other words, consumer feel comfortable with the presence of marketing practices in their countries and find that marketers do bring about positive outcomes as attached to a product. This confirms the distinctive differences between transitional economies to either less developed or well-industrialized ones, as they are both skeptical to the contribution of marketing on the creating customer value. However, one point worth notice is that the Index is varied among demographic groups and tends to be lower in consumer group with higher education. This result
Umeå School of Business Author: Thanh Phan & Mai Tran Umeå University, Sweden Supervisor: Gert-Olof Boström Master thesis in Business Administration Spring Semester, 2011
56
can be indicates that marketing activities are negatively respondents to the education level, which implies that as the consumers grow more educated and aware about the marketing practices, they will be less dependent on marketing to make purchases. Since the condition on marketplace literacy will be improved over time, we believe that the Index is expected to decline in time. Besides, it also indicates to a similar results as other previous study which confirm the existing effects of some of the demographic factors, including education background, occupation, and age. Gender, on the other hand, does not seem to have created differences in Index value.
The second major finding of this research is regarding the correlation between attitude towards marketing and satisfaction. According to the model of ACSI model (See section 3.3), consumer perception on a value of certain product are deducted from the perceived quality and prior expectation. In real life, most expectations of customers on a product or service are derived from the “promises” explicitly or implicitly sent out my marketers through their promotional programs. Therefore, the attitude towards marketing lay on the difference between the impression that marketer(s) provoke on consumers and what they actually perceive (using after product purchasing and using). The model also states that the factor of “perceive value” should be tightly connected to “customer satisfaction”. For the case of Vietnam, we have validated this section of the model with statistical significance that this relationship does exist with positive. In other words, customer with favorable sentiment towards marketing will bring about positive satisfaction of customer towards any purchased product(s). The idea with sentiment is that consumers believe marketing acts are truthful with the underlying goal is to generate extra value attached to a merchandise. From this, it can be conceive that the model and findings of previous study hold true for a transitional economy as Vietnam.
The third outcomes which hold important to this thesis concerns the validation of correlations of both consumer attitude, consumer satisfaction to government regulation toward marketing mix in developed countries (Gaski & Etzel, 1986 and Tsang-Sing & Geng, 2004). These studies indicated that consumer in developed countries are favorable and satisfied with the current situation and less likely to want more government regulation. Similar to the Bangladesh study case (Admed &Batul, 2008), Vietnam market indicated the negative index resulting that customers become more sentiment toward marketing, the attitude of customer are more skeptical to need of the government intervention. As this negative correlation has been certified by previous researches, there should be a divergent of expectation on government role in controlling marketing activities for industrialized and developing countries.
If consumer sentiment and government result in a negative correlation, the relationship between government and satisfaction yield a positive correspondence. This can be explained that when customers are satisfied with the current product or any other elements of the Marketing activities, they do feel that government has been doing well in controlling on the issue. It can be that the current policies are functioning effectively in encouraging companies to make good use of these
Umeå School of Business Author: Thanh Phan & Mai Tran Umeå University, Sweden Supervisor: Gert-Olof Boström Master thesis in Business Administration Spring Semester, 2011
57
marketing programs and constantly adding value to the product(s) bought. In the case of Vietnam, the consumers seem to be quite satisfied with the offering product ranges and the services that attached to it. Supportively, their mean score for government role expectation is also positive, which mean that the national government are trusted by citizens to administrate the operation of companies and that they should apply strict rules while making the results of any investigation published for the nation. This, in fact, can be beneficial not only for businesses bu also for third party sector for instant activists, NGO, or the government itself since they know to what degree they can make use or extend the involvement of rules and policies to gain over a situation with marketing.
Through this research, we have also found some aside interesting facts. One of them is that there is a different in “government-belief” between the two cities. Whereas in Vietnam, the consumer in Ho Chi Minh City are significantly has more favorable to government intervention than Hanoi. In addition to that, female seems to have more belief in government role than male do.
Thanks to these finding, the retailers or market researchers can partly forecast the trend of consumer attitude toward marketing in Vietnam market. As the result shown, there prevails the correlations between these factors together in Vietnam 2011 and the effectiveness of demographic toward consumer attitude are also studies in this research.
Umeå School of Business Author: Thanh Phan & Mai Tran Umeå University, Sweden Supervisor: Gert-Olof Boström Master thesis in Business Administration Spring Semester, 2011
58
7. Conclusion
In this last chapter of the thesis, general conclusions of the investigation are demonstrated. A general conclusion follows with recommendations for managers, government, and future researchers.
7.1 General conclusion
The goal of this thesis is to create a deeper understanding on the Vietnamese market, through which different connections between varied factors are brought into light. The examined variables in this case are consumer attitude, consumer satisfaction, and government regulation. Although there have been abundant of researches done in the aspect of calculating Consumer sentiment towards marketing, few has been carried out in Asia and developing economies. Moreover, yet extremely limited studies combine with the testing of relationship between this Index and the other variables. This thesis therefore focuses on covering all of these missing aspects above and it was a challenge for the authors to work from distant with the testing respondent sample.
Through the findings, the authors reach to achieve better understanding on the role of marketing in the Vietnamese market and how it currently affects people perception about the operation of businesses in general market. As the result, the relationships between these three variables are proven to be existed with mainly towards the path of positive perception. This affirms the still existing possible positive impact of marketing activities on consumers though it is also expected that government role is crucial in the controlling role that will ensure business to actually work ethically with their marketing programs. Besides, demographic factors (especially education background and occupation) are also pointed out to have influence on the consumer sentiment towards marketing.
In a broader sense, it seems to fit the expectation with the suspected situation for transitional economy. The findings also complement and again affirm stronger the validity of the theories.
7.2 Theoretical contributions of the study
As stated from the above section, the study has yielded certain success in confirming the theories of correlative between customer attitude and customer satisfaction. Related back to the ACSI model, the left part from the element consumer satisfaction shows the connection of this factor with perceived value and customer expectation. Our study, though, has yield results that may alter the order of these elements. In other words, the results encourage us to propose a slight alternation in the model. Instead of the direct relationship between perceived value and customer satisfaction, there is a median, which acts as the connector of both pre-mentioned elements. This connector is named “Consumer attitude”. We found that this change would be higher in accuracy when talking about relationship between these factors of satisfaction and marketing mix.
Umeå School of Business Author: Thanh Phan & Mai Tran Umeå University, Sweden Supervisor: Gert-Olof Boström Master thesis in Business Administration Spring Semester, 2011
59
In addition to the adding of a median, we suggest that government intervention can act as another factor which has proven impact on both consumer attitude and consumer satisfaction. It is also proven that attitude and satisfaction have a different flow of correlation with this third factor of government. This is a very interesting point as it implies profoundly that the concept of “attitude” and “satisfaction” can have divergent meaning depending on which perspective we stand from; while generally people can interchangeably use the concepts. The third contribution our study has assigned with should relate to the theory of marketing mix. We have found that the Index of Customer Satisfaction is still a useful tool, to a certain extent, in identifying customers’ thought. However, using the 4Ps model to measure it can lead to waving issue(s). First of all, consumers’ now are increasingly well-educated; they understand and demand further values from the normal Product quality, price, promotional program, and distribution channel. In correlation to the Kano model (Jacobs & Randy, 1999), consumer should be looking for different “attractive attributes”.
7.3 Recommendations for managers and government
As mentioned above, the authors considered marketing as the exposed arm of business and advertising is the most exposed arm of marketing function. For this study, marketing are also emphasized as one of the most effective ways to access the consumer sentiment in general and in Vietnam specifically. Once we understood the concept of consumer sentiment toward marketing mix, we could easily find the relationship between consumer attitude toward marketing mix to consumer satisfaction and government regulation.
As the result of our study, customers are tending to sentiment and satisfaction with the marketing practices in Vietnam in 2011. It is not hard to understand the reason why the consumer attitudes are positive to the consumer satisfaction and government regulation. When customers are educated and aware about the marketing practices, they are more confident in purchasing things in market in Vietnam.
Firstly, thanks to that results that managers and operators in Vietnam can easily predict the attitude of their current and potential consumers so that they can either kept the same or raise more marketing strategies including promotion, advertisement, price, product quality and retail fields without the fear of bringing about negative feedbacks. Moreover, among the four element of the Mix, it is recommended for mangers to focus more on the issue with individual product quality in comparison to the other three elements. Besides the short-term orientation strategies, the manager should pay more attention to the further orientation in the long-run because Vietnamese and international managers are set their minds at rest in the stable attitude of consumer recently. It may say that Vietnamese customers in general are satisfied with the marketing practices recently and the government intervention as well as; however, in different area in Vietnam has different attitude of customers toward marketing practices with government regulation, consumer in Ho Chi Minh City has negative attitude to the regulation whereas, Hanoi
Umeå School of Business Author: Thanh Phan & Mai Tran Umeå University, Sweden Supervisor: Gert-Olof Boström Master thesis in Business Administration Spring Semester, 2011
60
is the opposite attitude. Therefore, in different place in Vietnam, the managers should take consideration and give the crucial decisions in order to suitable to the market characteristics and consumer attitude.
As can be known, Vietnam has just joined the WTO (World Trade Organization) in 2008. That leads to the fact that Vietnamese market has to face with a lot of economics barriers in all the field of economy. The international companies try to invest and do the business with the domestic firms in Vietnam. With this result, the investors will give the definitive decisions to the Vietnamese market because the consumer attitude in Vietnam are going on stable and have favorable to the government regulations. Understanding consumer sentiment toward local marketing practices should be helpful for the exporters have clear sights into our marketing practices.
Another issues the Vietnamese government should take consideration that our economic is on going to transition economy so that government should give some laws or regulations to make consumer more aware and educated regarding business marketing practices. There are a range of tools for the government that can be raised the attitude of consumers such as print media, television or advertisements. By using those tools, Vietnamese government can easily understand and acquire the complaints or idea of consumer so that the level of customer sentiment can increase dramatically.
7.4 Further studies
Though the investigation has obtained some crucial findings as intended, there are always rooms for improvement.
First of all, as the role of marketing seems to be still a part of consumers’ “shopping life”, we encourage other researchers to continue revise this macro-marketing Index (as a longitudinal study) to track down any drastic change in consumer perception (if there is) over time. By doing so, it is believable to give somewhat a base for prediction in any coming wave of change within the national consumers.
Secondly, we suggested for further studies to expand the geographic scope as it will be a more representative set of sample for the nation.
Finally, future researchers may want to revise the questionnaire design to obtain higher degree of fitness for Asian consumers in specific.
Umeå School of Business Author: Thanh Phan & Mai Tran Umeå University, Sweden Supervisor: Gert-Olof Boström Master thesis in Business Administration Spring Semester, 2011
61
8. Reference list
Books
Brassington, F., and Pettitt, S., (2003), Principles of Marketing, England: Essex, Prentice Hall, Inc. Brenkert, G. G. (2008). Marketing Ethics. Blackwell, Singapore. Bryman, A., & Bell, E. (2007). Business research methods. 2nd Edition. United States: Oxford University Press Inc. Creswell, W.J. (2007). Research design: Qualitative, quantitative, and mixed methods approaches. 3rd Edition., Thousand Oaks, CA: Sage Publication. Dale A, Arber S., Procter M. (1988), Doing secondary analysis, Unwin Hyman (London and Boston). Ghauri, P. and Gronhaug, K. (2010). Research methods in business studies. 4th Edition. Great Britain: Pearson Education Limited Jobber, D. (2001) Principles and Practice of Marketing, 3rd Edition, McGrawHill. Kotler, P. (2003). Marketing Management. 11 th Edition. Prentice Hall International Editions Kotler, P. (2005). Marketing Management. 11th Edition. Prentice Hall International Editions
Kotler, P. and Keller, KL (2009). Marketing management , 13th Edition. Upper Saddle River, NJ: Prentice-Hall Kotler P., Wong V., Saunders J., Armstrong G. (2005). Principles of Marketing. Financial Times Prentice Hall. Leedy, P.D. & Ormrod, J. E., (2010), Practical Research: Planning and Design, 9th Edition, Person Education Inc., Boston MA. Lighter D.E, 2011. Basics of Health Care Performance Improvement: A Lean Six Sigma Approach. Business & Economics
Umeå School of Business Author: Thanh Phan & Mai Tran Umeå University, Sweden Supervisor: Gert-Olof Boström Master thesis in Business Administration Spring Semester, 2011
62
Murphy, P.E., Laczniak, G.R., Bowie, N.E., Klein, T.A. (2005). Marketing Ethics. 1st Edition, Person Education Inc., Boston MA. Saunder, M., Lewis, P., & Thornhill, A. (2007). Research Methods for Business Students. 4th Edition. Harlow: Pearson Education Limited. Crotty, M. (1998). The Foundations of Social Research: Meaning and Perspective in the Research Process. London: SAGE Publications Ltd. Shiu, E., Hair, J., Bush Jr., R., Ortinau, D. (2009). Market Research – European Edition. McGraw-Hill Higher Education. Solomon, M. R. (2004), Consumer Behavior: Buying, Having and Being, 6th Edition. New Jersey: Pearson-Prentice Hall. Solomon, M.R., Zaichowsky, J.L., Polegaro, R., (2002). Consumer Behavior. Prentice-Hall, Toronto Solomon M.R, (2010). Buying, Having and Being. 9th Edition. New Jersey: Pearson-Prentice Hall.
Articles
Ahmed, S.F. and Batul, T. (April 2008). Consumer sentiment towards marketing in Bangladesh: The relationship between attitudes to marketing, satisfaction and regulation. Marketing Intelligence & Planning, Vol. 26 No 5, pp 481-495. Blackwell, R.D., P.W. Miniard, J.F. Engel (2001). Consumer behavior, Fort Worth: Harcourt College Publishers. Bahari, S.F. (2010), Qualitative versus quantitative research strategies: contrasting epistemological and ontological assumption, Jurnal Teknologi, 52 Mei 2010: 17–28, Universiti Teknologi Malaysia Barksdale, H.C. and Darden, W.R. (1972). Consumer attitudes toward marketing consumerism. Journal of Marketing, Vol. 36, pp. 28-35.
Umeå School of Business Author: Thanh Phan & Mai Tran Umeå University, Sweden Supervisor: Gert-Olof Boström Master thesis in Business Administration Spring Semester, 2011
63
Barksdale, H.C., Perreault, W.D. Jr, Arndt, J., Barnhill, J.A., French, W.A., Halliday, M. and Zif, J.(1982). A cross-national survey of consumer attitudes towards marketing practices,consumerism and government regulations. Columbia Journal of World Business, Vol. 17, pp. 71-85. Borden, N. H. (1964). The concept of marketing mix. Journal of Advertising Research. 4: 2-7. Chan, E., Yau, O.H.M. and Chan, R. (1990). Consumer sentiment in Australia: a replication and cross-national comparison. European Journal of Marketing, Vol. 24 No. 10, pp. 44-58. Constantinides,E. (2006). The Marketing Mix Revisited: Towards the 21st Century Marketing . Journal of Marketing Management, 22: 3, 407 — 438 Chan, T. and Cui, G. (2008). Consumers' Attitudes toward Marketing: A Cross-cultural Study of China and Canada. Journal of International Consumer Marketing. Volume 20, Issue 3-4. Danaher J. P., Vanessa H., (1996) .A comparison of question scales used for measuring customer satisfaction. International Journal of Service Industry Management, Vol. 7 Iss: 4, pp.4 - 26 Darley, W.K. and Johnson, D.M. (1993), Cross-national comparison of consumer attitudes toward consumerism in four developing-countries, The Journal of Consumer Affairs, Vol. 27 No. 1, pp. 37-54. Dittman, H. (2005). Compulsive buying – a growing concern? An examination of gender, age, and endorsement of materialistic values as predictors. Journal of Social and Clinical Psychology, Vol 24(8), 1081-1087. Douglas, S. P., and C. S. Craig. (2006). Expanding the perspective: Making U.S. marketing relevant for the new world order. In Does marketing need reform?: Fresh perspectives on the future, edited by J. N. Sheth and R. S. Sisodia, 217-21. Armonk, NY: M. E. Sharpe. Fornell, C., Johnson, M. D., Anderson, E. W., Jaesung, C., & Bryant, B. (1996). The American Customer Satisfaction Index: Nature, Purpose, and Findings. Journal of Marketing, 60(4), 7-18. Gaski, J.F. and Etzel, M.J. (1986). The index of consumer sentiment toward marketing. Journal of Marketing. Vol. 50 No. 3, pp. 71-82.
Umeå School of Business Author: Thanh Phan & Mai Tran Umeå University, Sweden Supervisor: Gert-Olof Boström Master thesis in Business Administration Spring Semester, 2011
64
Gaski, J.F. and Etzel, M.J (2005). National aggregate consumer sentiment toward marketing: a thirty-year retrospective and analysis. Journal of Consumer Research, Vol. 31 No. 4, pp. 859-68. Gaski, J, F (2008). The index of consumer sentiment toward Marketing: Validation, Updated Results, and Demographic Analysis. Springer Science + Business Media, LCC 2008 Grönroos C., (1994). From Marketing Mix to Relationship Marketing: Towar ds a Paradigm Shift in Marketing. Management Decision, Vol. 32 Iss: 2, pp.4 - 20 Grönroos, C. (2006). On defining marketing: finding a new roadmap for marketing . Marketing Theory, 6, 4, pp. 395-417 Helms, J. E., Henze K. T., Sass, T. L. and Mifsud, V. A. (2006). Treating Cronbach’s Alpha Reliability Coefficients as Data in Counseling Research. The counseling psychologist, 34 (5), 630-660. Hustad, T. P., & Pessemier, E. A. (1973). Will the real consumer activist please stand up: An examination of consumers’ opinions about marketing practices. Journal of Marketing Research, 10, 319–324. Jacobs, Randy, (Winter 1999). Evaluating Satisfaction with Media Products and Services: An Attribute Based Approach. Kaynak, E. (1993). Some Thoughts On Consumerism In Developed And Less Developed Countries. International Marketing Review, 2(2), 15-30. Kimberlin, C., & Winterstein, A. (2008). Validity and reliability of measurement instruments used in research. American Journal Of Health-System Pharmacy, 65(23), 2276-2284. Le, D.D. (July, 1999). What’s the Rush? Far Eastern Economic Review, 42 Lincoln, Y., & Guba, E. (1990). Judging the quality of case study reports. International Journal Of Qualitative Studies In Education, 3(1), 53-59. Liu, Y., Wu, A. D., and Zumbo, B. D. (2010). The Impact of Outliers on Cronbach’s Coefficient Alpha Estimate of Reliability: Ordinal/Rating Scale Item Responses. Educational and Psychological Measurement, 70 (1), 5–21.
Umeå School of Business Author: Thanh Phan & Mai Tran Umeå University, Sweden Supervisor: Gert-Olof Boström Master thesis in Business Administration Spring Semester, 2011
65
Liua, Y. and Salvend, G. (2009). Effects of measurement errors on psychometric measurements in ergonomics studies: Implications for correlations, ANOVA, linear regression, factor analysis, and linear discriminant analysis. Ergonomics, 52 (5), 499–511. Lundstrom, W. J., & Lamont, L. M. (1976). The development of a scale to measure consumer discontent.Journal of Marketing Research, 13, 373–381. Lysonski, S., Durvasula, S. and Watson, J. (2003). Should marketing managers be concerned about attitudes towards marketing and consumerism in New Zealand? A longitudinal view. European Journal of Marketing, Vol. 37 Nos 3/4, pp. 385-406.' Lyster, M. (1997). Southeast Asia. World Trade, 10(3), 50-54. Maheswaran, D. and Shavitt, S. (2001). Issues and new directions in global consumer psychology. Journal of consumer Psychology, 9(2), 59-66. McMillan, J. and Woodruff C. (2002). The central role of entrepreneurs in transition economies. The Journal of Economic Perspectives, 16(3), 153-171. O'Brien, K. (2007). Factor Analysis: An Overview in the Field of Measurement. Physiotherapy Canada, 59 (2), 142-155. Peterson, M. and Ekici A. (2007). Consumer Attitude toward Marketing and Subjective Quality of Life in the Context of a Developing Country . Journal of Macro-marketing 27 (4 ): 350-359 Prahalad, C. K. (2005). The fortune at the bottom of the pyramid: Eradicating poverty through profits. Upper Saddle River, NJ:Wharton School Publishing Quan Xuan Dinh, (2000). The political economy of Vietnam’s transformation process. Contemporary Southeast Asia, 22, 2. Rosenbloom, B., & Dimitrova, B. (2011). The marketing mix paradigm and the Dixonian systems perspective of marketing. Journal of Historical Research in Marketing , Vol. 3 Iss: 1 pp. 53 - 66.
Umeå School of Business Author: Thanh Phan & Mai Tran Umeå University, Sweden Supervisor: Gert-Olof Boström Master thesis in Business Administration Spring Semester, 2011
66
Roberts, J, & Tanner, J (2002), Compulsive buying and sexual attitudes, intentions, and activity among adolescents: an extension of Roberts and Tanner (2000)', Psychological Reports 90, 3 Pt 2, pp. 1259-1260) Shelby, L. B. (2011). Beyond Cronbach’s Alpha: Considering Confirmatory Factor Analysis and Segmentation. Human Dimensions of Wildlife, 16 (2), 142–148 Sriram, V. and Sapienza, H.J. (1991).An empirical investigation of the role of marketing for small exporters. Journal of Small Business Management, Vol. 29(4): 33-43.. Spencer, J., & Albergotti, R. (2004). Customer-satisfaction index climbs. The Wall Street Journal, D2, (Feb. 18). Suk-ching, H. (2001). Executive Insights: Growing Consumer Power in China: Some Lessons for Managers. Journal of International Marketing, 9(1), 64-83. Roberts, J, & Tanner, J 2002, Compulsive buying and sexual attitudes, intentions, and activity among adolescents: an extension of Roberts and Tanner (2000)', Psychological Reports 90, 3 Pt 2, pp. 1259-1260) Rosenbloom B., Dimitrova B. (2011). Emerald Article: The marketing mix paradigm and the Dixonian systems perspective of marketing. Journal of Historical Research in Marketing, Vol. 3 Iss: 1 pp. 53 - 66. Tsang-Sing Chan and Geng Cui. (2004) Consumer attitudes toward marketing in a transitional economy: a replication and extension, Journal of Consumer Marketing, Vol. 21 Iss: 1, pp.10 – 26 Wee, C. H., & Chan, M. (1989). Consumer sentiment toward marketing in Hong Kong. European Journal of Marketing, 23 (4), 25–39. Wilkie, W. L., & Moore, E. S. (1999). Marketing’s contributions to society. Journal of Marketing, 63 (Special Issue), 198–218. Varadarajan, P., Rajan, P. and Thirunarayana, P. (1990). Consumers’ attitudes towards marketing practices, consumerism and government regulations: cross-national perspective. European Journal of Marketing, Vol. 24 No. 6, pp. 6-24.
Umeå School of Business Author: Thanh Phan & Mai Tran Umeå University, Sweden Supervisor: Gert-Olof Boström Master thesis in Business Administration Spring Semester, 2011
67
Websites
CIA Fact-book (2011). Available at: www.cia.gov. Accessed on 20th March 2011 European Media Management Review. Available at: www.tukkk.fi. Accessed on 20th March
The American Consumer Sentiment Index (2011), Available at www.theacsi.org. Accessed on 13th April, 2011
Tuoitre Newspaper (2011). Available at www.tuoire.vn. Accessed on 20th March 2011. Thanhnien Newspaper (2011). Available at: www.thanhniennews.com. Accessed on 20th March 2011. The 2009 Vietnam population and housing census: Available at: www.gso.gov.vn. Accessed on 14th April 2011. World Bank: (2011), Available at www.data.worldbank.org. Accessed in 24th April 2011
Conference Papers:
Jolliffe, L., and Bui, T. H. (2006) Coffee and tourism in Vietnam: A niche tourism product? Presented at the Travel and Tourism Research Association – Canada Chapter Conference at Montebello, Quebec
Others
Nielson Pocket Research Book – Vietnamese Consumer Confidence Report, 2009, 2010. Access at www.nielsen.com/intl/vn/news-insights/reports.html
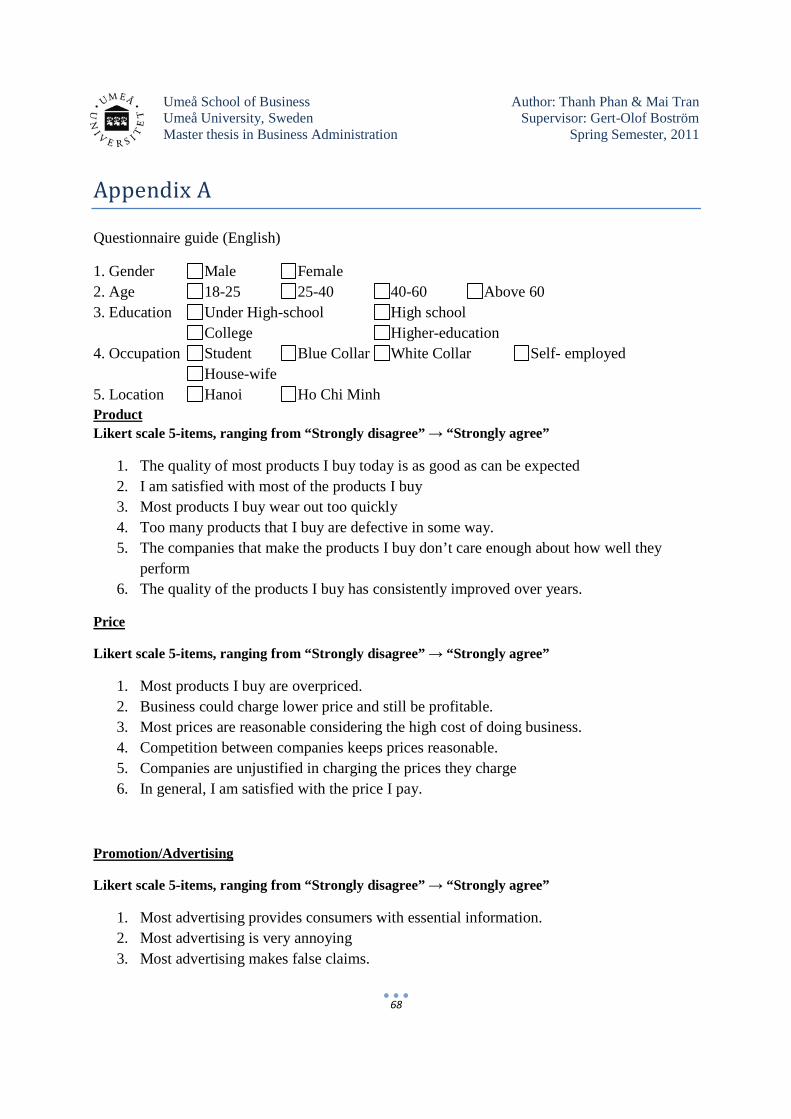
Umeå School of Business Author: Thanh Phan & Mai Tran Umeå University, Sweden Supervisor: Gert-Olof Boström Master thesis in Business Administration Spring Semester, 2011
68
Appendix A
Questionnaire guide (English)
1. Gender Male Female 2. Age 18-25 25-40 40-60 Above 60 3. Education Under High-school High school College Higher-education 4. Occupation Student Blue Collar White Collar Self- employed House-wife 5. Location Hanoi Ho Chi Minh Product Likert scale 5-items, ranging from “Strongly disagree” → “Strongly agree”
1. The quality of most products I buy today is as good as can be expected 2. I am satisfied with most of the products I buy 3. Most products I buy wear out too quickly 4. Too many products that I buy are defective in some way. 5. The companies that make the products I buy don’t care enough about how well they
perform 6. The quality of the products I buy has consistently improved over years.
Price
Likert scale 5-items, ranging from “Strongly disagree” → “Strongly agree”
1. Most products I buy are overpriced. 2. Business could charge lower price and still be profitable. 3. Most prices are reasonable considering the high cost of doing business. 4. Competition between companies keeps prices reasonable. 5. Companies are unjustified in charging the prices they charge 6. In general, I am satisfied with the price I pay.
Promotion/Advertising
Likert scale 5-items, ranging from “Strongly disagree” → “Strongly agree”
1. Most advertising provides consumers with essential information. 2. Most advertising is very annoying 3. Most advertising makes false claims.
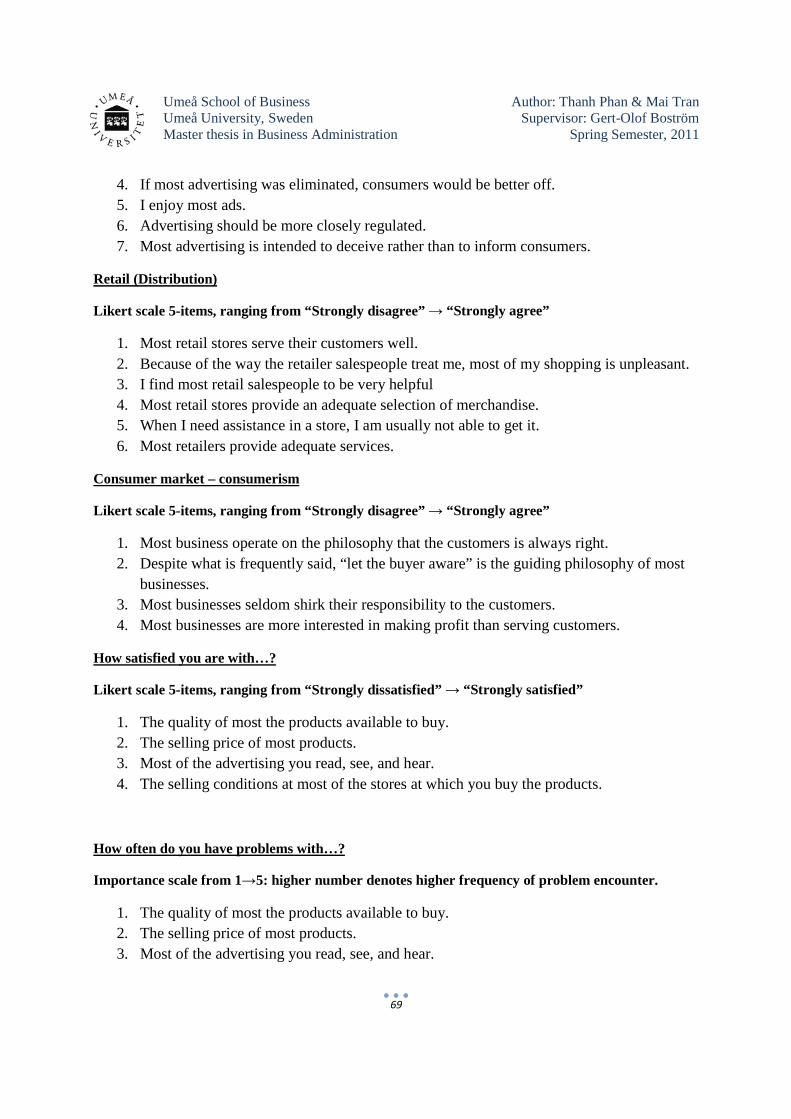
Umeå School of Business Author: Thanh Phan & Mai Tran Umeå University, Sweden Supervisor: Gert-Olof Boström Master thesis in Business Administration Spring Semester, 2011
69
4. If most advertising was eliminated, consumers would be better off. 5. I enjoy most ads. 6. Advertising should be more closely regulated. 7. Most advertising is intended to deceive rather than to inform consumers.
Retail (Distribution)
Likert scale 5-items, ranging from “Strongly disagree” → “Strongly agree”
1. Most retail stores serve their customers well. 2. Because of the way the retailer salespeople treat me, most of my shopping is unpleasant. 3. I find most retail salespeople to be very helpful 4. Most retail stores provide an adequate selection of merchandise. 5. When I need assistance in a store, I am usually not able to get it. 6. Most retailers provide adequate services.
Consumer market – consumerism
Likert scale 5-items, ranging from “Strongly disagree” → “Strongly agree”
1. Most business operate on the philosophy that the customers is always right. 2. Despite what is frequently said, “let the buyer aware” is the guiding philosophy of most
businesses. 3. Most businesses seldom shirk their responsibility to the customers. 4. Most businesses are more interested in making profit than serving customers.
How satisfied you are with…?
Likert scale 5-items, ranging from “Strongly dissatisfied” → “Strongly satisfied”
1. The quality of most the products available to buy. 2. The selling price of most products. 3. Most of the advertising you read, see, and hear. 4. The selling conditions at most of the stores at which you buy the products.
How often do you have problems with…?
Importance scale from 1→5: higher number denotes higher frequency of problem encounter.
1. The quality of most the products available to buy. 2. The selling price of most products. 3. Most of the advertising you read, see, and hear.
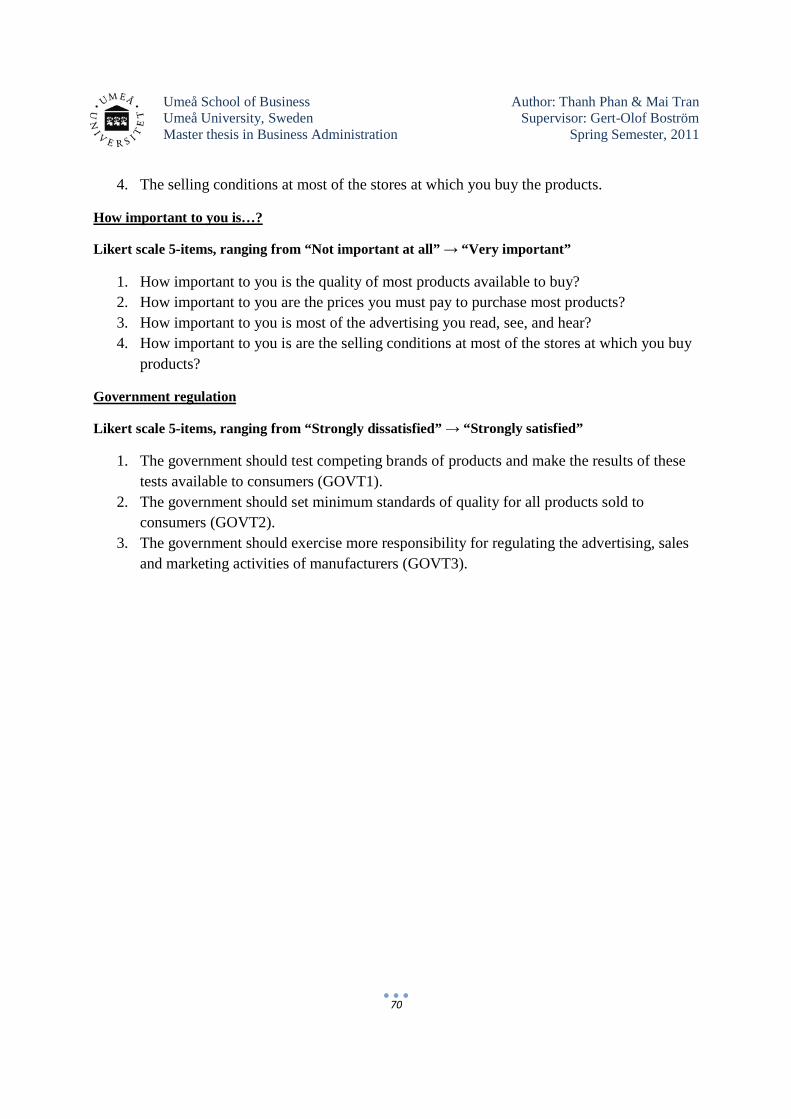
Umeå School of Business Author: Thanh Phan & Mai Tran Umeå University, Sweden Supervisor: Gert-Olof Boström Master thesis in Business Administration Spring Semester, 2011
70
4. The selling conditions at most of the stores at which you buy the products.
How important to you is…?
Likert scale 5-items, ranging from “Not important at all” → “Very important”
1. How important to you is the quality of most products available to buy? 2. How important to you are the prices you must pay to purchase most products? 3. How important to you is most of the advertising you read, see, and hear? 4. How important to you is are the selling conditions at most of the stores at which you buy
products?
Government regulation
Likert scale 5-items, ranging from “Strongly dissatisfied” → “Strongly satisfied”
1. The government should test competing brands of products and make the results of these tests available to consumers (GOVT1).
2. The government should set minimum standards of quality for all products sold to consumers (GOVT2).
3. The government should exercise more responsibility for regulating the advertising, sales and marketing activities of manufacturers (GOVT3).
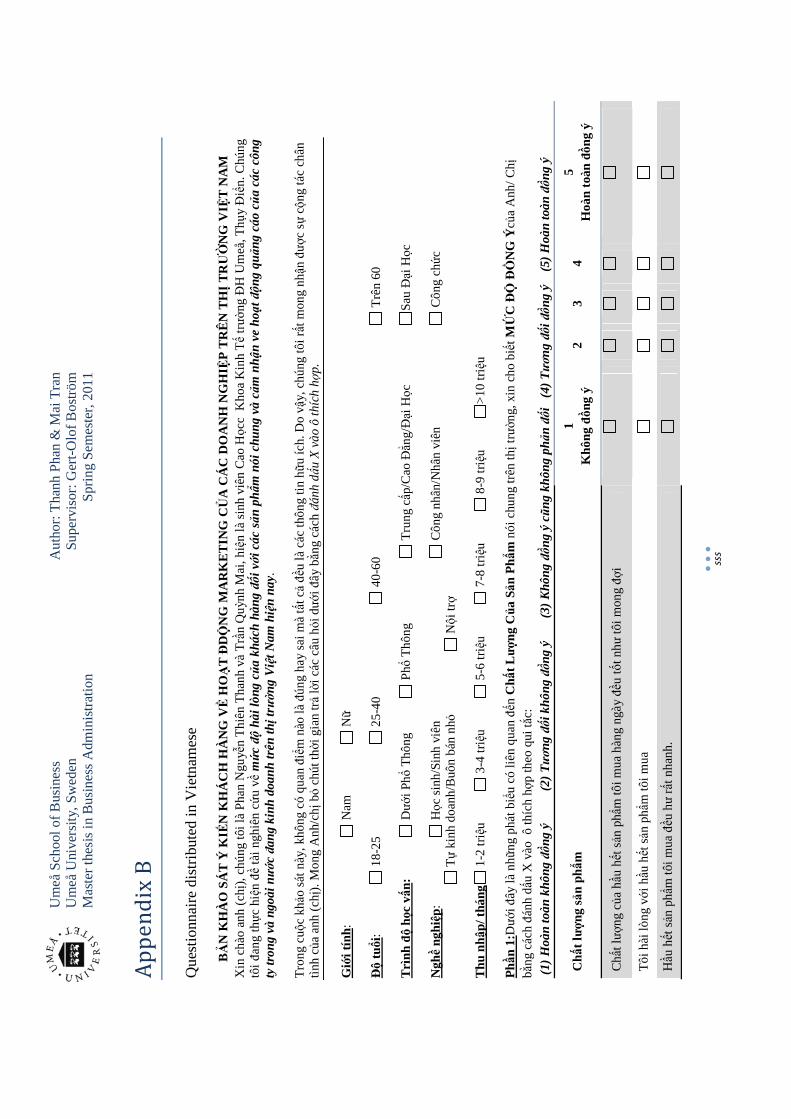
Um
eå
Sch
ool
of B
usin
ess
Au
tho
r: T
han
h P
han
& M
ai T
ran
U
me
å U
nive
rsity
, S
we
den
S
up
erv
isor
: Ger
t-O
lof B
os
trö
m
M
ast
er
thes
is in
Bu
sin
ess
Adm
inis
trat
ion
Sp
rin
g S
em
est
er,
20
11
sss
Ap
pe
nd
ix B
Qu
estio
nnai
re d
istr
ibu
ted
in V
ietn
ames
e
BẢ
N K
HÀ
O S
ÁT
Ý K
IẾ
N K
HÁ
CH
HÀ
NG
VỀ
HOẠ
T Đ
DỘ
NG
MA
RK
ET
ING
CỦ
A C
ÁC
DO
AN
H N
GH
IỆ
P T
RÊ
N T
HỊ
TRƯỜ
NG
VIỆ
T N
AM
X
in c
hào
an
h (
chị),
ch
ún
g tô
i là
Ph
an N
guyễn T
hiê
n T
han
h v
à T
rần Q
uỳn
h M
ai,
hiện
là s
inh
viê
n C
ao Họ
cc
Kh
oa
Kin
h Tế
trườn
g Đ
H U
meå
, T
hụy Đ
iển
. C
hún
g tô
i đan
g thự
c hiện
đề
tài n
ghiê
n cứ
u về
mứ
c độ
hài
lòng
của
khá
ch h
àng đối
với
các
sản
phẩm
nói
chu
ng v
à cảm
nhậ
n ve
hoạ
t độn
g quản
g cá
o củ
a cá
c cô
ng
ty tr
ong
và n
goài
nước
đan
g ki
nh d
oanh
trên
thị t
rườn
g V
iệt
Nam
hiện
nay
. T
ron
g cuộc
khả
o sá
t n
ày,
khô
ng c
ó q
uan
điểm
nào
là đú
ng
ha
y sa
i mà
tất cả đề
u là
các
thô
ng
tin hữ
u íc
h. D
o vậ
y, c
hú
ng t
ôi rấ
t m
ong
nhậ
n đượ
c sự
cộn
g tá
c ch
ân
tình
của
anh
(chị
). M
on
g A
nh/
chị
bỏ c
hút
thờ
i gia
n trả
lời c
ác c
âu hỏ
i dướ
i đâ
y bằ
ng
cách
đán
h dấu
X v
ào
ô t
híc
h hợ
p.
Giớ
i tín
h:
Nam
Nữ
Độ
tuổi
: 1
8-2
5
25
-40
4
0-6
0
T
rên
60
Trì
nh độ
học
vấn:
Dướ
i Phổ
Th
ôn
g
Phổ
Th
ông
T
run
g cấ
p/C
ao Đẳn
g/Đại
Học
Sau
Đại
Học
N
ghề
nghiệp
:
Học
sin
h/S
inh
viê
n
Cô
ng
nh
ân/N
hân
viê
n
C
ôn
g chức
Tự
kin
h d
oan
h/B
uôn
bán
nhỏ
Nội
trợ
T
hu n
hập
/ thá
ng
1-2
triệ
u 3
-4 t
riệu
5-6
triệ
u 7
-8 t
riệu
8-9
triệ
u >
10
triệ
u P
h ần
1:Dướ
i đây
là n
hữn
g p
hát
biểu
có
liên
qu
an đế
n C
hất L
ượ
ng Của
Sản
Phẩ
m n
ói c
hun
g tr
ên thị
trườn
g, x
in c
ho
biết
MỨ
C ĐỘ
ĐỒ
NG
Ýcủ
a A
nh/
Chị
bằn
g cá
ch đá
nh dấ
u X
vào
ô
thíc
h hợ
p th
eo q
ui tắ
c:
(1)
Hoà
n to
àn k
hông
đồng
ý
(2)
Tươn
g đố
i khô
ng đồn
g ý
(3)
Khô
ng đồ
ng ý
cũng
khô
ng p
hản đố
i (
4) Tươn
g đố
i đồn
g ý
(5
) H
oàn
toàn
đồng
ý
Ch ấ
t lượ
ng sả
n ph
ẩm
1 K
hông
đồn
g ý
2 3
4 5
Hoà
n to
àn đồn
g ý
Chấ
t lượn
g củ
a hầ
u hế
t sả
n p
hẩm
tô
i mu
a h
àng
ngà
y đều
tốt n
hư t
ôi m
ong đ
ợi
Tô
i hài
lòn
g vớ
i hầu
hết
sản
phẩ
m t
ôi m
ua
Hầu
hết
sản
phẩ
m t
ôi m
ua đều
hư
rất
nh
anh
.
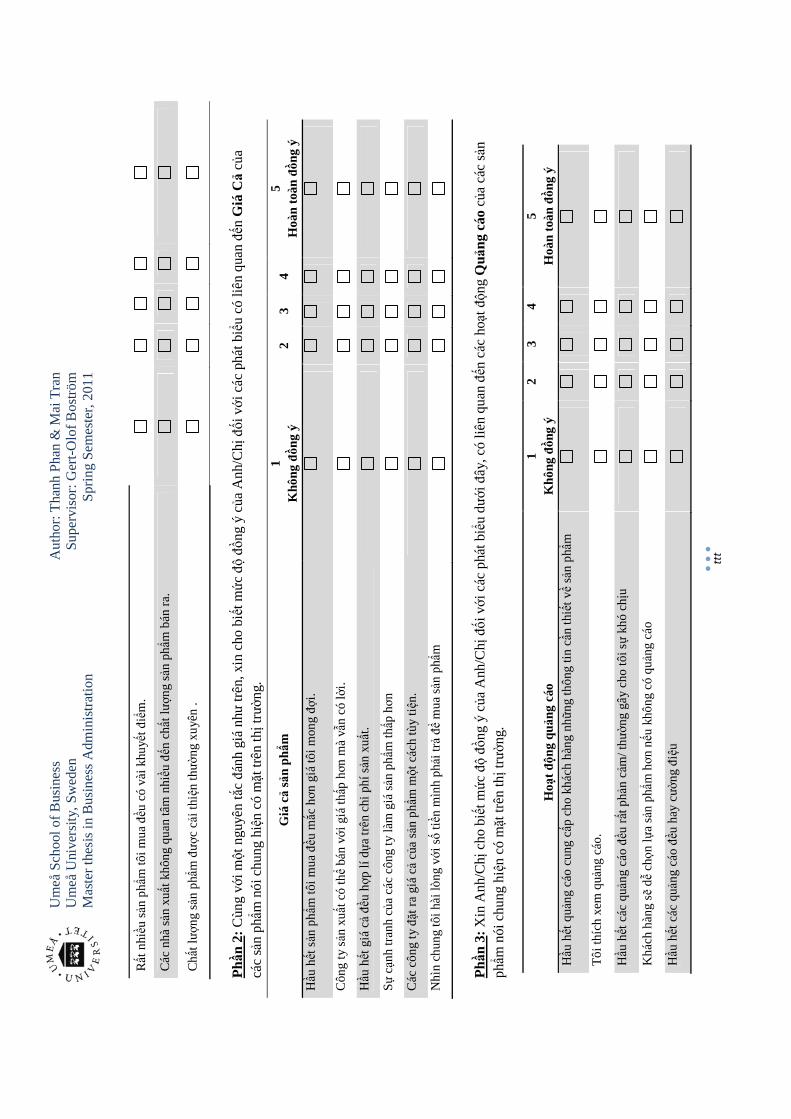
Um
eå
Sch
ool
of B
usin
ess
Au
tho
r: T
han
h P
han
& M
ai T
ran
U
me
å U
nive
rsity
, S
we
den
S
up
erv
isor
: Ger
t-O
lof B
os
trö
m
M
ast
er
thes
is in
Bu
sin
ess
Adm
inis
trat
ion
Sp
rin
g S
em
est
er,
20
11
ttt
Rất
nhiều
sản
phẩ
m t
ôi m
ua đều
có
vài k
huyết
điể
m.
Các
nhà
sản
xuất
kh
ông
qu
an tâ
m n
hiều đến
chấ
t lượn
g sả
n p
hẩm
bán
ra.
Chấ
t lượn
g sả
n p
hẩm
đượ
c cả
i thiện
thườ
ng
xuyê
n .
Phầ
n 2:
Cùn
g vớ
i một
ngu
yên
tắc đá
nh
giá
như
trê
n, x
in c
ho b
iết m
ức độ đồ
ng
ý củ
a A
nh/
Chị đố
i với
cá
c ph
át
biểu
có li
ên
qua
n đến
Giá
Cả
của
các
sản
phẩ
m n
ói c
hu
ng
hiện
có
mặt t
rên
thị t
rườn
g.
Giá
cả
sản
phẩm
1
Khô
ng đồn
g ý
2 3
4 5
Hoà
n to
àn đồn
g ý
Hầu
hết
sản
phẩ
m t
ôi m
ua đều
mắc
hơn
giá
tôi m
ong đợi
.
Côn
g ty
sản
xuất
có
thể
bán
với g
iá thấp
hơn
mà
vẫn
có
lời.
Hầu
hết
giá
cả đều
hợp
lí dựa
trê
n ch
i ph
í sản
xuấ
t.
Sự cạn
h t
ran
h củ
a cá
c cô
ng
ty là
m g
iá sản
phẩ
m t
hấp
hơn
Các
cô
ng
ty đặ
t ra
giá
cả của
sản
phẩ
m một
các
h tù
y tiệ
n.
Nh
ìn c
hu
ng
tôi h
ài lò
ng
v ới số
tiền
mìn
h p
hải t
rả để
mu
a sả
n p
hẩm
Phầ
n 3 :
Xin
An
h/C
hị c
ho
biết
mức
độ đồ
ng
ý củ
a A
nh/C
hị đố
i với
các
phá
t biể
u dưới
đâ
y, c
ó liê
n q
ua
n đến
các
hoạt
độn
g Q
uảng
cáo
của
các
sản
phẩ
m n
ói c
hu
ng h
iện c
ó mặ
t trê
n thị t
rườn
g.
H
oạt độn
g qu
ảng
cáo
1 K
hông
đồn
g ý
2 3
4 5
H
oàn
toàn
đồn
g ý
Hầu
hết
quả
ng
cáo
cu
ng cấp
ch
o k
hác
h h
àng
nhữn
g th
ông
tin
cần t
hiết
về
sản
phẩ
m
Tô
i th
ích
xem
quản
g cá
o.
Hầu
hết
các
quả
ng
cáo
đều
rất p
hản
cảm
/ thườ
ng g
ây
cho
tôi
sự k
hó
chịu
Kh
ách
hàn
g sẽ dễ
chọ
n lự
a sả
n p
hẩm
hơn
nếu
kh
ôn
g có
quản
g cá
o
Hầu
hết
các
quả
ng
cáo
đều
hay
cườn
g điệu
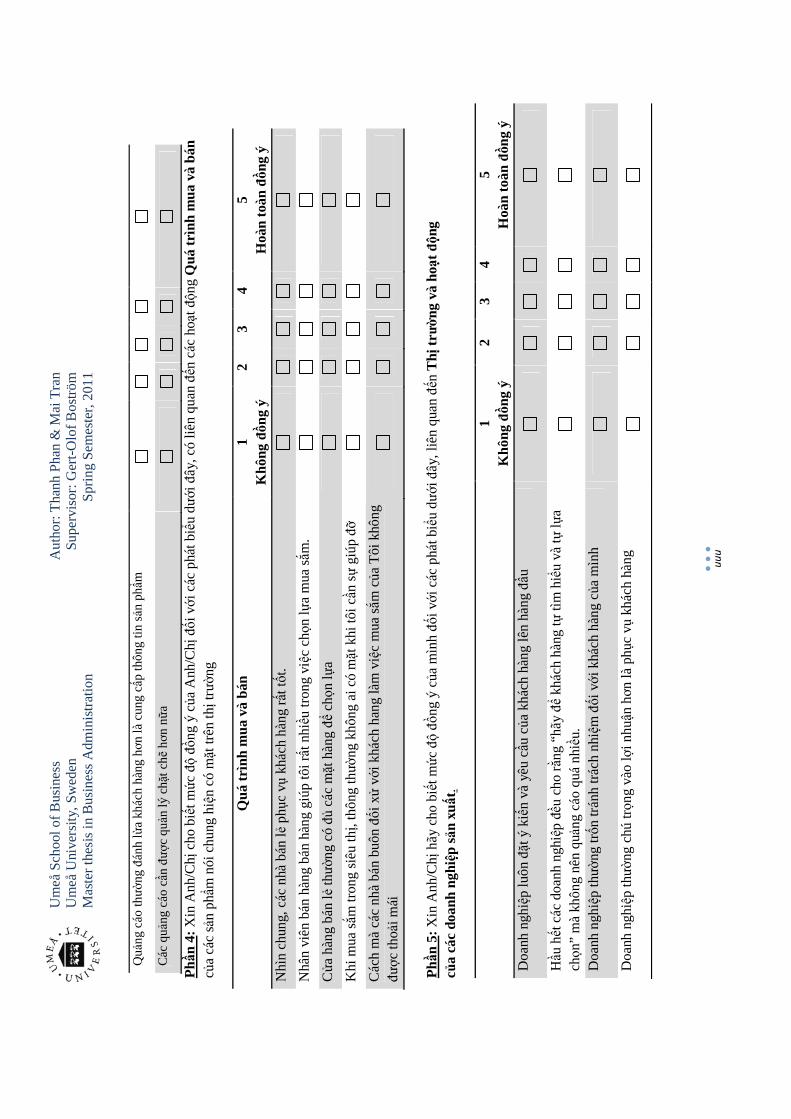
Um
eå
Sch
ool
of B
usin
ess
Au
tho
r: T
han
h P
han
& M
ai T
ran
U
me
å U
nive
rsity
, S
we
den
S
up
erv
isor
: Ger
t-O
lof B
os
trö
m
M
ast
er
thes
is in
Bu
sin
ess
Adm
inis
trat
ion
Sp
rin
g S
em
est
er,
20
11
uu
u
Quả
ng
cáo
thườn
g đá
nh
lừa
khác
h h
àng
hơn là
cu
ng cấ
p th
ông
tin sả
n p
hẩm
Các
quả
ng c
áo cầ
n đượ
c q
uản
lý c
hặt
chẽ
hơn
nữa
Phầ
n 4:
Xin
An
h/C
hị c
ho
biết
mức
độ đồ
ng
ý củ
a A
nh/C
hị đố
i với
các
phá
t biể
u dưới
đâ
y, c
ó liê
n q
ua
n đến
các
hoạt
độn
g Q
uá tr
ình
mua
và
bán
của
các
sản p
hẩm
nói
ch
ung
hiện
có
mặt
trê
n thị t
rườn
g
Quá
trìn
h m
ua v
à bá
n 1
Khô
ng đồn
g ý
2 3
4 5
H
oàn
toàn
đồn
g ý
Nhì
n ch
ung,
các
nhà
bán
lẻ
phụ
c vụ
khá
ch h
àn
g rất tố
t.
Nhâ
n vi
ên
bán
hà
ng bá
n hà
ng
giú
p tô
i rất n
hiề
u tr
on
g việ
c chọn
lựa
mua
sắm
.
Cửa
hàn
g b
án
lẻ thườ
ng
có đủ
cá
c mặ
t hà
ng để
chọn
lựa
Khi
mua
sắm
tro
ng
siê
u thị,
th
ông
thườn
g kh
ông
ai c
ó mặ
t kh
i tôi
cần
sự
giú
p đỡ
Cá
ch m
à cá
c n
hà
bá
n bu
ôn
đối x
ử vớ
i khá
ch h
ang
làm
việc m
ua sắ
m của
Tôi
khô
ng
được
thoả
i mái
Phầ
n 5:
Xin
An
h/C
hị h
ãy
cho
biết m
ức độ đồ
ng
ý củ
a m
ình đối
với
các
phá
t biểu
dướ
i đâ
y, li
ên
qua
n đến
Thị t
rườ
ng v
à hoạt
độn
g
của
các
doan
h ng
hiệp
sản
xuất
.
1
Khô
ng đồn
g ý
2 3
4 5
H
oàn
toàn
đồn
g ý
Do
anh
ngh
iệp lu
ôn đặ
t ý k
iến
và y
êu
cầu
của
khác
h hà
ng
lên hà
ng đ
ầu
Hầu
hết
cá
c do
an
h n
ghiệp đều
ch
o rằn
g “h
ãy đ
ể kh
ách
hà
ng tự
tìm
hiể
u và
tự lự
a chọn
” m
à kh
ôn
g nê
n q
uảng
cáo
quá
nhiều
.
Do
anh
ngh
iệp thườ
ng t
rốn
trá
nh tr
ách
nhiệ
m đối
với
khá
ch h
àng
của m
ình
Do
anh
ngh
iệp thườ
ng c
hú t
rọng
vào lợi
nh
uận
hơn
là p
hục
vụ k
há
ch h
àn
g
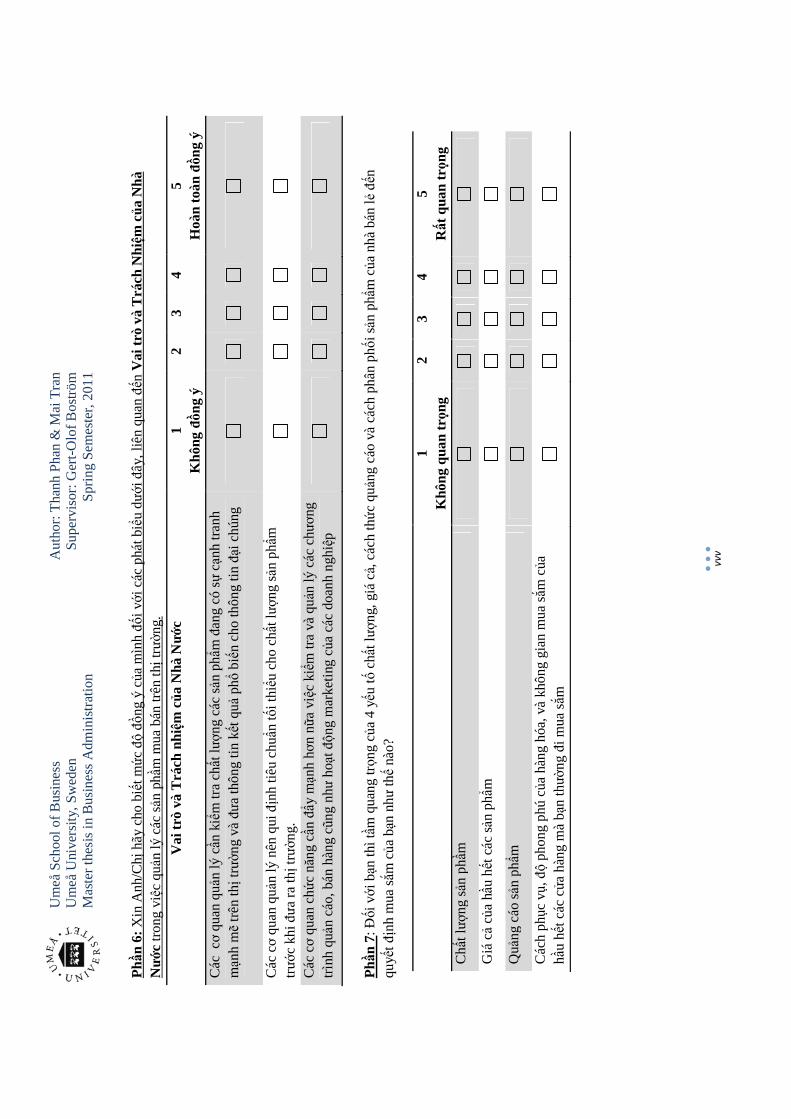
Um
eå
Sch
ool
of B
usin
ess
Au
tho
r: T
han
h P
han
& M
ai T
ran
U
me
å U
nive
rsity
, S
we
den
S
up
erv
isor
: Ger
t-O
lof B
os
trö
m
M
ast
er
thes
is in
Bu
sin
ess
Adm
inis
trat
ion
Sp
rin
g S
em
est
er,
20
11
vvv
Phầ
n 6:
Xin
An
h/C
hị h
ãy
cho
biết m
ức độ đồ
ng
ý củ
a m
ình đối
với
các
phá
t biểu
dướ
i đâ
y, li
ên
qua
n đến
Vai
trò
và T
rách
Nhiệm
của
Nhà
Nước
tro
ng
việc
quả
n lý
các
sản
phầm
mua
bán
trê
n thị trườ
ng.
Vai
trò
và T
rách
nhiệm
của
Nhà
Nước
1
Khô
ng đồn
g ý
2 3
4 5
H
oàn
toàn
đồn
g ý
Cá
c cơ
qua
n q
uản lý
cần
kiể
m tr
a chất
lượn
g cá
c sản
phẩ
m đ
an
g có
sự cạn
h tr
an
h mạn
h mẽ
trê
n thị
trườn
g và
đưa
thô
ng
tin kế
t quả
phổ
biế
n ch
o th
ôn
g tin
đại c
hún
g
Cá
c cơ
qu
an
quản
lý n
ên q
ui đị
nh t
iêu
chuẩn
tối t
hiể
u ch
o chất
lượn
g sả
n p
hẩm
trướ
c kh
i đưa
ra
thị t
rườn
g.
Cá
c cơ
qu
an
chức
năn
g cầ
n đẩ
y mạn
h hơn
nữa
việ
c kiểm
tra
và
quản
lý c
ác
chươ
ng
trìn
h quản
cáo
, bá
n hà
ng
cũng
như
hoạ
t độn
g m
arke
ting
của c
ác d
oan
h n
ghi
ệp
Phầ
n 7:
Đối
với
bạn
thì
tầm
qu
ang
trọn
g củ
a 4
yếu
tố c
hất lượ
ng,
giá
cả,
cách
thức
quả
ng c
áo v
à c
ách
ph
ân
ph
ối sản
phẩ
m của
nh
à b
án lẻ đế
n q
uyế
t địn
h m
ua sắ
m của
bạn
như
thế
nào?
1
Khô
ng q
uan
trọn
g 2
3 4
5
Rất
qua
n trọn
g C
hất lượ
ng
sản
phầ
m
Giá
cả
của
hầu
hết
các
sản p
hẩm
Quả
ng
cáo
sản p
hẩm
Cá
ch p
hục
vụ, đ
ộ ph
on
g p
hú củ
a hà
ng
hóa
, và
khô
ng
gia
n m
ua
sắm
của
hầ
u hế
t cá
c cử
a h
àng
mà
bạn t
hườn
g đi
mua
sắm
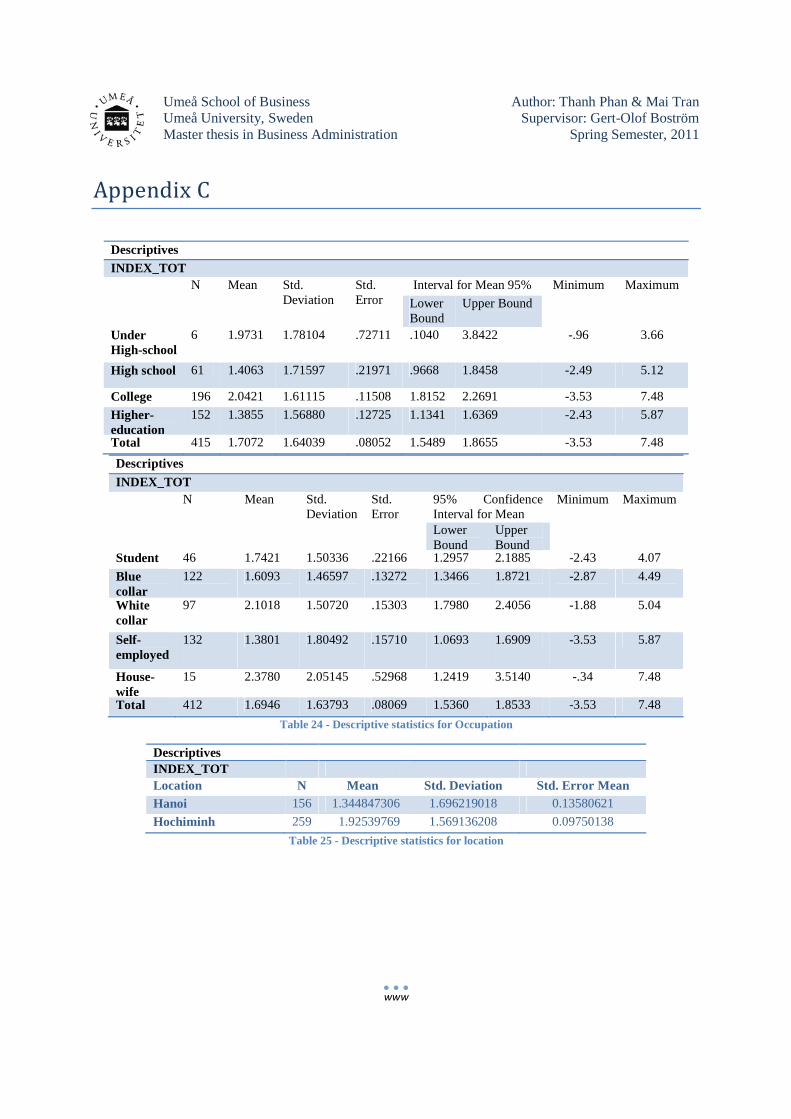
Umeå School of Business Author: Thanh Phan & Mai Tran Umeå University, Sweden Supervisor: Gert-Olof Boström Master thesis in Business Administration Spring Semester, 2011
www
Appendix C
Descriptives
INDEX_TOT N Mean Std.
Deviation Std. Error
95% Confidence Interval for Mean
Minimum Maximum
Lower Bound
Upper Bound
Student 46 1.7421 1.50336 .22166 1.2957 2.1885 -2.43 4.07
Blue collar
122 1.6093 1.46597 .13272 1.3466 1.8721 -2.87 4.49
White collar
97 2.1018 1.50720 .15303 1.7980 2.4056 -1.88 5.04
Self-employed
132 1.3801 1.80492 .15710 1.0693 1.6909 -3.53 5.87
House-wife
15 2.3780 2.05145 .52968 1.2419 3.5140 -.34 7.48
Total 412 1.6946 1.63793 .08069 1.5360 1.8533 -3.53 7.48
Table 24 - Descriptive statistics for Occupation
Descriptives INDEX_TOT Location N Mean Std. Deviation Std. Error Mean Hanoi 156 1.344847306 1.696219018 0.13580621
Hochiminh 259 1.92539769 1.569136208 0.09750138
Table 25 - Descriptive statistics for location
Descriptives INDEX_TOT N Mean Std.
Deviation Std. Error
Interval for Mean 95% Minimum Maximum
Lower Bound
Upper Bound
Under High-school
6 1.9731 1.78104 .72711 .1040 3.8422 -.96 3.66
High school 61 1.4063 1.71597 .21971 .9668 1.8458 -2.49 5.12
College 196 2.0421 1.61115 .11508 1.8152 2.2691 -3.53 7.48
Higher-education
152 1.3855 1.56880 .12725 1.1341 1.6369 -2.43 5.87
Total 415 1.7072 1.64039 .08052 1.5489 1.8655 -3.53 7.48
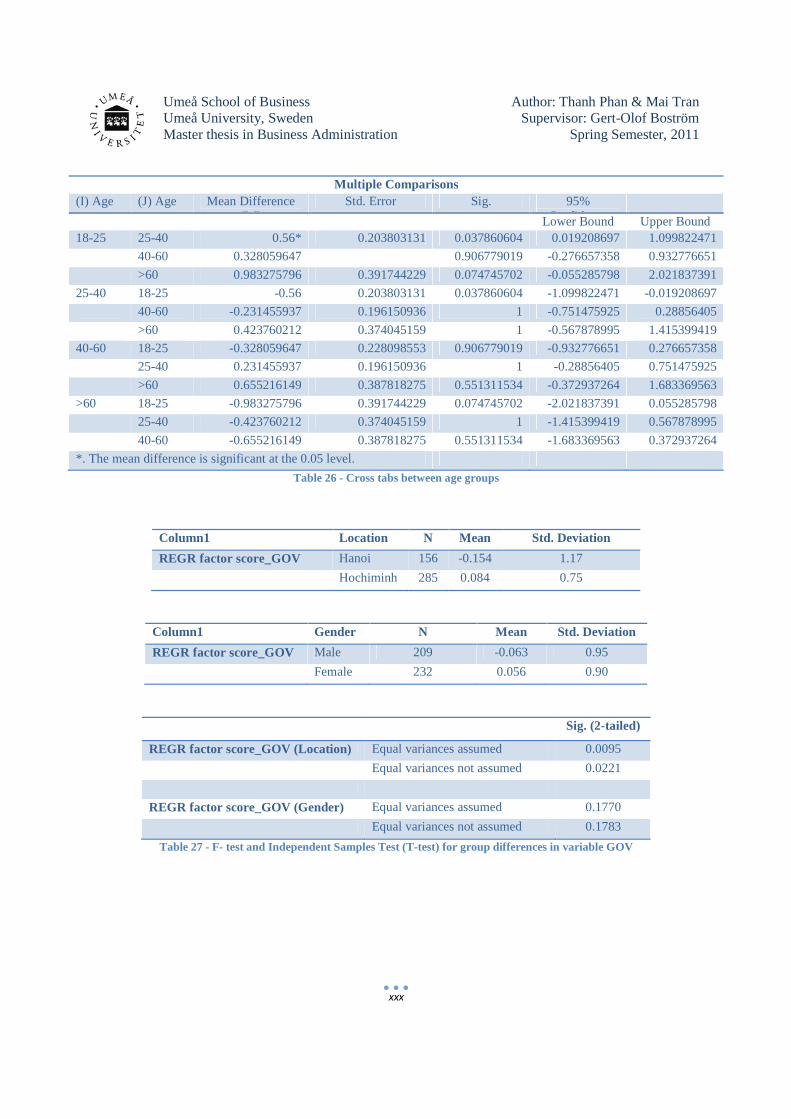
Umeå School of Business Author: Thanh Phan & Mai Tran Umeå University, Sweden Supervisor: Gert-Olof Boström Master thesis in Business Administration Spring Semester, 2011
xxx
Multiple Comparisons (I) Age (J) Age Mean Difference
(I-J) Std. Error Sig. 95%
Confidence
Lower Bound Upper Bound 18-25 25-40 0.56* 0.203803131 0.037860604 0.019208697 1.099822471
40-60 0.328059647 0.906779019 -0.276657358 0.932776651
>60 0.983275796 0.391744229 0.074745702 -0.055285798 2.021837391
25-40 18-25 -0.56 0.203803131 0.037860604 -1.099822471 -0.019208697
40-60 -0.231455937 0.196150936 1 -0.751475925 0.28856405
>60 0.423760212 0.374045159 1 -0.567878995 1.415399419
40-60 18-25 -0.328059647 0.228098553 0.906779019 -0.932776651 0.276657358
25-40 0.231455937 0.196150936 1 -0.28856405 0.751475925
>60 0.655216149 0.387818275 0.551311534 -0.372937264 1.683369563
>60 18-25 -0.983275796 0.391744229 0.074745702 -2.021837391 0.055285798
25-40 -0.423760212 0.374045159 1 -1.415399419 0.567878995
40-60 -0.655216149 0.387818275 0.551311534 -1.683369563 0.372937264
*. The mean difference is significant at the 0.05 level.
Table 26 - Cross tabs between age groups
Column1 Location N Mean Std. Deviation
REGR factor score_GOV Hanoi 156 -0.154 1.17
Hochiminh 285 0.084 0.75
Column1 Gender N Mean Std. Deviation
REGR factor score_GOV Male 209 -0.063 0.95
Female 232 0.056 0.90
Sig. (2-tailed)
REGR factor score_GOV (Location) Equal variances assumed 0.0095
Equal variances not assumed 0.0221
REGR factor score_GOV (Gender) Equal variances assumed 0.1770
Equal variances not assumed 0.1783
Table 27 - F- test and Independent Samples Test (T-test) for group differences in variable GOV