Embed Size (px)
Citation preview
Biodiversity and Conservation9: 1671–1705, 2000.© 2000Kluwer Academic Publishers. Printed in the Netherlands.
A simple system for monitoring biodiversityin protected areas of a developing country
FINN DANIELSEN1,∗, DANILO S. BALETE2, MICHAEL K. POULSEN1,MARTIN ENGHOFF1, CRISTI M. NOZAWA2 and ARNE E. JENSEN11NORDECO (Nordic Agency for Development and Ecology), Skindergade 23, DK-1159 Copenhagen,Denmark;2Protected Areas and Wildlife Bureau (PAWB) and NIPA (NGOs for Integrated ProtectedAreas, Inc.), Ninoy Aquino Parks and Wildlife Center, North Avenue, Diliman, Quezon City, Metro Manila,1100 Philippines;∗Author for correspondence (fax: +45-33919032; e-mail: [email protected])
Received 29 April 1999; accepted in revised form 21 February 2000
Abstract. The achievements of initiatives to strengthen biodiversity conservation in developing countriesmay be difficult to assess, since most countries have no system for monitoring biodiversity. This paperdescribes a simple and cost-effective, field-based biodiversity monitoring system developed specificallyfor areas where ‘specialist staff’ is lacking. We discuss the preliminary lessons learned from protectedareas in the Philippines. Whilst the monitoring system aims to identify trends in biodiversity and its usesso as to guide management action, it also promotes the participation of local people in the management,stimulates discussions about conservation amongst stakeholders and builds the capacity of park staff andcommunities in management skills. In addition, it seeks to provide people with direction regarding the aimsof protected areas, and reinforces the consolidation of existing livelihoods through strengthening commu-nity-based resource management systems. The field methods are: (1) standardised recording of routineobservations, (2) fixed point photographing, (3) line transect survey, and (4) focus group discussion. Bothbio-physical and socio-economic data are used and given equal importance. The system can be sustainedusing locally available resources. The approach is useful in countries embarking on shared managementof park resources with local communities, where rural people depend on use of natural ecosystems, andwhere the economic resources for park management are limited. We hope this paper will encourage othercountries to develop their own biodiversity monitoring system, letting its development become a meansfor capacity building whilst at the same time supporting the creation of ownership.
Key words: biodiversity, developing country, monitoring, participation, protected area
Introduction
Attempts to curb degradation of natural ecosystems world-wide have increas-ingly focused on the establishment of protected areas (e.g. Groombridge 1992), andthese now cover 6.4% of the world’s land area (WRI et al. 1998). The achieve-ments of protected area management may be difficult to assess, since in most de-veloping countries there is at present no established system for monitoring trends inbiodiversity.
Countries contracting to the Convention on Biological Diversity are obliged tomonitor biodiversity (Article 7.b), and donor countries increasingly demand account-
1672
ability and quantifiable achievements in return for their assistance. The developmentof biodiversity monitoring systems now attracts a significant proportion of the inter-national funding for biodiversity conservation. The Global Environment Facility, forexample presently the single largest funding source for biodiversity conservation indeveloping countries (Wells 1998) – requires the majority of the conservation projectsit finances to include biodiversity monitoring, although what this means in practiceremains to be seen.
The Protected Area and Wildlife Bureau (PAWB) of the Department of Environ-ment and Natural Resources (DENR) in the Philippines takes part in such internationalefforts (DENR and UNEP 1997; PAWB-DENR 1998) and, in addition, has legalrequirements for monitoring stipulated in the NIPAS Act (DENR 1992).
Basic assumptions for quantitative recording of biodiversity have been describedin the literature (e.g., Bibby et al. 1992; Wilson et al. 1996; Dallmeier and Comiskey1998; Margules et al. 1998; Thompson et al. 1998). The broader concepts of biodiver-sity monitoring have also been outlined (e.g., Noss 1990; Brown and Wyckoff-Baird1992; World Bank 1992; Harmon 1994; Kremen et al. 1994; Wangwacharakul et al.1996). However, few suggestions have been made as to how these may be meaning-fully translated into a developing country context (e.g., Fuller 1998; Kremen et al.1998; Margoluis and Salafsky 1998; World Bank 1998; Hellier et al. 1999), given theinherent tensions between standardisation of data, facility of collection and ease ofanalysis (IBAMA 1998). Initial efforts have tended to follow the standards used in de-veloped countries, probably because Western assistance has been involved. Comparedwith the West, developing countries have very limited human capacity and financialresources available. Furthermore, most protected areas in developing countries serveto meet the daily subsistence requirements of millions of rural poor (see e.g. Saberwaland Kothari 1996). It is therefore unlikely that Western-monitoring systems are suitedto developing countries.
Most monitoring systems in tropical forests include the establishment of perma-nent vegetation plots where all plants above a certain size are identified to speciesand measured, for instance every 5 years. Such monitoring can generate data forrigorous hypothesis testing and provide important scientific evidence. However, sincethe frequency of data collection is low and limited data is collected on the use ofresources, such exercise rarely provides any input to management. For conservationpurposes protected areas in developing countries need monitoring that is realistic andat the same time useful for guidance rather than what is ideally required for in depthstudies of how community structure and species richness are affected by differentenvironmental changes.
In this paper we describe and discuss a simple and cost-effective biodiversity mon-itoring system for protected areas, which:1. requires a minimum of training and education on the part of park staff,2. requires little equipment and financial resources,3. seeks to encourage participation of local communities in park management, and
1673
4. strengthens existing local systems for monitoring and managing naturalresources.
The ability of this monitoring system to detect trends in abundance of species andresource uses (i.e. to distinguish a situation different from the null hypothesis) couldbe strengthened by using more standardised methods e.g. territory mapping of birds(Bibby et al. 1992), arthropod protocols (Coddington et al. 1991) and permanentforest inventory plots (Alder and Synnott 1992). However, while more standardisedmethods can be valuable tools, their usefulness will in practice be constrained by:1. the shortage of trained field scientists, support staff, and facilities,2. the small proportion of taxa described and sufficiently known to make them use-
ful in applied programs, and3. the lack of identification manuals for most tropical species groups.
The aim of this monitoring system is to ensure better management and the involve-ment of local people rather than data-based falsification of scientific hypotheses con-cerning variation in biodiversity values. By allowing park staff to carry out the fieldassessments, this monitoring encourages them into the field and improves theircapacity for park management.
The monitoring system was developed for use in protected areas of the Philip-pines. It was designed and tested in three protected areas and the Government is nowembarking on large-scale implementation of the system in all the country’s protectedareas (G. Caledain litt . 1998). We hope this paper will help and encourage others toproceed with similar efforts elsewhere.
We define ‘monitoring’ as data sampling which is repeated at certain intervalsof time for management purposes. We distinguish this from surveys by emphasisingrepeated and replicable measurements over an extended time frame and by focusingon rates and magnitudes of change (modified from the World Bank 1992).
In developing countries in particular, most protected area management decisionsare taken at a local level (e.g. Groombridge and Jenkins 1996), and the system thus fo-cuses on monitoring at the level of the single protected area (or managementunit).
Methods
Development of this monitoring system was carried out over a 3-year period, from1996 to 1998, alongside building capacity among protected area staff and localdecision-makers in protected area management, undertaking inventories of thebiodiversity and its use, providing management information input, and raising aware-ness about conservation amongst local communities and decision-makers in threeprotected areas. Our team comprised Filipino professionals with expertise in ecology,field biology, socio-economy and training, a Danish ecologist and a Danish ruralsociologist. The Filipino staff input, in terms of person-months, was 5–6 times as
1674
high as the external staff input. The team was trained in protected area managementand integrating conservation with local development.
We searched the literature for monitoring techniques based on conventional meth-ods and then studied current natural resource and protected area management practic-es at field level in the three protected areas. Protected area staff and non-governmentalorganisations working with community development in the areas participated in thesurveys. Survey findings were subject to interdisciplinary discussions within the sur-vey team in the field or immediately after the surveys; this was time-consuming butgenerated awareness about methodological problems that had to be solved. It alsomeant that the conclusions were acceptable to a broader range of people and it encour-aged ownership of the monitoring system. Survey findings were brought back to thecommunities and protected area field staff in order to validate results and involve localstakeholders in the process. The survey helped us identify priority species, resourceuses and management interventions, and to adapt the monitoring system to the realsituation in the field.
Based on the literature and the field survey, a theoretical framework for monitor-ing biodiversity was drafted and discussed at a national workshop (University of thePhilippines, Los Baños, April 1997; Pollisco et al. 1997). This was attended by man-agers and scientists from the Philippines and abroad. We tested possible field meth-ods, discussed them with field staff, developed a training package and identificationguides for priority species and carried out one-week training courses for protectedarea staff in the forest and in the protected area villages where the staff would beworking. Field methods and data interpretation were discussed in a workshop withsenior staff of the Protected Areas and Wildlife Bureau of DENR (May 1998), and amanual was prepared (Nordeco and DENR 1998a). Regular visits were subsequentlymade to the sites to assist and supervise park staff in field implementation.
Study areas
The monitoring system was developed on the basis of fieldwork in three NaturalParks: Northern Sierra Madre, Bataan, and Mt. Kitanglad Range (Figure 1). Theseare covered by the Conservation of Priority Protected Areas Project (CPPAP), whichsupports the construction of park infrastructure, development of management plans,mapping, boundary delineation and demarcation, advocacy, community consultationand training, and non-degrading livelihood projects in buffer and multiple use zones.
Northern Sierra Madre Natural Park is in Isabela Province, north-eastern Luzon.With 359,486 ha, it is the largest protected area in the country. It has 36 park staff.The Park comprises the largest area of lowland forest remaining in the Philippinesand is one of the few areas with a natural transition between coastal and terrestrialecosystems. The Sierra Madre mountain range is the main water catchment area ineastern Luzon, which is one of the country’s most important rice-producing areas.
1675
During the El Niño of 1997, the Sierra Madre was the only part of the country thatdid not suffer from water supply deficit. A total of 70 wildlife species regarded asglobally threatened or near-threatened by IUCN (1996) are known within the Park,
Figure 1. Location of Northern Sierra Madre Natural Park (1), Bataan Natural Park (2), and Mt. KitangladRange Natural Park (3) in the Philippines.
1676
including the Golden-crownedFlying FoxAcerodon jubatus, DugongDugong dugon,Philippine EaglePithecophaga jefferyiand Estuarine CrocodileCrocodylus porosus.A total of 1000 indigenous Agtas and 31,500 migrants residing adjacent to or withinthe Park heavily depend on the forest and coastal resources. The human activitieswith most negative impact on the conservation values of the Park are logging (bothlarge and small-scale), swiddening, agricultural development, and forest clearing forland speculation (Nordeco and DENR 1998b).
Bataan Natural Park is located in Bataan Province in western Luzon. It covers23,668 ha and has 30 park staff. A total of 25 wildlife species regarded as globallythreatened or near-threatened by IUCN (1996) are known within the park. A total of300 indigenous people and 3000 migrants reside in the Park. The indigenous peopledepend on the forest as a source of food and medicine, whilst other residents largelyuse the forest for cultivation, extraction of bamboo and timber, and fishing. Humanactivities severely impacting on the Park are: construction of roads, buildings and fac-tories, and large-scale plantations of coffee, mangoes and other tree crops (Nordecoand DENR 1998c).
Mt. Kitanglad Range Natural Park is located in Bukidnon Province in northernMindanao. It covers 40,176 ha and has 24 park staff. The Park protects the majorpart of the remaining forest in the Province and comprises one of the largest areas ofmontane forest in the country. It is one of the main water catchment areas in northernMindanao. A total of 45 wildlife species regarded as globally threatened or near-threatened by IUCN (1996) have been recorded in the Park, including the PhilippineEaglePithecophaga jefferyiand a mammal only known in this area, the MindanaoPygmy Fruit BatAlionycteris paucidentata. A total of 34,000 indigenous people and9000 migrants reside in or adjacent to the Park. The indigenous people and house-holds close to the forest heavily depend on the forest as a source of food and medicine.They use more than 500 species of flora and fauna. The human activities with the mostsevere impact on the Park are the establishment of commercial crop plantations andlarge farms, swiddening and small-scale logging (Nordeco and DENR 1998d).
Theoretical framework for monitoring biodiversity in Philippine protectedareas
Questions the monitoring is intended to answer
The ultimate objective of the Philippine protected areas is “to secure for the Filipi-no people [..] the perpetual existence of all native plants and animals” (NIPAS Act;DENR 1992). Guided by this long-term objective, monitoring is intended to answerthe following questions in each protected area:• Are habitats and ecosystems being degraded?• Are the populations of threatened species of plants and animals declining?
1677
• What are the causes?• Has management intervention had the intended impact on the ecosystem?• Are there increased benefits to local people from sustainable natural resource
use?In other words, monitoring should answer the question: are the management inter-ventions in the area effective in addressing biodiversity conservation?
Existing monitoring activities
Many protected area communities in the Philippines, especially indigenous people,still implement some form of traditional system for controlling access to resources.These people have lived in a particular area for generations and have intimate know-ledge of the habitats and behaviour of wildlife species. Observing events in natureinfluences their survival strategies and resource use. Traditional systems for control-ling access to resources are used in all three Natural Parks concerned. Communityleaders and people regularly discuss the availability and quality of natural resources.One such example is the Talaandigs and Higaonon in Mt. Kitanglad Range NaturalPark who perform rituals for hunting and forbid resource extraction in some placeswhich are calledlalaw (Nordeco and DENR 1998d). In this way, they control andmonitor access to certain areas and the use of resources. Merely by living in theareas, using the resources and observing their environment, they monitor changes inthe resources. The biodiversity monitoring system was designed to build upon andstrengthen existing community-based monitoring.
The central Department of Environment and Natural Resources (DENR) regularlymonitors forest cover, trade in endangered species, etc., but most of this data compi-lation is undertaken on a country-wide or regional basis, and is therefore of limiteduse for local protected area management. Further monitoring activity is undertakenby local DENR staff who regularly visit the field where, for example, they assess thesize of extracted timber.
Available human capacity and financial resources
The availability of human capacity and financial resources has an important bear-ing on a monitoring system. In each protected area covered by the Conservation ofPriority Protected Areas Project (CPPAP), the following people typically work withprotected area management: staff of the Protected Area Superintendent (PASu) 8–10people, staff of the Host NGO (HNGO) 8–15 people and local forest guards up toca. 25 people. The forest guards can be ‘Datu’s or other members of the indigenouscommunities, and they may be selected by the local people. There is a high turnoveramong PASu staff (personal observation). In some protected areas, each PASu em-ployee is responsible for one particular geographical area, for instance two to fourvalleys.
1678
On the CPPAP sites, the PASu staff have B.Sc.’s in forestry or an associated field,and they receive training in different aspects of protected area management. Sincein the past, protected area management activities have mainly focused on enforcingregulations, there is limited capacity for creating a dialogue with local communities.Local people perceive PASu staff as law enforcers and they are sometimes unwillingto share information.
One HNGO employee is assigned to the same area such that in any one part of theprotected area one PASu and one HNGO are responsible for Government and NGOactivities respectively. The HNGO staff generally have a background in communityorganising or forestry. While most of the local forest guards have no formal education,some have attended primary or even secondary school. They have not received anysystematic training in protected area management. Given the size of most protectedareas and the high number of people living there, the workload for the protected areastaff is enormous. They have very limited time available for monitoring work, andthis is not likely to change.
The financial resources available for monitoring are limited. For CPPAP sites,there are some funds set aside for this purpose but beyond that project the only fund-ing sources are the endowment fund for each protected area (the Integrated ProtectedArea Fund, IPAF), and the Government of the Philippines. The local IPAF is expectedto provide funds for alternative livelihood activities in the buffer zone, whilst it ishoped that the Government will continue to fund basic protected area staffing andtransport costs etc. Biodiversity monitoring has to ‘compete’ for funds with otherhighly needed activities.
For a monitoring system to be sustained it needs to be based on locally availablepersonnel and resources. Satellite imagery, aerial surveillance and in-depth socio-logical and biological inventories can generate very useful data for protected areamanagement. These methods, however, rely on personnel and equipment, such ascomputer technology, which is not available at the level of the local protected area.Given the limited availability of funding for biodiversity, it was thus important tochoose simple monitoring procedures. The monitoring nevertheless had to be able toprovide tangible results that could be used – even in the short-term – for improvingprotected area management. Otherwise protected area staff would not be likely tocontinue the data compilation.
Management levels in protected areas
Given the constraints in the human capacity and financial resources available for pro-tected area management, we envisaged that the management level in most protectedareas would remain rather limited: only the most important management interven-tions would be undertaken. The biodiversity monitoring system was designed tofocus on addressing priority issues and providing input to protected area manage-
1679
ment that would be of a sufficiently general nature to lead to actions which could beimplemented.
Indicators
An ‘indicator for biodiversity’ can be defined as a parameter which describes the stateof biodiversity in an area. Indicators serve three main functions: (1) they measurecomplex phenomena, but (2) in a simplified way, by reducing the numbers of mea-surements normally required to make an exact presentation of a situation, (3) therebypromoting communication about complex relationships (Hammond et al. 1995).
Biodiversity indicators for protected areas should ideally highlight, as unambig-uously as possible, emerging problems in biodiversity conservation and draw atten-tion to the effectiveness of management policies and actions (Hammond et al. 1995;a review of indicators for ecosystem health is provided by Vora 1997). Relevant cri-teria regarding the usefulness and practicality of indicators for biodiversity in Phil-ippine protected areas are (modified from Noss 1990; Weber 1990; Wangwacharakulet al. 1996) those which:• are easy and cost-effective to collect, analyse and report;• are meaningful to local people;• point as directly as possible to changes in biodiversity and resource use;• are suited for providing a continuous assessment over a wide range of stress;• are able to differentiate between natural cycles or trends (weather, climate, etc.)
and those induced by anthropogenic stress;• are relatively independent of sample size;• are sufficiently sensitive to provide an early warning of change;• are applicable over the range of ecosystems in the Philippines.
Since no single indicator possessed all of these desirable properties, a (small) set ofcomplementary indicators was required.
We found it most relevant to concentrate on indicators at ecosystem/habitat/com-munity level, at species/population level, and at what we called ‘use of ecosystem/species’ level. Based on workshop discussions, we selected four indicators:1. Changes in number of sightings of designated species and local resource uses;2. Changes in size of vegetation type blocks and in land-use of priority areas;3. Changes in frequency of detection of specified signs of presence of designated
fauna species and local resource uses along established transects;4. Changes in perceived harvest volume per effort and in number of people engaged
in specific biodiversity impacting activities within a given time period.For each of these indicators, we assessed possible use for management decisions, hab-itat coverage, proposed field method, type of data set, proposed compilers, equipmentneeds, frequency of data collection, data storage, and general pros and cons (Table 1).The indicators were intended to focus on trends (or changes in status) in biodiversityand resources rather than changes in absolute figures.
1680
Approach and methods
The objective of the Philippine biodiversity monitoring system is to improve the in-formation available for decision-makers in protected areas through the regular col-lecting of data on natural biological resources and their utilization. The focus is onidentifying trends in important biodiversity assets of an area and the use of the ar-ea’s biodiversity in order to guide action in park management. In addition, the sys-tem is intended to improve the participation of protected area communities in parkmanagement.
Who undertakes biodiversity monitoring?
The monitoring system is for use by protected area staff, local forest guards, localenvironmental groups and others from the local communities. It is designed so thatanyone interested in gathering information on changes in the environment can use it.Since people living in or adjacent to protected areas represent important sources ofinformation it is an advantage when the protected area staff responsible for biodiver-sity monitoring are different to those involved in enforcement in order to encourageopen discussion with local people.
How are the data used?
The information gathered is analysed by the Head of the Protected Area Office. Theresults are used by the Protected Area Management Board to take better decisionson the management of the land and people in the protected areas. Sometimes theinformation alerts the Head of the Protected Area Office to situations which shouldbe examined further. The information is also used by the people living in or adjacentto the protected area to improve local resource management.
Which species and resource uses are monitored?
During the development of the monitoring system it was on several occasions sug-gested that all plant and animal species living within the protected areas should bemonitored or that some indicator groups would be used which would represent thetotal biodiversity well. Biodiversity in a Philippine protected area encompasses thou-sands of life-forms, many of them not even named and described. It would be impos-sible to monitor all of these and there is noa priori way of assessing how specificwell-known groups such as birds or larger mammals will reflect the total biodiversity.We do not even know what a species richness estimate will tell us as forest distur-bance often leads to an increase in species richness even though forest specialistsdecline. The biodiversity of a Philippine park will probably remain virtually the sameprovided no large-scale habitat changes take place. If habitat changes do take place
1681Ta
ble
1.F
our
indi
cato
rsfo
rm
onito
ring
biod
iver
sity
and
reso
urce
use
inP
hilip
pine
prot
ecte
dar
eas.
Indi
cato
r1
Indi
cato
r2
Indi
cato
r3
Indi
cato
r4
Indi
cato
rC
hang
esin
num
ber
ofC
hang
esin
size
ofC
hang
esin
freq
uenc
yof
dete
ctio
nC
hang
esin
perc
eive
dsi
ghtin
gs(o
r2n
dha
ndve
geta
tion
type
bloc
ksan
dof
spec
ified
sign
sof
pres
ence
harv
estv
olum
epe
ref
fort
reco
rds
prov
ided
bylo
cal
inla
nd-u
seof
prio
rity
ofde
sign
ated
faun
asp
ecie
san
din
num
ber
ofpe
ople
peop
le)
ofde
sign
ated
area
s(e
cosy
stem
/hab
itat/
and
loca
lres
ourc
een
gage
din
spec
ific
spec
ies
and
loca
lco
mm
unity
and
use
ofus
esal
ong
esta
blis
hed
biod
iver
sity
impa
ctin
gre
sour
ceus
es(s
peci
esan
dec
osys
tem
/spe
cies
leve
l).tr
anse
cts
for
the
sam
ese
arch
activ
ities
with
ina
give
nus
eof
ecos
yste
m/
effo
rt(s
peci
es/p
opul
atio
nan
dtim
epe
riod
(use
ofec
o-sp
ecie
sle
vel).
use
ofec
osys
tem
/spe
cies
leve
l).sy
stem
/spe
cies
leve
l).P
ossi
ble
use
Indi
cate
spo
ssib
leIn
dica
tes
effe
ctiv
enes
sof
Indi
cate
spo
ssib
lech
ange
sP
rovi
des
anea
rlyw
arni
ngof
chan
ges
inre
lativ
eha
bita
tpro
tect
ion
and
inw
ildlif
epo
pula
tion
over
harv
estin
gsi
tuat
ions
and
abun
danc
eof
spec
ies
cons
erva
tion.
Itca
nte
llif
the
size
/hum
anin
tens
ityof
indi
cate
sch
ange
sin
reso
urce
and
reso
urce
use.
size
ofim
port
anth
abita
tsre
sour
ceus
ean
d/or
shift
inus
e,an
def
fect
iven
ess
are
decl
inin
gan
dw
hy.
rang
eof
wild
life/
hum
anof
park
inpr
ovid
ing
reso
urce
extr
actio
n.be
nefit
sto
loca
lcom
mun
ities
.H
abita
tU
sefu
lin
both
land
and
Use
fuli
nla
ndha
bita
ts,
part
icul
arly
Use
fuli
nla
ndha
bita
ts.
Use
fuli
nbo
thla
ndan
dco
vera
gew
ater
habi
tats
.in
undu
latin
gte
rrai
nan
dw
ater
habi
tats
.al
ong
curv
edco
astli
nes.
Fie
ldF
ield
Dia
rym
etho
d.P
hoto
Doc
umen
tatio
nT
rans
ectW
alk
met
hod.
Foc
usG
roup
Dis
cuss
ion
met
hod.
met
hod
Sta
ndar
dise
dre
cord
ing
met
hod.
On-
the-
grou
ndL
ine-
tran
sect
surv
eyof
Par
kst
affc
oope
rate
with
ofro
utin
eob
serv
atio
nsfix
edpo
intp
hoto
grap
hing
wild
life
and
reso
urce
use
com
mun
ityle
ader
san
des
tabl
ish
onre
sour
ceus
ean
dof
sele
cted
hills
ides
inal
ong
perm
anen
trou
tes.
avo
lunt
eer
Com
mun
ityw
ildlif
ein
asi
mpl
epr
iorit
yfo
rest
bloc
ksat
Mon
itorin
gG
roup
of5–
8pe
rson
s,po
cket
book
oron
ada
tare
gula
rin
terv
als.
who
are
enco
urag
edto
colle
ctsh
eetd
urin
gre
gula
rin
form
atio
non
are
gula
rba
sis
patr
ols.
betw
een
quar
terly
disc
ussi
ons
with
park
staf
f.T
here
sults
are
anal
ysed
byth
epa
rkst
affa
ndpr
esen
ted
annu
ally
for
the
entir
evi
llage
inor
der
toen
able
the
com
mun
ities
’inp
uts
and
resp
onse
sto
beob
tain
ed,
lead
ing
toag
reed
miti
gatin
gac
tions
.
1682Ta
ble
1.C
ontin
ued.
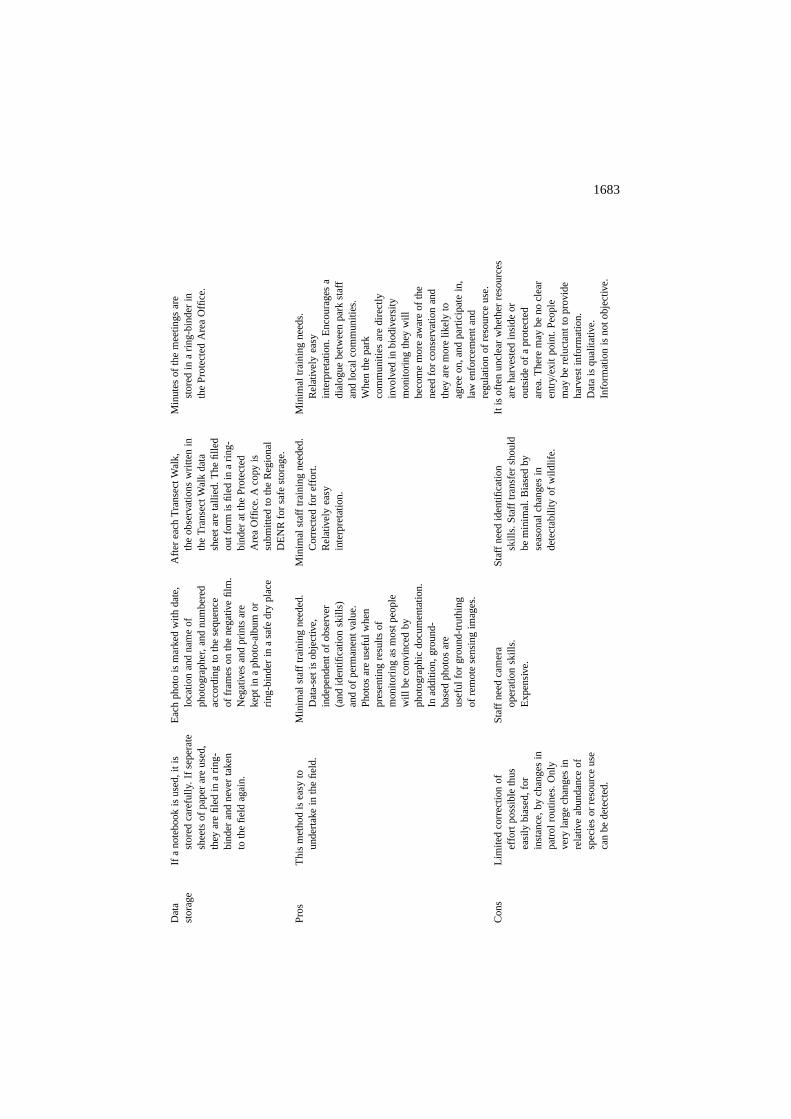
Indi
cato
r1
Indi
cato
r2
Indi
cato
r3
Indi
cato
r4
Dat
ase
tF
ield
data
shee
twith
Col
our
phot
o10×
15cm
Tra
nsec
tWal
kda
tash
eet
Am
ount
ofre
sour
ceha
rves
ted
(per
date
,nam
eof
obse
rver
,w
ithda
te,l
ocat
ion
and
with
date
,nam
eof
unit
effo
rt)
ina
defin
edar
ealo
catio
n,sp
ecie
s,na
me
ofph
otog
raph
er.
obse
rver
,loc
atio
n,sp
ecie
s,as
reco
rded
bya
com
mun
itynu
mbe
r/am
ount
and
num
ber/
amou
ntan
dor
sub-
grou
p;N
umbe
rof
rem
arks
.re
mar
ks.
peop
leen
gage
d(t
otal
orex
trap
olat
edfr
oma
sam
ple)
.
Com
pile
rsA
llpr
otec
ted
area
staf
f.S
kills
Pro
tect
edar
east
affw
itha
Pro
tect
edar
east
affw
ithP
rote
cted
area
staf
fwho
are
noti
nvol
ved
need
edin
com
mun
icat
ing
wor
king
know
ledg
eof
the
skill
sin
iden
tifyi
ngin
enfo
rcem
ent
activ
ities
.O
nepe
rson
with
loca
lpeo
ple
and
inba
sic
oper
atio
nsof
aca
mer
a.sp
ecie
s.E
ach
tran
sect
faci
litat
esdi
scus
sion
san
dan
othe
rid
entif
ying
spec
ies.
rout
esh
ould
besu
rvey
edre
cord
sth
em
inut
es.S
kills
inby
the
sam
epe
rson
.P
RA
met
hods
are
anad
vant
age.
Equ
ipm
ent
Not
eboo
k,pe
n,fie
ldC
amer
aw
ithba
ttery
,com
pass
,B
inoc
ular
s,fie
ldgu
ide,
wat
ch,
Fie
ldgu
ide,
larg
esh
eets
ofgu
ide
and
bino
cula
rs.
film
s,fo
rms
and,
ifpo
ssib
le,
Tra
nsec
tWal
kda
tash
eet,
pape
r,m
arke
rs,f
ood.
atr
ipod
.Dur
ing
wat
erco
ntai
ner
with
wat
er,a
ndes
tabl
ishm
ent
ofth
ism
etho
dfo
od.D
urin
ges
tabl
ishm
ent
ofot
her
need
edeq
uipm
ent
this
met
hod
othe
req
uipm
ent
isa
topo
grap
hic
map
need
edis
ato
pogr
aphi
can
d,if
poss
ible
,an
map
,com
pass
,alo
ngst
ring
altim
eter
,a
GP
S,a
ndpa
int
(50
or10
0m
),pe
rman
ent
orot
her
mat
eria
lsfo
rm
arke
r(p
aint
),an
d,if
poss
ible
,m
arki
ngth
esi
tepe
rman
ently
.a
GP
San
dan
altim
eter
.
Fre
quen
cyP
rote
cted
area
staf
fkee
pP
rote
cted
area
staf
ftak
eE
ach
Tra
nsec
tWal
kro
ute
Adi
scus
sion
mee
ting
oftw
oho
urs
afie
lddi
ary
whe
neve
rqu
arte
rlyph
otos
.Thi
sm
ayis
wal
ked
once
ever
yis
unde
rtak
enqu
arte
rlyw
ithth
eth
eyar
ein
the
field
.la
ter
bere
duce
dto
quar
ter
with
ina
defin
edC
omm
unity
Mon
itorin
gG
roup
.an
nual
lyat
view
-poi
nts
two-
wee
kpe
riod.
Onc
ea
year
am
eetin
gw
here
noch
ange
sin
land
-Ty
pica
llyon
epr
otec
ted
ishe
ldw
ithth
evi
llage
.us
ean
dha
bita
tsha
vear
east
affc
anbe
Mon
itorin
gG
roup
sca
nbe
bese
toc
curr
ed.T
ypic
ally
one
resp
onsi
ble
for
3–5
rout
es.
upin
alls
ettle
men
tsw
ithin
the
prot
ecte
dar
east
affc
anbe
prot
ecte
dar
ea.T
wo
park
resp
onsi
ble
for
3–5
phot
ost
affc
anbe
resp
onsi
ble
docu
men
tatio
nsi
tes.
for
4–6
Mon
itorin
gG
roup
s.
1683D
ata
Ifa
note
book
isus
ed,i
tis
Eac
hph
oto
ism
arke
dw
ithda
te,
Afte
rea
chT
rans
ectW
alk,
Min
utes
ofth
em
eetin
gsar
est
orag
est
ored
care
fully
.If
sepe
rate
loca
tion
and
nam
eof
the
obse
rvat
ions
writ
ten
inst
ored
ina
ring-
bind
erin
shee
tsof
pape
rar
eus
ed,
phot
ogra
pher
,an
dnu
mbe
red
the
Tra
nsec
tWal
kda
tath
eP
rote
cted
Are
aO
ffice
.th
eyar
efil
edin
arin
g-ac
cord
ing
toth
ese
quen
cesh
eeta
reta
llied
.T
hefil
led
bind
eran
dne
ver
take
nof
fram
eson
the
nega
tive
film
.ou
tfor
mis
filed
ina
ring-
toth
efie
ldag
ain.
Neg
ativ
esan
dpr
ints
are
bind
erat
the
Pro
tect
edke
ptin
aph
oto-
albu
mor
Are
aO
ffice
.Aco
pyis
ring-
bind
erin
asa
fedr
ypl
ace
subm
itted
toth
eR
egio
nal
DE
NR
for
safe
stor
age.
Pro
sT
his
met
hod
isea
syto
Min
imal
staf
ftra
inin
gne
eded
.M
inim
alst
afft
rain
ing
need
ed.
Min
imal
trai
ning
need
s.un
dert
ake
inth
efie
ld.
Dat
a-se
tis
obje
ctiv
e,C
orre
cted
for
effo
rt.
Rel
ativ
ely
easy
inde
pend
ent
ofob
serv
erR
elat
ivel
yea
syin
terp
reta
tion.
Enc
oura
ges
a(a
ndid
entifi
catio
nsk
ills)
inte
rpre
tatio
n.di
alog
uebe
twee
npa
rkst
aff
and
ofpe
rman
entv
alue
.an
dlo
calc
omm
uniti
es.
Pho
tos
are
usef
ulw
hen
Whe
nth
epa
rkpr
esen
ting
resu
ltsof
com
mun
ities
are
dire
ctly
mon
itorin
gas
mos
tpeo
ple
invo
lved
inbi
odiv
ersi
tyw
illbe
conv
ince
dby
mon
itorin
gth
eyw
illph
otog
raph
icdo
cum
enta
tion.
beco
me
mor
eaw
are
ofth
eIn
addi
tion,
grou
nd-
need
for
cons
erva
tion
and
base
dph
otos
are
they
are
mor
elik
ely
tous
eful
for
grou
nd-t
ruth
ing
agre
eon
,and
part
icip
ate
in,
ofre
mot
ese
nsin
gim
ages
.la
wen
forc
emen
tand
regu
latio
nof
reso
urce
use.
Con
sL
imite
dco
rrec
tion
ofS
taff
need
cam
era
Sta
ffne
edid
entifi
catio
nIt
isof
ten
uncl
ear
whe
ther
reso
urce
sef
fort
poss
ible
thus
oper
atio
nsk
ills.
skill
s.S
taff
tran
sfer
shou
ldar
eha
rves
ted
insi
deor
easi
lybi
ased
,for
Exp
ensi
ve.
bem
inim
al.B
iase
dby
outs
ide
ofa
prot
ecte
din
stan
ce,
bych
ange
sin
seas
onal
chan
ges
inar
ea.T
here
may
beno
clea
rpa
trol
rout
ines
.Onl
yde
tect
abili
tyof
wild
life.
entr
y/ex
itpo
int.
Peo
ple
very
larg
ech
ange
sin
may
bere
luct
ant
topr
ovid
ere
lativ
eab
unda
nce
ofha
rves
tinf
orm
atio
n.sp
ecie
sor
reso
urce
use
Dat
ais
qual
itativ
e.ca
nbe
dete
cted
.In
form
atio
nis
noto
bjec
tive.
1684
Table
1.C
ontin
ued. In
dica
tor
1In
dica
tor
2In
dica
tor
3In
dica
tor
4
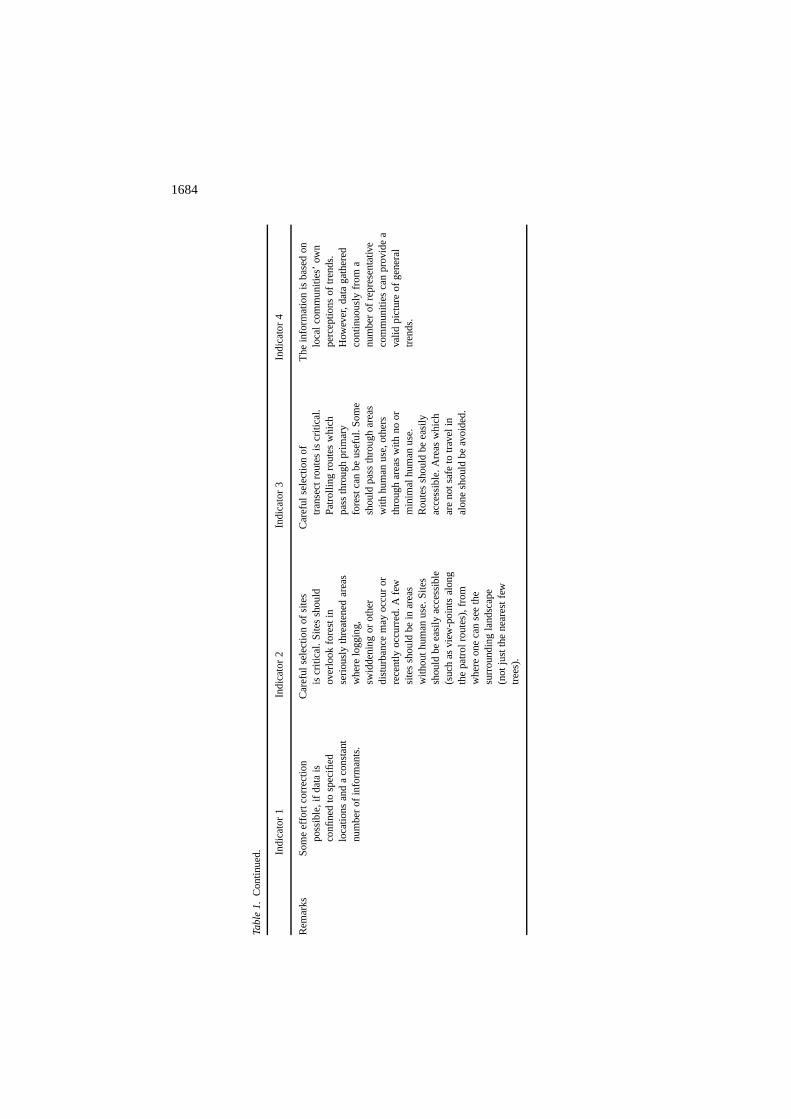
Rem
arks
Som
eef
fort
corr
ectio
nC
aref
ulse
lect
ion
ofsi
tes
Car
eful
sele
ctio
nof
The
info
rmat
ion
isba
sed
onpo
ssib
le,i
fdat
ais
iscr
itica
l.S
ites
shou
ldtr
anse
ctro
utes
iscr
itica
l.lo
calc
omm
uniti
es’o
wn
confi
ned
tosp
ecifi
edov
erlo
okfo
rest
inP
atro
lling
rout
esw
hich
perc
eptio
nsof
tren
ds.
loca
tions
and
aco
nsta
ntse
rious
lyth
reat
ened
area
spa
ssth
roug
hpr
imar
yH
owev
er,
data
gath
ered
num
ber
ofin
form
ants
.w
here
logg
ing,
fore
stca
nbe
usef
ul.S
ome
cont
inuo
usly
from
asw
idde
ning
orot
her
shou
ldpa
ssth
roug
har
eas
num
ber
ofre
pres
enta
tive
dist
urba
nce
may
occu
ror
with
hum
anus
e,ot
hers
com
mun
ities
can
prov
ide
are
cent
lyoc
curr
ed.A
few
thro
ugh
area
sw
ithno
orva
lidpi
ctur
eof
gene
ral
site
ssh
ould
bein
area
sm
inim
alhu
man
use.
tren
ds.
with
outh
uman
use.
Site
sR
oute
ssh
ould
beea
sily
shou
ldbe
easi
lyac
cess
ible
acce
ssib
le.
Are
asw
hich
(suc
has
view
-poi
nts
alon
gar
eno
tsaf
eto
trav
elin
the
patr
olro
utes
),fr
omal
one
shou
ldbe
avoi
ded.
whe
reon
eca
nse
eth
esu
rrou
ndin
gla
ndsc
ape
(not
just
the
near
estf
ewtr
ees)
.
1685
these will probably be the result of human activity. We therefore found it reasonableto focus biodiversity monitoring mainly on key habitats and uses in the parks.
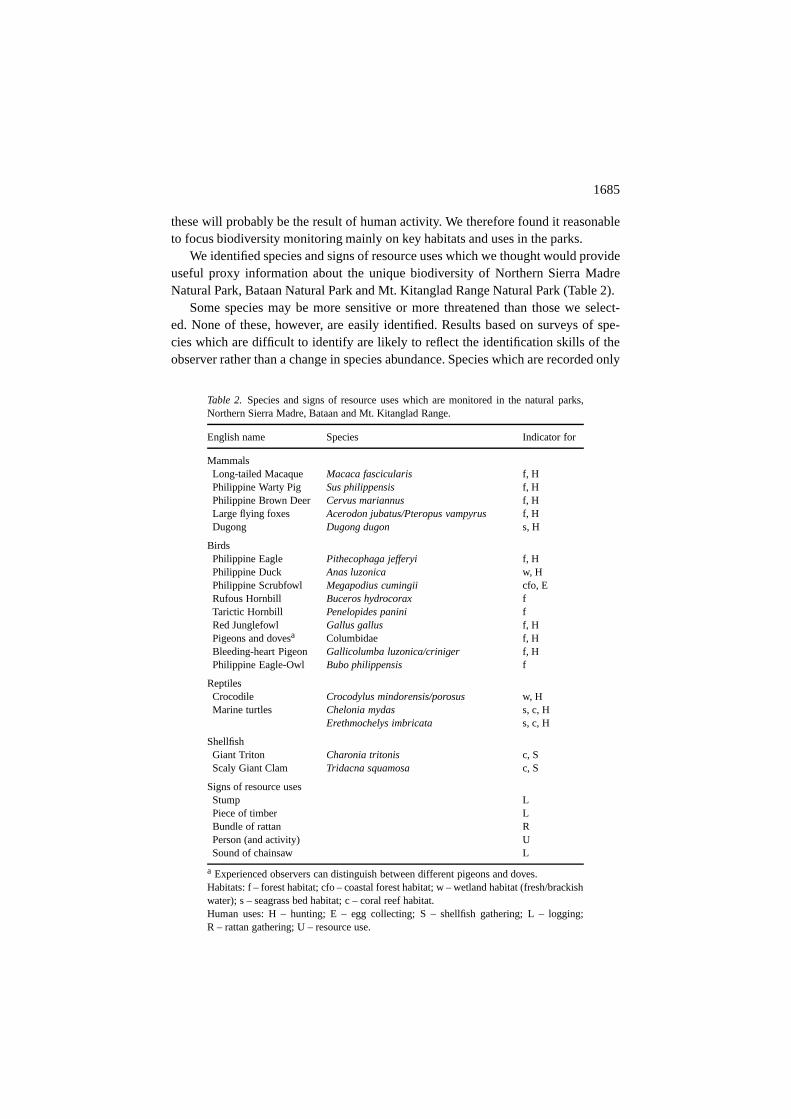
We identified species and signs of resource uses which we thought would provideuseful proxy information about the unique biodiversity of Northern Sierra MadreNatural Park, Bataan Natural Park and Mt. Kitanglad Range Natural Park (Table 2).
Some species may be more sensitive or more threatened than those we select-ed. None of these, however, are easily identified. Results based on surveys of spe-cies which are difficult to identify are likely to reflect the identification skills of theobserver rather than a change in species abundance. Species which are recorded only
Table 2. Species and signs of resource uses which are monitored in the natural parks,Northern Sierra Madre, Bataan and Mt. Kitanglad Range.
English name Species Indicator for
MammalsLong-tailed Macaque Macaca fascicularis f, HPhilippine Warty Pig Sus philippensis f, HPhilippine Brown Deer Cervus mariannus f, HLarge flying foxes Acerodon jubatus/Pteropus vampyrus f, HDugong Dugong dugon s, H
BirdsPhilippine Eagle Pithecophaga jefferyi f, HPhilippine Duck Anas luzonica w, HPhilippine Scrubfowl Megapodius cumingii cfo, ERufous Hornbill Buceros hydrocorax fTarictic Hornbill Penelopides panini fRed Junglefowl Gallus gallus f, HPigeons and dovesa Columbidae f, HBleeding-heart Pigeon Gallicolumba luzonica/criniger f, HPhilippine Eagle-Owl Bubo philippensis f
ReptilesCrocodile Crocodylus mindorensis/porosus w, HMarine turtles Chelonia mydas s, c, H
Erethmochelys imbricata s, c, H
ShellfishGiant Triton Charonia tritonis c, SScaly Giant Clam Tridacna squamosa c, S
Signs of resource usesStump LPiece of timber LBundle of rattan RPerson (and activity) USound of chainsaw L
a Experienced observers can distinguish between different pigeons and doves.Habitats: f – forest habitat; cfo – coastal forest habitat; w – wetland habitat (fresh/brackishwater); s – seagrass bed habitat; c – coral reef habitat.Human uses: H – hunting; E – egg collecting; S – shellfish gathering; L – logging;R – rattan gathering; U – resource use.
1686
rarely will not generate enough data. Species where the reason for possible change instatus can be relatively easily established (habitat versus hunting) are preferred.
Other parks may have different priority species and resource uses for monitoring.We have recommended that protected area staff in other parks should assess whetherthere are other species or signs of resource uses which are equally useful and practicalto monitor in their park and change the list accordingly.
Equipment
Only basic equipment is needed. These are: notebook and pencils, binoculars, watch,compass, camera with batteries and film, markers, large sheets of paper, ring bindersfor data storage, Photo Documentation forms, Transect Walk field data sheet, andfood. Whilst setting up the monitoring system it is also useful to have an altimeter anda GPS (Global Positioning System receiver). Apart from the initial costs of purchas-ing equipment, the most expensive items in the establishment and implementation ofthe system are staff time and travel (budget in Nordeco and DENR 1998a).
Field methods
Establishing and implementing the monitoring system comprises ten steps in eachprotected area (Table 3). For each indicator there is a corresponding field method.
The Field Diary method (Table 1) encourages protected area staff to be observantof changes in the use of park resources and the abundance of species. Data gatheredby this method is difficult to correct for effort and can be easily biased – by a changein patrol routines, for instance.
The Photo Documentation method provides data that is independent of observerand identification skills (Table 1). It documents habitat changes and provides an in-sight into the cause. If negatives and prints are stored in a safe, dry place, they canlast for many years. The photos can also be used for demonstration and educationpurposes.
The Transect Walk method (Table 1). Parts of existing patrol routes are used assurvey routes whenever possible (instead of establishing new trails) and only obser-vations, signs and spoor marks of a few preselected wildlife species and resourceuses are recorded. As the capacity of the protected area staff improves, this methodcan be further elaborated (by estimating the perpendicular distance from the trail toeach record) as it is a simplified version of the variable-distance line-transect method(Burnham and Anderson 1984; Buckland et al. 1993; Laake et al. 1993). The datamight subsequently be used to reveal national trends in the population of priorityspecies.
The Focus Group Discussion method draws upon Participatory Rural Appraisal(PRA) techniques developed by social scientists over the last decades. The strengthof the Focus Group Discussion method is that it encourages a dialogue between
1687
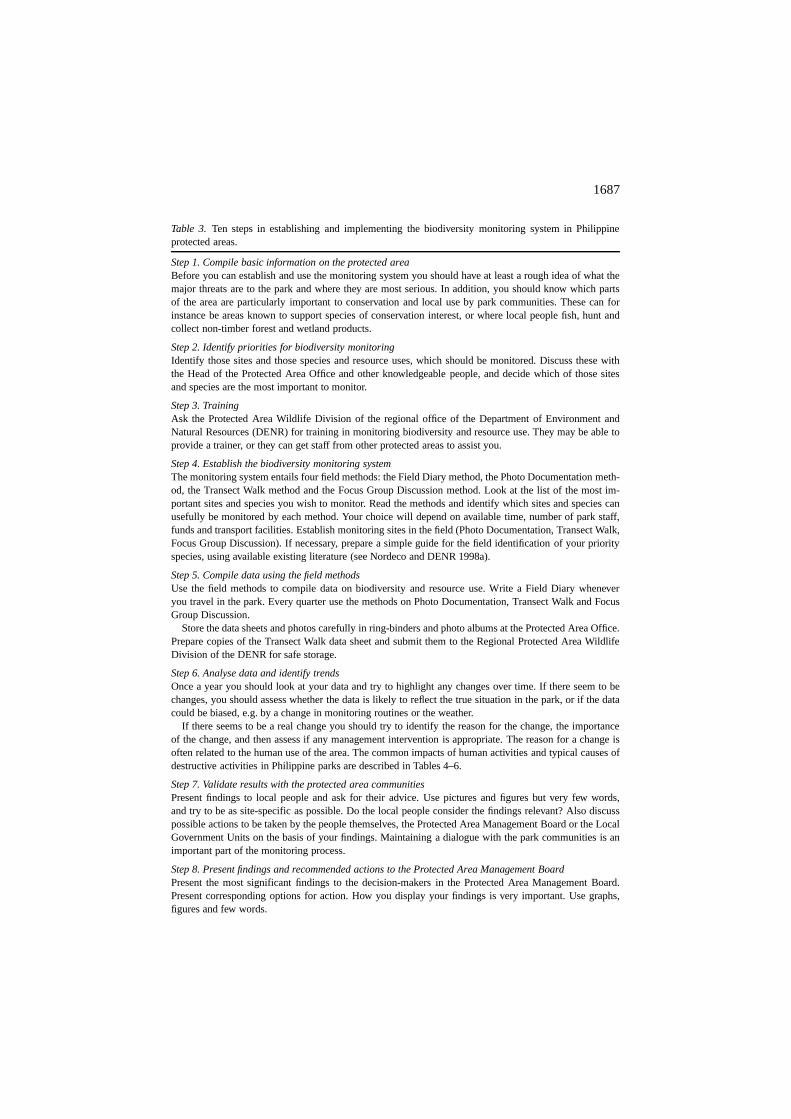
Table 3. Ten steps in establishing and implementing the biodiversity monitoring system in Philippineprotected areas.
Step 1. Compile basic information on the protected areaBefore you can establish and use the monitoring system you should have at least a rough idea of what themajor threats are to the park and where they are most serious. In addition, you should know which partsof the area are particularly important to conservation and local use by park communities. These can forinstance be areas known to support species of conservation interest, or where local people fish, hunt andcollect non-timber forest and wetland products.
Step 2. Identify priorities for biodiversity monitoringIdentify those sites and those species and resource uses, which should be monitored. Discuss these withthe Head of the Protected Area Office and other knowledgeable people, and decide which of those sitesand species are the most important to monitor.
Step 3. TrainingAsk the Protected Area Wildlife Division of the regional office of the Department of Environment andNatural Resources (DENR) for training in monitoring biodiversity and resource use. They may be able toprovide a trainer, or they can get staff from other protected areas to assist you.
Step 4. Establish the biodiversity monitoring systemThe monitoring system entails four field methods: the Field Diary method, the Photo Documentation meth-od, the Transect Walk method and the Focus Group Discussion method. Look at the list of the most im-portant sites and species you wish to monitor. Read the methods and identify which sites and species canusefully be monitored by each method. Your choice will depend on available time, number of park staff,funds and transport facilities. Establish monitoring sites in the field (Photo Documentation, Transect Walk,Focus Group Discussion). If necessary, prepare a simple guide for the field identification of your priorityspecies, using available existing literature (see Nordeco and DENR 1998a).
Step 5. Compile data using the field methodsUse the field methods to compile data on biodiversity and resource use. Write a Field Diary wheneveryou travel in the park. Every quarter use the methods on Photo Documentation, Transect Walk and FocusGroup Discussion.
Store the data sheets and photos carefully in ring-binders and photo albums at the Protected Area Office.Prepare copies of the Transect Walk data sheet and submit them to the Regional Protected Area WildlifeDivision of the DENR for safe storage.
Step 6. Analyse data and identify trendsOnce a year you should look at your data and try to highlight any changes over time. If there seem to bechanges, you should assess whether the data is likely to reflect the true situation in the park, or if the datacould be biased, e.g. by a change in monitoring routines or the weather.
If there seems to be a real change you should try to identify the reason for the change, the importanceof the change, and then assess if any management intervention is appropriate. The reason for a change isoften related to the human use of the area. The common impacts of human activities and typical causes ofdestructive activities in Philippine parks are described in Tables 4–6.
Step 7. Validate results with the protected area communitiesPresent findings to local people and ask for their advice. Use pictures and figures but very few words,and try to be as site-specific as possible. Do the local people consider the findings relevant? Also discusspossible actions to be taken by the people themselves, the Protected Area Management Board or the LocalGovernment Units on the basis of your findings. Maintaining a dialogue with the park communities is animportant part of the monitoring process.
Step 8. Present findings and recommended actions to the Protected Area Management BoardPresent the most significant findings to the decision-makers in the Protected Area Management Board.Present corresponding options for action. How you display your findings is very important. Use graphs,figures and few words.
1688
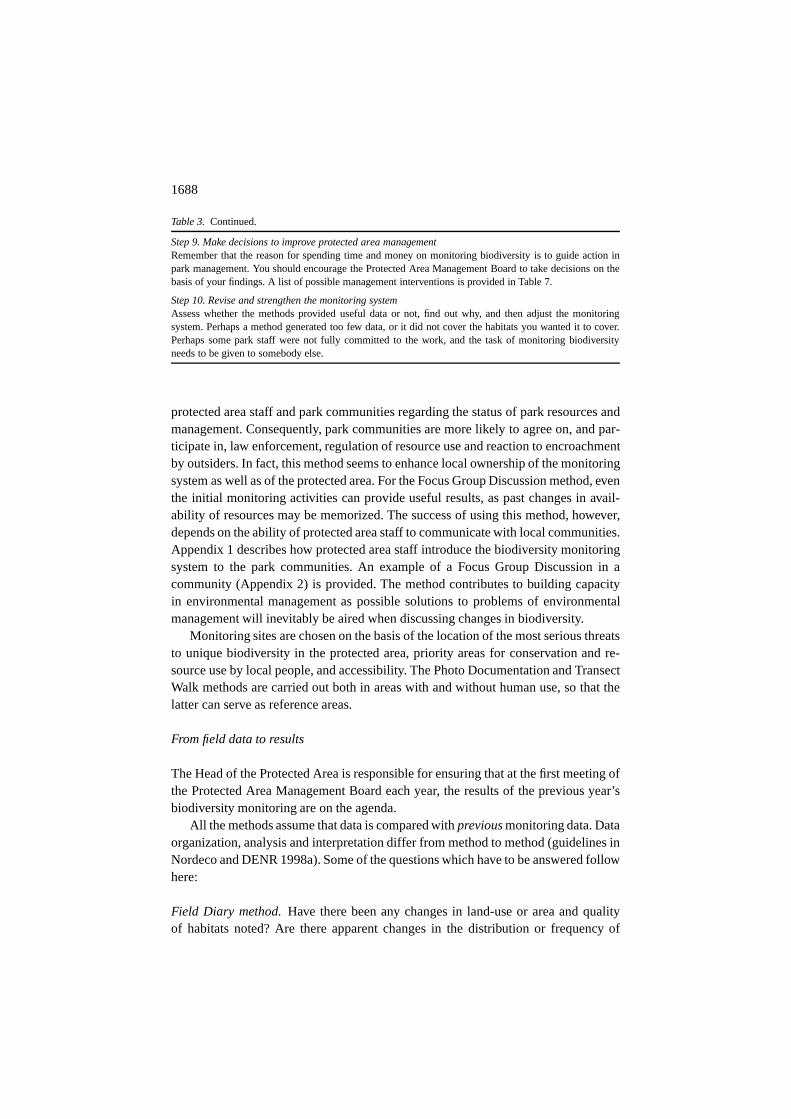
Table 3. Continued.
Step 9. Make decisions to improve protected area managementRemember that the reason for spending time and money on monitoring biodiversity is to guide action inpark management. You should encourage the Protected Area Management Board to take decisions on thebasis of your findings. A list of possible management interventions is provided in Table 7.
Step 10. Revise and strengthen the monitoring systemAssess whether the methods provided useful data or not, find out why, and then adjust the monitoringsystem. Perhaps a method generated too few data, or it did not cover the habitats you wanted it to cover.Perhaps some park staff were not fully committed to the work, and the task of monitoring biodiversityneeds to be given to somebody else.
protected area staff and park communities regarding the status of park resources andmanagement. Consequently, park communities are more likely to agree on, and par-ticipate in, law enforcement, regulation of resource use and reaction to encroachmentby outsiders. In fact, this method seems to enhance local ownership of the monitoringsystem as well as of the protected area. For the Focus Group Discussion method, eventhe initial monitoring activities can provide useful results, as past changes in avail-ability of resources may be memorized. The success of using this method, however,depends on the ability of protected area staff to communicate with local communities.Appendix 1 describes how protected area staff introduce the biodiversity monitoringsystem to the park communities. An example of a Focus Group Discussion in acommunity (Appendix 2) is provided. The method contributes to building capacityin environmental management as possible solutions to problems of environmentalmanagement will inevitably be aired when discussing changes in biodiversity.
Monitoring sites are chosen on the basis of the location of the most serious threatsto unique biodiversity in the protected area, priority areas for conservation and re-source use by local people, and accessibility. The Photo Documentation and TransectWalk methods are carried out both in areas with and without human use, so that thelatter can serve as reference areas.
From field data to results
The Head of the Protected Area is responsible for ensuring that at the first meeting ofthe Protected Area Management Board each year, the results of the previous year’sbiodiversity monitoring are on the agenda.
All the methods assume that data is compared withpreviousmonitoring data. Dataorganization, analysis and interpretation differ from method to method (guidelines inNordeco and DENR 1998a). Some of the questions which have to be answered followhere:
Field Diary method.Have there been any changes in land-use or area and qualityof habitats noted? Are there apparent changes in the distribution or frequency of
1689
species or signs of resource uses? Have there been major changes in the numbersor distribution of records of target species or resource uses (the selected species anduses which should always be noted)?
Photo Documentation method.Do the photographs show any change in land-use orvegetation when compared with older photographs of the same area?
Transect Walk method.Does the data indicate any change in species abundance orresource use?
Focus Group Discussion method.Do the local communities experience any changesin the environmental benefits, the amount of a resource harvested, the time it takesto harvest a desired quantity of some resource, the equipment used, or the number ofpeople involved in harvesting a resource?
It is important to assess whether the data is sufficiently extensive in order to ensurethat an apparent change is not merely caused by chance. What appear to be largechanges will often happen by chance when data sets are very small. For the TransectWalk method, simple statistical tests can be used to obtain an indication of the like-lihood of changes in frequency of records reflecting real changes. Results from allmethods may be biased by changes in weather, seasons or other natural backgroundconditions. Other potential bias includes: changes in patrol routines or intensity ofpatrolling (Field Diary method); timing of the transect walks, the ability of the observ-ers to detect wildlife species and resource uses (Transect Walk method) and changesin the composition of the Community Monitoring Group (Focus Group Discussionmethod). Interpretation should consider improvements of accuracy or efficiency fromthe first study period. Interpretation may also be complicated by spatial and tem-poral variations in biodiversity, which may be unrelated to the management of thearea. In the Philippines there is currently very limited knowledge of these naturalvariations.
From results to management responses
The most challenging part of the biodiversity monitoring system is to move fromresults to identifying appropriate management responses. It is relatively easy to detecta change but much more difficult to find a cause (e.g. Wilson 1994). Since significantchange in the biodiversity of a park is often related to the human use of the area, oneneeds to know what the likely impacts of different human activities are in order toidentify the reason for the change. This will often be a matter of understanding wheth-er change is caused by direct use of the species in question or by habitat modificationwhich may affect whole communities.
In the Philippines, human activities which involve serious destruction of natu-ral habitats include: logging using bulldozers and trucks, carabao (buffalo) logging,
1690
swiddening, agricultural development, industrial development, mining and road con-struction. Human activities which normally involve only minimal destruction of thenatural habitats but which may affect single species are: hunting, fishing and shell-fish gathering and gathering of non-timber forest and wetland products. Whilst thelatter four activities usually have limited impact on the natural ecosystems, there areexceptions in cases such as fishing using dynamite, poison or electricity. A summaryof the common impacts of human activities in, or adjacent to, Philippine parks is pro-vided in Tables 4 and 5. A special case is camping and hiking, which can sometimescause severe disturbance (when it is targeted towards sensitive species or ecosystemssuch as coral reefs), but which usually has only very limited impact (although it mayoccasionally lead to the desecration of the sacred places of indigenous communities).
Identifying the appropriateness of any management response involves examin-ing the typical causes of destructive human activities in Philippine protected areas(Table 6) and possible management responses (Table 7). For instance, indicationsof over-harvesting will require discussions with the villagers at a community meet-ing. Observations indicating rapid and serious decline in biodiversity (such as bigtree stumps indicating large-scale logging) may need the immediate attention of theHead of the Protected Area. It is important to avoid hasty conclusions but also to beaware that the interest in participating in monitoring can easily be jeopardised if nomanagement decisions are forthcoming on the basis of the monitoring system.
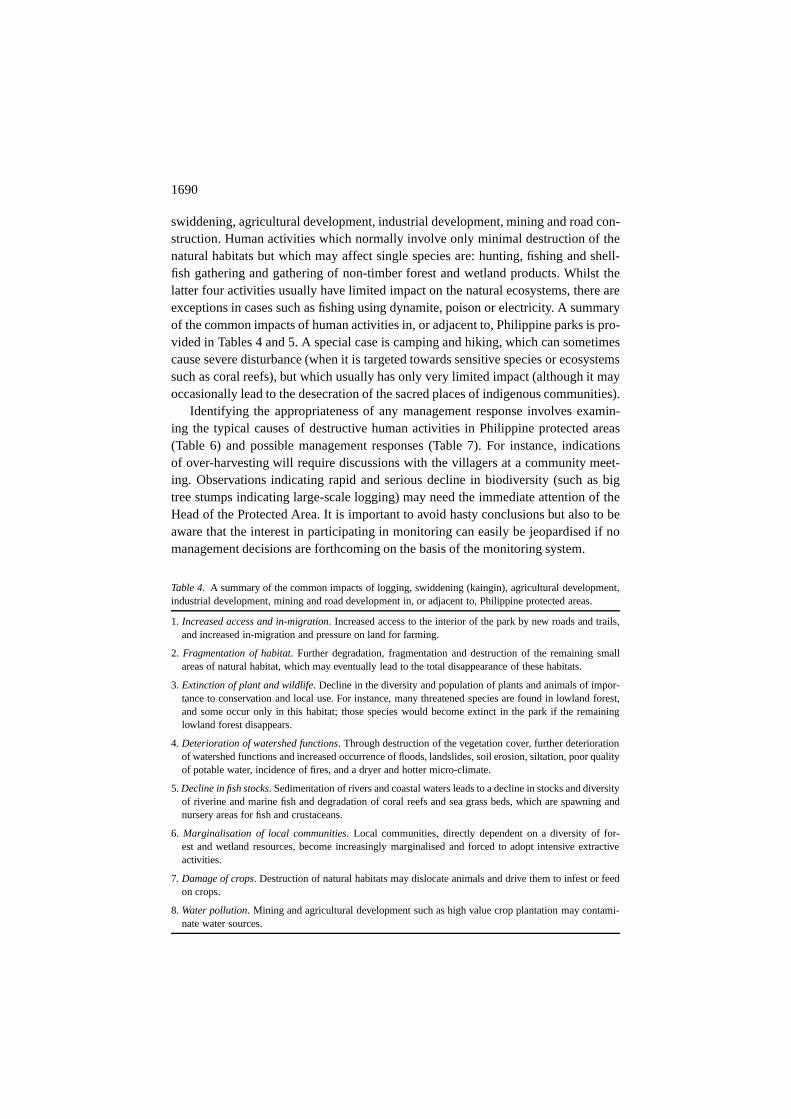
Table 4. A summary of the common impacts of logging, swiddening (kaingin), agricultural development,industrial development, mining and road development in, or adjacent to, Philippine protected areas.
1. Increased access and in-migration. Increased access to the interior of the park by new roads and trails,and increased in-migration and pressure on land for farming.
2. Fragmentation of habitat. Further degradation, fragmentation and destruction of the remaining smallareas of natural habitat, which may eventually lead to the total disappearance of these habitats.
3. Extinction of plant and wildlife. Decline in the diversity and population of plants and animals of impor-tance to conservation and local use. For instance, many threatened species are found in lowland forest,and some occur only in this habitat; those species would become extinct in the park if the remaininglowland forest disappears.
4. Deterioration of watershed functions. Through destruction of the vegetation cover, further deteriorationof watershed functions and increased occurrence of floods, landslides, soil erosion, siltation, poor qualityof potable water, incidence of fires, and a dryer and hotter micro-climate.
5.Decline in fish stocks. Sedimentation of rivers and coastal waters leads to a decline in stocks and diversityof riverine and marine fish and degradation of coral reefs and sea grass beds, which are spawning andnursery areas for fish and crustaceans.
6. Marginalisation of local communities. Local communities, directly dependent on a diversity of for-est and wetland resources, become increasingly marginalised and forced to adopt intensive extractiveactivities.
7. Damage of crops. Destruction of natural habitats may dislocate animals and drive them to infest or feedon crops.
8. Water pollution. Mining and agricultural development such as high value crop plantation may contami-nate water sources.
1691
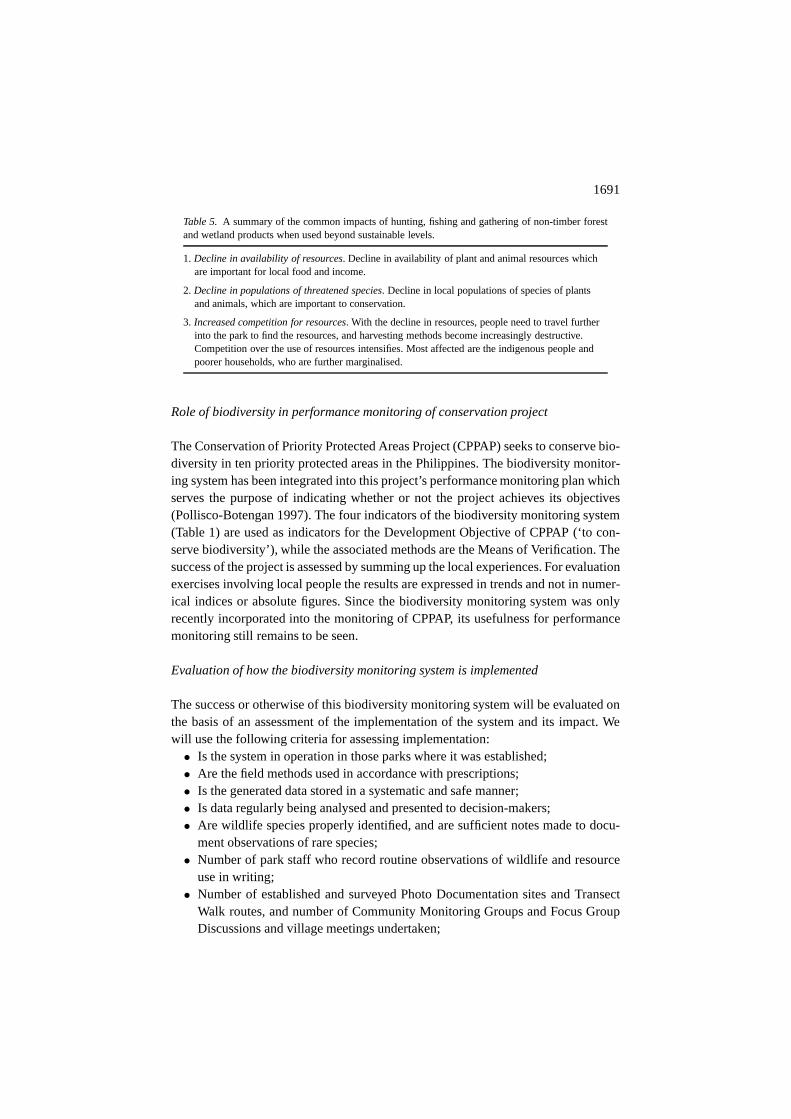
Table 5. A summary of the common impacts of hunting, fishing and gathering of non-timber forestand wetland products when used beyond sustainable levels.
1. Decline in availability of resources. Decline in availability of plant and animal resources whichare important for local food and income.
2. Decline in populations of threatened species. Decline in local populations of species of plantsand animals, which are important to conservation.
3. Increased competition for resources. With the decline in resources, people need to travel furtherinto the park to find the resources, and harvesting methods become increasingly destructive.Competition over the use of resources intensifies. Most affected are the indigenous people andpoorer households, who are further marginalised.
Role of biodiversity in performance monitoring of conservation project
The Conservation of Priority Protected Areas Project (CPPAP) seeks to conserve bio-diversity in ten priority protected areas in the Philippines. The biodiversity monitor-ing system has been integrated into this project’s performance monitoring plan whichserves the purpose of indicating whether or not the project achieves its objectives(Pollisco-Botengan 1997). The four indicators of the biodiversity monitoring system(Table 1) are used as indicators for the Development Objective of CPPAP (‘to con-serve biodiversity’), while the associated methods are the Means of Verification. Thesuccess of the project is assessed by summing up the local experiences. For evaluationexercises involving local people the results are expressed in trends and not in numer-ical indices or absolute figures. Since the biodiversity monitoring system was onlyrecently incorporated into the monitoring of CPPAP, its usefulness for performancemonitoring still remains to be seen.
Evaluation of how the biodiversity monitoring system is implemented
The success or otherwise of this biodiversity monitoring system will be evaluated onthe basis of an assessment of the implementation of the system and its impact. Wewill use the following criteria for assessing implementation:• Is the system in operation in those parks where it was established;• Are the field methods used in accordance with prescriptions;• Is the generated data stored in a systematic and safe manner;• Is data regularly being analysed and presented to decision-makers;• Are wildlife species properly identified, and are sufficient notes made to docu-
ment observations of rare species;• Number of park staff who record routine observations of wildlife and resource
use in writing;• Number of established and surveyed Photo Documentation sites and Transect
Walk routes, and number of Community Monitoring Groups and Focus GroupDiscussions and village meetings undertaken;
1692
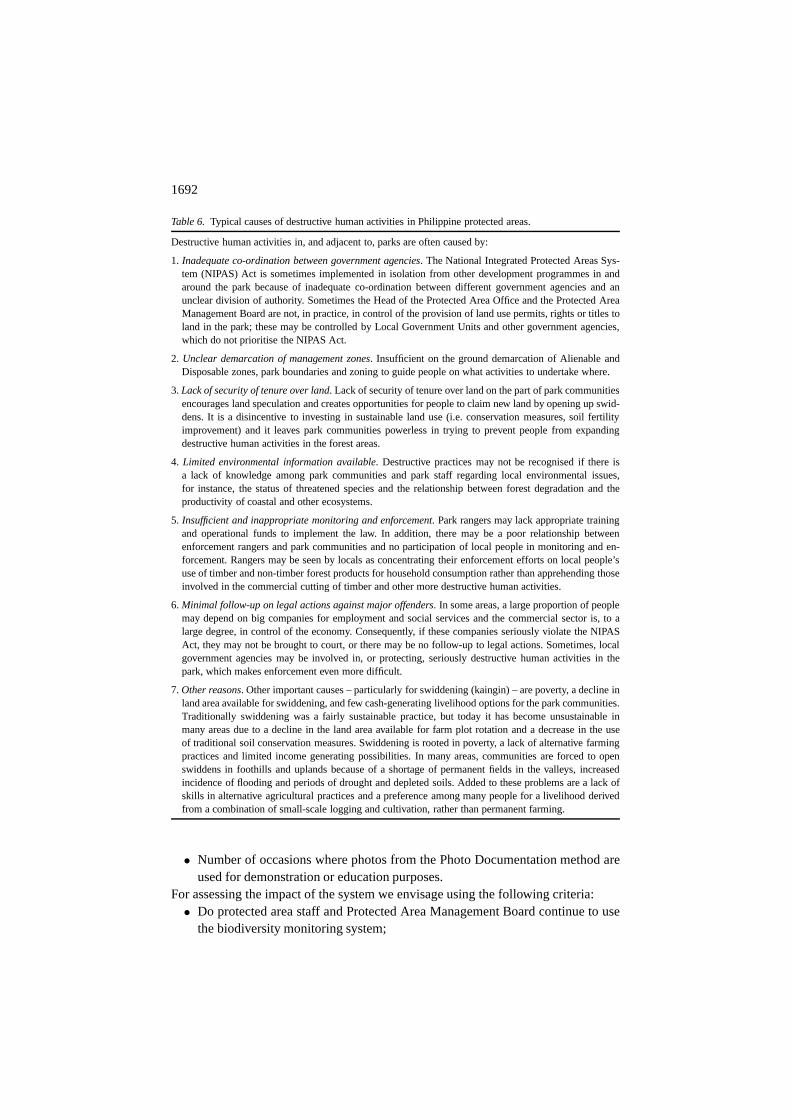
Table 6. Typical causes of destructive human activities in Philippine protected areas.
Destructive human activities in, and adjacent to, parks are often caused by:
1. Inadequate co-ordination between government agencies. The National Integrated Protected Areas Sys-tem (NIPAS) Act is sometimes implemented in isolation from other development programmes in andaround the park because of inadequate co-ordination between different government agencies and anunclear division of authority. Sometimes the Head of the Protected Area Office and the Protected AreaManagement Board are not, in practice, in control of the provision of land use permits, rights or titles toland in the park; these may be controlled by Local Government Units and other government agencies,which do not prioritise the NIPAS Act.
2. Unclear demarcation of management zones. Insufficient on the ground demarcation of Alienable andDisposable zones, park boundaries and zoning to guide people on what activities to undertake where.
3.Lack of security of tenure over land. Lack of security of tenure over land on the part of park communitiesencourages land speculation and creates opportunities for people to claim new land by opening up swid-dens. It is a disincentive to investing in sustainable land use (i.e. conservation measures, soil fertilityimprovement) and it leaves park communities powerless in trying to prevent people from expandingdestructive human activities in the forest areas.
4. Limited environmental information available. Destructive practices may not be recognised if there isa lack of knowledge among park communities and park staff regarding local environmental issues,for instance, the status of threatened species and the relationship between forest degradation and theproductivity of coastal and other ecosystems.
5. Insufficient and inappropriate monitoring and enforcement. Park rangers may lack appropriate trainingand operational funds to implement the law. In addition, there may be a poor relationship betweenenforcement rangers and park communities and no participation of local people in monitoring and en-forcement. Rangers may be seen by locals as concentrating their enforcement efforts on local people’suse of timber and non-timber forest products for household consumption rather than apprehending thoseinvolved in the commercial cutting of timber and other more destructive human activities.
6. Minimal follow-up on legal actions against major offenders. In some areas, a large proportion of peoplemay depend on big companies for employment and social services and the commercial sector is, to alarge degree, in control of the economy. Consequently, if these companies seriously violate the NIPASAct, they may not be brought to court, or there may be no follow-up to legal actions. Sometimes, localgovernment agencies may be involved in, or protecting, seriously destructive human activities in thepark, which makes enforcement even more difficult.
7. Other reasons. Other important causes – particularly for swiddening (kaingin) – are poverty, a decline inland area available for swiddening, and few cash-generating livelihood options for the park communities.Traditionally swiddening was a fairly sustainable practice, but today it has become unsustainable inmany areas due to a decline in the land area available for farm plot rotation and a decrease in the useof traditional soil conservation measures. Swiddening is rooted in poverty, a lack of alternative farmingpractices and limited income generating possibilities. In many areas, communities are forced to openswiddens in foothills and uplands because of a shortage of permanent fields in the valleys, increasedincidence of flooding and periods of drought and depleted soils. Added to these problems are a lack ofskills in alternative agricultural practices and a preference among many people for a livelihood derivedfrom a combination of small-scale logging and cultivation, rather than permanent farming.
• Number of occasions where photos from the Photo Documentation method areused for demonstration or education purposes.
For assessing the impact of the system we envisage using the following criteria:• Do protected area staff and Protected Area Management Board continue to use
the biodiversity monitoring system;
1693
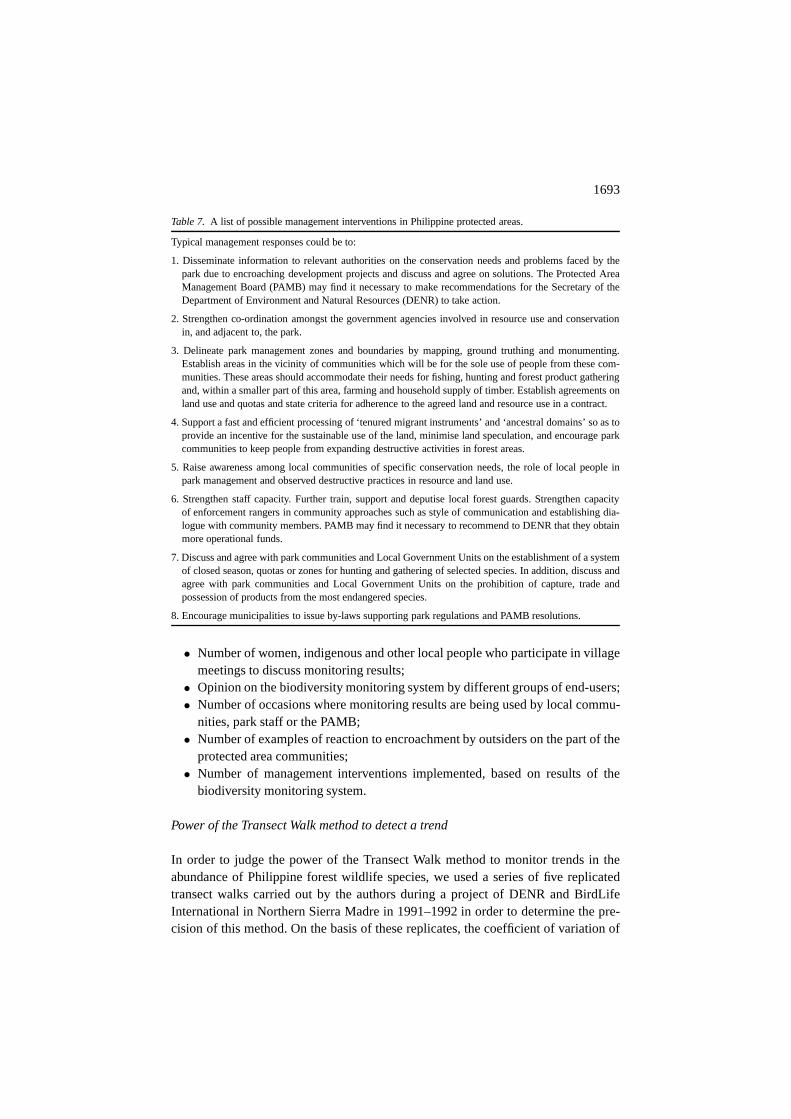
Table 7. A list of possible management interventions in Philippine protected areas.
Typical management responses could be to:
1. Disseminate information to relevant authorities on the conservation needs and problems faced by thepark due to encroaching development projects and discuss and agree on solutions. The Protected AreaManagement Board (PAMB) may find it necessary to make recommendations for the Secretary of theDepartment of Environment and Natural Resources (DENR) to take action.
2. Strengthen co-ordination amongst the government agencies involved in resource use and conservationin, and adjacent to, the park.
3. Delineate park management zones and boundaries by mapping, ground truthing and monumenting.Establish areas in the vicinity of communities which will be for the sole use of people from these com-munities. These areas should accommodate their needs for fishing, hunting and forest product gatheringand, within a smaller part of this area, farming and household supply of timber. Establish agreements onland use and quotas and state criteria for adherence to the agreed land and resource use in a contract.
4. Support a fast and efficient processing of ‘tenured migrant instruments’ and ‘ancestral domains’ so as toprovide an incentive for the sustainable use of the land, minimise land speculation, and encourage parkcommunities to keep people from expanding destructive activities in forest areas.
5. Raise awareness among local communities of specific conservation needs, the role of local people inpark management and observed destructive practices in resource and land use.
6. Strengthen staff capacity. Further train, support and deputise local forest guards. Strengthen capacityof enforcement rangers in community approaches such as style of communication and establishing dia-logue with community members. PAMB may find it necessary to recommend to DENR that they obtainmore operational funds.
7. Discuss and agree with park communities and Local Government Units on the establishment of a systemof closed season, quotas or zones for hunting and gathering of selected species. In addition, discuss andagree with park communities and Local Government Units on the prohibition of capture, trade andpossession of products from the most endangered species.
8. Encourage municipalities to issue by-laws supporting park regulations and PAMB resolutions.
• Number of women, indigenous and other local people who participate in villagemeetings to discuss monitoring results;• Opinion on the biodiversity monitoring system by different groups of end-users;• Number of occasions where monitoring results are being used by local commu-
nities, park staff or the PAMB;• Number of examples of reaction to encroachment by outsiders on the part of the
protected area communities;• Number of management interventions implemented, based on results of the
biodiversity monitoring system.
Power of the Transect Walk method to detect a trend
In order to judge the power of the Transect Walk method to monitor trends in theabundance of Philippine forest wildlife species, we used a series of five replicatedtransect walks carried out by the authors during a project of DENR and BirdLifeInternational in Northern Sierra Madre in 1991–1992 in order to determine the pre-cision of this method. On the basis of these replicates, the coefficient of variation of
1694
a single census of, e.g., Red JunglefowlGallus galluswas estimated to be 0.55. Weused the program TRENDS developed by Gerrodette (1987, 1991) and assumed thatpopulation change is linear, that the coefficient of variation is inversely proportionalto the square root of the abundance, and that the distribution was standard normal(z). We assumed that data will be analysed at theα = 0.05 significance level (two-tailed). With four censuses made each year, the probability of detecting a 20% peryear change in abundance after three years is 0.15, while after seven years the prob-ability is 0.81. In other words one should not be overly optimistic: for the TransectWalk method to be able to detect a trend with a statistically acceptable degree ofconfidence a long period is needed.
Constraints
By 1999, the biodiversity monitoring system had been established, tested and revisedin the three protected areas and was in almost full operation. The main constrainthas been insufficient institutional support for implementing the system. Biodiversi-ty monitoring is a new activity, which until 1999 did not figure in the annual workplans of DENR. It is not included in the job description of the park staff and onlyfrom 1999 will there be government funds available for transport and other costs.Another constraint has been the limited management skills of some park staff. Somestaff have difficulty in organizing themselves before going to the field, e.g., ensuringenough food and water, and in arranging that field data are copied, filed and storedproperly.
Discussion
Necessary further development of the Philippine monitoring system
The DENR of the Philippine Government would like to expand the biodiversity mon-itoring system to 184 protected areas (DENR 1998). We have suggested that it be firstestablished and further tested and refined in a small number of sites so that revisionsneeded in the approach, methodology and in the list of species and resource usesfor monitoring can be identified (see e.g. Simberloff 1998). We have proposed thefollowing criteria for selection of further sites:1. their combined coverage of Philippine flora and fauna,2. the interest of protected area communities in cooperating with government staff
on resource management,3. legislative status and field personnel available (sites should have protected area
status and staff),4. coverage of the administrative regions of DENR, and5. the law and order situation.
1695
There is a need for a national policy on biodiversity monitoring and a directive tothe regional and provincial offices of DENR. In each protected area, biodiversitymonitoring should be incorporated into annual work and financial plans, equipmentshould be purchased if not already available, and biodiversity monitoring should be-come part of the job description and performance evaluation of park staff. We suggestthat specific staff from the Protected Area and Wildlife Bureau of DENR be givenresponsibility for overseeing the implementation and supervision of the biodiversitymonitoring system. Staff from each protected area and some members of the localNGOs and communities should be trained in the monitoring system, and the systemshould be installed on the sites. National and regional staff of PAWB-DENR shouldbe trained in supervising its installation and implementation. Biodiversity monitoringtraining should be fully accredited by DENR and integrated into their existing trainingsystems. In addition, field guides for the identification of priority species and resourceuses in other parts of the Philippines need to be developed. Partnership between parkstaff and universities should be promoted. Park staff and local academics should beencouraged to present results of monitoring in national meetings, in conference pro-ceedings, newsletters, scientific journals and local and national newspapers in orderto stimulate discussions and increase awareness on biodiversity conservation and theimportance of biodiversity monitoring. PAWB should regularly prepare a nationalsynthesis report for decision-makers and the broader public on the results of the mon-itoring in order to provide an overview of the knowledge of trends in biodiversity andresource use.
It was unfortunately not possible for us to conduct methodological studies to doc-ument to what extent the parameters collected reflect changes recorded by more stan-dardized methods. In the Natural Parks of Northern Sierra Madre and Mt. KitangladRange however universities are currently establishing permanent vegetation plots,which we hope on long term can be used for comparison.
Minimum starting point
For forest biodiversity monitoring programs to be able to provide unequivocal an-swers, Margules et al. (1998) identified a number of important elements:1. controls in areas with no human activity,2. replication in sampling to account for spatial heterogeneity and random variation,3. knowledge of conditions before human activity began,4. environmental stratification to capture the habitat preferences of specialized spe-
cies and facilitate analyses of the responses of less abundant species,5. a sufficient period of monitoring to establish human use effects and distinguish
them from climatic fluctuations or other episodic events, and6. replication at more than one location to avoid location-specific phenomena.
In the Philippine monitoring system, controls in unused or largely unused areas (1)are made for the Photo Documentation and Transect Walk method where undisturbed
1696
forest areas are easily accessible. Replication of sampling (2) is undertaken in thePhoto Documentation, Transect Walk and Focus Group Discussion methods, as thesemethods are applied on several sites in each protected area. The monitoring systemdoes not establish knowledge of pre-human use conditions (3), since this would belogistically very difficult and human use of Philippine protected areas cannot be reg-ulated as in an experiment. Environmental stratification (4) is made for the TransectWalk method where data is compiled on the location of vegetation types and recordsof species and resource uses along the transect. The monitoring system is expectedto continue for a long period (5), and the monitoring system is replicated in severalprotected areas (6).
In the Philippine system, we have not included all those elements that are desirablefor monitoring programs but we have shown what monitoring can be undertaken inpractice by protected area staff and local communities. Many recent attempts to es-tablish biodiversity monitoring systems in developing countries have run into serioustrouble because the systems were too large and complicated. For instance, in theTarangire National Park, Tanzania, the University of Milan assisted the governmentby monitoring wildlife migration routes using radio-telemetry and ‘GIS’. Funds, how-ever, ran out rendering the high technology useless. The project is now simplifyingall monitoring routines so that they can be sustained with minimal funds and a smallnumber of government staff (V. Galanti, pers. com.).
The Philippine biodiversity monitoring system was developed bearing the typicalproblems of developing countries in mind, including those relating to high numbersof species, incomplete taxonomic knowledge, few economic resources and large totalsize of protected areas. We consider this monitoring system as a feasible minimumstarting point, which can evolve further over time as more resources and skilled peo-ple become available to manage and monitor biodiversity. As long as the proceduresof the four methods are continued on the same sites (and by the same persons, espe-cially for the Transect Walk method) development of the system does not significantlyviolate the assumption for monitoring that quality and reliability of data samplingremain unchanged. Further development of the system may include adding meth-ods and storage and analysis of biodiversity data on computer. Studies of the habitatrequirement and ecology for the target species will increase their value as indica-tors for biodiversity. The records from transect walks can be related to populationdensity if estimates are made of the perpendicular distance from the trail to eachrecord to correct for visibility bias. This need only be done until the relationshipbetween frequency of records and population density is understood. Data compiled ona geographical basis (with latitude and longitude) can be entered into a computerised‘GIS’-database, if and when this is appropriate. We anticipate the current methodsbeing backed up by remote sensing of land-use and vegetation on a regular basis, aswell as by in-depth monitoring of selected habitats, species and sites.
1697
Participation of local communities in biodiversity monitoring
Until the late 1980s it was a maxim of practical conservation in developing countriesthat biodiversity was best conserved by establishing strict protected areas. This result-ed in many conflicts with local communities who depended on the natural resourcesof the areas. It was morally impermissible in many places, and it was costly anddifficult (or impossible) to enforce regulations. The real threats to biodiversity oftencome from organised elites or other non-local residents, and long established localpeople frequently have strong interests in conserving their resource base.
By the beginning of the 1990s, many policy and decision-makers therefore aban-doned this ‘fines and fences’ approach in protected area management and insteadattempted to provide positive incentives through alternative income-generating strat-egies aimed at reducing dependence on natural resource use. However, in most devel-oping countries, at least in Africa (Brown 1998) and South East Asia (e.g., Daniel-sen and Enghoff 1999), this approach has also generally proved ineffective. Instead,the way forward in protected areas with long established local communities prob-ably lies in the consolidation of existing livelihoods in the protected areas throughstrengthening non-destructive natural resource management systems and supportingpartial exclusion of non-traditional resource users and users of external origin. Thebiodiversity monitoring system plays a role in reinforcing this strategy in Philippineprotected areas.
The communities expected to participate in the Philippine monitoring system arethe indigenous people and migrants who live in and adjacent to the protected areas.These people take decisions on resource management every day in the field, often faraway from park staff, municipal officials and others at higher levels. These decisionsare imperative for the future of the protected areas and should inform higher leveldecision-making.
These people are expected to provide information on resource use and wildlife tothe protected area staff (Field Diary method) and take part in discussions of photos ofhabitats and land-uses (Photo Documentation method). In addition, they are supposedto collect biodiversity relevant information, present and discuss this with other localpeople and park staff and agree on and take part in law enforcement and regulation ofresource use (Focus Group Discussion method).
As of 1999, the role of local communities in monitoring has, however, been lim-ited largely to collecting information and taking part in discussions with park staff.The ability of the Focus Group Discussion method to encourage shared managementof the parks’ resources with local communities has only partly begun to be utilized.There are several reasons, which we try to address in the revised training courses.
It is relative easy and straight forward to take photos or walk transects. One merelyneeds to follow the ‘recipe’ (and be able to identify species on the transect). Facili-tating Focus Group Discussions for the purpose of monitoring biodiversity requiresreflection and an independent way of thinking on the part of the park staff if they are
1698
to be able to respond in a constructive manner to what the members of the CommunityMonitoring Groups say.
Training is also difficult. You can walk a transect twice to become better at it butyou cannot repeat community meetings. A community meeting requires a lot of timefor many people. During training it rarely was possible to conduct a community meet-ing because people had limited time in settlements within reach of the training venue.In addition, it was difficult to find Philippine socio-economists with the appropriateexperience and ability to conduct such training.
Most park staff had minimal previous exposure to socio-cultural issues, to partici-patory methods and to entering into dialogue with local communities, in part becausemany had as the point of departure of their career the ‘fines and fences’ approach.Park staff used to see local people as potential offenders of the park regulations. Somemight have been reluctant to hand over control of resources to local people. It has beendifficult for park staff to understand and accept the basic strategy for this method ofsharing insight and knowledge with ‘normal’ community members and of acceptingthe subjective statements of community members as being of value to monitoring.Staff are used to dealing with outspoken and influential people in the communities.They sometimes have difficulty in communicating effectively with the lower levelstakeholders such as indigenous negritos (Agtas) and others who depend most directlyon the use of minor forest and wetland products. It does not help that many park staffhave witnessed earlier externally-funded projects, which formally emphasized theassignment of active key roles to local stakeholders but in reality limited the role of‘the beneficiaries’ to the subjects of consultation and passive reception of trainingand inputs. In addition, Focus Group Discussions are very time-consuming in theshort run. With the time constraints of the park administrations, low priority wassometimes given to this method.
Potential for application in other countries
The potential for using the present approach to biodiversity monitoring in other coun-tries depends on the government’s strategy for park management, the importance offorest and wetland resources to the rural people and the availability of human capacityand financial resources for protected areas. The system is particularly useful when agovernment is embarking on a policy of shared management of park resources withlocal communities, when a large proportion of the rural population depends on forestand wetland products (and where they have a long history of settlement and attach-ment to the areas) and when there is limited available human capacity and funds forprotected areas.
Most protected areas in developing countries fall within this category. In thesecases, the approach of the Philippine monitoring system may be readily applicable,but the management objectives of the protected areas may differ. In addition, therewill be different species and resource uses, different destructive human activities and
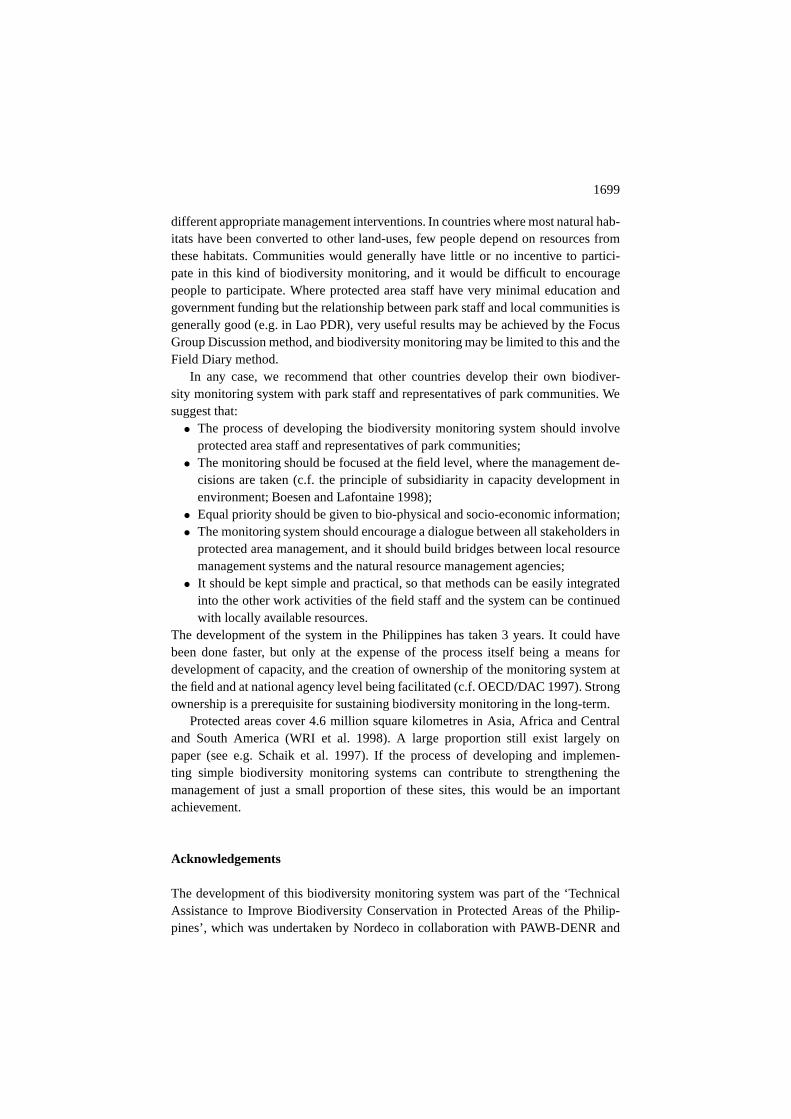
1699
different appropriate management interventions. In countries where most natural hab-itats have been converted to other land-uses, few people depend on resources fromthese habitats. Communities would generally have little or no incentive to partici-pate in this kind of biodiversity monitoring, and it would be difficult to encouragepeople to participate. Where protected area staff have very minimal education andgovernment funding but the relationship between park staff and local communities isgenerally good (e.g. in Lao PDR), very useful results may be achieved by the FocusGroup Discussion method, and biodiversity monitoring may be limited to this and theField Diary method.
In any case, we recommend that other countries develop their own biodiver-sity monitoring system with park staff and representatives of park communities. Wesuggest that:• The process of developing the biodiversity monitoring system should involve
protected area staff and representatives of park communities;• The monitoring should be focused at the field level, where the management de-
cisions are taken (c.f. the principle of subsidiarity in capacity development inenvironment; Boesen and Lafontaine 1998);• Equal priority should be given to bio-physical and socio-economic information;• The monitoring system should encourage a dialogue between all stakeholders in
protected area management, and it should build bridges between local resourcemanagement systems and the natural resource management agencies;• It should be kept simple and practical, so that methods can be easily integrated
into the other work activities of the field staff and the system can be continuedwith locally available resources.
The development of the system in the Philippines has taken 3 years. It could havebeen done faster, but only at the expense of the process itself being a means fordevelopment of capacity, and the creation of ownership of the monitoring system atthe field and at national agency level being facilitated (c.f. OECD/DAC 1997). Strongownership is a prerequisite for sustaining biodiversity monitoring in the long-term.
Protected areas cover 4.6 million square kilometres in Asia, Africa and Centraland South America (WRI et al. 1998). A large proportion still exist largely onpaper (see e.g. Schaik et al. 1997). If the process of developing and implemen-ting simple biodiversity monitoring systems can contribute to strengthening themanagement of just a small proportion of these sites, this would be an importantachievement.
Acknowledgements
The development of this biodiversity monitoring system was part of the ‘TechnicalAssistance to Improve Biodiversity Conservation in Protected Areas of the Philip-pines’, which was undertaken by Nordeco in collaboration with PAWB-DENR and
1700
NIPA, Inc. The project was funded by the Ministry of Foreign Affairs of the Govern-ment of Denmark, and managed by S. Shen of the World Bank (Grant No. TF020792).We are grateful to the protected area staff and the local communities in Mt. KitangladRange Natural Park, Bataan Natural Park, and Northern Sierra Madre Natural Parkfor participating in discussions and field testing of the system. We also thank thefollowing who assisted with the system development: R. Altamirano, P. Alviola,M.A. Barcelona-Leones, E. Batangan, J. David, A. Diesmos, R. Fernandez, R.T.Fragata, G. Gee, M. Heegaard, A. Manamtam, F.S. Mirasol, S.S. Nielsen, E. Paring,E.L. Pimentel, S. Pullarca, M.F. de los Reyes and R.J. Schoen. Comments werereceived from H. Acquay, M. Agayatin, A. Andres, W. Balilia, R.C. Bayabos,E. Bonilla, L. Calanog, P. Calimag, I. Castillo, N. Corpuz, C. Custodio, G. Garcia,M. Hawkes, M. Hidalgo, A. Khan, T.M. Lim, N. Lita, A. Manila, M. Mendoza,A. Meniado, G. Morgan, P.d.v. Moss, N. Moulinyawe, V. Palaganas, H.B. Pedersen,R. Pine, W.S. Pollisco, M.A. Pollisco-Botengan, J.F. Rasmussen, P. de los Reyes,G. Roscel, A. Tagtag and C. Ulep. The language was corrected by E.D. Bolton. We aregrateful to R. Altamirano, J. Fjeldså, L.L. Sørensen and T. Whitten for their commentson drafts of this paper.
Appendix 1. How protected area staff introduce the biodiversity monitoring system to the parkcommunities.
Park communities may be interested to participate in biodiversity monitoring if the park staff can gen-erate trust and establish reliable two-way communication with them. Below we describe how park staffintroduce themselves and the biodiversity monitoring system to the local communities.
1. Introduce yourself(name, job, where you come from).
2. Explain how the park has been established and what will happen in the future.The Philippine government decided in (year) that the area you are living in and the area within (nameof geographical features) shall be an area in which the use of the natural resources shall not destroythe resources in the long term, and where conservation is very important. This area is called (name). I,together with other park staff in the area, have been given the responsibility of working with you for thebest conservation and use of the area. It is the policy of the government that collaboration between youand us, both expressed by park staff working directly with you and by the working of the Protected AreaManagement Board as representing your interests, is the best way to make sure that the park remains withgood forest cover/water quality/wetland resources and with many different animals and plants when yourchildren and their children grow up.
3. Describe the reason for establishment of the park.The park was established because it is one of the few remaining areas in the country with good forest/wet-lands which are important for providing a clean and stable supply of water, and because it is home toanimals and plants that have been wiped out in most other places in the country and in the world (name afew). The area is also providing many benefits such as fish, animals and forest products to many peoplein the area. The government wants to ensure that this unique area is not disappearing and is for the benefitof both you and people in the country as a whole.
1701
Appendix 1. Continued.
4. Explain how the park staff will work with villagers.We will be able to work with you in order to assist you in seeking ways:• of using the wild plants and animals in your area in such a manner that they are not disappearing,• of better protecting the forest from destruction,• of improving protection of those wild animals and plants that are getting very rare such as (name a
few),• of improving the methods for farming, use of forest/wetlands, hunting and fishing in such a way that
they are not destroying the forest and wetlands,• of securing your rights to use the land, water, forest products and wild animals in your area within
certain limits and in a way that is approved by the Protected Area Management Board and LocalGovernment Units.
We are able to do this by visiting your village frequently to discuss, maybe advise and hopefully assistyou during the coming year and perhaps longer.
5. Explain the objectives and activities of the biodiversity monitoring system.I have come to your village today because we would like to know if you will work with us to observechanges in the numbers of wild plants and animals and in the use of the forests and/or wetlands for thebest conservation and use of the area. If you are interested, we would like to find 10–15 local people whoare willing to collect data on wild plants, animals and resource use, and who will spend two hours withme every quarter so that I can listen to, and we can discuss, their observations. It is best if those people areinvolved with community work within natural resource management (forest guards, community forestrycommittee members, etc.) or villagers otherwise interested in the use of forest/wetland resources. Wewould like the most experienced indigenous healer and all-round hunter/forest product gatherer to bemembers of this group (explain possible issues you would like them to look for but say that they mighthave better suggestions). Every year or so we would also like to discuss the findings with the whole villageso that we can tell them about your findings and get input and responses from all members of the village.
6. Describe how the park staff will work in other ways.We will also work in other villages, and we will work, both here and in other places, on issues such as:trying to stop commercial hunting and gathering by outsiders, trying to prevent developments that willdestroy the park, co-ordinating with other agencies, preventing large-scale logging, providing informationto park communities and others, etc.
Appendix 2. Description of a Focus Group Discussion in a protected area community.
The discussion took place in a village located partly inside a park and inhabited by both migrants andindigenous people. People in the village practise both swiddening (kaingin) and permanent agriculture.Small-scale logging, fishing, hunting and gathering of non-timber forest products are important activitiesfor part of the population.
The main problems of natural resource management in the village are: decreased access to non-timberforest products, decreased fishing and hunting, logging supported by outside business people, less avail-ability of clean water, occasional flooding, constraints in availability of land for agriculture, unclear rightsto land and resource use inside the park.
The discussion lasted about one hour. Five members of the Community Monitoring Group and two parkstaff participated.
A monitoring group has been established in the village and has, in consultation with park staff, decidedto concentrate on monitoring:• the number of people involved in rattan collection for sale at market and the change in time needed for
people to collect a bundle of good quality rattan;• the change in effort needed for collection of durian from the forest and for collection of orchids from
the montane forest;
1702
Appendix 2. Continued.
• the expansion of hectarage of land under swiddening in a specific upper watershed inside the park;• the change in number of households in the village with land under agriculture inside the park;• the number of new tree stumps above 30 cm in diameter in a specific area of good quality lowland
forest inside the park;• the number of days that water from two specific streams is considered to be undrinkable because it is
not clean enough or because it has dried out;• the number of days/hours needed by selected expert hunters to hunt one wild pig or one deer;• the change in size of fish and shellfish caught in specific streams and wetlands;• any sightings or reports of Philippine Eagle and all sighting of hornbills in the valley behind the village
inside the park.For the above monitoring, the monitoring group in the village depended on information from the other
villagers and on their own collection of data. Two people in the monitoring group noted the data in anotebook.
The discussion started with the park staff reporting back to the group on how the issues they discussedthree months ago have been developing and whether any management actions have been undertaken ordecided by the park or the Protected Area Management Board. The main issue was the protection of theupper watershed of one of the mountains in the park from further clearing for coffee growing and thedecision on a closed season for hunting deer in the park.
The park staff then reported to the group on how the data they discussed last time had been han-dled, whether any common aspects were found with other villages and whether any new trends had beendiscovered or any existing trends reinforced.
The main issues were that data on hunting was too unevenly collected to be reliable and that collectionmust be more continuous by talking to the same hunters at regular intervals. It now seems that improve-ments in the size of fish was quite consistent in the data for the last year. In general in the park this isquite unique and seems to be related to the villagers imposing regulations in the major fishing stream andwetland in their area. In other streams in the park the size is decreasing. The data on quality of water inone of the two streams in the village has now shown a decline as compared to the same time last yearbecause more days with dirty water have been reported; this is consistent with other villages in the park.
It was then discussed as to whether the monitoring group, which now only consisted of six members,was still able to monitor as many different aspects as before. The park staff reported that in other areasthe monitoring groups had decided to collect less data by concentrating on fewer aspects, but the groupfelt that they could still manage.
Following this, thechairmanof thegroup presented the monitoringdata from the last three months. Unlikelast time, when they copied the data from their notebooks to the park staff, they had not had the time on thisoccasion so it was decided that one would sit with the park staff after the meeting in order to copy the data.
The monitoring data follows:• the number of people collecting rattan remains unchanged. One of the collectors reported that during
the last three months she had had to increase her time for collection; others reported no change overthe last three months;
• no durians were collected (not the season);• data on orchid collection was still not easy to obtain, but at least two outsiders have been seen with
orchids and one new businessman has approached the villagers to buy one very special orchid onlyfound in the montane forest;
• the hectarage of land under kaingin remains unchanged, but a number of households in the villageare preparing for clearance of some good quality forest in the watershed, as they have too little landavailable. Discussions with the monitoring group are taking place;
• one new household is now farming inside the park. As a newly married son of one of the families, hehas received part of the cultivated family land. One family from outside the village has been asking forpermission to open up land in the area; status of application not known;
• ten new tree stumps were reported (size ranging from 30 to 85 cm in diameter, with 5 from 30–40 cm,1 of 50 cm, 3 between 60–70 cm, and 1 of 85 cm);
• two days with water too dirty for drinking were reported in one of the streams. In the other stream nodirty water was reported. No floods or drying out of streams were reported;
1703
Appendix 2. Continued.
• hunting data was from one hunter who went on three hunting expeditions during the period, it took himtwo days to get one pig on the first, four days on the second and he did not get any on the third. Heclaims that hunting has become more difficult but that this has been so for many years and there hasbeen no change during the last quarter;
• size of fish and shellfish caught remains unchanged according to people fishing in the village. On twotrips to the river, three people from the monitoring group measured the size of the catch of peoplefishing with nets and hooks and the size of shellfish. The measuring data is in the notebook;
• number of hornbills sighted by members of the group in the valley seem to show that more hornbillsare being found. On two trips to the valley that lasted one day each to collect rattan, one of the groupmembers saw or heard 23 hornbills (15 one day and 8 the next). Other people also report more hornbillsover the last quarter. One person in the village claims that he has seen a Philippine Eagle or at least avery big bird of prey.The monitoring data was then discussed. The data on orchids collected needs to be improved. There
must be more efforts made to ask other villagers what, and how much, they collect. Contact with morehunters should be established on a more regular basis. The data on hornbills should be compared to seeif there is fruiting of specific trees found in the valley as this will attract hornbills and might explain theapparent increase in numbers. The sighting of a Philippine Eagle should be treated with care, as it can befairly difficult to distinguish the Philippine Eagle from other large birds of prey. The most significant datais probably the number of big stumps (above 60 cm in diameter) found in the forest.
Problems of monitoring were then discussed and the group expressed a need for training in monitoringand for having an opportunity to share experiences with other monitoring groups in the park. Moreover,some material support such as pencils, paper, a pair a binoculars and a small per diem for the chairmanof the monitoring group who spends a lot of time on the work, were discussed. The park staff memberagreed to look at the issues with the park management.
Following this, some major management issues were discussed. Specifically, the issue of increasedpressure to open up new agricultural land inside the park and the increased demand for orchids werediscussed. Also, the possibility of extending the fishing regulations imposed by the villagers to the otherstream near the village was discussed. Moreover, the reasons for increased logging of large logs werediscussed and possible mitigating measures were looked at. The meeting ended, and a tentative new datefor the next meeting was agreed upon. The park staff member ended by congratulating the group on thegood work they had been doing.
References
Alder D and Synnott TJ (1992) Permanent sample plot techniques for mixed tropical forest. TropicalForestry Papers 25: 1–124
Bibby CJ, Burgess ND and Hill DA (1992) Bird Census Techniques. Academic Press, LondonBoesen J and Lafontaine A (1998) Indicators and monitoring of capacity development in environment
initiatives. In: Danida and DANCED International Workshop on Danish Assistance to Capacity Devel-opment in Environment, Snekkersten, Denmark 12–14 May 1998, Workshop Proceedings, pp 96–130.Danida and DANCED, Copenhagen
Brown D (1998) Participatory biodiversity conservation rethinking the strategy in the low tourist potentialareas of tropical Africa. ODI Natural Resource Perspectives 33: 1–5
Brown M and Wyckoff-Baird B (1992) Designing Integrated Conservation and Development Projects.Biodiversity Support Program. WWF, Washington, DC
Buckland ST, Anderson DR, Burnham KP and Laake JL (1993) Distance Sampling: Estimating Abundanceof Biological Populations. Chapman and Hall, New York
Burnham KP and Anderson DR (1984) The need for distance data in transect counts. Journal of WildlifeManagement 48: 1248–1254
Coddington JA, Griswold CE, Dávila DS, Peñaranda E and Larcher SF (1991) Designing and testingsampling protocols to estimate biodiversity in tropical ecosystems. In: Dudley EC (ed) The Unity of
1704
Evolutionary Biology: Proceedings of the Fourth International Congress of Systematic and EvolutionaryBiology, pp 44–60. Dioscorides Press, Portland
Dallmeier F and Comiskey JA (eds) (1998) Forest Biodiversity Research, Monitoring and Modeling:Conceptual Background and Old World Case Studies. Parthenon Publishing, Paris
Danielsen F and Enghoff M (1999) Fredet natur – mellem udnyttelse og beskyttelse. Den Ny Verden 32(4):74–81
DENR (1992) National Integrated Protected Area System Act R.A. No. 7586 and Implementing Rules andRegulations DAO 25, Series of 1992. DENR, PAWB, Manila
DENR (1998) Medium Term Development Plan for the Protected Area and Wildlife Sector of DENR1999–2004. DENR, Quezon City, Philippines
DENR and UNEP (1997) Philippine Biodiversity. An Assessment and Action Plan. Bookmark, Inc., Mak-ati City, Philippines
Fuller J (1998) Participatory monitoring of forest resources: current methodologies being developed inThailand. Rural Development Forestry Network 23e: 23–27
Gerrodette T (1987) A power analysis for detecting trends. Ecology 68: 1364–1372Gerrodette T (1991) Models for power of detecting trends – a reply to Link and Hatfield. Ecology 72:
1889–1892Groombridge B (ed) (1992) Global Biodiversity. Status of the Earth’s Living Resources. World Conserva-
tion Monitoring Center. Chapman and Hall, LondonGroombridge B and Jenkins MD (eds) (1996) Assessing Biodiversity Status and Sustainability. WCMC
Biodiversity Series No. 5. World Conservation Press, CambridgeHarmon D (1994) Coordinating Research and Management to Enhance Protected Areas. IUCN, CambridgeHammond A, Adriaanse A, Rodenburg E, Bryant D and Woodward R (1995) Environmental Indicators: A
Systematic Approach to Measuring and Reporting on Environmental Policy Performance in the Contextof Sustainable Development. World Resources Institute, Washington, DC
Hellier A, Newton AC and Gaona SO (1999) Use of indigenous knowledge for rapidly assessing trends inbiodiversity: a case study from Chiapas, Mexico. Biodiversity and Conservation 8: 869–889
IBAMA (1998) International Workshop on Biodiversity Monitoring in Federal Protected Areas: Observa-tions and General Remarks. www.erols.com/dsbaker/
IUCN (1996) 1996 IUCN Red List of Threatened Animals. IUCN, GlandKremen C, Merenlender AM and Murphy DD (1994) Ecological monitoring: a vital need for integrated
conservation and development programs in the tropics. Conservation Biology 8: 388–397Kremen C, Raymond I and Lance K (1998) An interdisciplinary tool for monitoring conservation impacts
in Madagascar. Conservation Biology 12: 549–563Laake JL, Buckland ST, Anderson DR and Burnham KP (1993) Distance User’s Guide, v. 2.0. Colorado
Cooperation of Fish and Wildlife Research Unit, Colorado State University, Fort CollinsMargules CR, Austin MP, Davies KF, Meyers JA and Nicholls AO (1998) The design of programs to moni-
tor forest biodiversity: lessons from the Wog Wog habitat fragmentation experiment. In: Dallmeier F andComiskey JA (eds) Forest Biodiversity Research, Monitoring and Modelling: Conceptual Backgroundand Old World Case Studies, pp 183–196. Parthenon Publishing, Paris
Margoulis R and Salafsky N (1998) Measures of Success: A Systematic Approach to Designing, Managingand Monitoring Community-Oriented Conservation Projects. Adaptive Management Series, Biodiversi-ty Support Program, Washington
Nordeco and DENR (1998a) Biodiversity Monitoring System Manual. DENR, Manila; Nordeco, Copen-hagen
Nordeco and DENR (1998b) Integrating Conservation and Development in Protected Area Managementin Northern Sierra Madre Natural Park, the Philippines. DENR, Manila; Nordeco, Copenhagen
Nordeco and DENR (1998c) Integrating Conservation and Development in Protected Area Managementin Bataan Natural Park, the Philippines. DENR, Manila; Nordeco, Copenhagen
Nordeco and DENR (1998d) Integrating Conservation and Development in Protected Area Managementin Mt. Kitanglad Range Natural Park, the Philippines. DENR, Manila; Nordeco, Copenhagen
Noss RF (1990) Indicators for monitoring biodiversity: a hierarchical approach. Conservation Biology 4:355–364
1705
OECD/DAC (1997) Capacity Development in Environment: Proceedings of a Workshop held in Rome,Italy, 4–6 December, 1996. OECD, Paris
PAWB-DENR (1998) The First Philippine National Report to the Convention on Biological Diversity.PAWB-DENR, Quezon City, Philippines
Pollisco-Botengan MA (1997) CPPAP Monitoring and Evaluation (M&E) Framework. DENR and NIPA,Inc., Manila
Pollisco W, Danielsen F, Nozawa C, Jensen A and Balete D (1997) Proceedings of Workshop on Monitor-ing Biodiversity in Protected Areas of the Philippines. SYLVATROP The Technical Journal of Philip-pine Ecosystems and Natural Resources 7: 101–104
Saberwal VK and Kothari A (1996) The human dimension in conservation biology curricula in developingcountries. Conservation Biology 10: 1328–1331
Schaik CP van, Terborgh T and Dugelby B (1997) The silent crisis: the state of rain forest nature preserves.In: Kramer R, Schaik CP van and Johnson J (eds) Last Stand: Protected Areas & the Defense of TropicalBiodiversity. Oxford University Press, New York
Simberloff D (1998) Flagships, umbrellas, and keystones: is single-species management passé in the land-scape era? Biological Conservation 83: 247–257
Thompson WL, White GC and Gowan C (1998) Monitoring Vertebrate Populations. Academic Press,San Diego
Vora RS (1997) Developing programs to monitor ecosystem health and effectiveness of management prac-tices on Lakes States National Forests, USA. Biological Conservation 80: 289–302
Wangwacharakul V, Claridge G and Mather R (1996) Biodiversity Monitoring and Evaluation in the LaoPDR: Developing a Protected Area Approach. MIDAS Agronomics Co. Ltd., Bangkok
Weber FR (1990) Preliminary Indicators for Monitoring Changes in the Natural Resource Base. A.I.D.Program Design Evaluation Methodology No. 14. USAID, Washington, DC
Wells MP (1998) Institutions and incentives for biodiversity conservation. Biodiversity and Conservation7: 815–835
Wilson JG (1994) The Role of Bio-indicators in Estuarine Management. Estuaries 17: 94–101Wilson DE, Cole FR, Nichols JD, Rudran R and Foster MS (eds) (1996) Measuring and Monitoring Biolog-
ical Diversity. Standard Methods for Mammals. Smithsonian Institution Press, Washington and LondonWorld Bank (1992) Guidelines for Monitoring and Evaluation of GEF Biodiversity Projects. The World
Bank, WashingtonWorld Bank (1998) Guidelines for Monitoring and Evaluation for Biodiversity Projects. Environment
Department Note No. 65. The World Bank, WashingtonWRI, UNEP, UNDP and WB (1998) World Resources 1998–99, pp 320–321. Oxford University Press,
New York, Oxford