Embed Size (px)
Citation preview
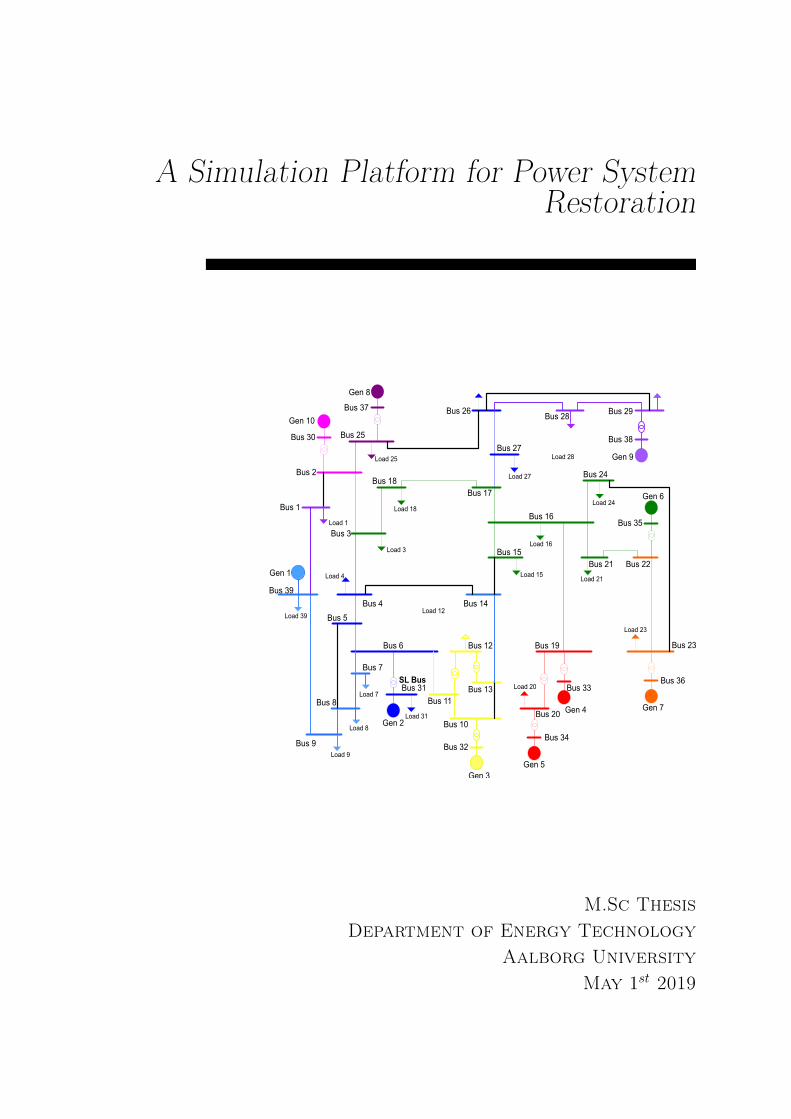
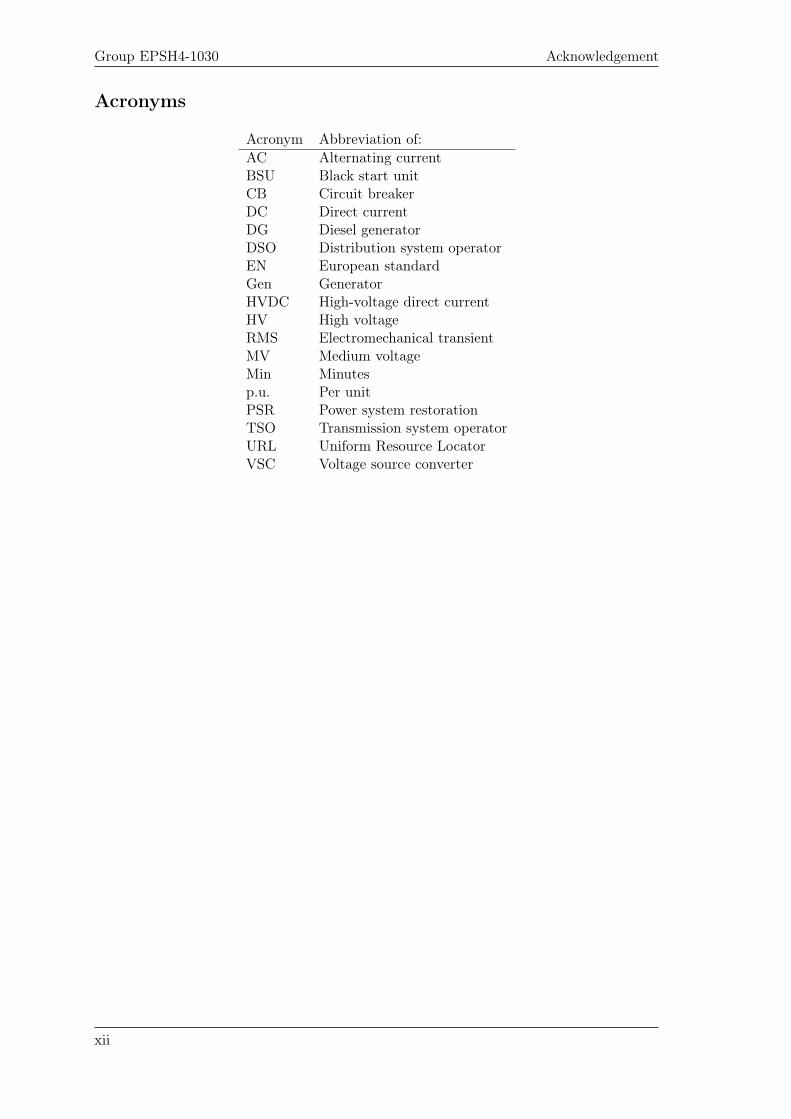
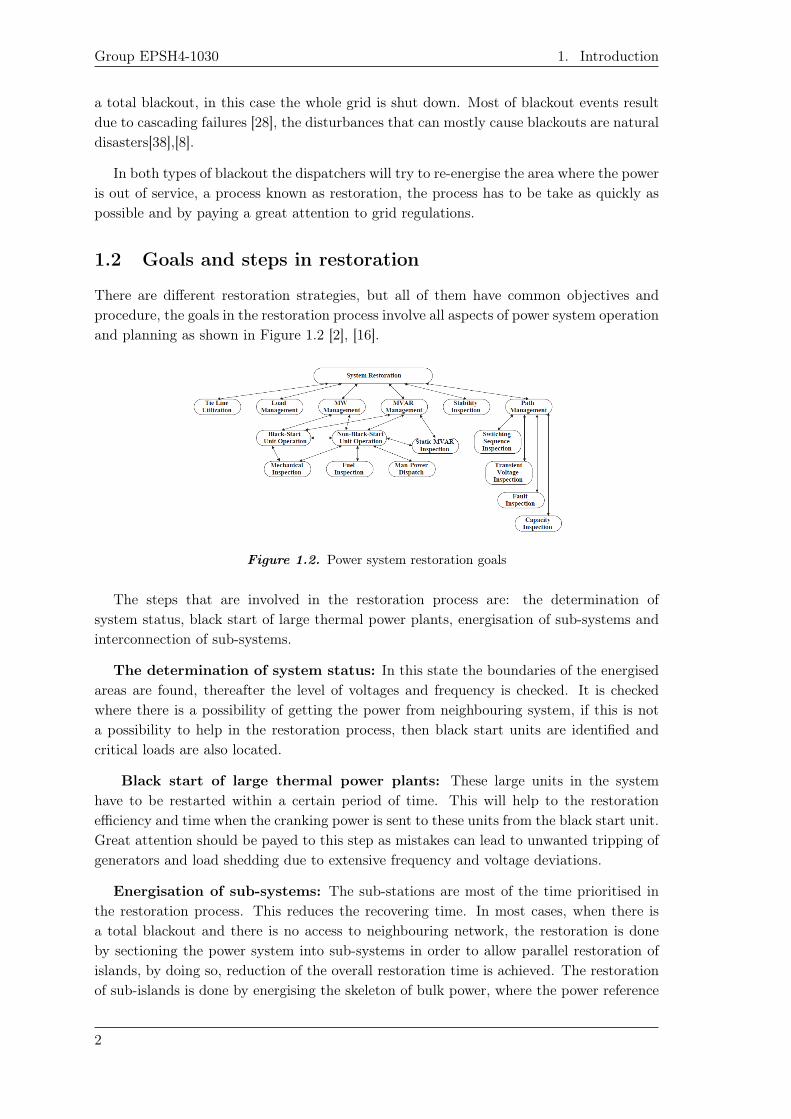
A Simulation Platform for Power SystemRestoration
Gen 1
Gen 2
Gen 3
Gen 4
Gen 5
Gen 6
Gen 7
Gen 8
Gen 10
Gen 9
Bus 1
Bus 2
Bus 30
Bus 37
Bus 25
Bus 18Bus 17
Bus 27
Bus 26Bus 28
Bus 29
Bus 38
Bus 24
Bus 35
Bus 22Bus 21
Bus 16
Bus 15
Bus 19 Bus 23
Bus 36Bus 33
Bus 34Bus 32
Bus 20Bus 10
Bus 11Bus 13
Bus 9
Bus 8
Bus 6
Bus 14Bus 4
Bus 39
Bus 5
Bus 7
Bus 31
Bus 12
Load 25
Bus 3
Load 3
Load 18
Load 4
Load 39
Load 7
Load 8
Load 31
Load 12
Load 20
Load 15
Load 16
Load 21
Load 24
Load 27
Load 28
Load 23
Load 1
Load 9
SL Bus
M.Sc ThesisDepartment of Energy Technology
Aalborg UniversityMay 1st 2019

Aalborg University
Title: A Hybrid Simulation Platform for Power System RestorationSemester: 4st M.ScSemester theme: Master’s Thesis
Power Systems and High Voltage SystemsProject period: 01.02.2019 to 01.05.2019ECTS: 30Supervisor: Chengxi LiuProject group: EPSH4-1030
Richard Mushimiye
SYNOPSIS:
This paper deals with the concept restora-tion process. It develops a flexible simula-tion platform as a decision-support tool forpower system restoration. This platformadopts a path searching algorithm basedon electric distances to find the direct pathfrom the black-start unit or current ener-gized buses to the bus with shortest elec-tric distance, and then closes the switchesto boost its voltage within the operatinglimit. During the restoration, the grid reg-ulations regarding frequency and voltageat each substation will be iterative checkedby time-domain simulations, i.e. either inthe root mean square (RMS). A flexibleclose-loop decision-support tool will be im-plemented to recalculate the path of en-ergization when necessary, e.g. unavail-ability of components or violation of gridregulations. The effect of automatic onload tap changer (OLTC) of transformerswill also be examined during the restora-tion process. This flexible simulation plat-form is developed using DIg-SILENT Pro-gramming Language (DPL) in PowerFac-tory with any selected black-start unit.
Pages, total: 63Appendix: A and BSupplements: PowerFactory models
iii

Group EPSH4-1030
iv
Abstract
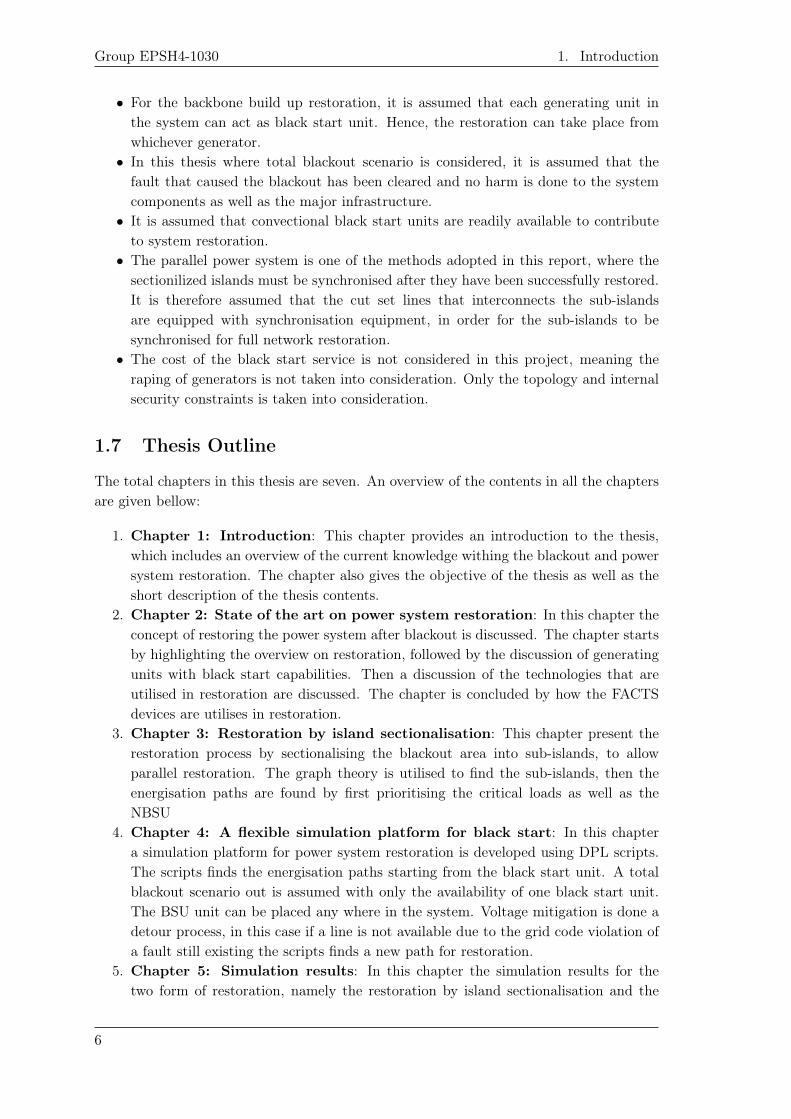
Power system restoration is the process of restoring a part of or a total electric powergrid into normal operation after a wide-area outage. This paper dealts with the conceptrestoration process. It develops a flexible simulation platform as a decision-support toolfor power system restoration. This platform adopts a path searching algorithm based onelectric distances to find the direct path from the black-start unit or current energized busesto the bus with shortest electric distance, and then closes the switches to boost its voltagewithin the operating limit. During the restoration, the grid regulations regarding frequencyand voltage at each substation will be iterative checked by time-domain simulations, i.e.either in the root mean square (RMS). A flexible close-loop decision-support tool will beimplemented to recalculate the path of energization when necessary, e.g. unavailability ofcomponents or violation of grid regulations. The effect of automatic on load tap changer(OLTC) of transformers will also be examined during the restoration process. This flexiblesimulation platform is developed using DIg-SILENT Programming Language (DPL) inPowerFactory with any selected black-start unit. This platform can adapt to differentpower systems and various grid operating conditions. The IEEE 39-bus New Englandpower system is selected as the test system to validate this plat-form with different black-start paths
Keyworks:Power system restoration,Decision support tool, Black start units, Blackout
v

Preface
This project is the result of a 4th semester master project, carried out by an electricalengineering student from the Department of Electrical Energy Technology at AalborgUniversity. The theme of the semester is "Power System and High Voltage Systems",and the project mainly concerns about the hybrid simulation platform for power systemrestoration. The project content, both theoretical and simulations has been carried out incollaboration with the supervisor Associate Professor Chengxi Liu.
Reading Guide
All sections, tables, equations and figures, are in chronological order according to thechapter number. For example, the first section, figure, table, or equation in chapter 4 isnumbered 4.1, the second 4.2 and so on. Each figure and table contains a caption with adescription of the figure or table. The reference system used in this report is the IEEEMethod. The IEEE Method shows the references with the label [Number of Reference]. Ifthe reference is placed before a full stop, the reference is for the specific sentence. If thereference is placed after a full stop, the reference is for the entire section. The complete listwith the references is placed in the section called Bibliography, where the Author, Titleand Year are shown. Internet websites are labelled as the other references, but they willalso include the [URL].
Each chapter is introduced and concluded by a short paragraph written in italic form.These paragraphs are introductions and partial conclusions for the given chapters.
Some of the figures in the report are touched up versions of figures found in differentliterature. When such a figure appears it will be noted in the caption of the figure whatliterature inspired the remade figure.
vii


Acknowledgement
The 5 years study period has been full of joy yet challenging. The intense academic lifein AAU have made me to always put my best effort and push myself to the limit and Iam and will always be grateful for the given opportunities. I am sure that the experiencehave I gained during my education will be helpful in the next phase of my life. Since thismaster thesis marks the completion of my journey as a student at AAU I would like toexpress my sincerest gratitude to those who made it possible.
To my supervisor for the master thesis Chengxi Liu: for all his help and sharedknowledge during the period of the master thesis. He was an excellent super visor in allaspects and I will always be thankful.
To my Guardian Parents Valerie and Stanley Power: I would like to thank mydear parents, whose love, support and prayers have made me get this far. You have beenthe best parents one can wish for, I will always be thankful for the love and support youhave showed me throughout my studies and my life, may God bless You.
To all people who have been encouraging me to go further: I would like tothank everyone who has made my studies possible. There were many people who pushedme to the limit in order to complete my studies. I am thankful.
To God: I can not finish without thanking the Almighty God for being there for meall the time.
ix


Nomenclature List
Special Symbols and Denotations
Symbol Description Derived unit UnitC Capacitance Farad Ff Frequency Hertz HzH Inertia Kilogram metre squared kg·m2
I Current Ampere AL Inductance Henry HR Resistance Ohm ΩX Reactance Ohm ΩP Active power Watt WQ Reactive power Volt-ampere reactive VArS Apparent power Volt-ampere VAt Time Seconds sV Voltage Volt VZ Impedance Ohm Ω
xi
Group EPSH4-1030 Acknowledgement
Acronyms
Acronym Abbreviation of:AC Alternating currentBSU Black start unitCB Circuit breakerDC Direct currentDG Diesel generatorDSO Distribution system operatorEN European standardGen GeneratorHVDC High-voltage direct currentHV High voltageRMS Electromechanical transientMV Medium voltageMin Minutesp.u. Per unitPSR Power system restorationTSO Transmission system operatorURL Uniform Resource LocatorVSC Voltage source converter
xii
Contents
Abstract v
Preface vii
Acknowledgement ix
1 Introduction 11.1 General background . . . . . . . . . . . . . . . . . . . . . . . . . . . . . . . 11.2 Goals and steps in restoration . . . . . . . . . . . . . . . . . . . . . . . . . . 21.3 Grid regulations during restoration . . . . . . . . . . . . . . . . . . . . . . . 3
1.3.1 The active power balance and frequency response . . . . . . . . . . . 31.3.2 The reactive power balance and voltage response . . . . . . . . . . . 3
1.4 Blackout . . . . . . . . . . . . . . . . . . . . . . . . . . . . . . . . . . . . . . 31.5 Thesis Motivation and Objective . . . . . . . . . . . . . . . . . . . . . . . . 51.6 Limitations and Assumptions . . . . . . . . . . . . . . . . . . . . . . . . . . 51.7 Thesis Outline . . . . . . . . . . . . . . . . . . . . . . . . . . . . . . . . . . 6
2 Start of the Art on Restoration 92.1 Overview of Restoration Process . . . . . . . . . . . . . . . . . . . . . . . . 92.2 Generation units with black start capability . . . . . . . . . . . . . . . . . . 10
2.2.1 Hydroelectric generating units . . . . . . . . . . . . . . . . . . . . . . 112.2.2 Diesel generating units . . . . . . . . . . . . . . . . . . . . . . . . . . 112.2.3 Gas turbine generating units . . . . . . . . . . . . . . . . . . . . . . 112.2.4 Behaviour of generator during black start . . . . . . . . . . . . . . . 11
2.3 VSV-HVDC in Black Start . . . . . . . . . . . . . . . . . . . . . . . . . . . 122.3.1 Advantage of VSC-HVDC in Black start . . . . . . . . . . . . . . . . 13
2.4 Coordination of Wind Power and Energy storage System in SystemRestoration . . . . . . . . . . . . . . . . . . . . . . . . . . . . . . . . . . . . 132.4.1 Coordination of Pumped Storage Hydro Units and Wind Power in
Restoration . . . . . . . . . . . . . . . . . . . . . . . . . . . . . . . . 142.4.2 Coordination of Battery Energy Storage System and Wind Power in
Restoration . . . . . . . . . . . . . . . . . . . . . . . . . . . . . . . . 142.5 Micro-grid in Restoration . . . . . . . . . . . . . . . . . . . . . . . . . . . . 162.6 Electric Vehicles in Power Restoration . . . . . . . . . . . . . . . . . . . . . 172.7 Effects of FACTS devices in Power System Restoration . . . . . . . . . . . . 17
2.7.1 Oscillation stability: . . . . . . . . . . . . . . . . . . . . . . . . . . . 172.7.2 Voltage stability: . . . . . . . . . . . . . . . . . . . . . . . . . . . . . 182.7.3 Standing phase angle control: . . . . . . . . . . . . . . . . . . . . . . 182.7.4 Reactive power control: . . . . . . . . . . . . . . . . . . . . . . . . . 182.7.5 Sustained over-voltage: . . . . . . . . . . . . . . . . . . . . . . . . . . 182.7.6 Transient over-voltage: . . . . . . . . . . . . . . . . . . . . . . . . . . 19
xiii
Group EPSH4-1030 Contents
2.7.7 Smooth cold load pickup: . . . . . . . . . . . . . . . . . . . . . . . . 19
3 Restoration by Island sectionalisation 213.1 The Heuristic Technique . . . . . . . . . . . . . . . . . . . . . . . . . . . . . 213.2 Parallel restoration constraints . . . . . . . . . . . . . . . . . . . . . . . . . 223.3 Graph theory . . . . . . . . . . . . . . . . . . . . . . . . . . . . . . . . . . . 23
3.3.1 Expending the initial sub-islands . . . . . . . . . . . . . . . . . . . . 293.4 Complete restoration sequence for sub-islands . . . . . . . . . . . . . . . . . 31
3.4.1 Sequence paths for island 1 . . . . . . . . . . . . . . . . . . . . . . . 313.4.2 Sequence paths for island 2 . . . . . . . . . . . . . . . . . . . . . . . 323.4.3 Sequence paths for island 3 . . . . . . . . . . . . . . . . . . . . . . . 323.4.4 Complete restoration time for the whole grid . . . . . . . . . . . . . 33
4 A Flexible Simulation Platform for Black Start 354.1 Path searching algorithm . . . . . . . . . . . . . . . . . . . . . . . . . . . . 354.2 Closed-loop decision support tool for detour . . . . . . . . . . . . . . . . . . 374.3 The black start process . . . . . . . . . . . . . . . . . . . . . . . . . . . . . . 39
4.3.1 Step by step black start sequence starting from generator 4 . . . . . 42
5 Simulation Result 535.1 Result for the flexible simulation platform for black start . . . . . . . . . . . 53
5.1.1 Case A: Sequence energisation . . . . . . . . . . . . . . . . . . . . . 535.1.2 Case B: Black start with detour . . . . . . . . . . . . . . . . . . . . . 555.1.3 Case C: Black start with tap changer control . . . . . . . . . . . . . 56
5.2 Results for the parallel restoration . . . . . . . . . . . . . . . . . . . . . . . 58
6 Conclusion 61
7 Future Work 63
Bibliography 65
A DPL Scripts for the Flexible simulation platform for PSR 69A.1 Scripts for black start . . . . . . . . . . . . . . . . . . . . . . . . . . . . . . 69
B Simulation Model Data 73B.1 Line parameter . . . . . . . . . . . . . . . . . . . . . . . . . . . . . . . . . . 73B.2 Loads size . . . . . . . . . . . . . . . . . . . . . . . . . . . . . . . . . . . . . 74B.3 Generation input data . . . . . . . . . . . . . . . . . . . . . . . . . . . . . . 75B.4 Parameters of OLTC . . . . . . . . . . . . . . . . . . . . . . . . . . . . . . . 75
xiv
Introduction 1This chapter introduces this thesis. The importance of restoration, steps and constrains inrestoration process are discussed. The objective of the thesis is highlighted after the analysisof the problem. The limitations and assumption taken during simulation are highlighted.The chapter is concluded by the short descriptions of the chapters in this thesis
1.1 General background
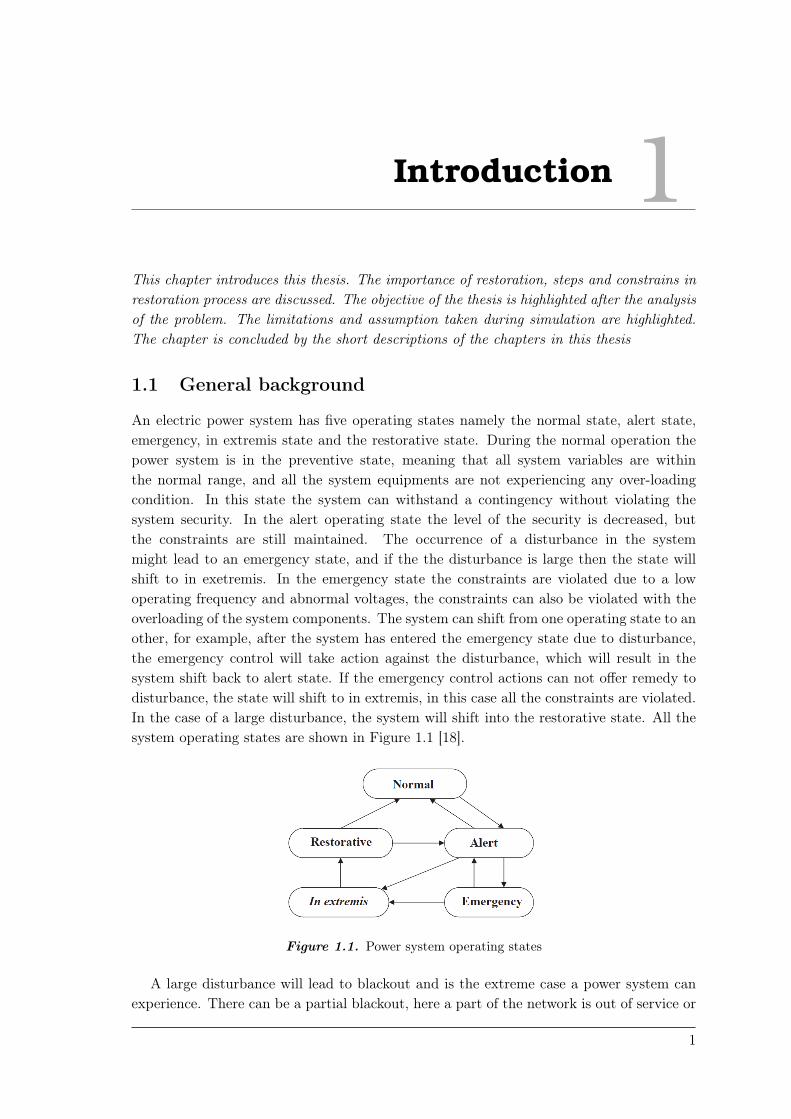
An electric power system has five operating states namely the normal state, alert state,emergency, in extremis state and the restorative state. During the normal operation thepower system is in the preventive state, meaning that all system variables are withinthe normal range, and all the system equipments are not experiencing any over-loadingcondition. In this state the system can withstand a contingency without violating thesystem security. In the alert operating state the level of the security is decreased, butthe constraints are still maintained. The occurrence of a disturbance in the systemmight lead to an emergency state, and if the the disturbance is large then the state willshift to in exetremis. In the emergency state the constraints are violated due to a lowoperating frequency and abnormal voltages, the constraints can also be violated with theoverloading of the system components. The system can shift from one operating state to another, for example, after the system has entered the emergency state due to disturbance,the emergency control will take action against the disturbance, which will result in thesystem shift back to alert state. If the emergency control actions can not offer remedy todisturbance, the state will shift to in extremis, in this case all the constraints are violated.In the case of a large disturbance, the system will shift into the restorative state. All thesystem operating states are shown in Figure 1.1 [18].
Figure 1.1. Power system operating states
A large disturbance will lead to blackout and is the extreme case a power system canexperience. There can be a partial blackout, here a part of the network is out of service or
1
Group EPSH4-1030 1. Introduction
a total blackout, in this case the whole grid is shut down. Most of blackout events resultdue to cascading failures [28], the disturbances that can mostly cause blackouts are naturaldisasters[38],[8].
In both types of blackout the dispatchers will try to re-energise the area where the poweris out of service, a process known as restoration, the process has to be take as quickly aspossible and by paying a great attention to grid regulations.
1.2 Goals and steps in restoration
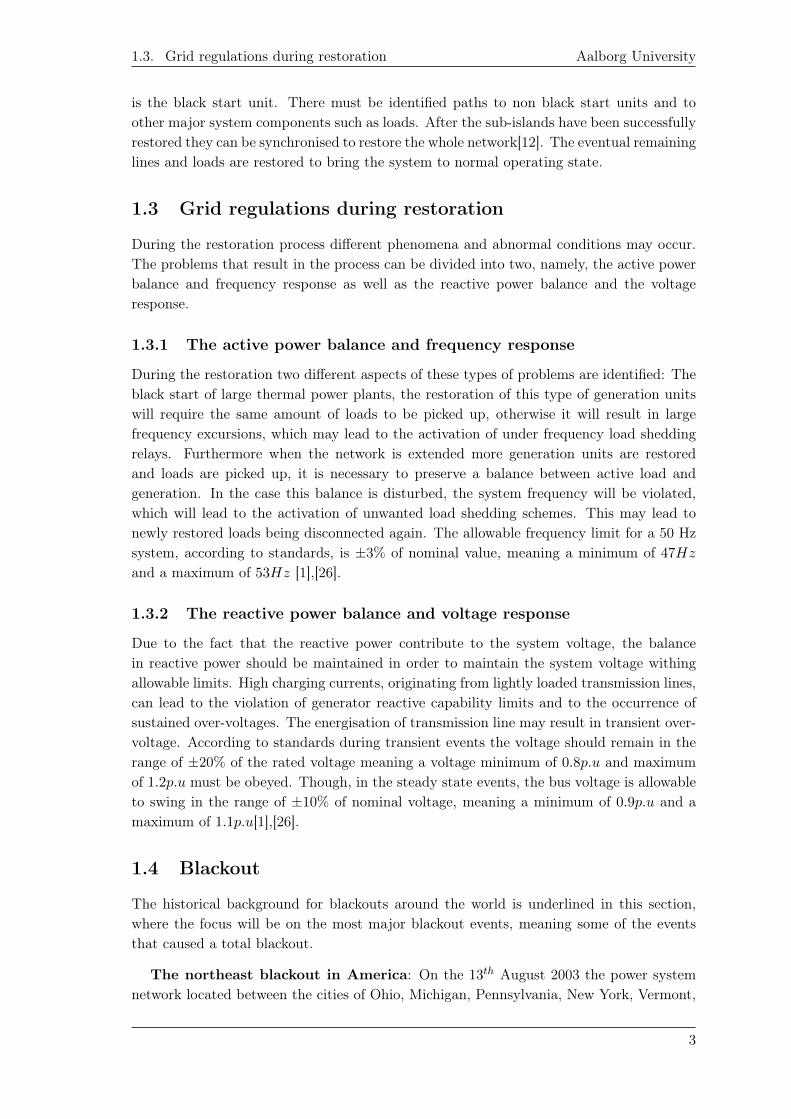
There are different restoration strategies, but all of them have common objectives andprocedure, the goals in the restoration process involve all aspects of power system operationand planning as shown in Figure 1.2 [2], [16].
Figure 1.2. Power system restoration goals
The steps that are involved in the restoration process are: the determination ofsystem status, black start of large thermal power plants, energisation of sub-systems andinterconnection of sub-systems.
The determination of system status: In this state the boundaries of the energisedareas are found, thereafter the level of voltages and frequency is checked. It is checkedwhere there is a possibility of getting the power from neighbouring system, if this is nota possibility to help in the restoration process, then black start units are identified andcritical loads are also located.
Black start of large thermal power plants: These large units in the systemhave to be restarted within a certain period of time. This will help to the restorationefficiency and time when the cranking power is sent to these units from the black start unit.Great attention should be payed to this step as mistakes can lead to unwanted tripping ofgenerators and load shedding due to extensive frequency and voltage deviations.
Energisation of sub-systems: The sub-stations are most of the time prioritised inthe restoration process. This reduces the recovering time. In most cases, when there isa total blackout and there is no access to neighbouring network, the restoration is doneby sectioning the power system into sub-systems in order to allow parallel restoration ofislands, by doing so, reduction of the overall restoration time is achieved. The restorationof sub-islands is done by energising the skeleton of bulk power, where the power reference
2
1.3. Grid regulations during restoration Aalborg University
is the black start unit. There must be identified paths to non black start units and toother major system components such as loads. After the sub-islands have been successfullyrestored they can be synchronised to restore the whole network[12]. The eventual remaininglines and loads are restored to bring the system to normal operating state.
1.3 Grid regulations during restoration
During the restoration process different phenomena and abnormal conditions may occur.The problems that result in the process can be divided into two, namely, the active powerbalance and frequency response as well as the reactive power balance and the voltageresponse.
1.3.1 The active power balance and frequency response
During the restoration two different aspects of these types of problems are identified: Theblack start of large thermal power plants, the restoration of this type of generation unitswill require the same amount of loads to be picked up, otherwise it will result in largefrequency excursions, which may lead to the activation of under frequency load sheddingrelays. Furthermore when the network is extended more generation units are restoredand loads are picked up, it is necessary to preserve a balance between active load andgeneration. In the case this balance is disturbed, the system frequency will be violated,which will lead to the activation of unwanted load shedding schemes. This may lead tonewly restored loads being disconnected again. The allowable frequency limit for a 50 Hzsystem, according to standards, is ±3% of nominal value, meaning a minimum of 47Hz
and a maximum of 53Hz [1],[26].
1.3.2 The reactive power balance and voltage response
Due to the fact that the reactive power contribute to the system voltage, the balancein reactive power should be maintained in order to maintain the system voltage withingallowable limits. High charging currents, originating from lightly loaded transmission lines,can lead to the violation of generator reactive capability limits and to the occurrence ofsustained over-voltages. The energisation of transmission line may result in transient over-voltage. According to standards during transient events the voltage should remain in therange of ±20% of the rated voltage meaning a voltage minimum of 0.8p.u and maximumof 1.2p.u must be obeyed. Though, in the steady state events, the bus voltage is allowableto swing in the range of ±10% of nominal voltage, meaning a minimum of 0.9p.u and amaximum of 1.1p.u[1],[26].
1.4 Blackout
The historical background for blackouts around the world is underlined in this section,where the focus will be on the most major blackout events, meaning some of the eventsthat caused a total blackout.
The northeast blackout in America: On the 13th August 2003 the power systemnetwork located between the cities of Ohio, Michigan, Pennsylvania, New York, Vermont,
3
Group EPSH4-1030 1. Introduction
Massachusetts, Connecticut, New Jersey and a part of Canada, Ontarion were hit by thepower blackout, where a total of 61 800MW power was not available for a period of 4 to 7days. Due to the large area of blackout, more people were affected by the event, a total ofapproximately 50 millions consumers in all the regions were affected. The events cause wasthe cascading failure, the state estimator (SE) and contingency analysis of the midwestISO’s (MISO) which solves the line loading automatically were not working accordingly,which lead to the cascade of the loading to other part of the system. This affected thecontrol of balance between generation and demand leading to the whole system blackout.Since then the power system in America has been upgraded to smart grid technology, wherethe system control and data acquisition (SCADA) play a role in the control system[6].
India blackout: On July 30th and 31st These two blackout event in India occurredon two different following days, the time for the power system to be restored to normaloperation is said to be several hours on that day. Around 620 and 700 million had noaccess to electricity. The overloading on the 400 kV double transmission line located inGwalior-Bina is said to be the reason for the blackout on the 30th, one of the doubleline was under maintenance and this caused the overloading on the other transmissionline causing cascading failure in the system. The over-loading caused low voltage on thesystem buses causing system components to be tripped by the protection system leavinga generation shortage of 32 GW. The whole high voltage transmission grid was blackout.The network was restored after several hours, however, the imbalance between generationand demand caused the system to collapse again on the next day. The control system andmonitoring equipments in India power grid was poor and could not realise the overloadingin the system. The system parameters was measured by the remote terminal units (RTU),which did not give accurate information on the current situation in the system, since thenthe phasor measurement unit (PMU) are utilised[33].
Ukraine blackout: On 23rd December 2015 Ukraine power system had a blackoutthat left around 225 000 consumers without power for several hours. The system blackoutwas caused by cyber-attack which hijacked the SCADA network and started to inject falsedata into the SCADA, the meter measurements units sent wrong data information, thenetwork topology was changed by the attackers and modified system electrical parameterseventual this lead to the collapse of the whole network. The solution to cyber attack is tostrengthen the defensive system against the cyber-attack[3].
San Diego blackout: On the 8th September 2011 the Pacific southwest had an outagecaused by the tripping of a line during the peak load causing overloading, with insufficientload shedding, the overload propagated to other part of the system components to causecascading blackout, the power loss lasted for 12 hours and affected approximately 4.2million customers[9].
Italy blackout: On 28th September 2003, Italy was hit by a blackout where the wholecountry was left without power, due to the loss of a line between Italy and Switzerlandwhich was hit by a tree contact, causing overloading to the system components. Thecomponents were tripped by the protection relay, and there were shortage of generation inthe system which lead to the fall in system frequency this lead to the loss of synchronisebetween Italy and the rest of Europe where 58 million people were affected by the event[36].
4
1.5. Thesis Motivation and Objective Aalborg University
European blackout: On 4th November 2006 the European power system was hit by ablackout due the loss of a line in the German power system. An over head line was plannedto be disconnected to allow a ship to pass, however the disconnection of the line and apoor communication between TSOs, caused overloading to other system parameters whichcaused a cascading failure in the European power system.The European interconnectedgrid was divided into three islands with different frequencies. The attempt to solve thefrequency problem was the automatic load shedding which resulted in blackout. More than15 million were left without electricity, transport such as trains and elevators were trappedwith people involved for almost 2 hours[21].
South Australia blackout: On 28th November 2016, the power system network inthe south Australia was shut down. The cause for the blackout was a heavy storm thatcollapsed several transmission towers in the system. The loss of overhead lines resulted inmany wind turbines being shut down, making the grid lose about 52 % of the generation,this led to the fall in frequency and voltage. For the emergency solution to the problem,the power was imported from the neighbouring grid (Victoria state), unfortunately theexported power was beyond the interconnection capacity which led to overloading in thesystem. The south network was then separated from the southeast grid without powersupply, approximately 1,7 million people were affected by the event[32].
1.5 Thesis Motivation and Objective
It can be concluded from the previous sections, that a number of complex and seriousproblems need to be resolved during power system restoration. Hence, a detailed analysisduring both the system planing stage and during the restoration stage is necessary. As itwill be shown in chapter 2 many researches have been done on power system restoration,but all of them have share the same final solution, which is to develop energisation pathsfor black start while obeying the grid regulations.
The objective of this thesis is to give simple and approximate rules to assess thefeasibility of restoration steps. A flexible simulation platform for power system restorationis developed to guide the operators finding paths for energisation. The restoration schemecan limit the number of time consuming simulations based on trial and error. The platformadopts a path searching algorithm, which is based on finding the shortest path based onshortest electrical distance, the path can be from the black start unit to another generationunits or from the currently energized bus to the bus with shortest electrical distance.Using the RMS time domain simulation tool, the grid code requirement for voltage andfrequency are checked for each energized path. Regardless of the electric shortest distance,the voltage mitigation during the restoration is examined with the detour process and onload tap changer (ONTC).
1.6 Limitations and Assumptions
• For the multi-island restoration strategy the black start units are chosen accordingto the structure of the grid, meaning the exactly placement of the black start in theoriginal new England grid.
5
Group EPSH4-1030 1. Introduction
• For the backbone build up restoration, it is assumed that each generating unit inthe system can act as black start unit. Hence, the restoration can take place fromwhichever generator.
• In this thesis where total blackout scenario is considered, it is assumed that thefault that caused the blackout has been cleared and no harm is done to the systemcomponents as well as the major infrastructure.
• It is assumed that convectional black start units are readily available to contributeto system restoration.
• The parallel power system is one of the methods adopted in this report, where thesectionilized islands must be synchronised after they have been successfully restored.It is therefore assumed that the cut set lines that interconnects the sub-islandsare equipped with synchronisation equipment, in order for the sub-islands to besynchronised for full network restoration.
• The cost of the black start service is not considered in this project, meaning theraping of generators is not taken into consideration. Only the topology and internalsecurity constraints is taken into consideration.
1.7 Thesis Outline
The total chapters in this thesis are seven. An overview of the contents in all the chaptersare given bellow:
1. Chapter 1: Introduction: This chapter provides an introduction to the thesis,which includes an overview of the current knowledge withing the blackout and powersystem restoration. The chapter also gives the objective of the thesis as well as theshort description of the thesis contents.
2. Chapter 2: State of the art on power system restoration: In this chapter theconcept of restoring the power system after blackout is discussed. The chapter startsby highlighting the overview on restoration, followed by the discussion of generatingunits with black start capabilities. Then a discussion of the technologies that areutilised in restoration are discussed. The chapter is concluded by how the FACTSdevices are utilises in restoration.
3. Chapter 3: Restoration by island sectionalisation: This chapter present therestoration process by sectionalising the blackout area into sub-islands, to allowparallel restoration. The graph theory is utilised to find the sub-islands, then theenergisation paths are found by first prioritising the critical loads as well as theNBSU
4. Chapter 4: A flexible simulation platform for black start: In this chaptera simulation platform for power system restoration is developed using DPL scripts.The scripts finds the energisation paths starting from the black start unit. A totalblackout scenario out is assumed with only the availability of one black start unit.The BSU unit can be placed any where in the system. Voltage mitigation is done adetour process, in this case if a line is not available due to the grid code violation ofa fault still existing the scripts finds a new path for restoration.
5. Chapter 5: Simulation results: In this chapter the simulation results for thetwo form of restoration, namely the restoration by island sectionalisation and the
6

1.7. Thesis Outline Aalborg University
flexible simulation platform for PSR is presented. The frequency response and voltageresponse during the black start are checked.
6. Conclusion: This chapter concludes the work in this thesis. The main results duringthe restoration process are concluded.
7. Future Work:In this chapter the task that can be curried out with regards to thisthesis’ topic are identified and highlighted.
This chapter has presented an overall description of the blackout and restoration inelectrical power system. It is shown that the blackout concept is a serious matter which canlead to economical losses and system instability. Hence, a restoration plan has to be madein advance in order to minimise the restoration time.
7

Start of the Art onRestoration 2
This chapter gives a literature survey that provides an overview of the relevant areas inrestoration. It is subdivided into three topic. The first topic provides a general overview ofthe restoration process. It is followed by a discussion of generation units with black startcapability. Then, the technologies that can be used in black starts process are highlightedand discussed. The chapter is finished by discussing the impact of FACTS devices inrestoration, as support tools to regulate the system voltage and frequency.
2.1 Overview of Restoration Process
Power system restoration is the process where generation, load consumption and systemcomponents, e.g. substations, transformers, lines and cables, are restored to normaloperation after the power grid has been affected by a total or a partial blackout. Powersystem blackouts are rare, but depending on the duration of the restoration process, theblackouts may have great impact on the stability of the power system, economy and society.Hence, a fast and reliable restoration scheme is of great importance to minimise the losses.The goal of restoration is to accelerate the restoration process and to reduce the impactsof power outages. However, power system restorations become more and more challengingsince power resources migrate to distributed generation and intermittent generation basedon RES [34],[10].
The restoration is done by identifying the path of energisation for de-energised buses.Various methods are suggested by different authors, which gives rules to find the paths. In[35] a knowledge based system was developed, which contains rules to follow in identifyingthe paths of energisation, after the path were identified, a power flow was conducted toverify the feasibility of the restoration plan. In [40] an advanced method to guide for systemrestoration was developed. During the restoration the method provides the guidance inswitching actions and load dispatching. A similar model but more advanced to the previouscase was tagged prototype model and is developed in [39], after the blackout the model willperform a fault analysis to identify the location of the fault, thereafter it will generate atargeted configurations and restoration procedure. The loads and generations are restoredwhile the faulted portion of the system is isolated from the restoration paths.
The restoration process is implemented by maintaining the grid code for voltage andfrequency, as re-energizing the power system components may make the power grid appearwith different characteristics as compared to the initial condition [37]. In addition thesystem must be restored as quickly as possible, in order to avoid of the surging economic
9
Group EPSH4-1030 2. Start of the Art on Restoration
lost [23]. The restoration of the power system components can be initialised in differentways, such as the use of RES and generators with black start capabilities. The REScan be either a black-start source or supportive black-start units in the whole restorationprocess, for example a combined system of wind power (WP) and battery energy storagesystem (BESS) is proposed in for restoration process [19]. The WP supplies the initialactive power to crank the synchronous generators in the system and the BESS is used tomaintain the system stability by supplying the stored energy to balance the system duringthe process. Wind power can also be utilised as an independent supportive black-startunit for system restoration. In this case voltage source converters (VSCs) technology isused to connect the wind farm to the grid [29]. The VSC-HVDC based offshore WF arecapable of controlling the frequency and voltage of the islanded network during the wholerestoration process [30],[31].
Other distributed generation (DG) units such as wind turbines and combined heat andpower generators can also be used to restore an islanded grid. The units are coordinatelycontrolled during the restoration process in order to keep the grid in a stable operatingcondition during the restoration. For example in the case when the wind turbines are notable to supply enough active power, due to unavailable wind then signals should be givento an available DG to support the power grid [11],[24]. Microgrids connected at the pointof common coupling to the main grid, contain DG units and energy storage systems, hencecan also black-start the network after blackouts [41], [42]. For all the restoration strategies,critical loads are considered to have the first priority to be picked up, meaning that theseloads must be restored first.
The restoration process is also done by sectionalizing the blackout grid into small sub-islands, where every sub-island is assigned with black-start units to start the restorationprocess, each island must meet the stability requirements such as the voltage and frequencyregulations and each sub-island must have enough generation to meet the demand. Thisrestoration strategy is known as the parallel restoration, because the divided sub-islandscan be restored in parallel. For every sub-island a black-start unit is energized first to sendcranking power to another generation units[5], [27].
The objective of all the restoration methods aim on searching for energising paths, afterthe restoration plan is developed a feasibility check is done with a load flow program suchas PowerFactory DIgSILENT.
The transmission system dispatchers (TSO) are responsible for the restoration of thetransmission level, while restoration on the distribution level is done by the distributionoperators (DSO). However, there must be coordination between the two system operators,meaning that data communication must be allowed between the parts.
2.2 Generation units with black start capability
The black start units (BSUs) are the power units that have the capability of self start,meaning that they do not need power from out side source to start, furthermore these unitsmust be able to be syncronisated to the grid, in order to start the black start process. Theyare utilised in the build up restoration process where sub-islands are formed. These unitsmust be prepared in advance in order to make the restoration process faster, this because
10
2.2. Generation units with black start capability Aalborg University
some unit needs more time than others, for example a small diesel generator can be faststarted in order to start up other big generators, while a steam turbine generator requirestation service power of up to 10% of their capacity for boiler feed water pumps. Normallythe small BSU are put in stand by for black start, because it is expensive to standby a bigBSU though they can be beneficial during black start as they can be used in the restorationprocess, comparing to small diesel generators which only starts the big NBSU. The BSUthat are mostly utilised in the restoration process are: a hydroelectric generating units,diesel generating units and gas turbine generating units.
2.2.1 Hydroelectric generating units
The hydroelectric generators can be utilised to crank power to NBSU during the buildup restoration strategy. These types of generators has the capability of self start withoutthe need of outside power. They have a fast primary frequency response characteristic,meaning that they can also contribute to the system frequency regulations when restartingthe NBSU. The operation principle for this generator is based on the Bryton cycle as it isdemonstrated is section 2.2.3 [12][15].
2.2.2 Diesel generating units
The diesel generators are also used as black start units. The generators have the capabilityto start on their own with the use of a battery, their starting time is within milliseconds,which means that they can start at any time required by the operators. This advantage ofimmediately self start make the units very usable in emergency situation such as duringthe restoration process, where the out of service generators need to be restarted in order tostart supplying generation to the grid. These generators are found in small size, thereforethey have advantage in terms of transportation from one station to an other if required.Because of thier sizes, these units can not be used to pick up major transmission elementsduring the restoration process. Their operation is done by converting the mechanical powerfrom the rotating shaft into electrical power needed by the system generator, in generalthier operation is based on Bryton cycle discussed later in section 2.2.3 [12][15].
2.2.3 Gas turbine generating units
The gas turbine generator sets used to black start the grid does not have the capability toaccomplish the work required for PSR alone, in addition these units are coupled with theon-site diesel generator sets, or batteries to help them start. The gas turbines are large insize, hence they have the capability of participating in the restoration process by pickingup loads. The time it takes to start and available ramping capability of these generatorsdepends on how long the units have been offline[12][15].
2.2.4 Behaviour of generator during black start
The generator start up curve 2.1 explains the working principle of the generator duringthe restoration process, it is based on the available active power and the assigned blackstart unit.
11
Group EPSH4-1030 2. Start of the Art on Restoration
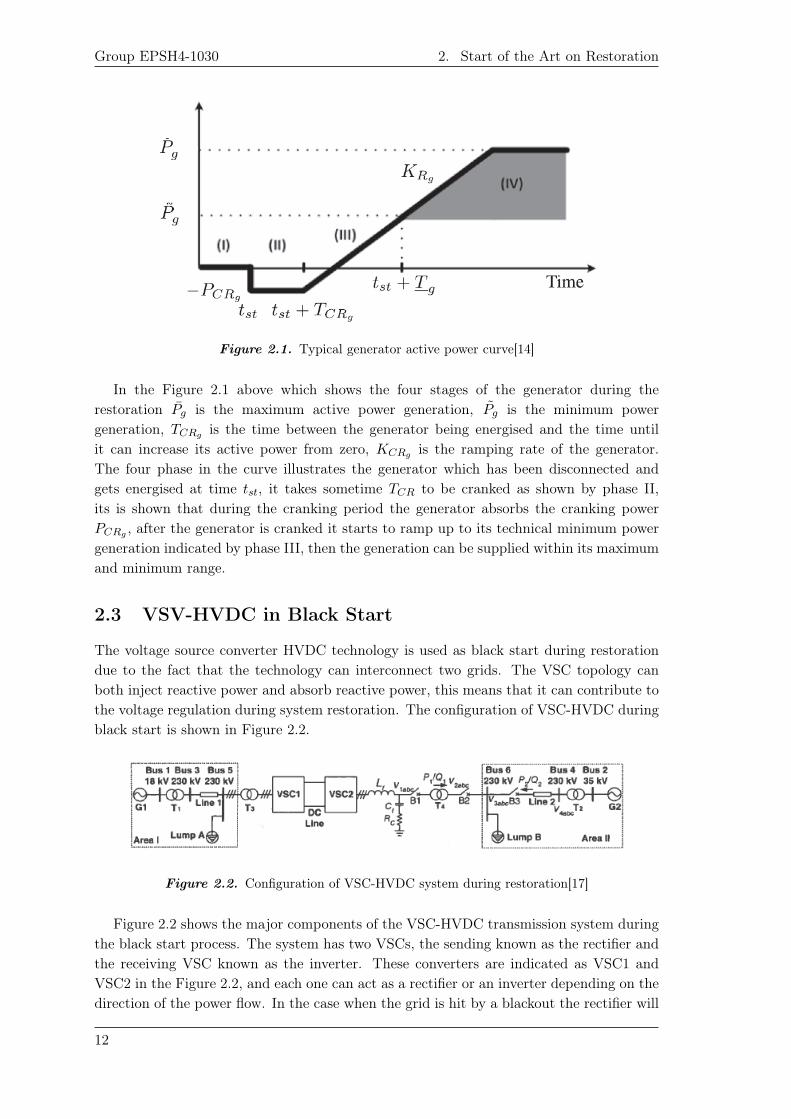
Figure 2.1. Typical generator active power curve[14]
In the Figure 2.1 above which shows the four stages of the generator during therestoration Pg is the maximum active power generation, Pg is the minimum powergeneration, TCRg is the time between the generator being energised and the time untilit can increase its active power from zero, KCRg is the ramping rate of the generator.The four phase in the curve illustrates the generator which has been disconnected andgets energised at time tst, it takes sometime TCR to be cranked as shown by phase II,its is shown that during the cranking period the generator absorbs the cranking powerPCRg , after the generator is cranked it starts to ramp up to its technical minimum powergeneration indicated by phase III, then the generation can be supplied within its maximumand minimum range.
2.3 VSV-HVDC in Black Start
The voltage source converter HVDC technology is used as black start during restorationdue to the fact that the technology can interconnect two grids. The VSC topology canboth inject reactive power and absorb reactive power, this means that it can contribute tothe voltage regulation during system restoration. The configuration of VSC-HVDC duringblack start is shown in Figure 2.2.
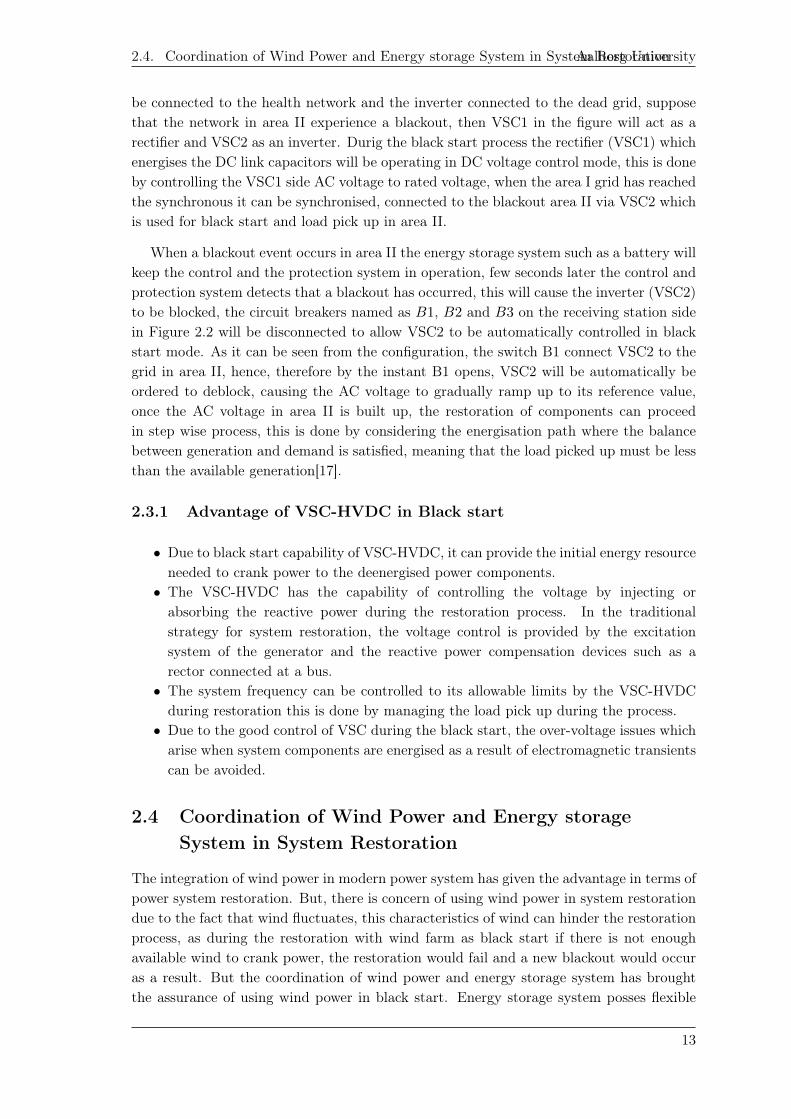
Figure 2.2. Configuration of VSC-HVDC system during restoration[17]
Figure 2.2 shows the major components of the VSC-HVDC transmission system duringthe black start process. The system has two VSCs, the sending known as the rectifier andthe receiving VSC known as the inverter. These converters are indicated as VSC1 andVSC2 in the Figure 2.2, and each one can act as a rectifier or an inverter depending on thedirection of the power flow. In the case when the grid is hit by a blackout the rectifier will
12
2.4. Coordination of Wind Power and Energy storage System in System RestorationAalborg University
be connected to the health network and the inverter connected to the dead grid, supposethat the network in area II experience a blackout, then VSC1 in the figure will act as arectifier and VSC2 as an inverter. Durig the black start process the rectifier (VSC1) whichenergises the DC link capacitors will be operating in DC voltage control mode, this is doneby controlling the VSC1 side AC voltage to rated voltage, when the area I grid has reachedthe synchronous it can be synchronised, connected to the blackout area II via VSC2 whichis used for black start and load pick up in area II.
When a blackout event occurs in area II the energy storage system such as a battery willkeep the control and the protection system in operation, few seconds later the control andprotection system detects that a blackout has occurred, this will cause the inverter (VSC2)to be blocked, the circuit breakers named as B1, B2 and B3 on the receiving station sidein Figure 2.2 will be disconnected to allow VSC2 to be automatically controlled in blackstart mode. As it can be seen from the configuration, the switch B1 connect VSC2 to thegrid in area II, hence, therefore by the instant B1 opens, VSC2 will be automatically beordered to deblock, causing the AC voltage to gradually ramp up to its reference value,once the AC voltage in area II is built up, the restoration of components can proceedin step wise process, this is done by considering the energisation path where the balancebetween generation and demand is satisfied, meaning that the load picked up must be lessthan the available generation[17].
2.3.1 Advantage of VSC-HVDC in Black start
• Due to black start capability of VSC-HVDC, it can provide the initial energy resourceneeded to crank power to the deenergised power components.
• The VSC-HVDC has the capability of controlling the voltage by injecting orabsorbing the reactive power during the restoration process. In the traditionalstrategy for system restoration, the voltage control is provided by the excitationsystem of the generator and the reactive power compensation devices such as arector connected at a bus.
• The system frequency can be controlled to its allowable limits by the VSC-HVDCduring restoration this is done by managing the load pick up during the process.
• Due to the good control of VSC during the black start, the over-voltage issues whicharise when system components are energised as a result of electromagnetic transientscan be avoided.
2.4 Coordination of Wind Power and Energy storageSystem in System Restoration
The integration of wind power in modern power system has given the advantage in terms ofpower system restoration. But, there is concern of using wind power in system restorationdue to the fact that wind fluctuates, this characteristics of wind can hinder the restorationprocess, as during the restoration with wind farm as black start if there is not enoughavailable wind to crank power, the restoration would fail and a new blackout would occuras a result. But the coordination of wind power and energy storage system has broughtthe assurance of using wind power in black start. Energy storage system posses flexible
13
Group EPSH4-1030 2. Start of the Art on Restoration
characteristics, meaning that they have advantage to the fact that they can store energywhen there is excess from wind power and can release the energy to support the gridduring unstable condition, the energy storage system can accommodate the uncertaintyand variability of wind energy. Among the energy storage system utilises together withwind power are the battery energy storage system (BESS) and pumped storage hydro(PSH)[20].
2.4.1 Coordination of Pumped Storage Hydro Units and Wind Powerin Restoration
The energy storage system known as the pumped storage hydro (PSH) units is discussedto be the energy storage system that can be used in coordination with the wind powerto provide a reliable system for restoration process. The HSH system stores the energyby using the surplus energy to pump water from a lower reservoir to a high reservoir andgenerate power in the reverse process, hence in the event of excess wind power the energycan be stored. The system can provide a fast response with large scale, therefore it can bea good energy storage system to be coordinated with the wind power to provide a fasterand reliable system for restoration. The PSH can be used to crank power to NBSU or loadpick up, or it can also be utilised to compensate the power in the event or wind rampingup[17].
2.4.2 Coordination of Battery Energy Storage System and WindPower in Restoration
The combination of BESS and the WF has been utilised in restoration process, there aretwo ways where the BESS and the WF are implemented: the parallel connection at thePCC and the BESS implemented in the DC link of the type 3 wind turbine.
BESS connected in Parallel with the WF at PCC for Black Start
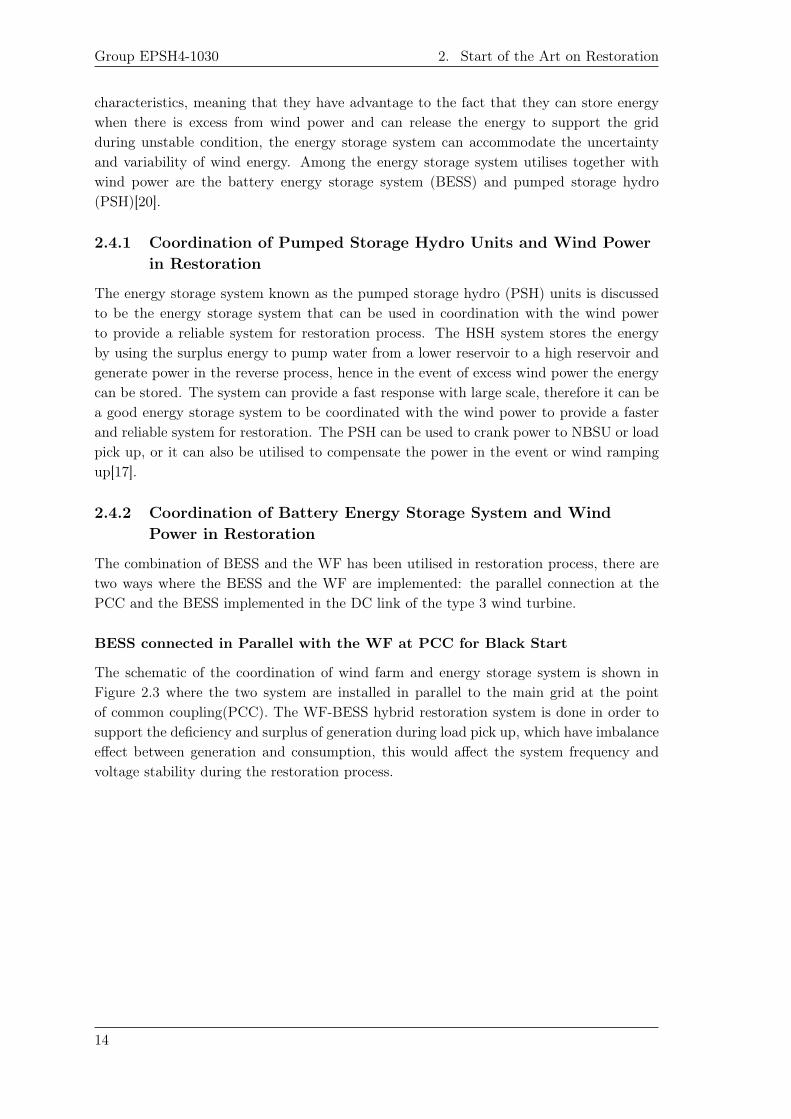
The schematic of the coordination of wind farm and energy storage system is shown inFigure 2.3 where the two system are installed in parallel to the main grid at the pointof common coupling(PCC). The WF-BESS hybrid restoration system is done in order tosupport the deficiency and surplus of generation during load pick up, which have imbalanceeffect between generation and consumption, this would affect the system frequency andvoltage stability during the restoration process.
14
2.4. Coordination of Wind Power and Energy storage System in System RestorationAalborg University
Figure 2.3. Schematic of a typical intergrated wind farm and BESS[20]
Figure 2.3 shows the WF and a battery dispatching strategy as hybrid system for powerrestoration. The BESS has advantage because, they can act as load and as a generationduring the process, meaning that in the case when there is imbalance between load andgeneration, for example if there is surplus generation, the BESS will act as a load bystoring the excess energy to bring balance to the system and when there is less generationcomparing to the available load, the BESS will release the stored energy supporting thegrid. In the initial stage of the restoration with WF-BESS where generation from windpower begin to ramp up the batteries will be operating in the discharging mode (behavinglike a BSU) to crank power to NBSU or load pick up, when there is available power fromwind the battery will operate in charging mode storing the surplus energy. This switch ofoperation will continue during the restoration process until the grid is fully recovered[20].The out put power of the BESS at time t is expressed as in Equation 2.1
P bt = P desch
t − P cht (2.1)
Equation 2.1 shows the working principle of the BESS, for short generation supply fromWF P b
t will be positive indicating the discharging state, hence BESS acting as generationunit to supply power, otherwise P b
t will be negative for storing the surplus energy. Thecombined power from WF and BESS is the power sum from the two system as shown inEquation 2.2.
Pwbt = P b
t + Pwt (2.2)
BESS installed in DC link of type 3 wind turbine for black start
The BESS is also some times implemented in the DC link of the type 3 wind turbine,namely, the doubly fed induction generation (DFIG) type wind turbine, for black start theconfiguration is as shown in Figure 2.4.
15
Group EPSH4-1030 2. Start of the Art on Restoration
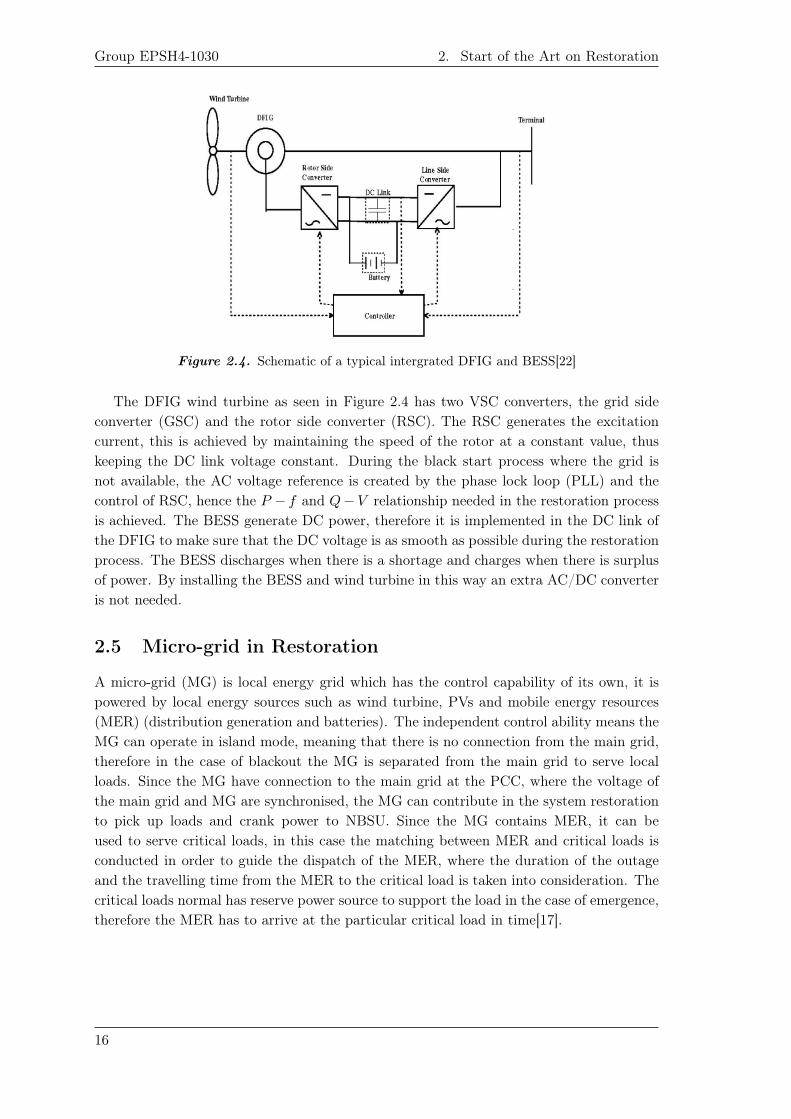
Figure 2.4. Schematic of a typical intergrated DFIG and BESS[22]
The DFIG wind turbine as seen in Figure 2.4 has two VSC converters, the grid sideconverter (GSC) and the rotor side converter (RSC). The RSC generates the excitationcurrent, this is achieved by maintaining the speed of the rotor at a constant value, thuskeeping the DC link voltage constant. During the black start process where the grid isnot available, the AC voltage reference is created by the phase lock loop (PLL) and thecontrol of RSC, hence the P − f and Q− V relationship needed in the restoration processis achieved. The BESS generate DC power, therefore it is implemented in the DC link ofthe DFIG to make sure that the DC voltage is as smooth as possible during the restorationprocess. The BESS discharges when there is a shortage and charges when there is surplusof power. By installing the BESS and wind turbine in this way an extra AC/DC converteris not needed.
2.5 Micro-grid in Restoration
A micro-grid (MG) is local energy grid which has the control capability of its own, it ispowered by local energy sources such as wind turbine, PVs and mobile energy resources(MER) (distribution generation and batteries). The independent control ability means theMG can operate in island mode, meaning that there is no connection from the main grid,therefore in the case of blackout the MG is separated from the main grid to serve localloads. Since the MG have connection to the main grid at the PCC, where the voltage ofthe main grid and MG are synchronised, the MG can contribute in the system restorationto pick up loads and crank power to NBSU. Since the MG contains MER, it can beused to serve critical loads, in this case the matching between MER and critical loads isconducted in order to guide the dispatch of the MER, where the duration of the outageand the travelling time from the MER to the critical load is taken into consideration. Thecritical loads normal has reserve power source to support the load in the case of emergence,therefore the MER has to arrive at the particular critical load in time[17].
16
2.6. Electric Vehicles in Power Restoration Aalborg University
2.6 Electric Vehicles in Power Restoration
Electric vehicles (EVs) can be used in system restoration, the plug-in hybrid (PHEV) hasthe capability of charging and discharging, the car has a rechargeable battery that can becharged by connecting to an external power source. Since the the car system can chargeand recharge it is considered as an energy storage system, therefore it can be consideredas a load when it is charging and as a generation unit when it is discharging to the grid.It can therefore be used as a support system in the restoration process to absorb power inthe event of excess power and inject power when there is a shortage of power, in this waythe grid stability can be maintained during the restoration process[4].
2.7 Effects of FACTS devices in Power System Restoration
The restoration process threatens the stability of the grid as more generations, lines andloads are out of serve, which cause the imbalance of voltage and frequency, therefore theFlexible AC transmission system devices (FACTS) such as static var compensator (SVC),thyristor-controlled series capacitor (TCSC), static synchronous compensate (STATCOM)and unified power flow controller (UPFC) are considered in the restoration process, inorder to assure a faster and a smooth restoration process. The SVC and TCSC are arebased on variable reactances, meaning that they can contribute to voltage regulation,the STATCOM and UPFC devices are based on voltage source converter, therefore hasthe ability of absorbing or injecting reactive power for voltage support also the controlof power flow[13]. The issues that may occur during the restoration process, and whichcan lead the introduction of a FACTS devise are osclillation stability, voltage stability,transient stability, standing phase angle control, reactive power control, sustained over-voltage, transient over-voltage reduction in stored energy for circuit breaker, and smoothload pickup[25]. The discussion of this issues and possible solution in terms of whichFACTS device can be implemented for the matter is addressed in the following subsections:
2.7.1 Oscillation stability:
As discussed in chapter 1, one of the causes of the blakout is the low frequency oscillationin the voltage magnitude. The issue can still occur during the restoration process, due tointerconnection of the transmission lines or if there is no devices to damp the oscillations.The device that can be used to mitigate the power system oscillations during the restorationis the STATCOM, the SSSC and UPFC. The STATCOM whith its VSC has the ability forreactive power compensation, meaning it can absorb or generate reactive power in orderto damp the voltage oscillations. The SSSC can also be used to damp the oscillations,this is done by regulating the difference of both angle and phase between the sending endand receiving end buses. UPFC is a combination of SSSC and STATOM, therefore itcan also be utilised to damp the voltage oscillations. The generators contain the powersystem stabilizer (PSS) which is used to dam the power oscillations, however, since theregeneration unit is not installed at every bus, it may be a more practical to have a FACTSdevice which can be installed at a particular bus when necessary.
17
Group EPSH4-1030 2. Start of the Art on Restoration
2.7.2 Voltage stability:
Under normal condition and during dynamics, the voltage stability is a concern, whichcan be described as the ability of the power system to maintain the voltage within a pre-described grid limits. Factors that can lead to voltage instability during the restoration isthe loadability margin. The components loadings, such as transmission line loading canbe reduced by reducing the line reatance. When transmission lines are not energised fora while there will be generated loading, hence during the restoration process where linesare being energised the reactance of the some lines may be large compered to the initialcondition. FACTS devices suh as SVC, STATCOM, TCSC can be installed to adjust theline reactance thereby improving the voltage profile. When the system is in steady statethe voltage should be maintained within ±10 % of the nominal value, while a ±20 % ofthe rated value i acceptable for during dynamic analysis[26].
2.7.3 Standing phase angle control:
After the sub-islands have be sucessfully restored, they have to be synchronised, during thesynchronization the system dispatcher may face an excessive standing phase angle (SPA)at the sending and receiving nodes of the tie lines. When standing phase angle is largesynchronising the sub-islands in this condition may lead to cascading events and systemoutage, the instability of the sub-island synchronization can also lead to the damage onthe system components. The generators are the most affected components in the systemdue to large SPA, to avoid this relays are normal installed at the transmission lines ortransformer in order to avoid the switching on a large SPA. To reduce the SPA the outputof the generating units in the system is adjusted, this is can be done by the tap changer ofthe transformers. But FACTS devices can be implemented to help the adjustment of theSPA.
2.7.4 Reactive power control:
When HV transmission lines are out of service for a while there will be increase in reactivepower during the energisation due to line charging current, this will cause the increase insystem reactive power, which will sustain over-voltage. A solution to this matter can beto pick up some positive reactive loads to avoid the reactive power imbalance, howeverthe pick up of extra loads may the system frequency to drop, because of the imbalancein active power. The alternative solution is to use a FACTS devise like the one with anegative reactive power compensator and which can contribute zero active power. TheSVC has the capability of absorbing reactive power, hence it is used in system restorationwhere it can be connected at the bus bar.
2.7.5 Sustained over-voltage:
The sustained over-voltage is caused by the line charging currents of lightly loaded HVtransmission lines, the phenomena can cause damage to transformers due to over heating,it can also cause over-excitation on the transformer, over and under excitation on thegenerators and harmonic distortion, overall the stability of the system is greatly affected,a STATCOM or an SVC can be used in such matters.
18
2.7. Effects of FACTS devices in Power System Restoration Aalborg University
2.7.6 Transient over-voltage:
Transmission line are energised by closing circuit breakers (CB) installed at the ends.energising a large section of lines causes transient over-voltage. The phenomenon can alsoresult when the capacitive components in the system are energised. Transient over-voltagecan lead to the failure of relays, this is because, the phenomenon result is a current thatis a bit above the nominal value and the relays have difficulties in detecting such currents.The closure time point of the CB is of important, for example closing the CB when sourceinstantaneous voltage is at peak result in zero missing phenomena. Controllable FACTSdevices can be used to avoid such problem, where they can be utilised to find the optimalclosure time point to avoid switching transient.
2.7.7 Smooth cold load pickup:
The capacity of loads in the initial period after pick up is often higher than the steadystate load. The reason for load capacity increase is the losing of asynchrony of the constantpower temperature controlled loads. During the restoration process, the system’s constanttemperature controlled loads such as refrigerator, electric heater and other consumerappliances will be energised simultaneously, which will result in the load power increasein a short time, at this time the load demand can be increased up to 10 times comperingto the steady state value, however during the final stage of load pick up the load is largerfor 4-5 times. This rapid increase in load will cause overloading and a large fluctuationsin system frequency will take place, therefore the voltage and frequency will be large atthis stage. By controlling the voltage and frequency during restoration FACTS devices canhelp to smooth the power flow during the load pick up to maintain frequency and voltagewithin the allowable grid code limitations.
The chapter has presented the technologies used in power system restoring restoration.It is seen that the electrical power system can be restored efficiently and successfully,and there are different ways utilised in restoration, though it can be summarised in twocategories, namely, the build up and build down. It is seen that in order to restore thesystem efficiently, optimisation techniques are utilised in order to minimise the restorationtime. The VSC−HVDC transmission, wind power and energy storage system has been usedin black start process, it is shown that these technology are useful for black start, due tothier contribution in achieving a more stable system. Finally is shown that FACTS devicessuch as STATOM and SVC can also contribute to power restoration, since they can helpto regulate the system voltage and frequency
19

Restoration by Islandsectionalisation 3
This chapter presents the restoration process based on the build up strategy, where theblackout network is sectionilized in small islands depending on the available black startunits, in order for the islands to be restored individually. The heuristic technique is adoptedin this process to find the balanced islands for restoration, based on the availability of blackstart units, voltages limit and frequency limitation. The method defines the energisingtime and find the final cut set lines as the objectives, in order to maximise the possibility offinding the optimal sub-islands in short time. After the sub-islands are found, the energisingpath is selected by prioritising the critical loads and non black start units. The developedrestoration plan is implemented in DIg SILENT PowerFatory.
3.1 The Heuristic Technique
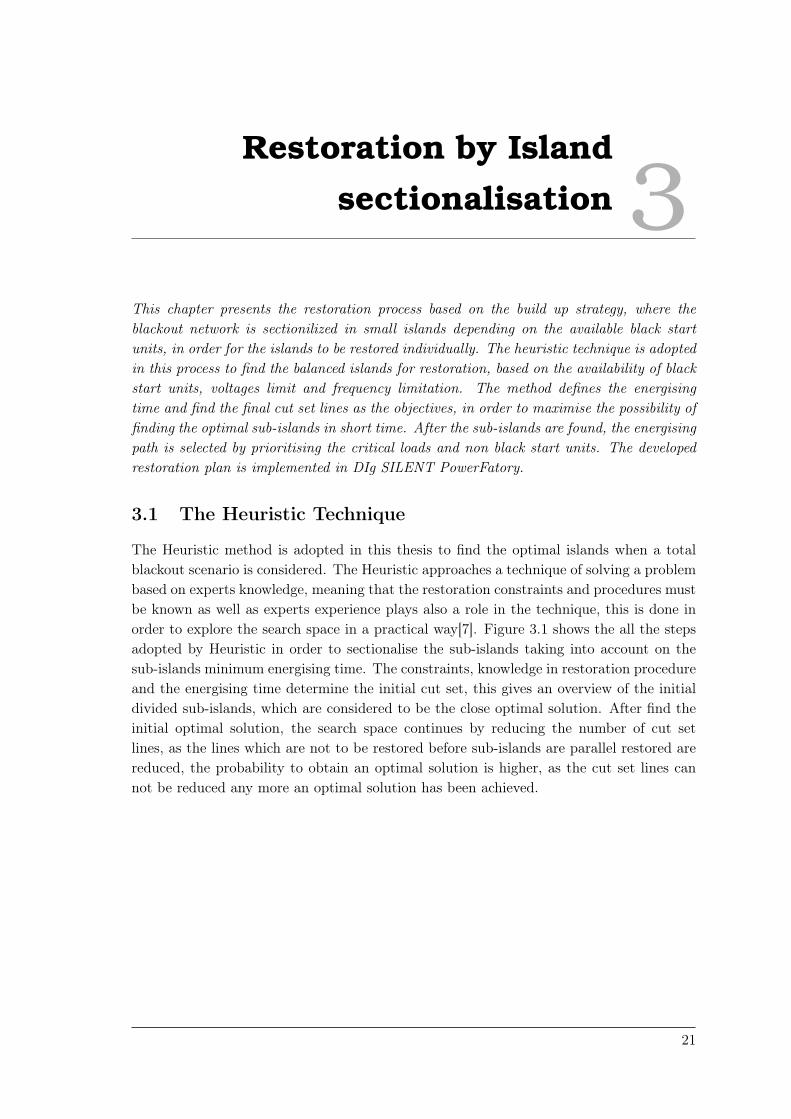
The Heuristic method is adopted in this thesis to find the optimal islands when a totalblackout scenario is considered. The Heuristic approaches a technique of solving a problembased on experts knowledge, meaning that the restoration constraints and procedures mustbe known as well as experts experience plays also a role in the technique, this is done inorder to explore the search space in a practical way[7]. Figure 3.1 shows the all the stepsadopted by Heuristic in order to sectionalise the sub-islands taking into account on thesub-islands minimum energising time. The constraints, knowledge in restoration procedureand the energising time determine the initial cut set, this gives an overview of the initialdivided sub-islands, which are considered to be the close optimal solution. After find theinitial optimal solution, the search space continues by reducing the number of cut setlines, as the lines which are not to be restored before sub-islands are parallel restored arereduced, the probability to obtain an optimal solution is higher, as the cut set lines cannot be reduced any more an optimal solution has been achieved.
21
Group EPSH4-1030 3. Restoration by Island sectionalisation
Figure 3.1. The Heuristic initialization technique[7]
The Heuristic technique by Figure 3.1 is basically composed of two main steps: thefirst step is to group the generators in the system according to the number of black startunits (BSUs) available, then create the generator skeleton, the generators are groupedin accordance to the total active power generation balance between the the islands as inequation 2.7.7. The second step is to search for initial cut set lines referencing to solutionin step one and according to Heuristic algorithm. In step two, the total restorative timefor major system components in each group is taken into consideration.
3.2 Parallel restoration constraints
In sectionalising the islands several constraints must be fulfilled, this done as to maintainthe reliability of the sub-islands in order to be restored in parallel, by doing so the stabilityof the sub-islands is obtained. The constraints to be obeyed during the sectionalising andsynchronizing are the following.
• Black start unit constraint: As there is no power available in the network, eachsub-island must have a black start unit (BSU) as the main cranking power to nonblack start unit (NBSU)[12].
• Frequency constraint: The total maximum power generated in each island mustbe higher than the total power consumed by the loads in each island. This is donein order to main the system frequency withing prescribed range. The frequencyis affected by the imbalance between generation and demand and according tostandards it must be maintained in the range of ±3% of nominal value, meaninga minimum of 47Hz and 53Hz according to standards [1],[26].
22
3.3. Graph theory Aalborg University
• Voltage constraints: Each island must have sufficient voltage control capabilitiesin order to maintain the bus voltage within prescribed limits. According to standardsduring transient events the voltage should remain in the range of ±20% of the ratedvoltage meaning a voltage minimum of 0.8p.u and maximum of 1.2p.u must beobeyed. Though, in the steady state events, the bus voltage is allowable to swing inthe range of ±10% of nominal voltage, meaning a minimum of 0.9p.u and a maximumof 1.1p.u[1],[26].
• Synchronisation constraints: It is recommended that the cut set lines mustcontain synchronisation equipment to allow the sub-islands synchronisation totake place. It is assumed in this thesis that each cut set is equipped withsynchronous meter to measure the sub-islands frequency and voltage before theycan be synchronised.
3.3 Graph theory
The steps in Heuristic technique is applied to the grid in Figure 4.5 for a total blackoutscenario. In order to find the generator skeleton, the system is modelled using graph theorymethod according to Equation 3.1.
G = (V,E,W ) (3.1)
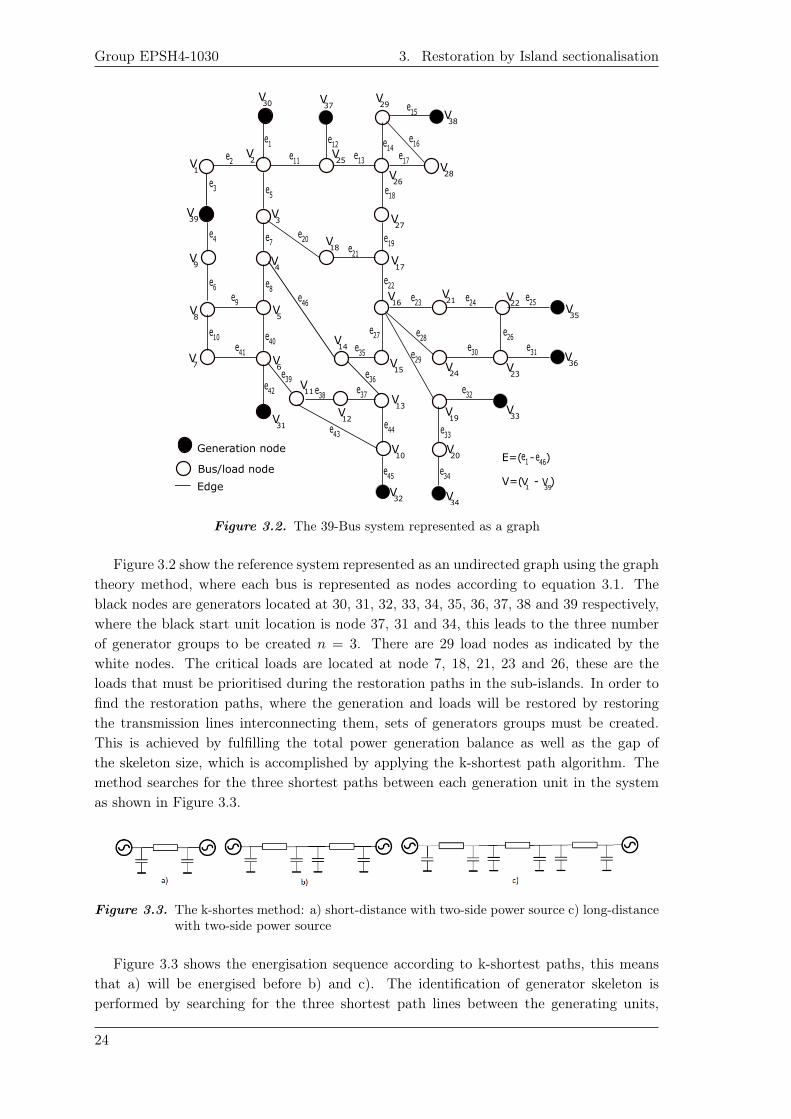
where V stands for major electrical components (bus, generator, loads), E is thetransmission lines (edges) and W is weight factor of the transmission line in terms ofelectric distance, all the system components are represented as a node as seen in Figure3.2.
23
Group EPSH4-1030 3. Restoration by Island sectionalisation
V36
V30 V
37V38
V29
V25
V26
V28
V27
V17
V18
V16
V15
V13
V12
V11
V14
V10
V32
V1
V2
V6
V7
V9
V5
V3
V4
V21 V
22V35
V23
V24
V33
V20
V19
V34
e4
e5
e1
e40e35 e29
e7
e16
e30
e14
e18
e27
e25
e34
e39
e41
e2
e3
e22
e13
e21
e20
e15
e28
e17
e6 e8e9
e10
e11
e12
e19
e23 e24
e26e31
e32
e33
e37
e36e38
e42
e43
Generation node
Bus/load node
Edge
E=( - )e46 e1
V=( - )V1
V39
V31
V39
V8
e44
e45
e46
Figure 3.2. The 39-Bus system represented as a graph
Figure 3.2 show the reference system represented as an undirected graph using the graphtheory method, where each bus is represented as nodes according to equation 3.1. Theblack nodes are generators located at 30, 31, 32, 33, 34, 35, 36, 37, 38 and 39 respectively,where the black start unit location is node 37, 31 and 34, this leads to the three numberof generator groups to be created n = 3. There are 29 load nodes as indicated by thewhite nodes. The critical loads are located at node 7, 18, 21, 23 and 26, these are theloads that must be prioritised during the restoration paths in the sub-islands. In order tofind the restoration paths, where the generation and loads will be restored by restoringthe transmission lines interconnecting them, sets of generators groups must be created.This is achieved by fulfilling the total power generation balance as well as the gap ofthe skeleton size, which is accomplished by applying the k-shortest path algorithm. Themethod searches for the three shortest paths between each generation unit in the systemas shown in Figure 3.3.
Figure 3.3. The k-shortes method: a) short-distance with two-side power source c) long-distancewith two-side power source
Figure 3.3 shows the energisation sequence according to k-shortest paths, this meansthat a) will be energised before b) and c). The identification of generator skeleton isperformed by searching for the three shortest path lines between the generating units,
24
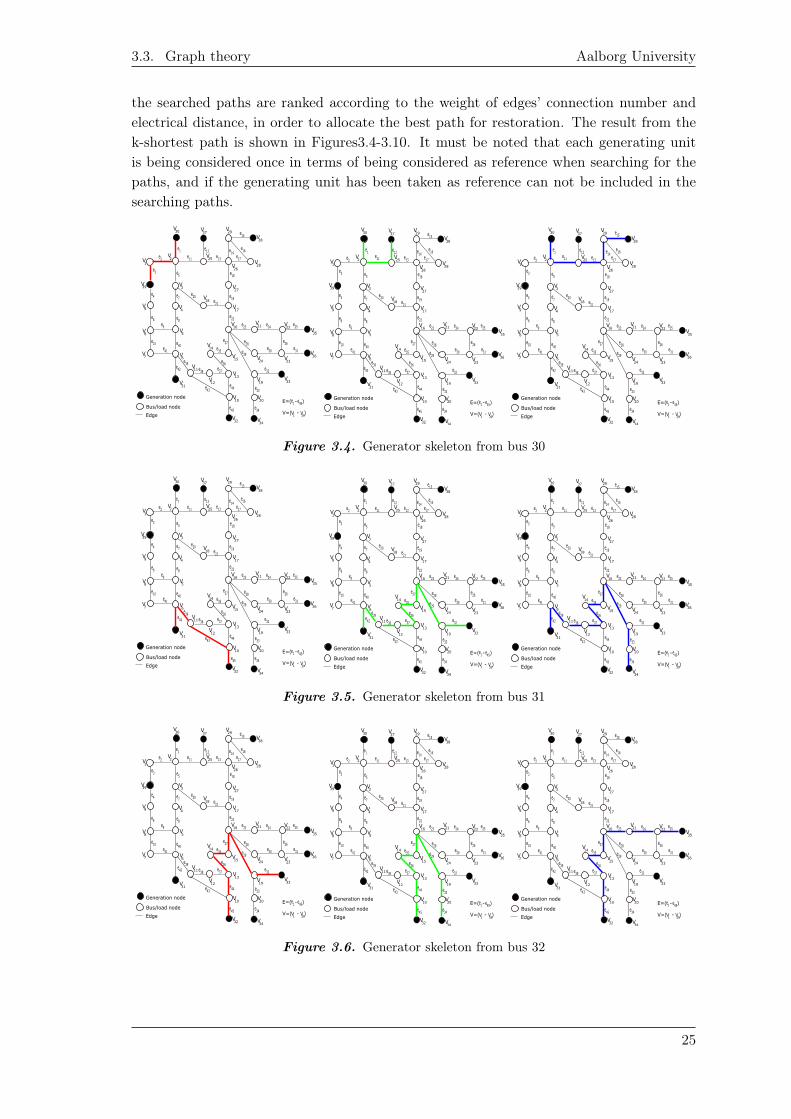
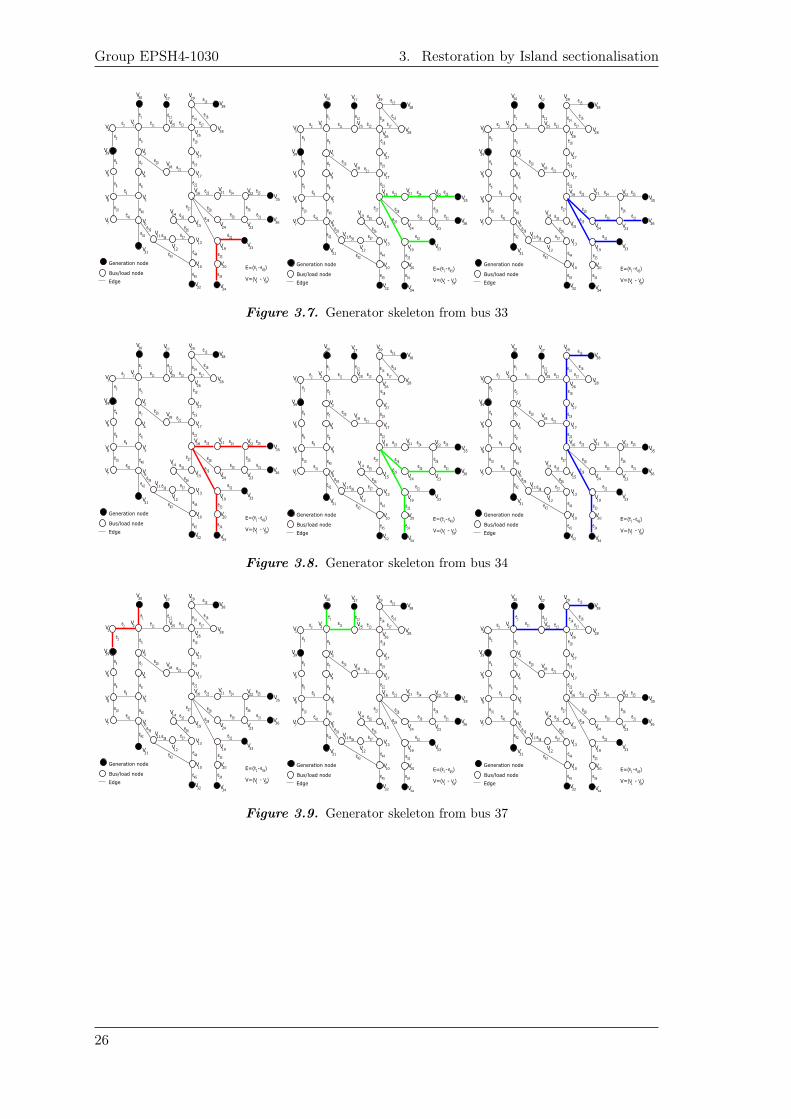
3.3. Graph theory Aalborg University
the searched paths are ranked according to the weight of edges’ connection number andelectrical distance, in order to allocate the best path for restoration. The result from thek-shortest path is shown in Figures3.4-3.10. It must be noted that each generating unitis being considered once in terms of being considered as reference when searching for thepaths, and if the generating unit has been taken as reference can not be included in thesearching paths.
V36
V30 V
37V38
V29
V25
V26
V28
V27
V17
V18
V16
V15
V13
V12
V11
V14
V10
V32
V1
V2
V6
V7
V9
V5
V3
V4
V21 V
22V35
V23
V24
V33
V20
V19
V34
e4
e5
e1
e40e35 e29
e7
e16
e30
e14
e18
e27
e25
e34
e39
e41
e2
e3
e22
e13
e21
e20
e15
e28
e17
e6 e8e9
e10
e11
e12
e19
e23 e24
e26e31
e32
e33
e37
e36e38
e42
e43
Generation node
Bus/load node
Edge
E=( - )e45 e1
V=( - )V1
V39
V31
V39
V8
e44
e45
Figure 3.4. Generator skeleton from bus 30
V36
V30 V
37V38
V29
V25
V26
V28
V27
V17
V18
V16
V15
V13
V12
V11
V14
V10
V32
V1
V2
V6
V7
V9
V5
V3
V4
V21 V
22V35
V23
V24
V33
V20
V19
V34
e4
e5
e1
e40e35 e29
e7
e16
e30
e14
e18
e27
e25
e34
e39
e41
e2
e3
e22
e13
e21
e20
e15
e28
e17
e6 e8e9
e10
e11
e12
e19
e23 e24
e26e31
e32
e33
e37
e36e38
e42
e43
Generation node
Bus/load node
Edge
E=( - )e45 e1
V=( - )V1
V39
V31
V39
V8
e44
e45
Figure 3.5. Generator skeleton from bus 31
V36
V30 V
37V38
V29
V25
V26
V28
V27
V17
V18
V16
V15
V13
V12
V11
V14
V10
V32
V1
V2
V6
V7
V9
V5
V3
V4
V21 V
22V35
V23
V24
V33
V20
V19
V34
e4
e5
e1
e40e35 e29
e7
e16
e30
e14
e18
e27
e25
e34
e39
e41
e2
e3
e22
e13
e21
e20
e15
e28
e17
e6 e8e9
e10
e11
e12
e19
e23 e24
e26e31
e32
e33
e37
e36e38
e42
e43
Generation node
Bus/load node
Edge
E=( - )e45 e1
V=( - )V1
V39
V31
V39
V8
e44
e45
Figure 3.6. Generator skeleton from bus 32
25
Group EPSH4-1030 3. Restoration by Island sectionalisation
V36
V30 V
37V38
V29
V25
V26
V28
V27
V17
V18
V16
V15
V13
V12
V11
V14
V10
V32
V1
V2
V6
V7
V9
V5
V3
V4
V21 V
22V35
V23
V24
V33
V20
V19
V34
e4
e5
e1
e40e35 e29
e7
e16
e30
e14
e18
e27
e25
e34
e39
e41
e2
e3
e22
e13
e21
e20
e15
e28
e17
e6 e8e9
e10
e11
e12
e19
e23 e24
e26e31
e32
e33
e37
e36e38
e42
e43
Generation node
Bus/load node
Edge
E=( - )e45 e1
V=( - )V1
V39
V31
V39
V8
e44
e45
Figure 3.7. Generator skeleton from bus 33
V36
V30 V
37V38
V29
V25
V26
V28
V27
V17
V18
V16
V15
V13
V12
V11
V14
V10
V32
V1
V2
V6
V7
V9
V5
V3
V4
V21 V
22V35
V23
V24
V33
V20
V19
V34
e4
e5
e1
e40e35 e29
e7
e16
e30
e14
e18
e27
e25
e34
e39
e41
e2
e3
e22
e13
e21
e20
e15
e28
e17
e6 e8e9
e10
e11
e12
e19
e23 e24
e26e31
e32
e33
e37
e36e38
e42
e43
Generation node
Bus/load node
Edge
E=( - )e45 e1
V=( - )V1
V39
V31
V39
V8
e44
e45
Figure 3.8. Generator skeleton from bus 34
V36
V30 V
37V38
V29
V25
V26
V28
V27
V17
V18
V16
V15
V13
V12
V11
V14
V10
V32
V1
V2
V6
V7
V9
V5
V3
V4
V21 V
22V35
V23
V24
V33
V20
V19
V34
e4
e5
e1
e40e35 e29
e7
e16
e30
e14
e18
e27
e25
e34
e39
e41
e2
e3
e22
e13
e21
e20
e15
e28
e17
e6 e8e9
e10
e11
e12
e19
e23 e24
e26e31
e32
e33
e37
e36e38
e42
e43
Generation node
Bus/load node
Edge
E=( - )e45 e1
V=( - )V1
V39
V31
V39
V8
e44
e45
Figure 3.9. Generator skeleton from bus 37
26
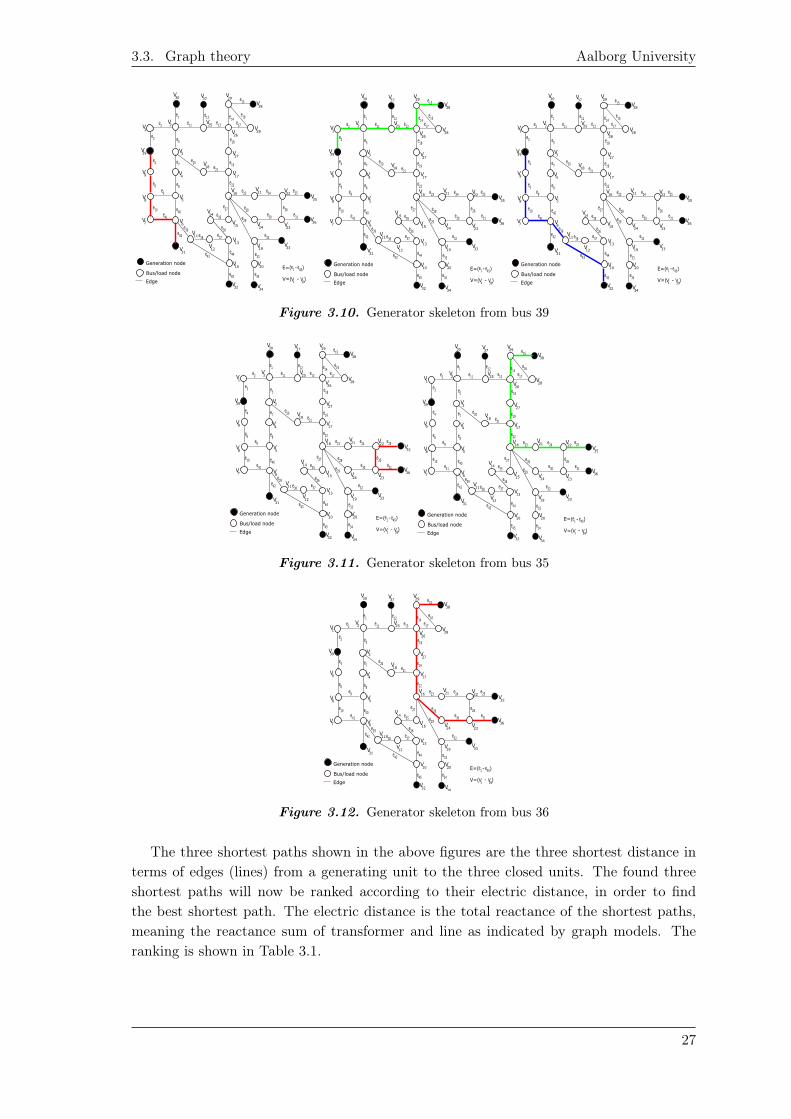
3.3. Graph theory Aalborg University
V36
V30 V
37V38
V29
V25
V26
V28
V27
V17
V18
V16
V15
V13
V12
V11
V14
V10
V32
V1
V2
V6
V7
V9
V5
V3
V4
V21 V
22V35
V23
V24
V33
V20
V19
V34
e4
e5
e1
e40e35 e29
e7
e16
e30
e14
e18
e27
e25
e34
e39
e41
e2
e3
e22
e13
e21
e20
e15
e28
e17
e6 e8e9
e10
e11
e12
e19
e23 e24
e26e31
e32
e33
e37
e36e38
e42
e43
Generation node
Bus/load node
Edge
E=( - )e45 e1
V=( - )V1
V39
V31
V39
V8
e44
e45
Figure 3.10. Generator skeleton from bus 39
V36
V30 V
37V38
V29
V25
V26
V28
V27
V17
V18
V16
V15
V13
V12
V11
V14
V10
V32
V1
V2
V6
V7
V9
V5
V3
V4
V21 V
22V35
V23
V24
V33
V20
V19
V34
e4
e5
e1
e40e35 e29
e7
e16
e30
e14
e18
e27
e25
e34
e39
e41
e2
e3
e22
e13
e21
e20
e15
e28
e17
e6 e8e9
e10
e11
e12
e19
e23 e24
e26e31
e32
e33
e37
e36e38
e42
e43
Generation node
Bus/load node
Edge
E=( - )e45 e1
V=( - )V1
V39
V31
V39
V8
e44
e45
Figure 3.11. Generator skeleton from bus 35
V36
V30 V
37V38
V29
V25
V26
V28
V27
V17
V18
V16
V15
V13
V12
V11
V14
V10
V32
V1
V2
V6
V7
V9
V5
V3
V4
V21 V
22V35
V23
V24
V33
V20
V19
V34
e4
e5
e1
e40e35 e29
e7
e16
e30
e14
e18
e27
e25
e34
e39
e41
e2
e3
e22
e13
e21
e20
e15
e28
e17
e6 e8e9
e10
e11
e12
e19
e23 e24
e26e31
e32
e33
e37
e36e38
e42
e43
Generation node
Bus/load node
Edge
E=( - )e45 e1
V=( - )V1
V39
V31
V39
V8
e44
e45
Figure 3.12. Generator skeleton from bus 36
The three shortest paths shown in the above figures are the three shortest distance interms of edges (lines) from a generating unit to the three closed units. The found threeshortest paths will now be ranked according to their electric distance, in order to findthe best shortest path. The electric distance is the total reactance of the shortest paths,meaning the reactance sum of transformer and line as indicated by graph models. Theranking is shown in Table 3.1.
27
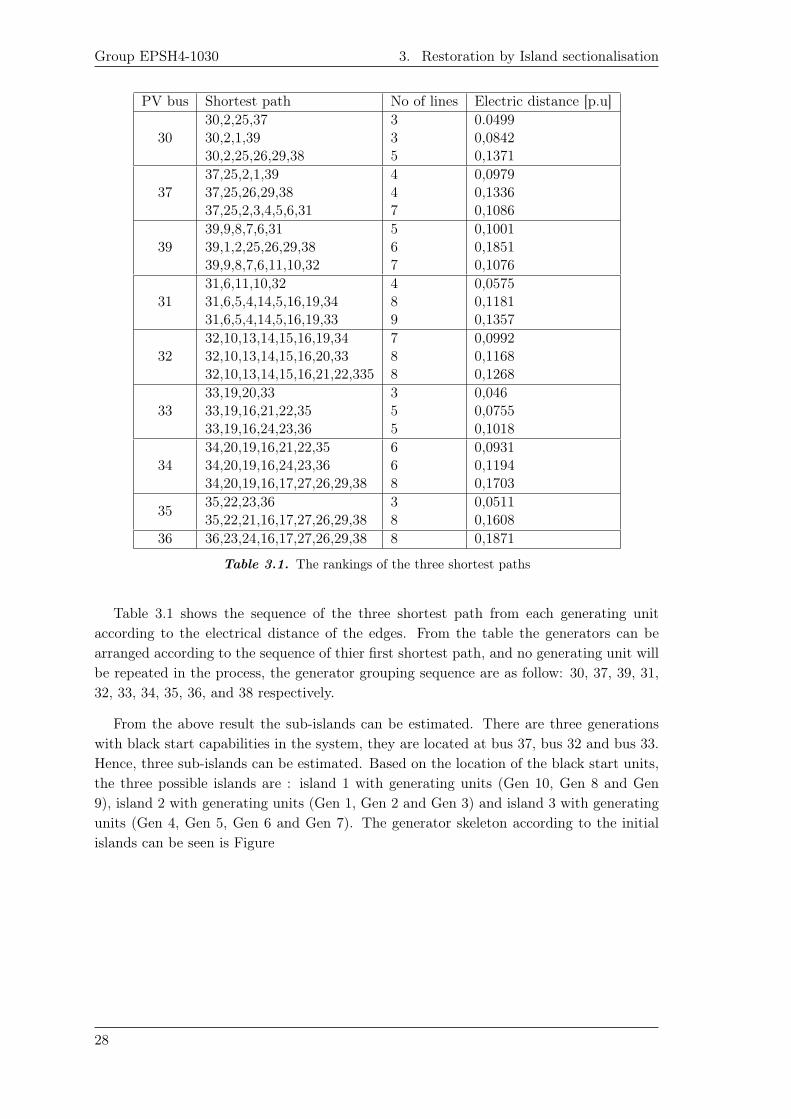
Group EPSH4-1030 3. Restoration by Island sectionalisation
PV bus Shortest path No of lines Electric distance [p.u]
3030,2,25,3730,2,1,3930,2,25,26,29,38
335
0.04990,08420,1371
3737,25,2,1,3937,25,26,29,3837,25,2,3,4,5,6,31
447
0,09790,13360,1086
3939,9,8,7,6,3139,1,2,25,26,29,3839,9,8,7,6,11,10,32
567
0,10010,18510,1076
3131,6,11,10,3231,6,5,4,14,5,16,19,3431,6,5,4,14,5,16,19,33
489
0,05750,11810,1357
3232,10,13,14,15,16,19,3432,10,13,14,15,16,20,3332,10,13,14,15,16,21,22,335
788
0,09920,11680,1268
3333,19,20,3333,19,16,21,22,3533,19,16,24,23,36
355
0,0460,07550,1018
3434,20,19,16,21,22,3534,20,19,16,24,23,3634,20,19,16,17,27,26,29,38
668
0,09310,11940,1703
35 35,22,23,3635,22,21,16,17,27,26,29,38
38
0,05110,1608
36 36,23,24,16,17,27,26,29,38 8 0,1871
Table 3.1. The rankings of the three shortest paths
Table 3.1 shows the sequence of the three shortest path from each generating unitaccording to the electrical distance of the edges. From the table the generators can bearranged according to the sequence of thier first shortest path, and no generating unit willbe repeated in the process, the generator grouping sequence are as follow: 30, 37, 39, 31,32, 33, 34, 35, 36, and 38 respectively.
From the above result the sub-islands can be estimated. There are three generationswith black start capabilities in the system, they are located at bus 37, bus 32 and bus 33.Hence, three sub-islands can be estimated. Based on the location of the black start units,the three possible islands are : island 1 with generating units (Gen 10, Gen 8 and Gen9), island 2 with generating units (Gen 1, Gen 2 and Gen 3) and island 3 with generatingunits (Gen 4, Gen 5, Gen 6 and Gen 7). The generator skeleton according to the initialislands can be seen is Figure
28
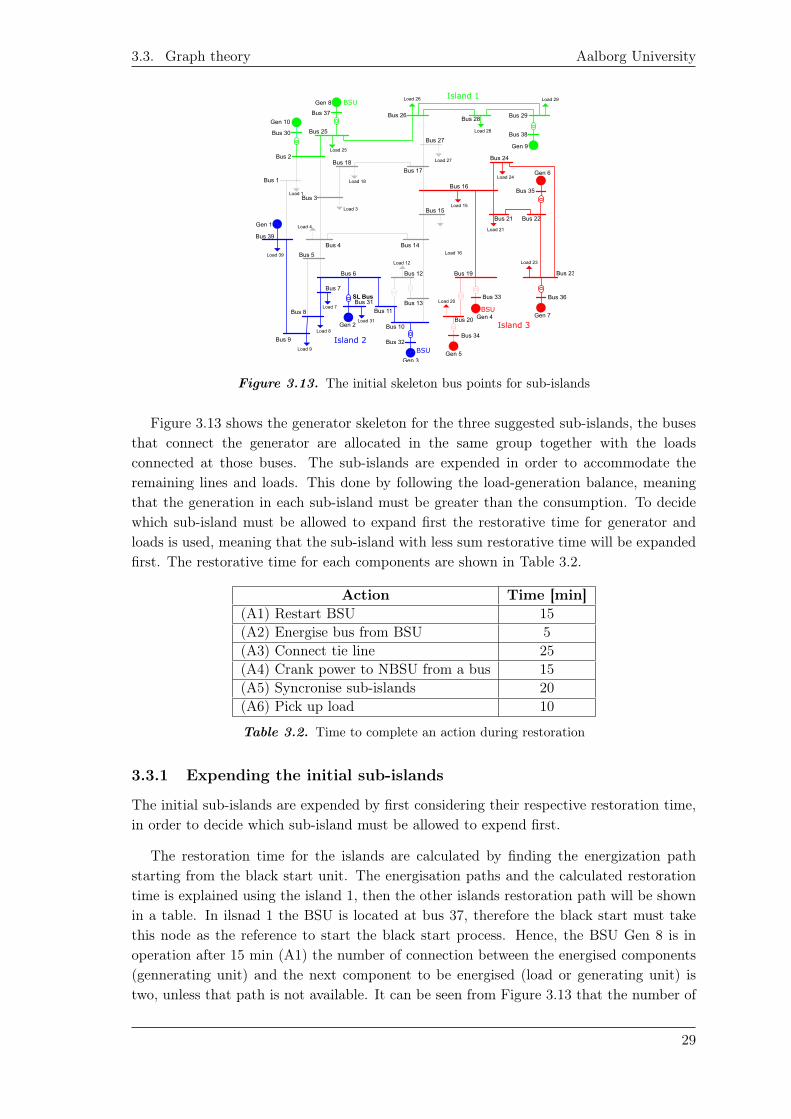
3.3. Graph theory Aalborg University
Gen 1
Gen 2
Gen 3
Gen 4
Gen 5
Gen 6
Gen 7
Gen 8
Gen 10
Gen 9
Bus 1
Bus 2
Bus 30
Bus 37
Bus 25
Bus 18Bus 17
Bus 27
Bus 26Bus 28
Bus 29
Bus 38
Bus 24
Bus 35
Bus 22Bus 21
Bus 16
Bus 15
Bus 19 Bus 23
Bus 36Bus 33
Bus 34Bus 32
Bus 20Bus 10
Bus 11Bus 13
Bus 9
Bus 8
Bus 6
Bus 14Bus 4
Bus 39
Bus 5
Bus 7
Bus 31
Bus 12
Load 25
Bus 3
Load 3
Load 18
Load 4
Load 39
Load 7
Load 8
Load 31
Load 12
Load 20
Load 15
Load 16
Load 21
Load 24
Load 27
Load 28
Load 26 Load 29
Load 23
Load 1
Load 9
SL Bus
Island 1
Island 2
Island 3
BSU
BSU
BSU
Figure 3.13. The initial skeleton bus points for sub-islands
Figure 3.13 shows the generator skeleton for the three suggested sub-islands, the busesthat connect the generator are allocated in the same group together with the loadsconnected at those buses. The sub-islands are expended in order to accommodate theremaining lines and loads. This done by following the load-generation balance, meaningthat the generation in each sub-island must be greater than the consumption. To decidewhich sub-island must be allowed to expand first the restorative time for generator andloads is used, meaning that the sub-island with less sum restorative time will be expandedfirst. The restorative time for each components are shown in Table 3.2.
Action Time [min](A1) Restart BSU 15(A2) Energise bus from BSU 5(A3) Connect tie line 25(A4) Crank power to NBSU from a bus 15(A5) Syncronise sub-islands 20(A6) Pick up load 10
Table 3.2. Time to complete an action during restoration
3.3.1 Expending the initial sub-islands
The initial sub-islands are expended by first considering their respective restoration time,in order to decide which sub-island must be allowed to expend first.
The restoration time for the islands are calculated by finding the energization pathstarting from the black start unit. The energisation paths and the calculated restorationtime is explained using the island 1, then the other islands restoration path will be shownin a table. In ilsnad 1 the BSU is located at bus 37, therefore the black start must takethis node as the reference to start the black start process. Hence, the BSU Gen 8 is inoperation after 15 min (A1) the number of connection between the energised components(gennerating unit) and the next component to be energised (load or generating unit) istwo, unless that path is not available. It can be seen from Figure 3.13 that the number of
29
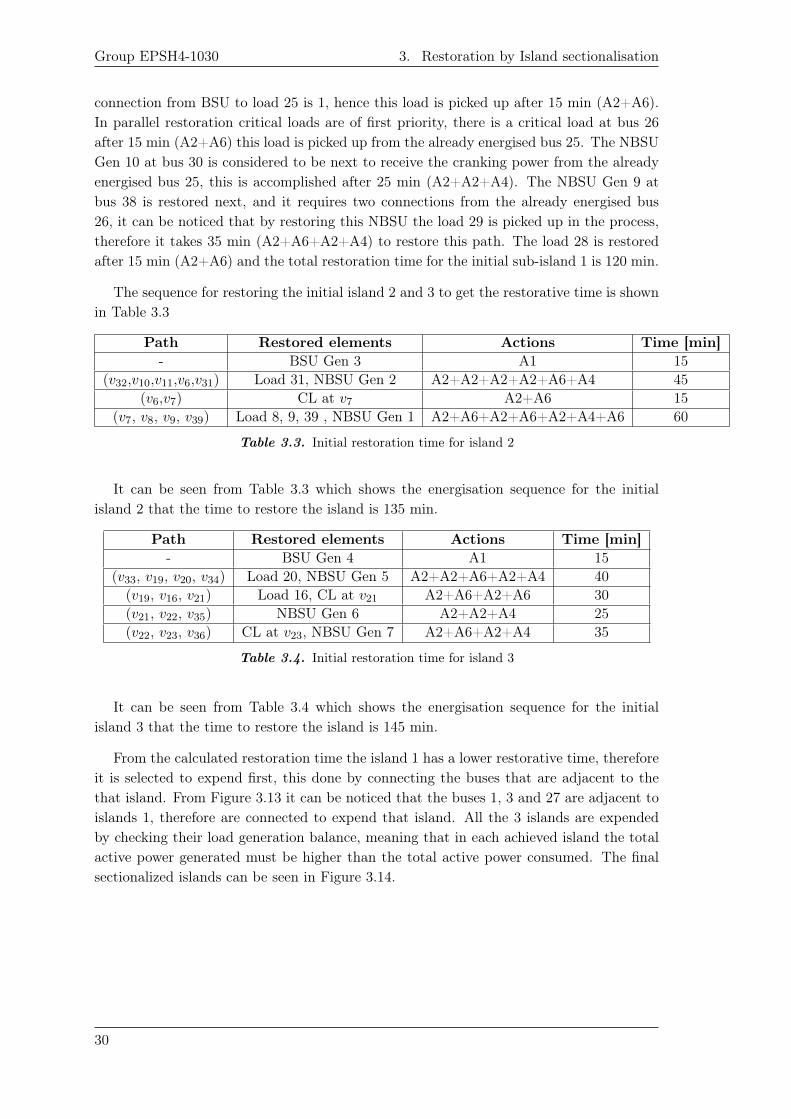
Group EPSH4-1030 3. Restoration by Island sectionalisation
connection from BSU to load 25 is 1, hence this load is picked up after 15 min (A2+A6).In parallel restoration critical loads are of first priority, there is a critical load at bus 26after 15 min (A2+A6) this load is picked up from the already energised bus 25. The NBSUGen 10 at bus 30 is considered to be next to receive the cranking power from the alreadyenergised bus 25, this is accomplished after 25 min (A2+A2+A4). The NBSU Gen 9 atbus 38 is restored next, and it requires two connections from the already energised bus26, it can be noticed that by restoring this NBSU the load 29 is picked up in the process,therefore it takes 35 min (A2+A6+A2+A4) to restore this path. The load 28 is restoredafter 15 min (A2+A6) and the total restoration time for the initial sub-island 1 is 120 min.
The sequence for restoring the initial island 2 and 3 to get the restorative time is shownin Table 3.3
Path Restored elements Actions Time [min]- BSU Gen 3 A1 15
(v32,v10,v11,v6,v31) Load 31, NBSU Gen 2 A2+A2+A2+A2+A6+A4 45(v6,v7) CL at v7 A2+A6 15
(v7, v8, v9, v39) Load 8, 9, 39 , NBSU Gen 1 A2+A6+A2+A6+A2+A4+A6 60
Table 3.3. Initial restoration time for island 2
It can be seen from Table 3.3 which shows the energisation sequence for the initialisland 2 that the time to restore the island is 135 min.
Path Restored elements Actions Time [min]- BSU Gen 4 A1 15
(v33, v19, v20, v34) Load 20, NBSU Gen 5 A2+A2+A6+A2+A4 40(v19, v16, v21) Load 16, CL at v21 A2+A6+A2+A6 30(v21, v22, v35) NBSU Gen 6 A2+A2+A4 25(v22, v23, v36) CL at v23, NBSU Gen 7 A2+A6+A2+A4 35
Table 3.4. Initial restoration time for island 3
It can be seen from Table 3.4 which shows the energisation sequence for the initialisland 3 that the time to restore the island is 145 min.
From the calculated restoration time the island 1 has a lower restorative time, thereforeit is selected to expend first, this done by connecting the buses that are adjacent to thethat island. From Figure 3.13 it can be noticed that the buses 1, 3 and 27 are adjacent toislands 1, therefore are connected to expend that island. All the 3 islands are expendedby checking their load generation balance, meaning that in each achieved island the totalactive power generated must be higher than the total active power consumed. The finalsectionalized islands can be seen in Figure 3.14.
30
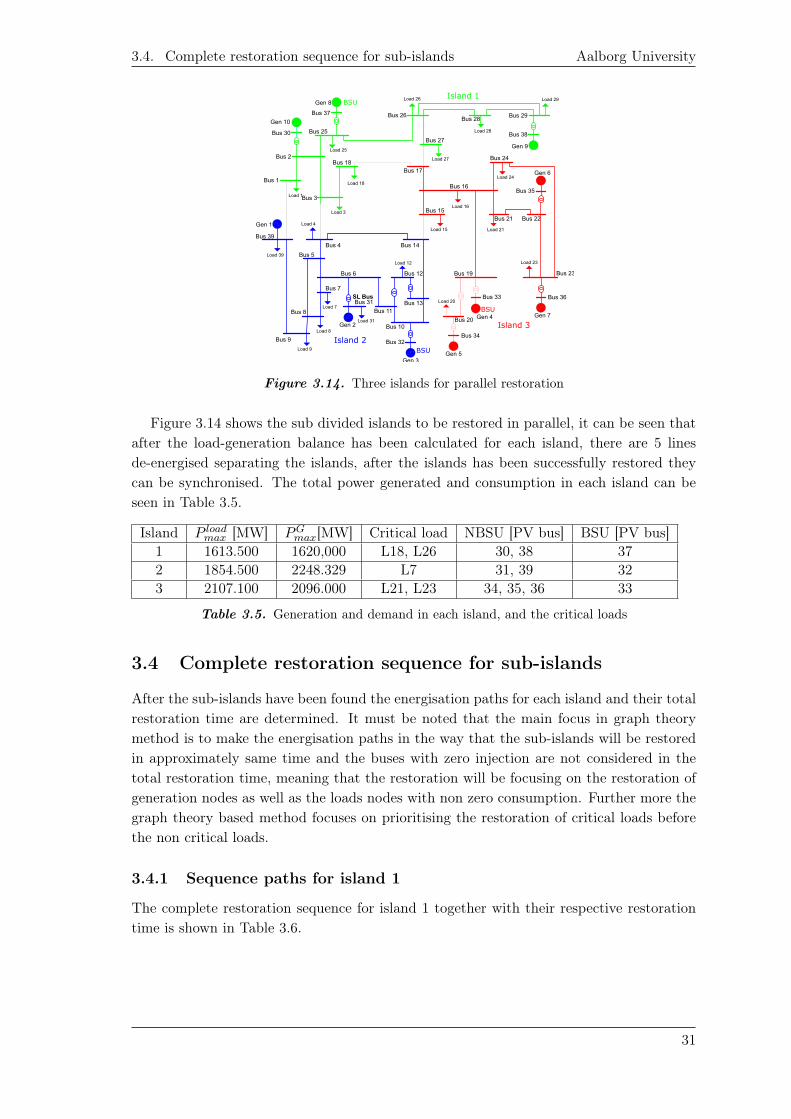
3.4. Complete restoration sequence for sub-islands Aalborg University
Gen 1
Gen 2
Gen 3
Gen 4
Gen 5
Gen 6
Gen 7
Gen 8
Gen 10
Gen 9
Bus 1
Bus 2
Bus 30
Bus 37
Bus 25
Bus 18Bus 17
Bus 27
Bus 26Bus 28
Bus 29
Bus 38
Bus 24
Bus 35
Bus 22Bus 21
Bus 16
Bus 15
Bus 19 Bus 23
Bus 36Bus 33
Bus 34Bus 32
Bus 20Bus 10
Bus 11Bus 13
Bus 9
Bus 8
Bus 6
Bus 14Bus 4
Bus 39
Bus 5
Bus 7
Bus 31
Bus 12
Load 25
Bus 3
Load 3
Load 18
Load 4
Load 39
Load 7
Load 8
Load 31
Load 12
Load 20
Load 15
Load 16
Load 21
Load 24
Load 27
Load 28
Load 26 Load 29
Load 23
Load 1
Load 9
SL Bus
Island 1
Island 2
Island 3
BSU
BSU
BSU
Figure 3.14. Three islands for parallel restoration
Figure 3.14 shows the sub divided islands to be restored in parallel, it can be seen thatafter the load-generation balance has been calculated for each island, there are 5 linesde-energised separating the islands, after the islands has been successfully restored theycan be synchronised. The total power generated and consumption in each island can beseen in Table 3.5.
Island P loadmax [MW] PG
max[MW] Critical load NBSU [PV bus] BSU [PV bus]1 1613.500 1620,000 L18, L26 30, 38 372 1854.500 2248.329 L7 31, 39 323 2107.100 2096.000 L21, L23 34, 35, 36 33
Table 3.5. Generation and demand in each island, and the critical loads
3.4 Complete restoration sequence for sub-islands
After the sub-islands have been found the energisation paths for each island and their totalrestoration time are determined. It must be noted that the main focus in graph theorymethod is to make the energisation paths in the way that the sub-islands will be restoredin approximately same time and the buses with zero injection are not considered in thetotal restoration time, meaning that the restoration will be focusing on the restoration ofgeneration nodes as well as the loads nodes with non zero consumption. Further more thegraph theory based method focuses on prioritising the restoration of critical loads beforethe non critical loads.
3.4.1 Sequence paths for island 1
The complete restoration sequence for island 1 together with their respective restorationtime is shown in Table 3.6.
31
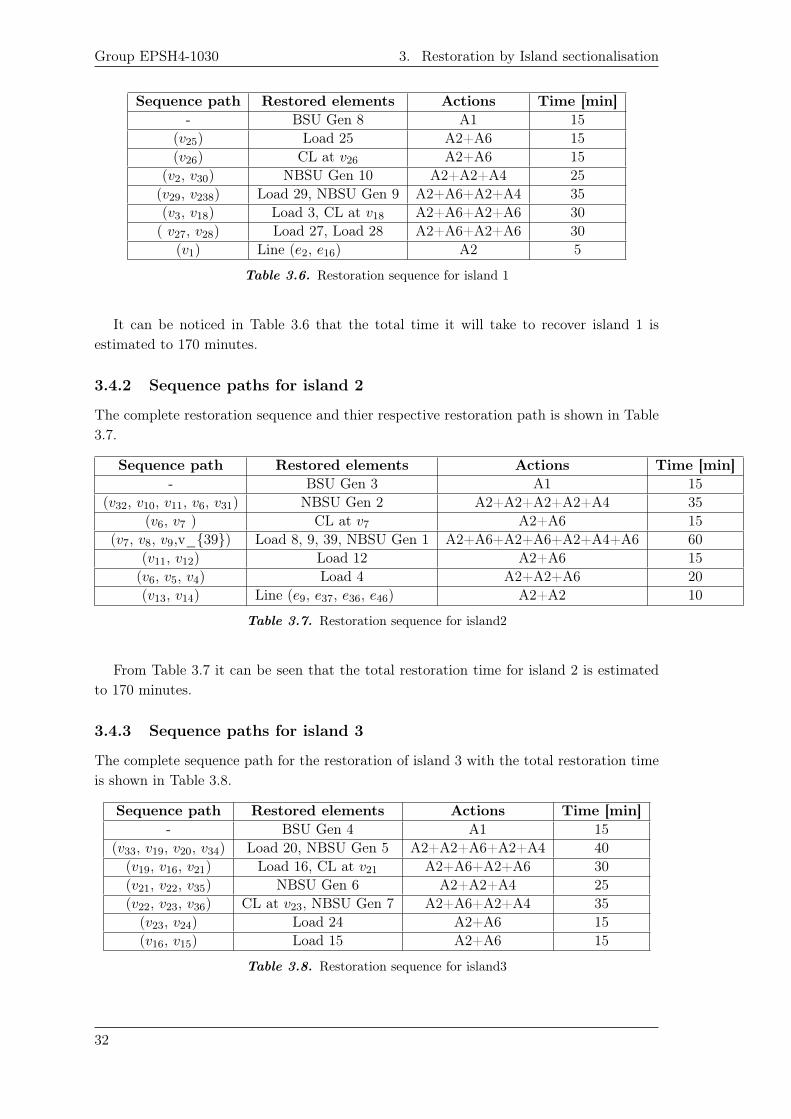
Group EPSH4-1030 3. Restoration by Island sectionalisation
Sequence path Restored elements Actions Time [min]- BSU Gen 8 A1 15
(v25) Load 25 A2+A6 15(v26) CL at v26 A2+A6 15
(v2, v30) NBSU Gen 10 A2+A2+A4 25(v29, v238) Load 29, NBSU Gen 9 A2+A6+A2+A4 35(v3, v18) Load 3, CL at v18 A2+A6+A2+A6 30( v27, v28) Load 27, Load 28 A2+A6+A2+A6 30
(v1) Line (e2, e16) A2 5
Table 3.6. Restoration sequence for island 1
It can be noticed in Table 3.6 that the total time it will take to recover island 1 isestimated to 170 minutes.
3.4.2 Sequence paths for island 2
The complete restoration sequence and thier respective restoration path is shown in Table3.7.
Sequence path Restored elements Actions Time [min]- BSU Gen 3 A1 15
(v32, v10, v11, v6, v31) NBSU Gen 2 A2+A2+A2+A2+A4 35(v6, v7 ) CL at v7 A2+A6 15
(v7, v8, v9,v_39) Load 8, 9, 39, NBSU Gen 1 A2+A6+A2+A6+A2+A4+A6 60(v11, v12) Load 12 A2+A6 15(v6, v5, v4) Load 4 A2+A2+A6 20(v13, v14) Line (e9, e37, e36, e46) A2+A2 10
Table 3.7. Restoration sequence for island2
From Table 3.7 it can be seen that the total restoration time for island 2 is estimatedto 170 minutes.
3.4.3 Sequence paths for island 3
The complete sequence path for the restoration of island 3 with the total restoration timeis shown in Table 3.8.
Sequence path Restored elements Actions Time [min]- BSU Gen 4 A1 15
(v33, v19, v20, v34) Load 20, NBSU Gen 5 A2+A2+A6+A2+A4 40(v19, v16, v21) Load 16, CL at v21 A2+A6+A2+A6 30(v21, v22, v35) NBSU Gen 6 A2+A2+A4 25(v22, v23, v36) CL at v23, NBSU Gen 7 A2+A6+A2+A4 35(v23, v24) Load 24 A2+A6 15(v16, v15) Load 15 A2+A6 15
Table 3.8. Restoration sequence for island3
32
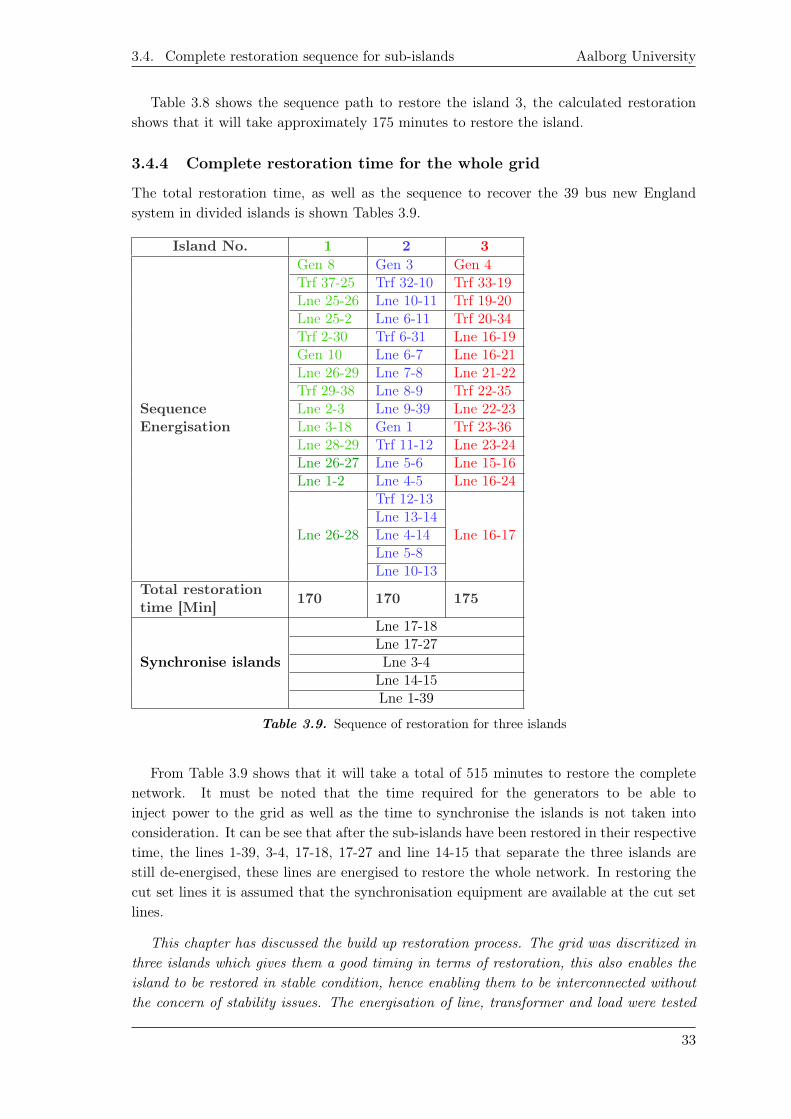
3.4. Complete restoration sequence for sub-islands Aalborg University
Table 3.8 shows the sequence path to restore the island 3, the calculated restorationshows that it will take approximately 175 minutes to restore the island.
3.4.4 Complete restoration time for the whole grid
The total restoration time, as well as the sequence to recover the 39 bus new Englandsystem in divided islands is shown Tables 3.9.
Island No. 1 2 3Gen 8 Gen 3 Gen 4Trf 37-25 Trf 32-10 Trf 33-19Lne 25-26 Lne 10-11 Trf 19-20Lne 25-2 Lne 6-11 Trf 20-34Trf 2-30 Trf 6-31 Lne 16-19Gen 10 Lne 6-7 Lne 16-21Lne 26-29 Lne 7-8 Lne 21-22Trf 29-38 Lne 8-9 Trf 22-35Lne 2-3 Lne 9-39 Lne 22-23Lne 3-18 Gen 1 Trf 23-36Lne 28-29 Trf 11-12 Lne 23-24Lne 26-27 Lne 5-6 Lne 15-16Lne 1-2 Lne 4-5 Lne 16-24
Trf 12-13Lne 13-14Lne 4-14Lne 5-8
SequenceEnergisation
Lne 26-28
Lne 10-13
Lne 16-17
Total restorationtime [Min] 170 170 175
Lne 17-18Lne 17-27Lne 3-4Lne 14-15
Synchronise islands
Lne 1-39
Table 3.9. Sequence of restoration for three islands
From Table 3.9 shows that it will take a total of 515 minutes to restore the completenetwork. It must be noted that the time required for the generators to be able toinject power to the grid as well as the time to synchronise the islands is not taken intoconsideration. It can be see that after the sub-islands have been restored in their respectivetime, the lines 1-39, 3-4, 17-18, 17-27 and line 14-15 that separate the three islands arestill de-energised, these lines are energised to restore the whole network. In restoring thecut set lines it is assumed that the synchronisation equipment are available at the cut setlines.
This chapter has discussed the build up restoration process. The grid was discritized inthree islands which gives them a good timing in terms of restoration, this also enables theisland to be restored in stable condition, hence enabling them to be interconnected withoutthe concern of stability issues. The energisation of line, transformer and load were tested
33

Group EPSH4-1030 3. Restoration by Island sectionalisation
in both normal EMT simulation mode and in hybrid mode, it is shown that when the hybridmode is utilised to switch on elements in order to analyse the transient phenomena thereless transient resulting after the event which makes it easy to analyse the behaviour of thecomponents after the event.
-
34
A Flexible SimulationPlatform for Black Start 4
This chapter discusses the developed simulation platform for power system restoration. Thealgorithm considers the total blackout scenario, where every generator in the system can beconsidered to act as a black start unit. The shortest line path from the generator to an othergenerator is searched for energisation, and the search sequence continues from the alreadyenergised bus. The grid regulations for frequency and voltage is taken into considerationduring the process. To minimise the violation of grid regulations two cases are proposed:1) the detouring process, in this case when the energisation path is not available due tothe fact that the voltage limit is violated the search continues to the next shortest availablepath. 2) By considering the tap changer to regulate the system voltage, in this case whenthe voltage limit is violated transformer on load tap changer (OLTC) will be activated totry to regulate the voltage. The path search algorithm is developed with PDL scripts inPowerFactor.
4.1 Path searching algorithm
The path search algorithm is explained in a flow chart diagram in Figure 4.1, where Brepresent the sets of black-start units, E for energized substations, D for de-energizedsubstations, U for unavailable branches and L for de-energized branches.
The first step in the black start process according is to assess the extent of blackout, thisis done by checking the status of all switches, generators, substations, transformers, cablesand transmission lines. The generating units with black start capabilities are consideredto crank power to non-black start units.
The second step is to find the sequence of generation units starting from the black-startunit, then the path searching algorithm Figure 4.1 is implemented to find the transmissionpath to implement the sequence. All the switches and breakers along the path are searchedout. Then the actions of closing switches and breakers will be arranged in sequence asswitch events. For each switch event, the grid regulations, which includes the criteria ofvoltage and frequency, will be checked by time-domain (T-D) simulation. After all thesubstations are energized, the final step is to restore the remaining de-energized branchesfrom the one with the shortest electric distance. In this thesis, at each step of the searchingpath algorithm, e.g. Step m, the branch connecting one energized substation iεE and onede-energized substation j ε D with the shortest electric distance, i.e. dij,m=dmin,m, hashighest priority to be connected. This is because the energization of long-distance branches,especially long under-ground cables, may result in large charging current when the grid
35
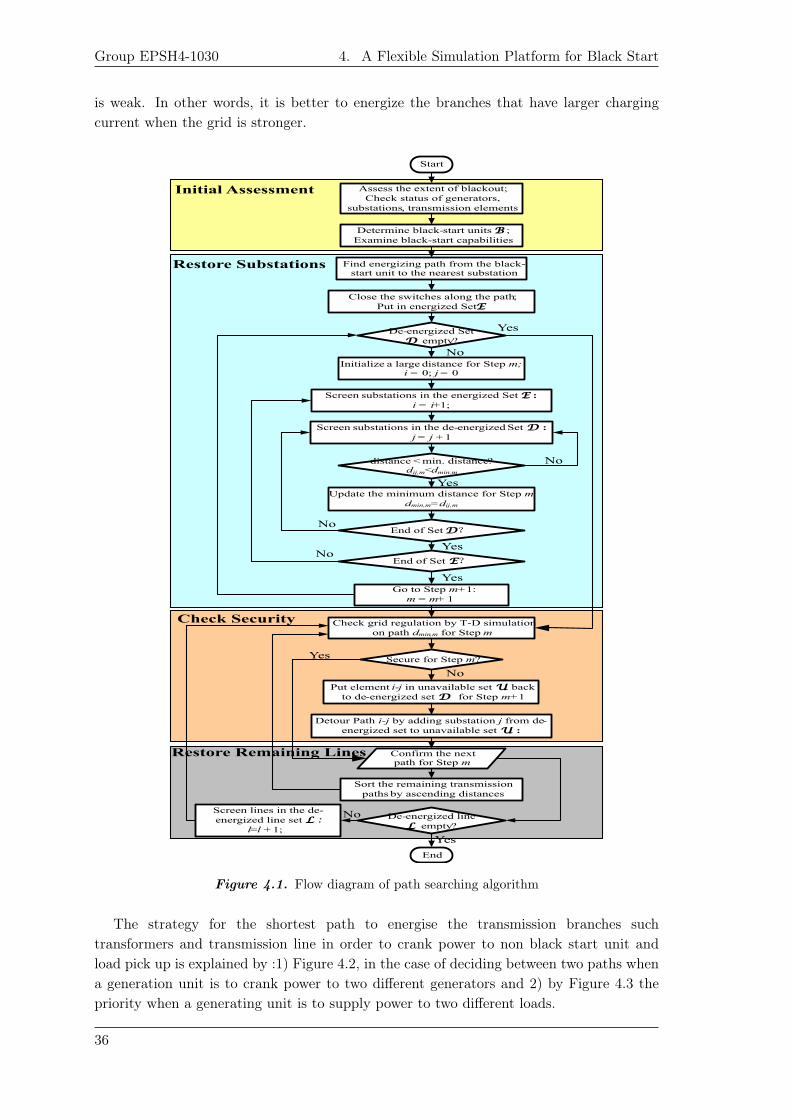
Group EPSH4-1030 4. A Flexible Simulation Platform for Black Start
is weak. In other words, it is better to energize the branches that have larger chargingcurrent when the grid is stronger.
Restore Remaining Lines
Start
Assess the extent of blackout;Check status of generators,
substations, transmission elements
Determine black-start units B ; Examine black-start capabilities
Find energizing path from the black-start unit to the nearest substation
Close the switches along the path; Put in energized SetE
De-energized SetD empty?
distance < min. distance?dij,m<dmin,m
Update the minimum distance for Step mdmin,m=dij,m
Initialize a large distance for Step m;i = 0; j = 0
End
Check grid regulation by T-D simulationon path dmin,m for Step m
Secure for Step m?
Detour Path i-j by adding substation j from de-energized set to unavailable set U :
Sort the remaining transmission paths by ascending distances
Put element i-j in unavailable set U back to de-energized set D for Step m+1
Go to Step m+1: m = m+ 1
End of Set D?
End of Set E?
Screen substations in the energized Set E :i = i+1;
Screen substations in the de-energized Set D :j = j + 1
Confirm the next path for Step m
De-energized lineL empty?
Initial Assessment
Restore Substations
Check Security
Screen lines in the de-energized line set L :
l=l + 1;
Yes
No
Yes
Yes
No
No
No
Yes
Yes
No
Yes
No
Figure 4.1. Flow diagram of path searching algorithm
The strategy for the shortest path to energise the transmission branches suchtransformers and transmission line in order to crank power to non black start unit andload pick up is explained by :1) Figure 4.2, in the case of deciding between two paths whena generation unit is to crank power to two different generators and 2) by Figure 4.3 thepriority when a generating unit is to supply power to two different loads.
36
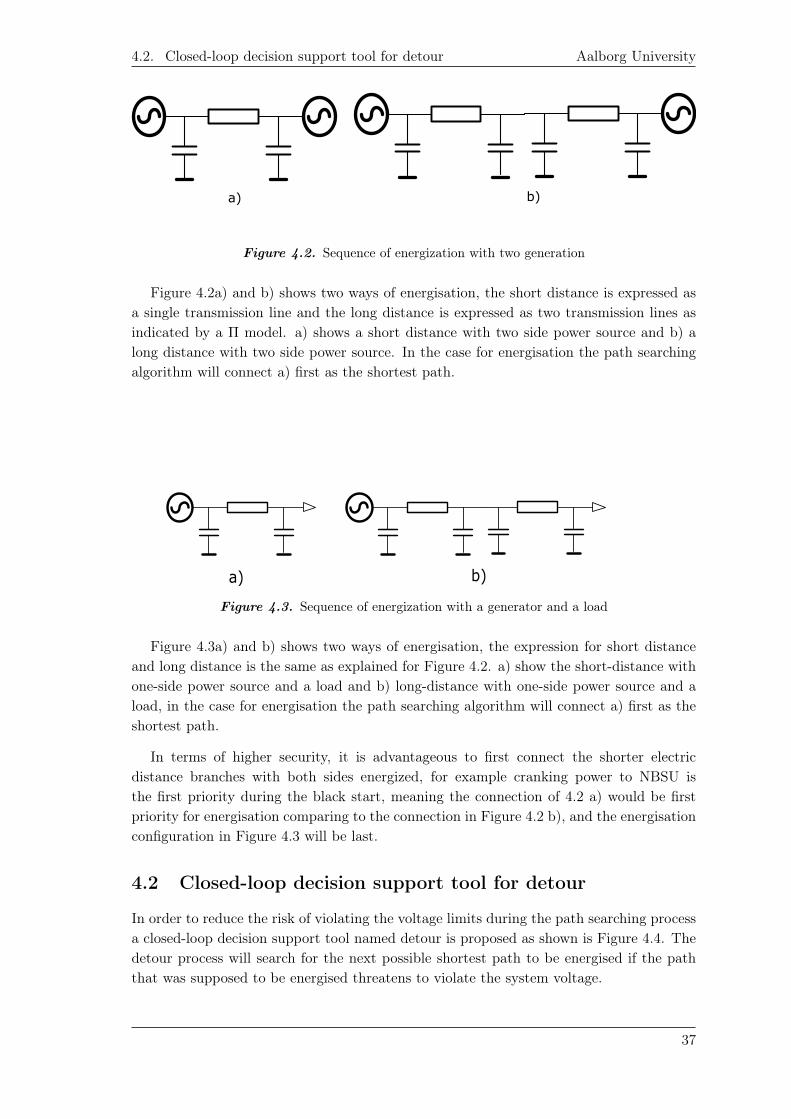
4.2. Closed-loop decision support tool for detour Aalborg University
a) b)
Figure 4.2. Sequence of energization with two generation
Figure 4.2a) and b) shows two ways of energisation, the short distance is expressed asa single transmission line and the long distance is expressed as two transmission lines asindicated by a Π model. a) shows a short distance with two side power source and b) along distance with two side power source. In the case for energisation the path searchingalgorithm will connect a) first as the shortest path.
a) b)
Figure 4.3. Sequence of energization with a generator and a load
Figure 4.3a) and b) shows two ways of energisation, the expression for short distanceand long distance is the same as explained for Figure 4.2. a) show the short-distance withone-side power source and a load and b) long-distance with one-side power source and aload, in the case for energisation the path searching algorithm will connect a) first as theshortest path.
In terms of higher security, it is advantageous to first connect the shorter electricdistance branches with both sides energized, for example cranking power to NBSU isthe first priority during the black start, meaning the connection of 4.2 a) would be firstpriority for energisation comparing to the connection in Figure 4.2 b), and the energisationconfiguration in Figure 4.3 will be last.
4.2 Closed-loop decision support tool for detour
In order to reduce the risk of violating the voltage limits during the path searching processa closed-loop decision support tool named detour is proposed as shown is Figure 4.4. Thedetour process will search for the next possible shortest path to be energised if the paththat was supposed to be energised threatens to violate the system voltage.
37
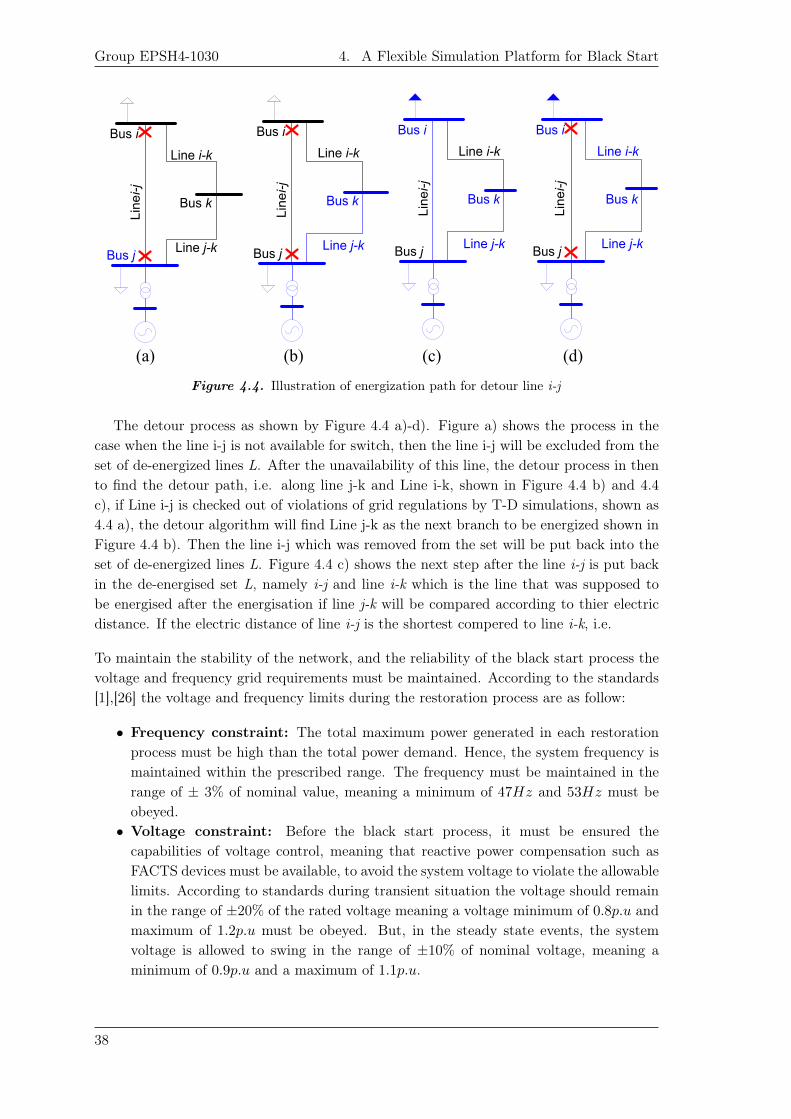
Group EPSH4-1030 4. A Flexible Simulation Platform for Black Start
Bus iL
inei-j
Bus jLine j-k
Bus k
Line i-k
Bus i
Lin
ei-j
Bus jLine j-k
Bus k
Line i-k
Bus i
Lin
ei-j
Bus jLine j-k
Bus k
Line i-k
Bus i
Lin
ei-j
Bus jLine j-k
Bus k
Line i-k
(a) (b) (c) (d)
Figure 4.4. Illustration of energization path for detour line i-j
The detour process as shown by Figure 4.4 a)-d). Figure a) shows the process in thecase when the line i-j is not available for switch, then the line i-j will be excluded from theset of de-energized lines L. After the unavailability of this line, the detour process in thento find the detour path, i.e. along line j-k and Line i-k, shown in Figure 4.4 b) and 4.4c), if Line i-j is checked out of violations of grid regulations by T-D simulations, shown as4.4 a), the detour algorithm will find Line j-k as the next branch to be energized shown inFigure 4.4 b). Then the line i-j which was removed from the set will be put back into theset of de-energized lines L. Figure 4.4 c) shows the next step after the line i-j is put backin the de-energised set L, namely i-j and line i-k which is the line that was supposed tobe energised after the energisation if line j-k will be compared according to thier electricdistance. If the electric distance of line i-j is the shortest compered to line i-k, i.e.
To maintain the stability of the network, and the reliability of the black start process thevoltage and frequency grid requirements must be maintained. According to the standards[1],[26] the voltage and frequency limits during the restoration process are as follow:
• Frequency constraint: The total maximum power generated in each restorationprocess must be high than the total power demand. Hence, the system frequency ismaintained within the prescribed range. The frequency must be maintained in therange of ± 3% of nominal value, meaning a minimum of 47Hz and 53Hz must beobeyed.
• Voltage constraint: Before the black start process, it must be ensured thecapabilities of voltage control, meaning that reactive power compensation such asFACTS devices must be available, to avoid the system voltage to violate the allowablelimits. According to standards during transient situation the voltage should remainin the range of ±20% of the rated voltage meaning a voltage minimum of 0.8p.u andmaximum of 1.2p.u must be obeyed. But, in the steady state events, the systemvoltage is allowed to swing in the range of ±10% of nominal voltage, meaning aminimum of 0.9p.u and a maximum of 1.1p.u.
38
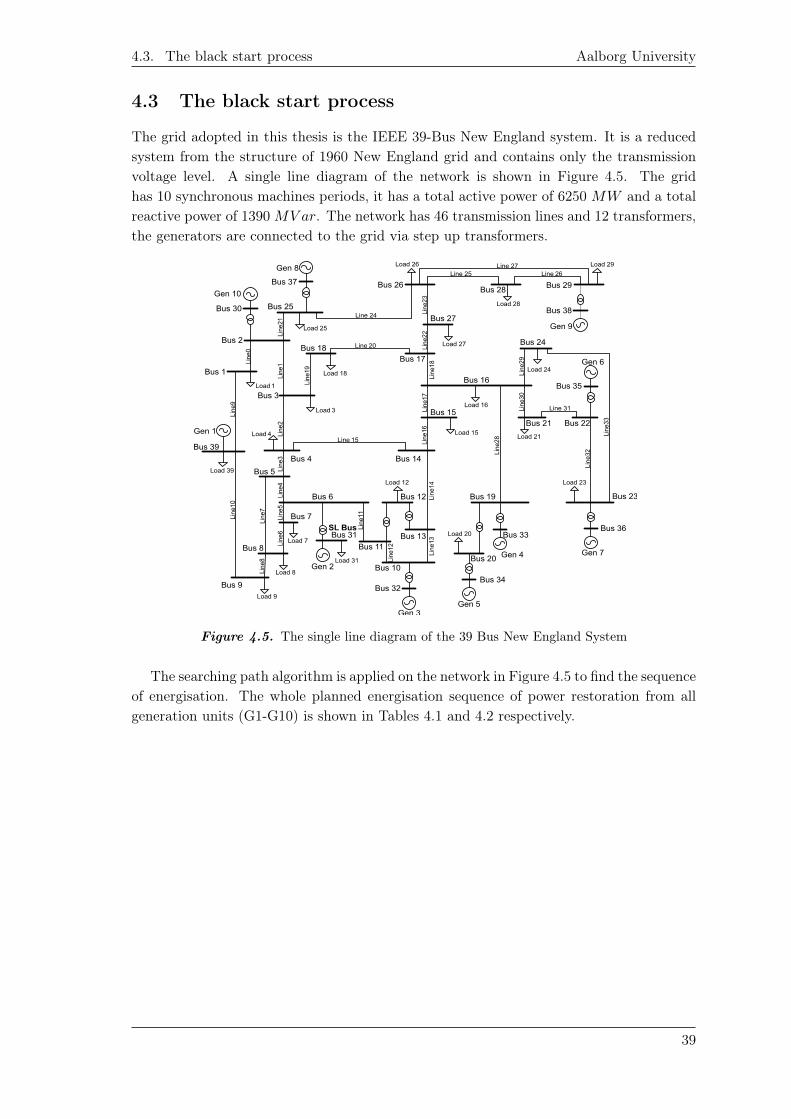
4.3. The black start process Aalborg University
4.3 The black start process
The grid adopted in this thesis is the IEEE 39-Bus New England system. It is a reducedsystem from the structure of 1960 New England grid and contains only the transmissionvoltage level. A single line diagram of the network is shown in Figure 4.5. The gridhas 10 synchronous machines periods, it has a total active power of 6250 MW and a totalreactive power of 1390MV ar. The network has 46 transmission lines and 12 transformers,the generators are connected to the grid via step up transformers.
Gen 1
Gen 2
Gen 3
Gen 4
Gen 5
Gen 6
Gen 7
Gen 8
Gen 10
Gen 9
Bus 1
Bus 2
Bus 30
Bus 37
Bus 25
Bus 18Bus 17
Bus 27
Bus 26Bus 28
Bus 29
Bus 38
Bus 24
Bus 35
Bus 22Bus 21
Bus 16
Bus 15
Bus 19 Bus 23
Bus 36Bus 33
Bus 34Bus 32
Bus 20Bus 10
Bus 11Bus 13
Bus 9
Bus 8
Bus 6
Bus 14Bus 4
Bus 39
Bus 5
Bus 7
Bus 31
Bus 12
Line 27Line 25 Line 26
Line 31
Line
32
Line
33
Line
28
Line
13
Line
12
Line
11
Line
6
Line
7
Line
4
Line
10
Line
2Li
ne1
Line
19
Line
0
Line
9
Line
21
Line
8
Line 20
Line 24
Line 15
Line
14Li
ne16
Line
17Li
ne18
Line
30Li
ne29
Load 25
Bus 3
Load 3
Load 18
Load 4
Load 39
Load 7
Load 8
Load 31
Load 12
Load 20
Load 15
Load 16
Load 21
Load 24
Load 27
Load 28
Load 26 Load 29
Load 23
Line
3Li
ne5
Line
22Li
ne23
Load 1
Load 9
SL Bus
Figure 4.5. The single line diagram of the 39 Bus New England System
The searching path algorithm is applied on the network in Figure 4.5 to find the sequenceof energisation. The whole planned energisation sequence of power restoration from allgeneration units (G1-G10) is shown in Tables 4.1 and 4.2 respectively.
39
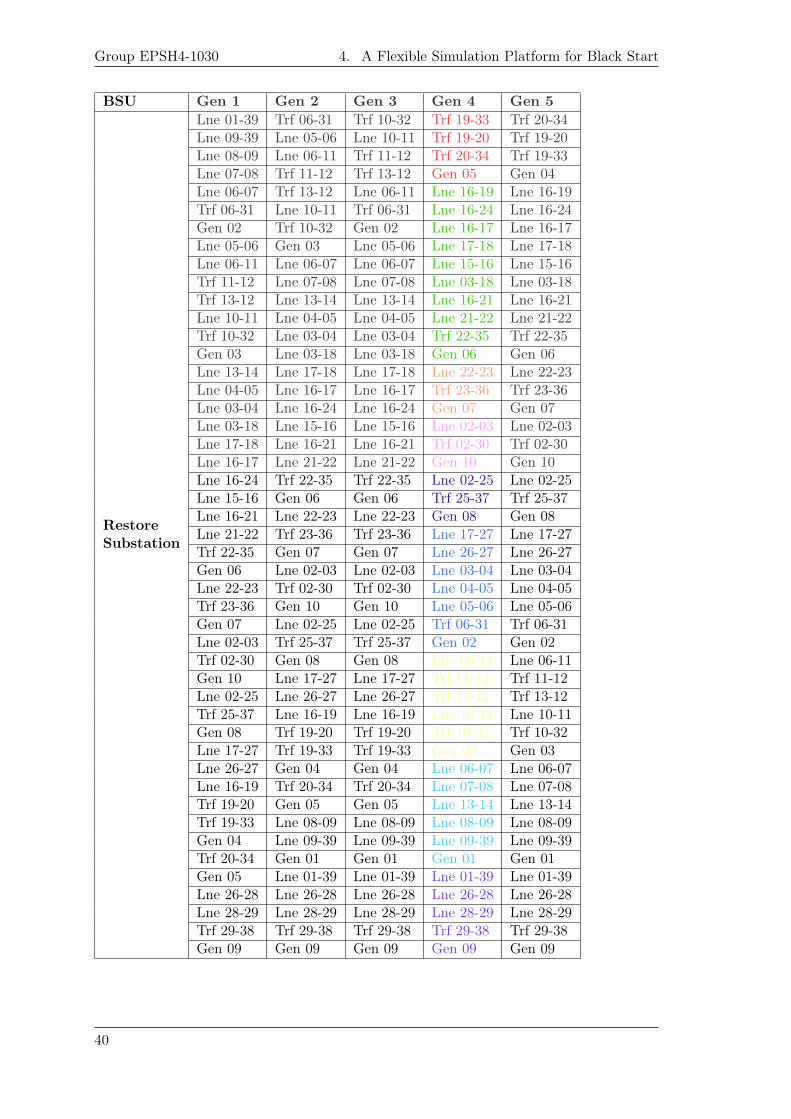
Group EPSH4-1030 4. A Flexible Simulation Platform for Black Start
BSU Gen 1 Gen 2 Gen 3 Gen 4 Gen 5Lne 01-39 Trf 06-31 Trf 10-32 Trf 19-33 Trf 20-34Lne 09-39 Lne 05-06 Lne 10-11 Trf 19-20 Trf 19-20Lne 08-09 Lne 06-11 Trf 11-12 Trf 20-34 Trf 19-33Lne 07-08 Trf 11-12 Trf 13-12 Gen 05 Gen 04Lne 06-07 Trf 13-12 Lne 06-11 Lne 16-19 Lne 16-19Trf 06-31 Lne 10-11 Trf 06-31 Lne 16-24 Lne 16-24Gen 02 Trf 10-32 Gen 02 Lne 16-17 Lne 16-17Lne 05-06 Gen 03 Lne 05-06 Lne 17-18 Lne 17-18Lne 06-11 Lne 06-07 Lne 06-07 Lne 15-16 Lne 15-16Trf 11-12 Lne 07-08 Lne 07-08 Lne 03-18 Lne 03-18Trf 13-12 Lne 13-14 Lne 13-14 Lne 16-21 Lne 16-21Lne 10-11 Lne 04-05 Lne 04-05 Lne 21-22 Lne 21-22Trf 10-32 Lne 03-04 Lne 03-04 Trf 22-35 Trf 22-35Gen 03 Lne 03-18 Lne 03-18 Gen 06 Gen 06Lne 13-14 Lne 17-18 Lne 17-18 Lne 22-23 Lne 22-23Lne 04-05 Lne 16-17 Lne 16-17 Trf 23-36 Trf 23-36Lne 03-04 Lne 16-24 Lne 16-24 Gen 07 Gen 07Lne 03-18 Lne 15-16 Lne 15-16 Lne 02-03 Lne 02-03Lne 17-18 Lne 16-21 Lne 16-21 Trf 02-30 Trf 02-30Lne 16-17 Lne 21-22 Lne 21-22 Gen 10 Gen 10Lne 16-24 Trf 22-35 Trf 22-35 Lne 02-25 Lne 02-25Lne 15-16 Gen 06 Gen 06 Trf 25-37 Trf 25-37Lne 16-21 Lne 22-23 Lne 22-23 Gen 08 Gen 08Lne 21-22 Trf 23-36 Trf 23-36 Lne 17-27 Lne 17-27Trf 22-35 Gen 07 Gen 07 Lne 26-27 Lne 26-27Gen 06 Lne 02-03 Lne 02-03 Lne 03-04 Lne 03-04Lne 22-23 Trf 02-30 Trf 02-30 Lne 04-05 Lne 04-05Trf 23-36 Gen 10 Gen 10 Lne 05-06 Lne 05-06Gen 07 Lne 02-25 Lne 02-25 Trf 06-31 Trf 06-31Lne 02-03 Trf 25-37 Trf 25-37 Gen 02 Gen 02Trf 02-30 Gen 08 Gen 08 Lne 06-11 Lne 06-11Gen 10 Lne 17-27 Lne 17-27 Trf 11-12 Trf 11-12Lne 02-25 Lne 26-27 Lne 26-27 Trf 13-12 Trf 13-12Trf 25-37 Lne 16-19 Lne 16-19 Lne 10-11 Lne 10-11Gen 08 Trf 19-20 Trf 19-20 Trf 10-32 Trf 10-32Lne 17-27 Trf 19-33 Trf 19-33 Gen 03 Gen 03Lne 26-27 Gen 04 Gen 04 Lne 06-07 Lne 06-07Lne 16-19 Trf 20-34 Trf 20-34 Lne 07-08 Lne 07-08Trf 19-20 Gen 05 Gen 05 Lne 13-14 Lne 13-14Trf 19-33 Lne 08-09 Lne 08-09 Lne 08-09 Lne 08-09Gen 04 Lne 09-39 Lne 09-39 Lne 09-39 Lne 09-39Trf 20-34 Gen 01 Gen 01 Gen 01 Gen 01Gen 05 Lne 01-39 Lne 01-39 Lne 01-39 Lne 01-39Lne 26-28 Lne 26-28 Lne 26-28 Lne 26-28 Lne 26-28Lne 28-29 Lne 28-29 Lne 28-29 Lne 28-29 Lne 28-29Trf 29-38 Trf 29-38 Trf 29-38 Trf 29-38 Trf 29-38
RestoreSubstation
Gen 09 Gen 09 Gen 09 Gen 09 Gen 09
40
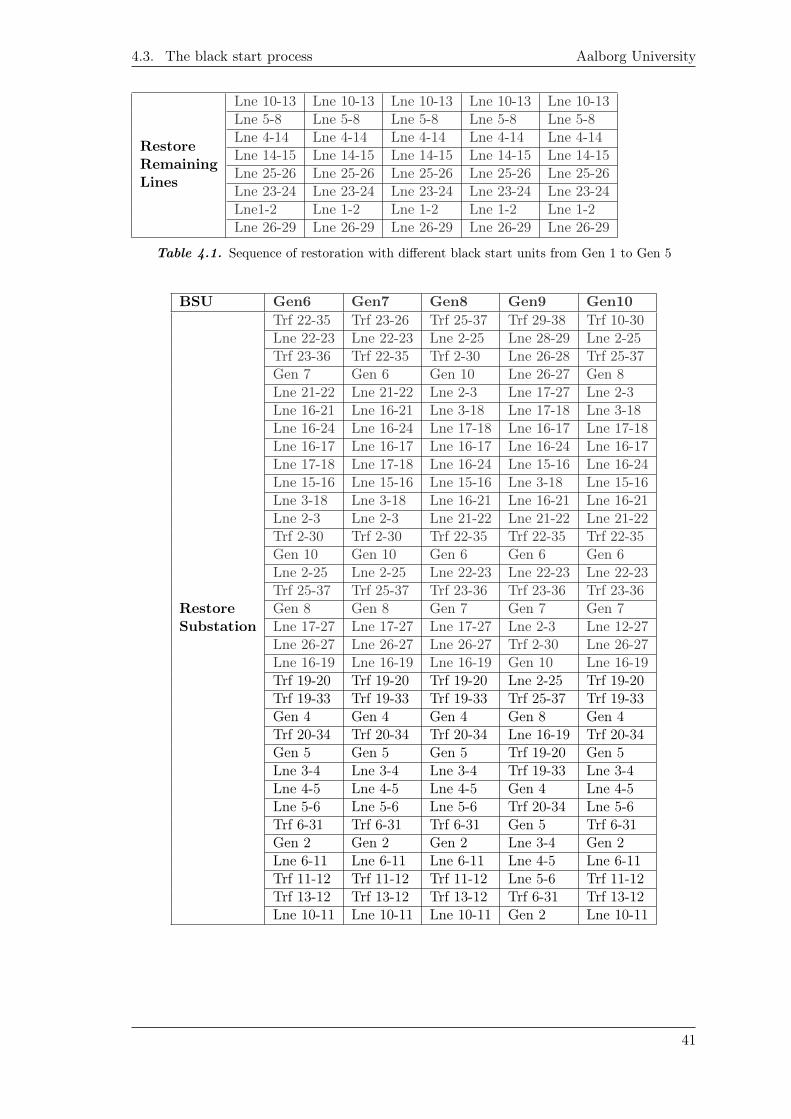
4.3. The black start process Aalborg University
Lne 10-13 Lne 10-13 Lne 10-13 Lne 10-13 Lne 10-13Lne 5-8 Lne 5-8 Lne 5-8 Lne 5-8 Lne 5-8Lne 4-14 Lne 4-14 Lne 4-14 Lne 4-14 Lne 4-14Lne 14-15 Lne 14-15 Lne 14-15 Lne 14-15 Lne 14-15Lne 25-26 Lne 25-26 Lne 25-26 Lne 25-26 Lne 25-26Lne 23-24 Lne 23-24 Lne 23-24 Lne 23-24 Lne 23-24Lne1-2 Lne 1-2 Lne 1-2 Lne 1-2 Lne 1-2
RestoreRemainingLines
Lne 26-29 Lne 26-29 Lne 26-29 Lne 26-29 Lne 26-29
Table 4.1. Sequence of restoration with different black start units from Gen 1 to Gen 5
BSU Gen6 Gen7 Gen8 Gen9 Gen10Trf 22-35 Trf 23-26 Trf 25-37 Trf 29-38 Trf 10-30Lne 22-23 Lne 22-23 Lne 2-25 Lne 28-29 Lne 2-25Trf 23-36 Trf 22-35 Trf 2-30 Lne 26-28 Trf 25-37Gen 7 Gen 6 Gen 10 Lne 26-27 Gen 8Lne 21-22 Lne 21-22 Lne 2-3 Lne 17-27 Lne 2-3Lne 16-21 Lne 16-21 Lne 3-18 Lne 17-18 Lne 3-18Lne 16-24 Lne 16-24 Lne 17-18 Lne 16-17 Lne 17-18Lne 16-17 Lne 16-17 Lne 16-17 Lne 16-24 Lne 16-17Lne 17-18 Lne 17-18 Lne 16-24 Lne 15-16 Lne 16-24Lne 15-16 Lne 15-16 Lne 15-16 Lne 3-18 Lne 15-16Lne 3-18 Lne 3-18 Lne 16-21 Lne 16-21 Lne 16-21Lne 2-3 Lne 2-3 Lne 21-22 Lne 21-22 Lne 21-22Trf 2-30 Trf 2-30 Trf 22-35 Trf 22-35 Trf 22-35Gen 10 Gen 10 Gen 6 Gen 6 Gen 6Lne 2-25 Lne 2-25 Lne 22-23 Lne 22-23 Lne 22-23Trf 25-37 Trf 25-37 Trf 23-36 Trf 23-36 Trf 23-36Gen 8 Gen 8 Gen 7 Gen 7 Gen 7Lne 17-27 Lne 17-27 Lne 17-27 Lne 2-3 Lne 12-27Lne 26-27 Lne 26-27 Lne 26-27 Trf 2-30 Lne 26-27Lne 16-19 Lne 16-19 Lne 16-19 Gen 10 Lne 16-19Trf 19-20 Trf 19-20 Trf 19-20 Lne 2-25 Trf 19-20Trf 19-33 Trf 19-33 Trf 19-33 Trf 25-37 Trf 19-33Gen 4 Gen 4 Gen 4 Gen 8 Gen 4Trf 20-34 Trf 20-34 Trf 20-34 Lne 16-19 Trf 20-34Gen 5 Gen 5 Gen 5 Trf 19-20 Gen 5Lne 3-4 Lne 3-4 Lne 3-4 Trf 19-33 Lne 3-4Lne 4-5 Lne 4-5 Lne 4-5 Gen 4 Lne 4-5Lne 5-6 Lne 5-6 Lne 5-6 Trf 20-34 Lne 5-6Trf 6-31 Trf 6-31 Trf 6-31 Gen 5 Trf 6-31Gen 2 Gen 2 Gen 2 Lne 3-4 Gen 2Lne 6-11 Lne 6-11 Lne 6-11 Lne 4-5 Lne 6-11Trf 11-12 Trf 11-12 Trf 11-12 Lne 5-6 Trf 11-12Trf 13-12 Trf 13-12 Trf 13-12 Trf 6-31 Trf 13-12
RestoreSubstation
Lne 10-11 Lne 10-11 Lne 10-11 Gen 2 Lne 10-11
41
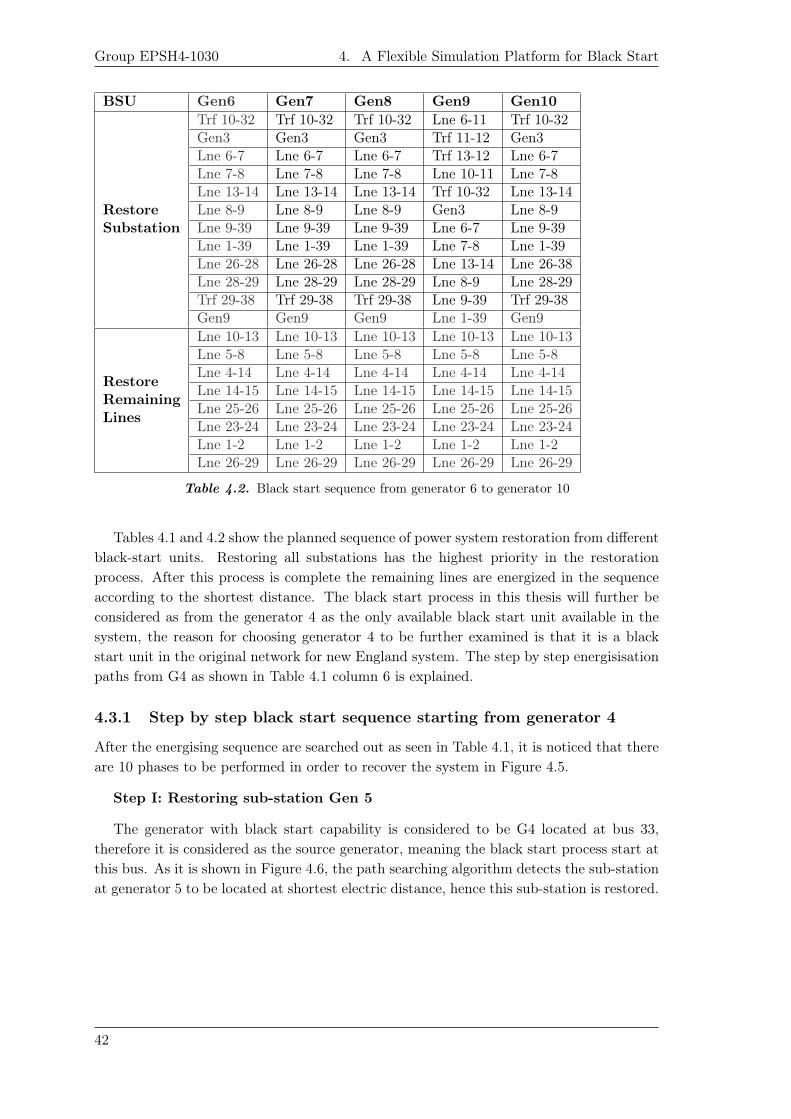
Group EPSH4-1030 4. A Flexible Simulation Platform for Black Start
BSU Gen6 Gen7 Gen8 Gen9 Gen10Trf 10-32 Trf 10-32 Trf 10-32 Lne 6-11 Trf 10-32Gen3 Gen3 Gen3 Trf 11-12 Gen3Lne 6-7 Lne 6-7 Lne 6-7 Trf 13-12 Lne 6-7Lne 7-8 Lne 7-8 Lne 7-8 Lne 10-11 Lne 7-8Lne 13-14 Lne 13-14 Lne 13-14 Trf 10-32 Lne 13-14Lne 8-9 Lne 8-9 Lne 8-9 Gen3 Lne 8-9Lne 9-39 Lne 9-39 Lne 9-39 Lne 6-7 Lne 9-39Lne 1-39 Lne 1-39 Lne 1-39 Lne 7-8 Lne 1-39Lne 26-28 Lne 26-28 Lne 26-28 Lne 13-14 Lne 26-38Lne 28-29 Lne 28-29 Lne 28-29 Lne 8-9 Lne 28-29Trf 29-38 Trf 29-38 Trf 29-38 Lne 9-39 Trf 29-38
RestoreSubstation
Gen9 Gen9 Gen9 Lne 1-39 Gen9Lne 10-13 Lne 10-13 Lne 10-13 Lne 10-13 Lne 10-13Lne 5-8 Lne 5-8 Lne 5-8 Lne 5-8 Lne 5-8Lne 4-14 Lne 4-14 Lne 4-14 Lne 4-14 Lne 4-14Lne 14-15 Lne 14-15 Lne 14-15 Lne 14-15 Lne 14-15Lne 25-26 Lne 25-26 Lne 25-26 Lne 25-26 Lne 25-26Lne 23-24 Lne 23-24 Lne 23-24 Lne 23-24 Lne 23-24Lne 1-2 Lne 1-2 Lne 1-2 Lne 1-2 Lne 1-2
RestoreRemainingLines
Lne 26-29 Lne 26-29 Lne 26-29 Lne 26-29 Lne 26-29
Table 4.2. Black start sequence from generator 6 to generator 10
Tables 4.1 and 4.2 show the planned sequence of power system restoration from differentblack-start units. Restoring all substations has the highest priority in the restorationprocess. After this process is complete the remaining lines are energized in the sequenceaccording to the shortest distance. The black start process in this thesis will further beconsidered as from the generator 4 as the only available black start unit available in thesystem, the reason for choosing generator 4 to be further examined is that it is a blackstart unit in the original network for new England system. The step by step energisisationpaths from G4 as shown in Table 4.1 column 6 is explained.
4.3.1 Step by step black start sequence starting from generator 4
After the energising sequence are searched out as seen in Table 4.1, it is noticed that thereare 10 phases to be performed in order to recover the system in Figure 4.5.
Step I: Restoring sub-station Gen 5
The generator with black start capability is considered to be G4 located at bus 33,therefore it is considered as the source generator, meaning the black start process start atthis bus. As it is shown in Figure 4.6, the path searching algorithm detects the sub-stationat generator 5 to be located at shortest electric distance, hence this sub-station is restored.
42
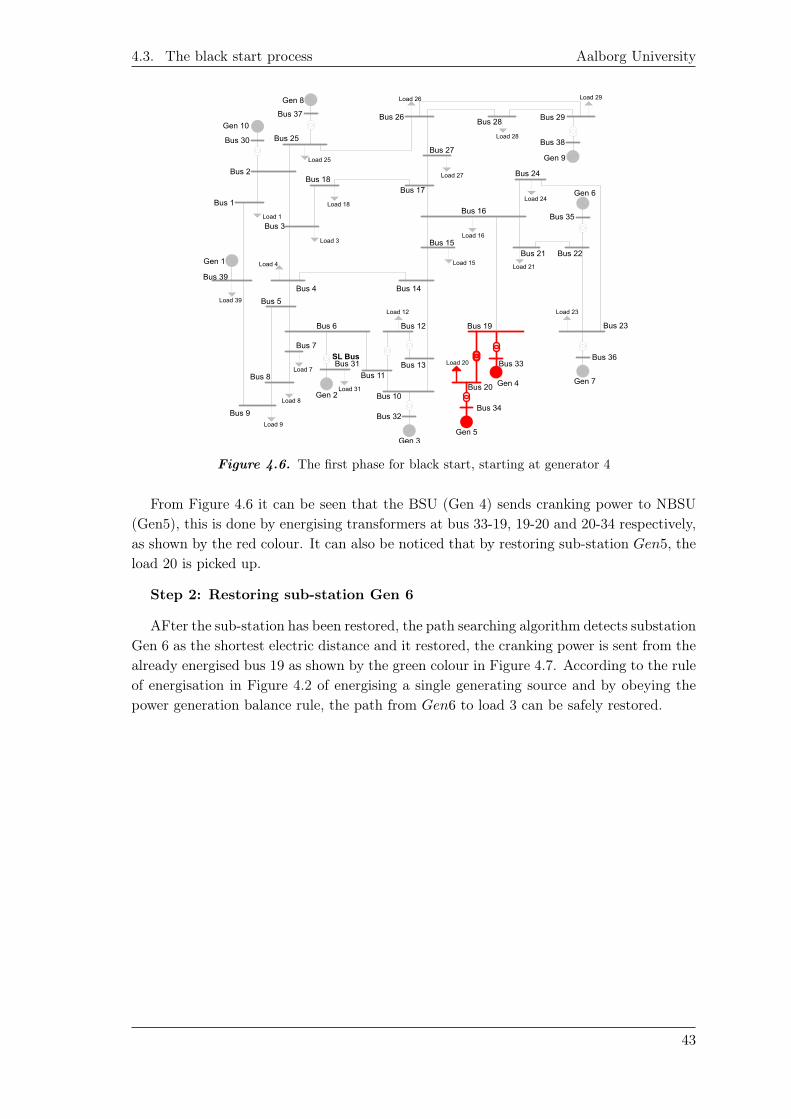
4.3. The black start process Aalborg University
Gen 1
Gen 2
Gen 3
Gen 4
Gen 5
Gen 6
Gen 7
Gen 8
Gen 10
Gen 9
Bus 1
Bus 2
Bus 30
Bus 37
Bus 25
Bus 18Bus 17
Bus 27
Bus 26Bus 28
Bus 29
Bus 38
Bus 24
Bus 35
Bus 22Bus 21
Bus 16
Bus 15
Bus 19 Bus 23
Bus 36Bus 33
Bus 34Bus 32
Bus 20Bus 10
Bus 11Bus 13
Bus 9
Bus 8
Bus 6
Bus 14Bus 4
Bus 39
Bus 5
Bus 7
Bus 31
Bus 12
Load 25
Bus 3
Load 3
Load 18
Load 4
Load 39
Load 7
Load 8
Load 31
Load 12
Load 20
Load 15
Load 16
Load 21
Load 24
Load 27
Load 28
Load 26 Load 29
Load 23
Load 1
Load 9
SL Bus
Figure 4.6. The first phase for black start, starting at generator 4
From Figure 4.6 it can be seen that the BSU (Gen 4) sends cranking power to NBSU(Gen5), this is done by energising transformers at bus 33-19, 19-20 and 20-34 respectively,as shown by the red colour. It can also be noticed that by restoring sub-station Gen5, theload 20 is picked up.
Step 2: Restoring sub-station Gen 6
AFter the sub-station has been restored, the path searching algorithm detects substationGen 6 as the shortest electric distance and it restored, the cranking power is sent from thealready energised bus 19 as shown by the green colour in Figure 4.7. According to the ruleof energisation in Figure 4.2 of energising a single generating source and by obeying thepower generation balance rule, the path from Gen6 to load 3 can be safely restored.
43
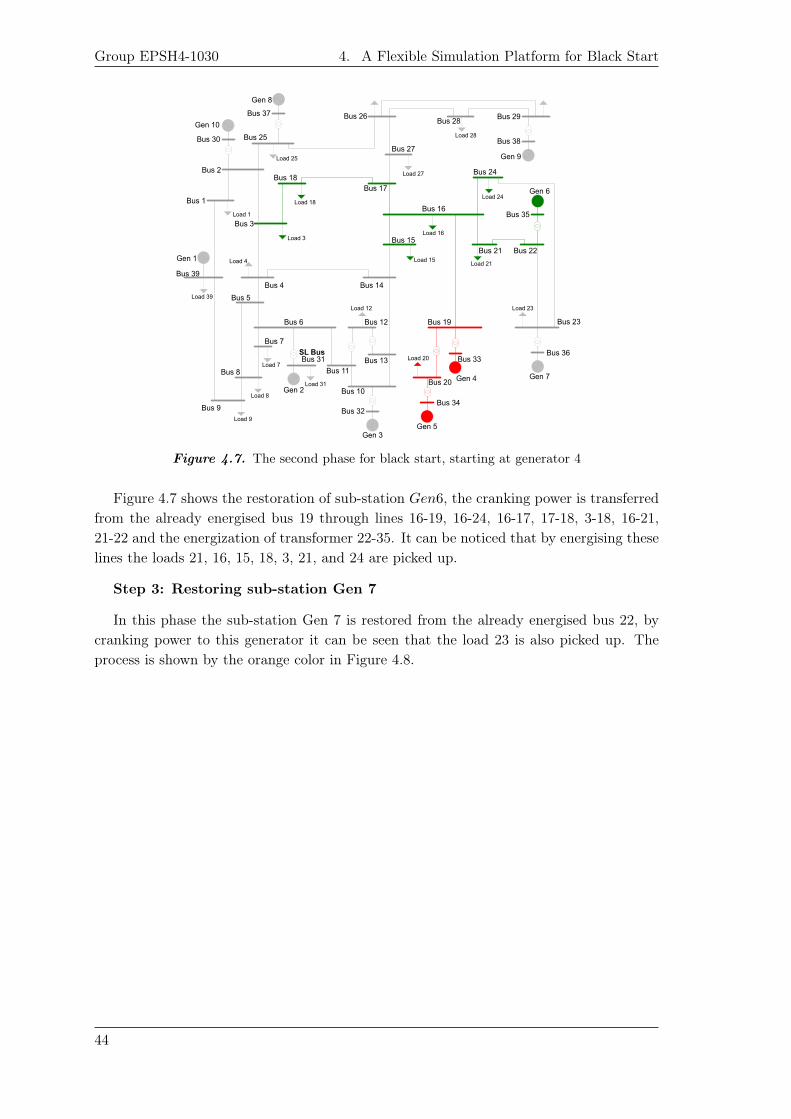
Group EPSH4-1030 4. A Flexible Simulation Platform for Black Start
Gen 1
Gen 2
Gen 3
Gen 4
Gen 5
Gen 6
Gen 7
Gen 8
Gen 10
Gen 9
Bus 1
Bus 2
Bus 30
Bus 37
Bus 25
Bus 18Bus 17
Bus 27
Bus 26Bus 28
Bus 29
Bus 38
Bus 24
Bus 35
Bus 22Bus 21
Bus 16
Bus 15
Bus 19 Bus 23
Bus 36Bus 33
Bus 34Bus 32
Bus 20Bus 10
Bus 11Bus 13
Bus 9
Bus 8
Bus 6
Bus 14Bus 4
Bus 39
Bus 5
Bus 7
Bus 31
Bus 12
Load 25
Bus 3
Load 3
Load 18
Load 4
Load 39
Load 7
Load 8
Load 31
Load 12
Load 20
Load 15
Load 16
Load 21
Load 24
Load 27
Load 28
Load 23
Load 1
Load 9
SL Bus
Figure 4.7. The second phase for black start, starting at generator 4
Figure 4.7 shows the restoration of sub-station Gen6, the cranking power is transferredfrom the already energised bus 19 through lines 16-19, 16-24, 16-17, 17-18, 3-18, 16-21,21-22 and the energization of transformer 22-35. It can be noticed that by energising theselines the loads 21, 16, 15, 18, 3, 21, and 24 are picked up.
Step 3: Restoring sub-station Gen 7
In this phase the sub-station Gen 7 is restored from the already energised bus 22, bycranking power to this generator it can be seen that the load 23 is also picked up. Theprocess is shown by the orange color in Figure 4.8.
44
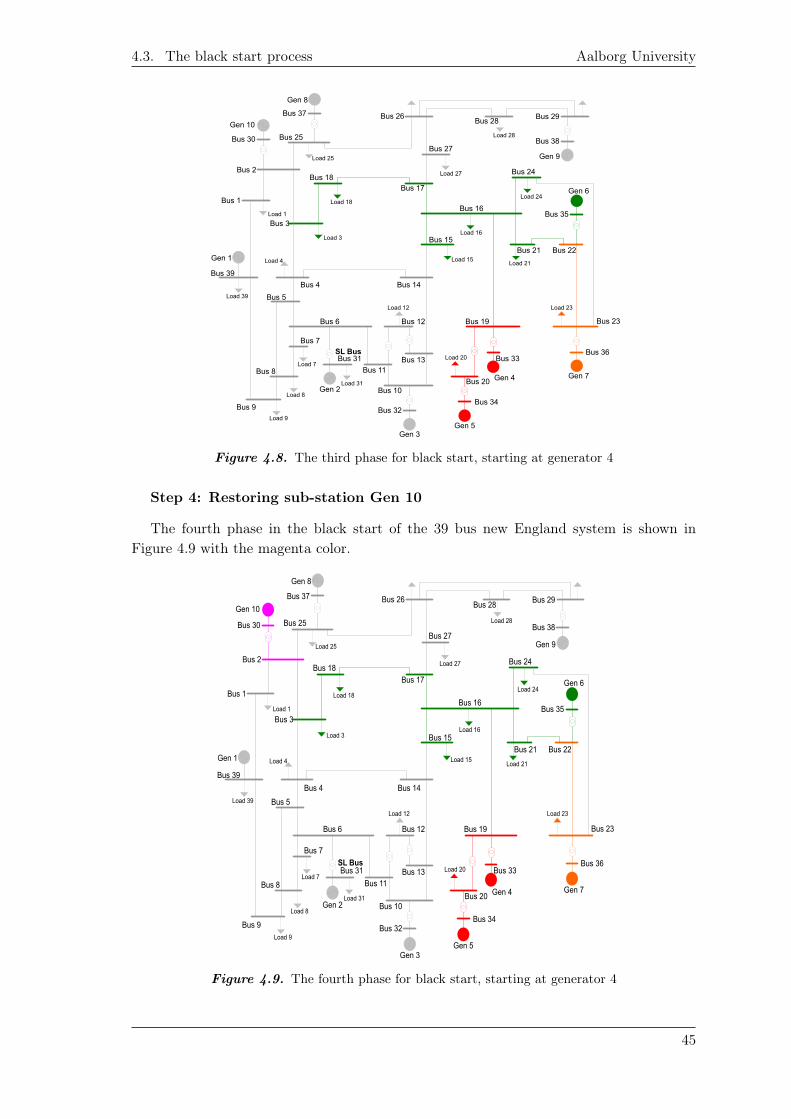
4.3. The black start process Aalborg University
Gen 1
Gen 2
Gen 3
Gen 4
Gen 5
Gen 6
Gen 7
Gen 8
Gen 10
Gen 9
Bus 1
Bus 2
Bus 30
Bus 37
Bus 25
Bus 18Bus 17
Bus 27
Bus 26Bus 28
Bus 29
Bus 38
Bus 24
Bus 35
Bus 22Bus 21
Bus 16
Bus 15
Bus 19 Bus 23
Bus 36Bus 33
Bus 34Bus 32
Bus 20Bus 10
Bus 11Bus 13
Bus 9
Bus 8
Bus 6
Bus 14Bus 4
Bus 39
Bus 5
Bus 7
Bus 31
Bus 12
Load 25
Bus 3
Load 3
Load 18
Load 4
Load 39
Load 7
Load 8
Load 31
Load 12
Load 20
Load 15
Load 16
Load 21
Load 24
Load 27
Load 28
Load 23
Load 1
Load 9
SL Bus
Figure 4.8. The third phase for black start, starting at generator 4
Step 4: Restoring sub-station Gen 10
The fourth phase in the black start of the 39 bus new England system is shown inFigure 4.9 with the magenta color.
Gen 1
Gen 2
Gen 3
Gen 4
Gen 5
Gen 6
Gen 7
Gen 8
Gen 10
Gen 9
Bus 1
Bus 2
Bus 30
Bus 37
Bus 25
Bus 18Bus 17
Bus 27
Bus 26Bus 28
Bus 29
Bus 38
Bus 24
Bus 35
Bus 22Bus 21
Bus 16
Bus 15
Bus 19 Bus 23
Bus 36Bus 33
Bus 34Bus 32
Bus 20Bus 10
Bus 11Bus 13
Bus 9
Bus 8
Bus 6
Bus 14Bus 4
Bus 39
Bus 5
Bus 7
Bus 31
Bus 12
Load 25
Bus 3
Load 3
Load 18
Load 4
Load 39
Load 7
Load 8
Load 31
Load 12
Load 20
Load 15
Load 16
Load 21
Load 24
Load 27
Load 28
Load 23
Load 1
Load 9
SL Bus
Figure 4.9. The fourth phase for black start, starting at generator 4
45
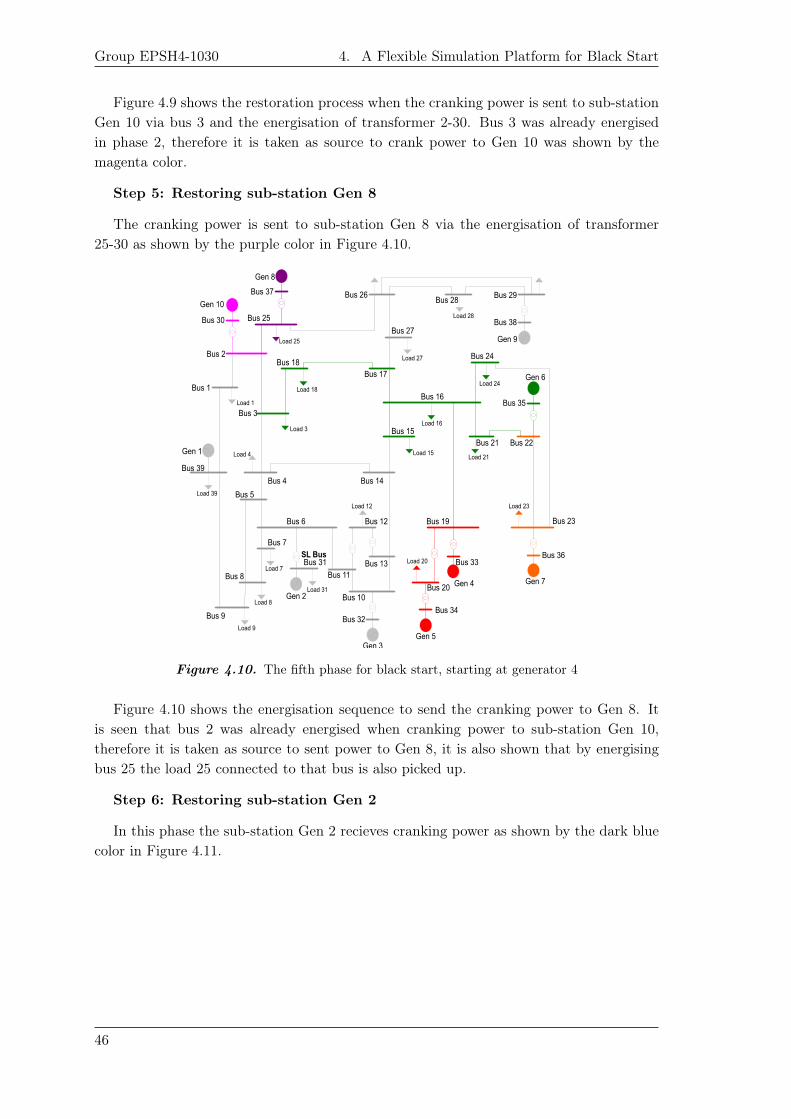
Group EPSH4-1030 4. A Flexible Simulation Platform for Black Start
Figure 4.9 shows the restoration process when the cranking power is sent to sub-stationGen 10 via bus 3 and the energisation of transformer 2-30. Bus 3 was already energisedin phase 2, therefore it is taken as source to crank power to Gen 10 was shown by themagenta color.
Step 5: Restoring sub-station Gen 8
The cranking power is sent to sub-station Gen 8 via the energisation of transformer25-30 as shown by the purple color in Figure 4.10.
Gen 1
Gen 2
Gen 3
Gen 4
Gen 5
Gen 6
Gen 7
Gen 8
Gen 10
Gen 9
Bus 1
Bus 2
Bus 30
Bus 37
Bus 25
Bus 18Bus 17
Bus 27
Bus 26Bus 28
Bus 29
Bus 38
Bus 24
Bus 35
Bus 22Bus 21
Bus 16
Bus 15
Bus 19 Bus 23
Bus 36Bus 33
Bus 34Bus 32
Bus 20Bus 10
Bus 11Bus 13
Bus 9
Bus 8
Bus 6
Bus 14Bus 4
Bus 39
Bus 5
Bus 7
Bus 31
Bus 12
Load 25
Bus 3
Load 3
Load 18
Load 4
Load 39
Load 7
Load 8
Load 31
Load 12
Load 20
Load 15
Load 16
Load 21
Load 24
Load 27
Load 28
Load 23
Load 1
Load 9
SL Bus
Figure 4.10. The fifth phase for black start, starting at generator 4
Figure 4.10 shows the energisation sequence to send the cranking power to Gen 8. Itis seen that bus 2 was already energised when cranking power to sub-station Gen 10,therefore it is taken as source to sent power to Gen 8, it is also shown that by energisingbus 25 the load 25 connected to that bus is also picked up.
Step 6: Restoring sub-station Gen 2
In this phase the sub-station Gen 2 recieves cranking power as shown by the dark bluecolor in Figure 4.11.
46
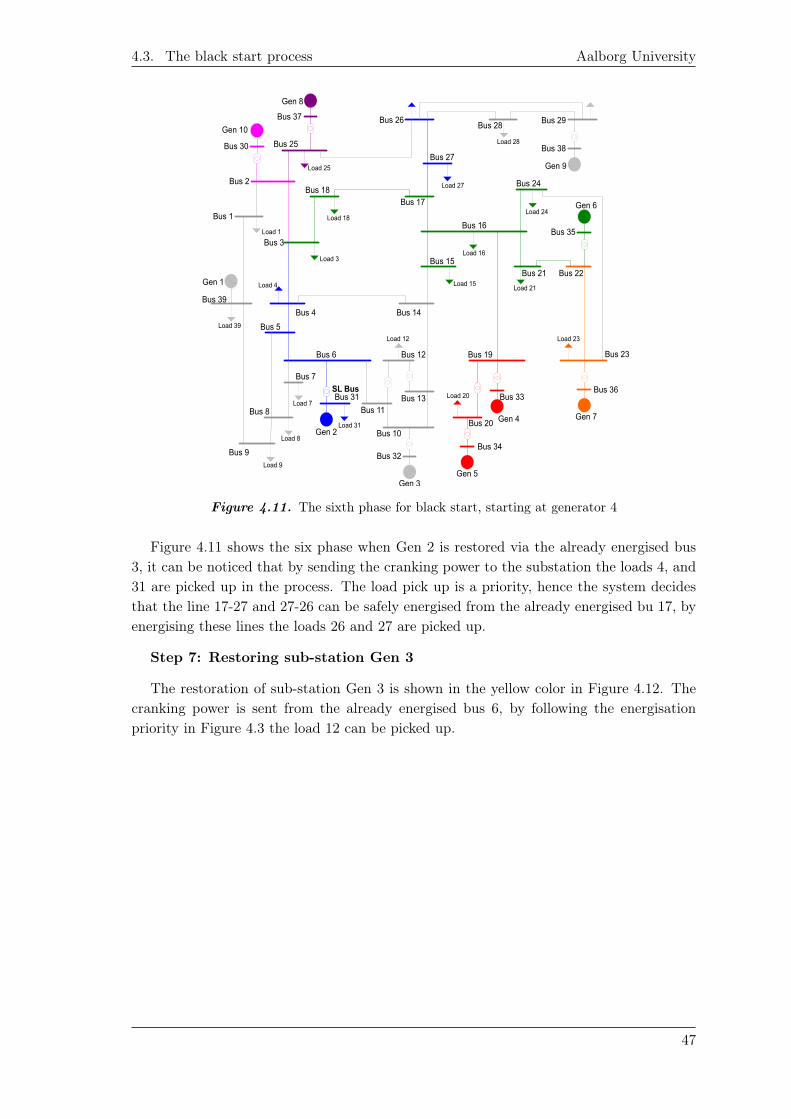
4.3. The black start process Aalborg University
Gen 1
Gen 2
Gen 3
Gen 4
Gen 5
Gen 6
Gen 7
Gen 8
Gen 10
Gen 9
Bus 1
Bus 2
Bus 30
Bus 37
Bus 25
Bus 18Bus 17
Bus 27
Bus 26Bus 28
Bus 29
Bus 38
Bus 24
Bus 35
Bus 22Bus 21
Bus 16
Bus 15
Bus 19 Bus 23
Bus 36Bus 33
Bus 34Bus 32
Bus 20Bus 10
Bus 11Bus 13
Bus 9
Bus 8
Bus 6
Bus 14Bus 4
Bus 39
Bus 5
Bus 7
Bus 31
Bus 12
Load 25
Bus 3
Load 3
Load 18
Load 4
Load 39
Load 7
Load 8
Load 31
Load 12
Load 20
Load 15
Load 16
Load 21
Load 24
Load 27
Load 28
Load 23
Load 1
Load 9
SL Bus
Figure 4.11. The sixth phase for black start, starting at generator 4
Figure 4.11 shows the six phase when Gen 2 is restored via the already energised bus3, it can be noticed that by sending the cranking power to the substation the loads 4, and31 are picked up in the process. The load pick up is a priority, hence the system decidesthat the line 17-27 and 27-26 can be safely energised from the already energised bu 17, byenergising these lines the loads 26 and 27 are picked up.
Step 7: Restoring sub-station Gen 3
The restoration of sub-station Gen 3 is shown in the yellow color in Figure 4.12. Thecranking power is sent from the already energised bus 6, by following the energisationpriority in Figure 4.3 the load 12 can be picked up.
47
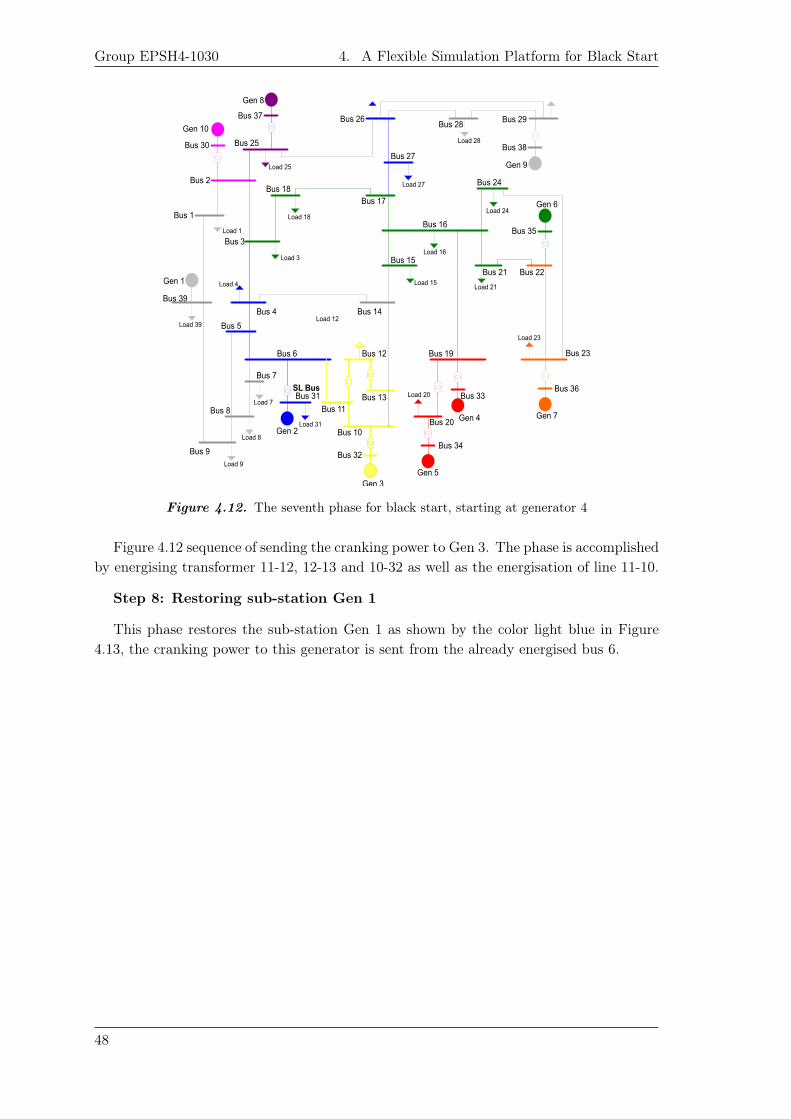
Group EPSH4-1030 4. A Flexible Simulation Platform for Black Start
Gen 1
Gen 2
Gen 3
Gen 4
Gen 5
Gen 6
Gen 7
Gen 8
Gen 10
Gen 9
Bus 1
Bus 2
Bus 30
Bus 37
Bus 25
Bus 18Bus 17
Bus 27
Bus 26Bus 28
Bus 29
Bus 38
Bus 24
Bus 35
Bus 22Bus 21
Bus 16
Bus 15
Bus 19 Bus 23
Bus 36Bus 33
Bus 34Bus 32
Bus 20Bus 10
Bus 11Bus 13
Bus 9
Bus 8
Bus 6
Bus 14Bus 4
Bus 39
Bus 5
Bus 7
Bus 31
Bus 12
Load 25
Bus 3
Load 3
Load 18
Load 4
Load 39
Load 7
Load 8
Load 31
Load 12
Load 20
Load 15
Load 16
Load 21
Load 24
Load 27
Load 28
Load 23
Load 1
Load 9
SL Bus
Figure 4.12. The seventh phase for black start, starting at generator 4
Figure 4.12 sequence of sending the cranking power to Gen 3. The phase is accomplishedby energising transformer 11-12, 12-13 and 10-32 as well as the energisation of line 11-10.
Step 8: Restoring sub-station Gen 1
This phase restores the sub-station Gen 1 as shown by the color light blue in Figure4.13, the cranking power to this generator is sent from the already energised bus 6.
48
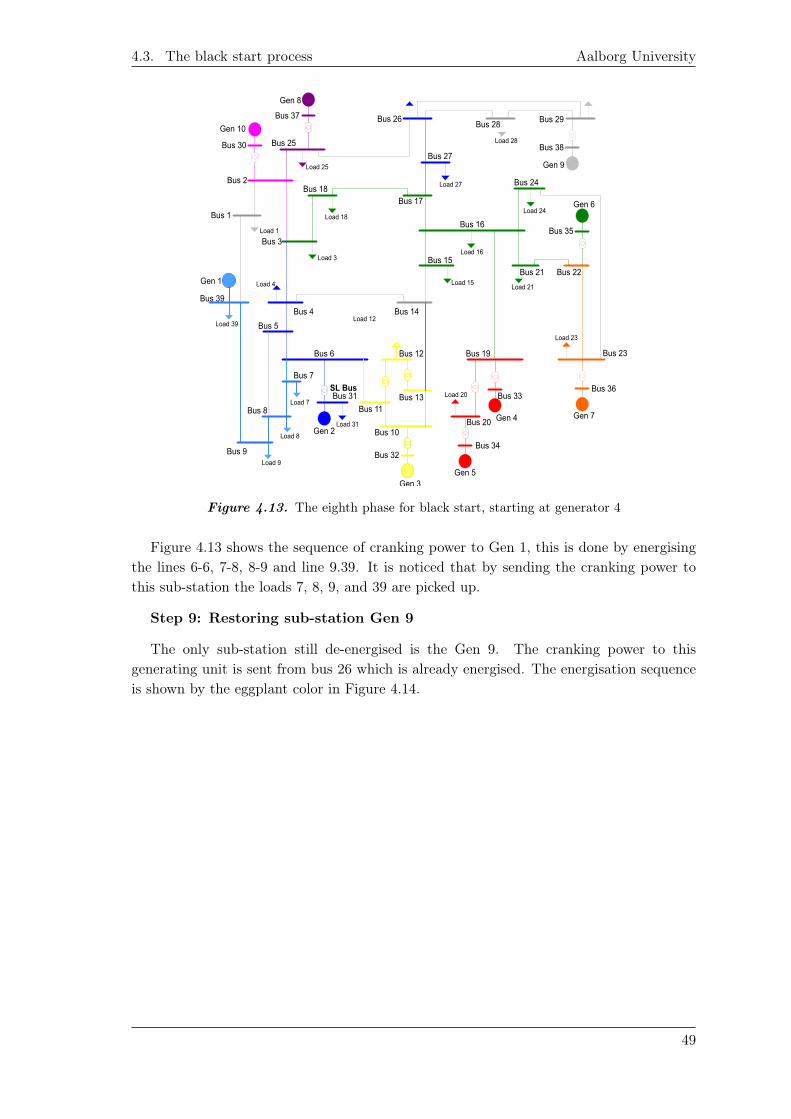
4.3. The black start process Aalborg University
Gen 1
Gen 2
Gen 3
Gen 4
Gen 5
Gen 6
Gen 7
Gen 8
Gen 10
Gen 9
Bus 1
Bus 2
Bus 30
Bus 37
Bus 25
Bus 18Bus 17
Bus 27
Bus 26Bus 28
Bus 29
Bus 38
Bus 24
Bus 35
Bus 22Bus 21
Bus 16
Bus 15
Bus 19 Bus 23
Bus 36Bus 33
Bus 34Bus 32
Bus 20Bus 10
Bus 11Bus 13
Bus 9
Bus 8
Bus 6
Bus 14Bus 4
Bus 39
Bus 5
Bus 7
Bus 31
Bus 12
Load 25
Bus 3
Load 3
Load 18
Load 4
Load 39
Load 7
Load 8
Load 31
Load 12
Load 20
Load 15
Load 16
Load 21
Load 24
Load 27
Load 28
Load 23
Load 1
Load 9
SL Bus
Figure 4.13. The eighth phase for black start, starting at generator 4
Figure 4.13 shows the sequence of cranking power to Gen 1, this is done by energisingthe lines 6-6, 7-8, 8-9 and line 9.39. It is noticed that by sending the cranking power tothis sub-station the loads 7, 8, 9, and 39 are picked up.
Step 9: Restoring sub-station Gen 9
The only sub-station still de-energised is the Gen 9. The cranking power to thisgenerating unit is sent from bus 26 which is already energised. The energisation sequenceis shown by the eggplant color in Figure 4.14.
49
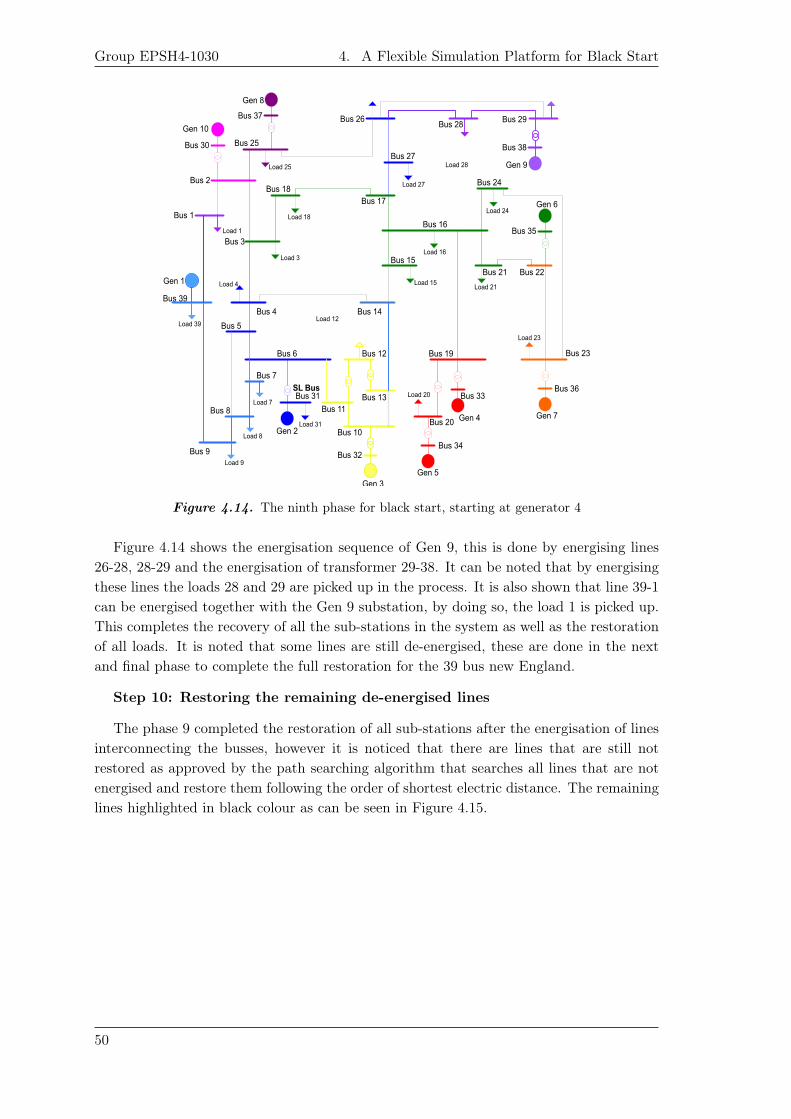
Group EPSH4-1030 4. A Flexible Simulation Platform for Black Start
Gen 1
Gen 2
Gen 3
Gen 4
Gen 5
Gen 6
Gen 7
Gen 8
Gen 10
Gen 9
Bus 1
Bus 2
Bus 30
Bus 37
Bus 25
Bus 18Bus 17
Bus 27
Bus 26Bus 28
Bus 29
Bus 38
Bus 24
Bus 35
Bus 22Bus 21
Bus 16
Bus 15
Bus 19 Bus 23
Bus 36Bus 33
Bus 34Bus 32
Bus 20Bus 10
Bus 11Bus 13
Bus 9
Bus 8
Bus 6
Bus 14Bus 4
Bus 39
Bus 5
Bus 7
Bus 31
Bus 12
Load 25
Bus 3
Load 3
Load 18
Load 4
Load 39
Load 7
Load 8
Load 31
Load 12
Load 20
Load 15
Load 16
Load 21
Load 24
Load 27
Load 28
Load 23
Load 1
Load 9
SL Bus
Figure 4.14. The ninth phase for black start, starting at generator 4
Figure 4.14 shows the energisation sequence of Gen 9, this is done by energising lines26-28, 28-29 and the energisation of transformer 29-38. It can be noted that by energisingthese lines the loads 28 and 29 are picked up in the process. It is also shown that line 39-1can be energised together with the Gen 9 substation, by doing so, the load 1 is picked up.This completes the recovery of all the sub-stations in the system as well as the restorationof all loads. It is noted that some lines are still de-energised, these are done in the nextand final phase to complete the full restoration for the 39 bus new England.
Step 10: Restoring the remaining de-energised lines
The phase 9 completed the restoration of all sub-stations after the energisation of linesinterconnecting the busses, however it is noticed that there are lines that are still notrestored as approved by the path searching algorithm that searches all lines that are notenergised and restore them following the order of shortest electric distance. The remaininglines highlighted in black colour as can be seen in Figure 4.15.
50
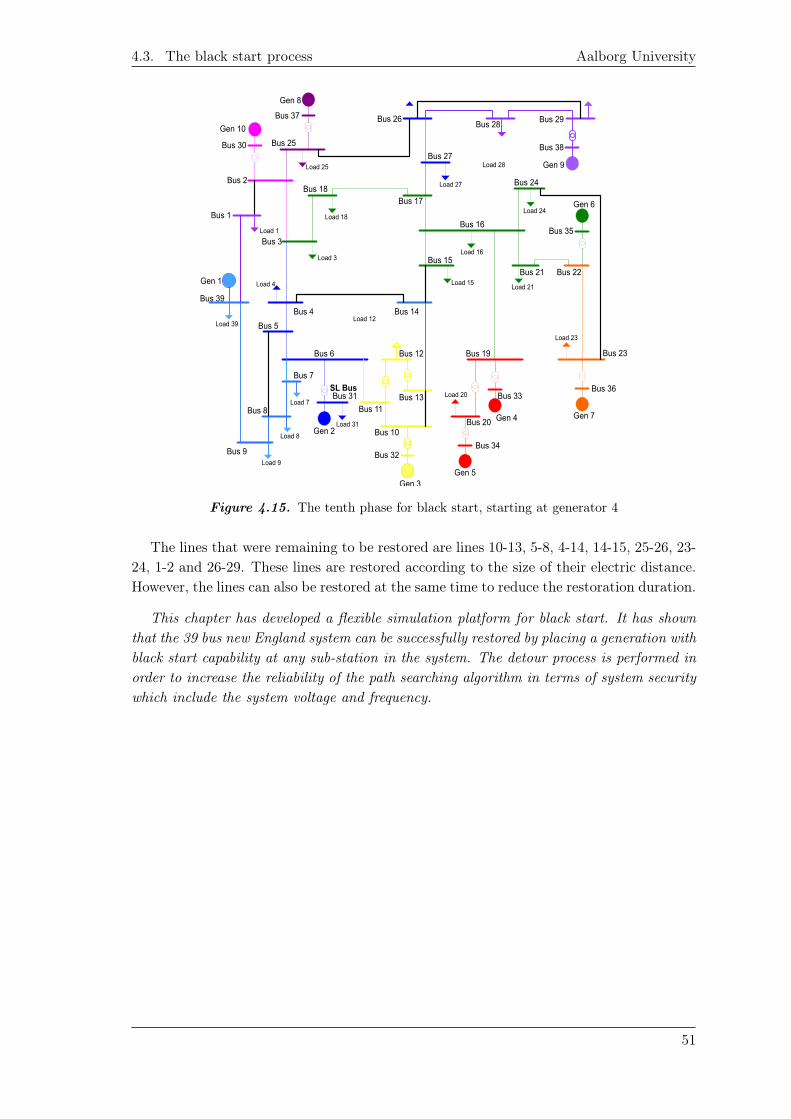
4.3. The black start process Aalborg University
Gen 1
Gen 2
Gen 3
Gen 4
Gen 5
Gen 6
Gen 7
Gen 8
Gen 10
Gen 9
Bus 1
Bus 2
Bus 30
Bus 37
Bus 25
Bus 18Bus 17
Bus 27
Bus 26Bus 28
Bus 29
Bus 38
Bus 24
Bus 35
Bus 22Bus 21
Bus 16
Bus 15
Bus 19 Bus 23
Bus 36Bus 33
Bus 34Bus 32
Bus 20Bus 10
Bus 11Bus 13
Bus 9
Bus 8
Bus 6
Bus 14Bus 4
Bus 39
Bus 5
Bus 7
Bus 31
Bus 12
Load 25
Bus 3
Load 3
Load 18
Load 4
Load 39
Load 7
Load 8
Load 31
Load 12
Load 20
Load 15
Load 16
Load 21
Load 24
Load 27
Load 28
Load 23
Load 1
Load 9
SL Bus
Figure 4.15. The tenth phase for black start, starting at generator 4
The lines that were remaining to be restored are lines 10-13, 5-8, 4-14, 14-15, 25-26, 23-24, 1-2 and 26-29. These lines are restored according to the size of their electric distance.However, the lines can also be restored at the same time to reduce the restoration duration.
This chapter has developed a flexible simulation platform for black start. It has shownthat the 39 bus new England system can be successfully restored by placing a generation withblack start capability at any sub-station in the system. The detour process is performed inorder to increase the reliability of the path searching algorithm in terms of system securitywhich include the system voltage and frequency.
51

Simulation Result 5This chapter presents the simulation results for the restoration strategy as developed in theprevious chapter, naely the result for the energisation sequence, the result when the detouris considered and the results when the tap changer effect is taken into consideration.
5.1 Result for the flexible simulation platform for blackstart
The total length of simulation is 2800sec, where three cases are defined:
• Case A: The power system restoration following the original sequence, where theshortest paths are considered as shown in Tables 4.1 and 4.2 respectively.
• Case B: In this case the power system restoration is performed with the detouredsequence.
• Case C: In this case the restoration sequence is the same as in case A with exceptthat automatic on load tap changer (OLTC) is implemented to be activated toregulate the voltage during the black start process, meaning that the transformertap-changers will be tuned upward or downward if the voltage is out of range of0.97 − 1.01p.u for more than 5 sec.
5.1.1 Case A: Sequence energisation
This section presents the result for energisation sequence for black start from Gen 4 as incase A. It must be noted that the results shown for system frequency are for busses 1-20 inthe system 4.5, because it is where the frequency ±3% of rated value is violated, and thebus voltage result shown are for busses 21-39 as the allowed voltage ±20% of rated valuelimits is violated. The frequency response at bus-bar 1-20 is shown in Figure 5.1.
5.1.
53
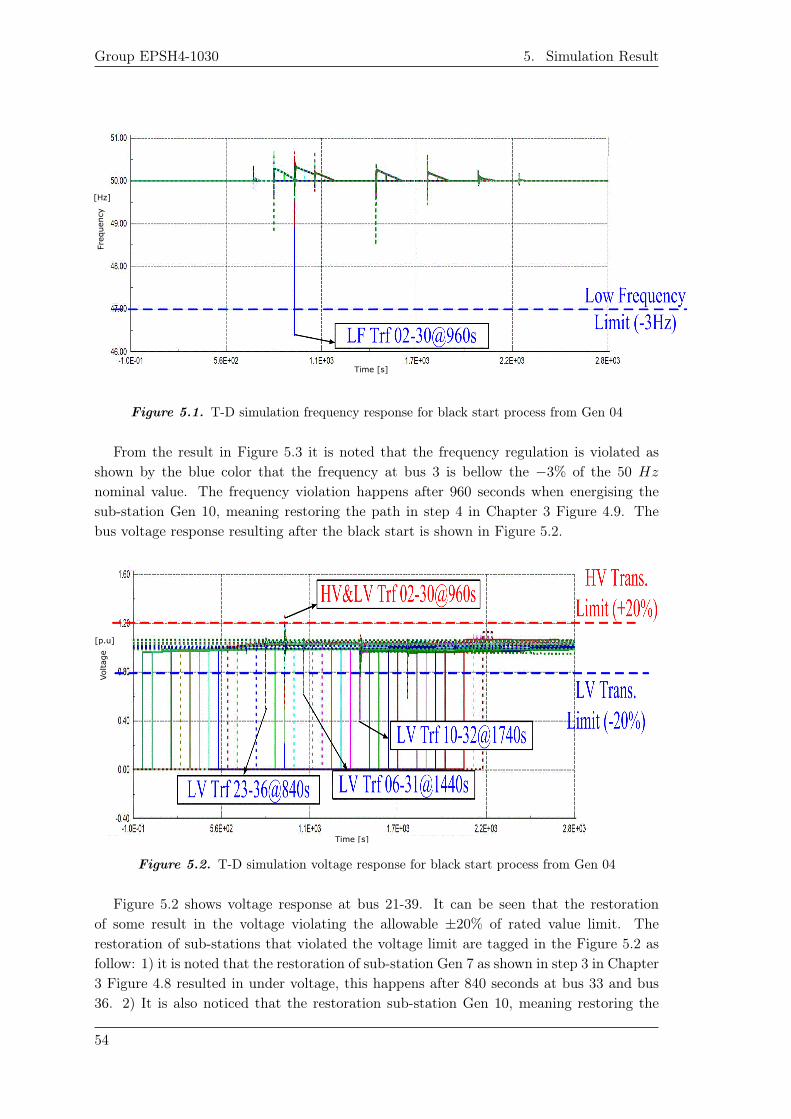
Group EPSH4-1030 5. Simulation Result
Time [s]
Freq
uen
cy
[Hz]
Figure 5.1. T-D simulation frequency response for black start process from Gen 04
From the result in Figure 5.3 it is noted that the frequency regulation is violated asshown by the blue color that the frequency at bus 3 is bellow the −3% of the 50 Hz
nominal value. The frequency violation happens after 960 seconds when energising thesub-station Gen 10, meaning restoring the path in step 4 in Chapter 3 Figure 4.9. Thebus voltage response resulting after the black start is shown in Figure 5.2.
Time [s]
Vol
tage
[p.u]
Figure 5.2. T-D simulation voltage response for black start process from Gen 04
Figure 5.2 shows voltage response at bus 21-39. It can be seen that the restorationof some result in the voltage violating the allowable ±20% of rated value limit. Therestoration of sub-stations that violated the voltage limit are tagged in the Figure 5.2 asfollow: 1) it is noted that the restoration of sub-station Gen 7 as shown in step 3 in Chapter3 Figure 4.8 resulted in under voltage, this happens after 840 seconds at bus 33 and bus36. 2) It is also noticed that the restoration sub-station Gen 10, meaning restoring the
54
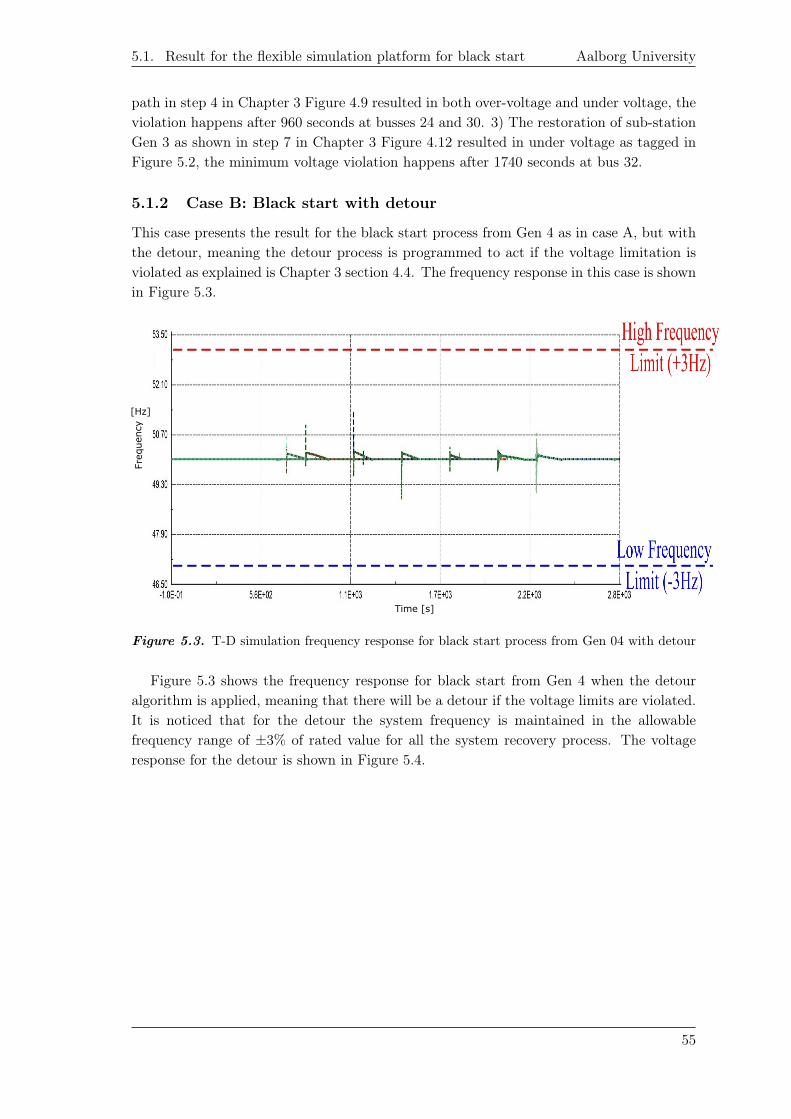
5.1. Result for the flexible simulation platform for black start Aalborg University
path in step 4 in Chapter 3 Figure 4.9 resulted in both over-voltage and under voltage, theviolation happens after 960 seconds at busses 24 and 30. 3) The restoration of sub-stationGen 3 as shown in step 7 in Chapter 3 Figure 4.12 resulted in under voltage as tagged inFigure 5.2, the minimum voltage violation happens after 1740 seconds at bus 32.
5.1.2 Case B: Black start with detour
This case presents the result for the black start process from Gen 4 as in case A, but withthe detour, meaning the detour process is programmed to act if the voltage limitation isviolated as explained is Chapter 3 section 4.4. The frequency response in this case is shownin Figure 5.3.
Time [s]
Freq
uen
cy
[Hz]
Figure 5.3. T-D simulation frequency response for black start process from Gen 04 with detour
Figure 5.3 shows the frequency response for black start from Gen 4 when the detouralgorithm is applied, meaning that there will be a detour if the voltage limits are violated.It is noticed that for the detour the system frequency is maintained in the allowablefrequency range of ±3% of rated value for all the system recovery process. The voltageresponse for the detour is shown in Figure 5.4.
55
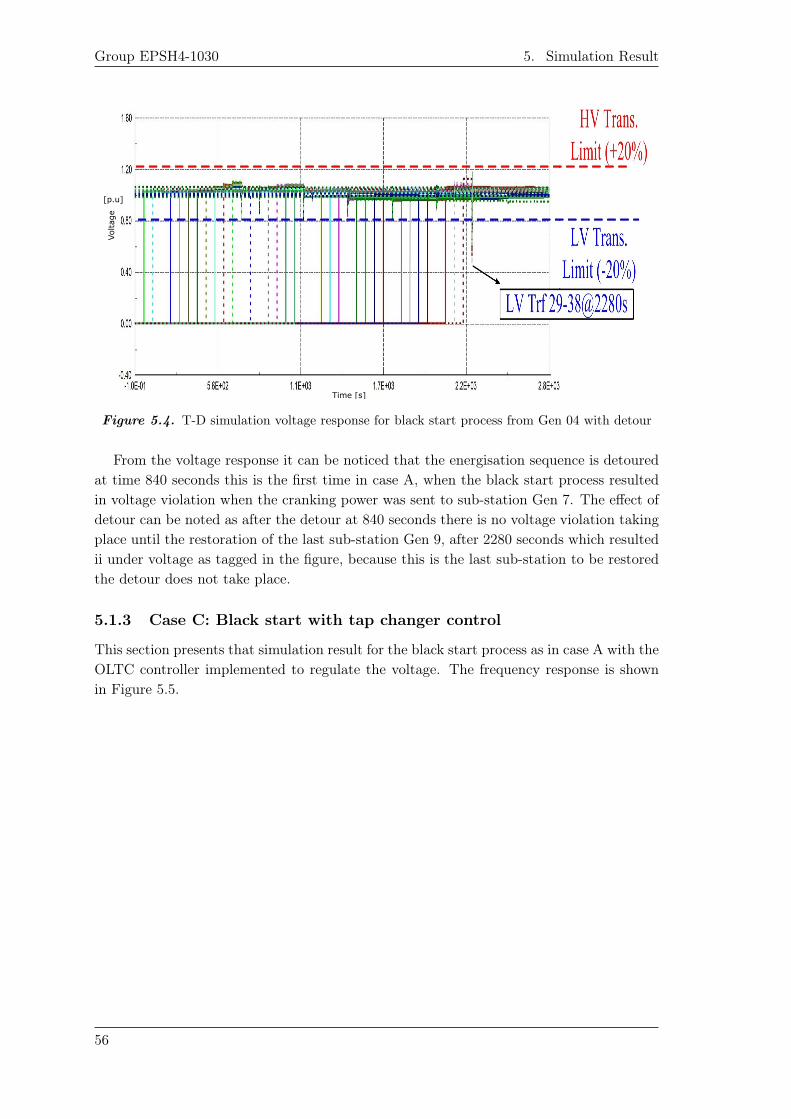
Group EPSH4-1030 5. Simulation Result
Time [s]
Vol
tage
[p.u]
Figure 5.4. T-D simulation voltage response for black start process from Gen 04 with detour
From the voltage response it can be noticed that the energisation sequence is detouredat time 840 seconds this is the first time in case A, when the black start process resultedin voltage violation when the cranking power was sent to sub-station Gen 7. The effect ofdetour can be noted as after the detour at 840 seconds there is no voltage violation takingplace until the restoration of the last sub-station Gen 9, after 2280 seconds which resultedii under voltage as tagged in the figure, because this is the last sub-station to be restoredthe detour does not take place.
5.1.3 Case C: Black start with tap changer control
This section presents that simulation result for the black start process as in case A with theOLTC controller implemented to regulate the voltage. The frequency response is shownin Figure 5.5.
56
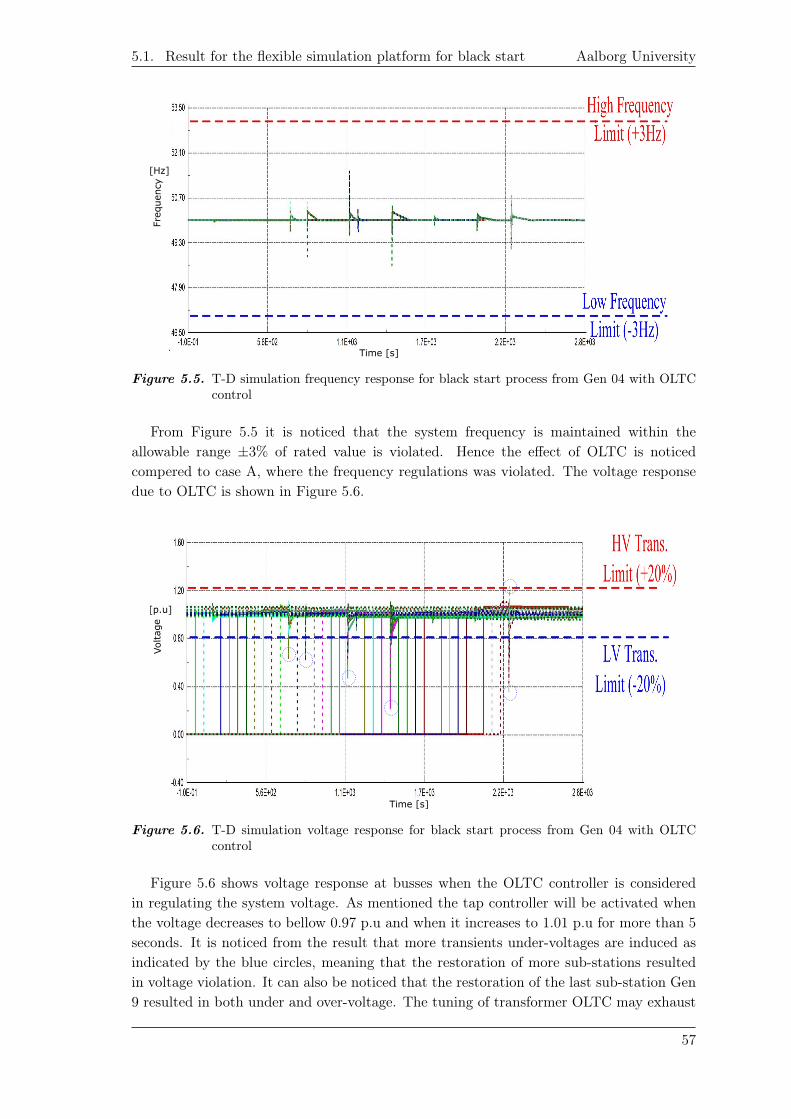
5.1. Result for the flexible simulation platform for black start Aalborg University
Time [s]
Freq
uen
cy
[Hz]
Figure 5.5. T-D simulation frequency response for black start process from Gen 04 with OLTCcontrol
From Figure 5.5 it is noticed that the system frequency is maintained within theallowable range ±3% of rated value is violated. Hence the effect of OLTC is noticedcompered to case A, where the frequency regulations was violated. The voltage responsedue to OLTC is shown in Figure 5.6.
Time [s]
Vol
tage
[p.u]
Figure 5.6. T-D simulation voltage response for black start process from Gen 04 with OLTCcontrol
Figure 5.6 shows voltage response at busses when the OLTC controller is consideredin regulating the system voltage. As mentioned the tap controller will be activated whenthe voltage decreases to bellow 0.97 p.u and when it increases to 1.01 p.u for more than 5seconds. It is noticed from the result that more transients under-voltages are induced asindicated by the blue circles, meaning that the restoration of more sub-stations resultedin voltage violation. It can also be noticed that the restoration of the last sub-station Gen9 resulted in both under and over-voltage. The tuning of transformer OLTC may exhaust
57
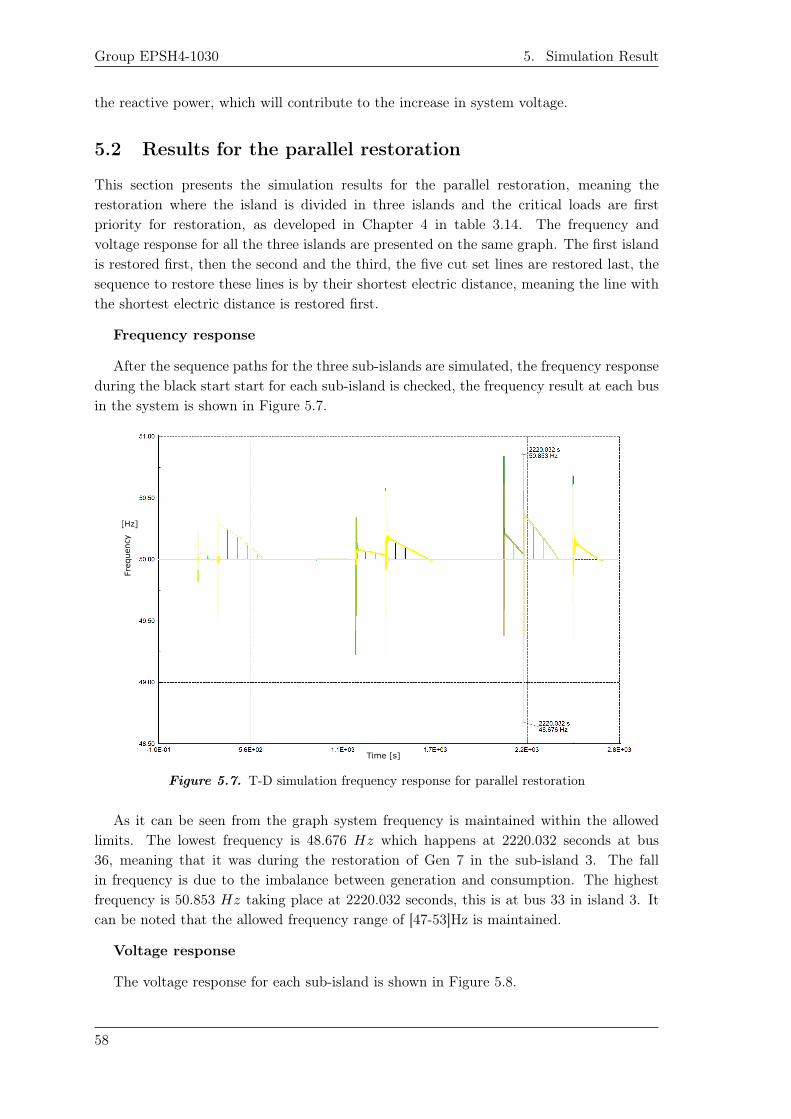
Group EPSH4-1030 5. Simulation Result
the reactive power, which will contribute to the increase in system voltage.
5.2 Results for the parallel restoration
This section presents the simulation results for the parallel restoration, meaning therestoration where the island is divided in three islands and the critical loads are firstpriority for restoration, as developed in Chapter 4 in table 3.14. The frequency andvoltage response for all the three islands are presented on the same graph. The first islandis restored first, then the second and the third, the five cut set lines are restored last, thesequence to restore these lines is by their shortest electric distance, meaning the line withthe shortest electric distance is restored first.
Frequency response
After the sequence paths for the three sub-islands are simulated, the frequency responseduring the black start start for each sub-island is checked, the frequency result at each busin the system is shown in Figure 5.7.
Time [s]
Freq
uen
cy
[Hz]
Figure 5.7. T-D simulation frequency response for parallel restoration
As it can be seen from the graph system frequency is maintained within the allowedlimits. The lowest frequency is 48.676 Hz which happens at 2220.032 seconds at bus36, meaning that it was during the restoration of Gen 7 in the sub-island 3. The fallin frequency is due to the imbalance between generation and consumption. The highestfrequency is 50.853 Hz taking place at 2220.032 seconds, this is at bus 33 in island 3. Itcan be noted that the allowed frequency range of [47-53]Hz is maintained.
Voltage response
The voltage response for each sub-island is shown in Figure 5.8.
58
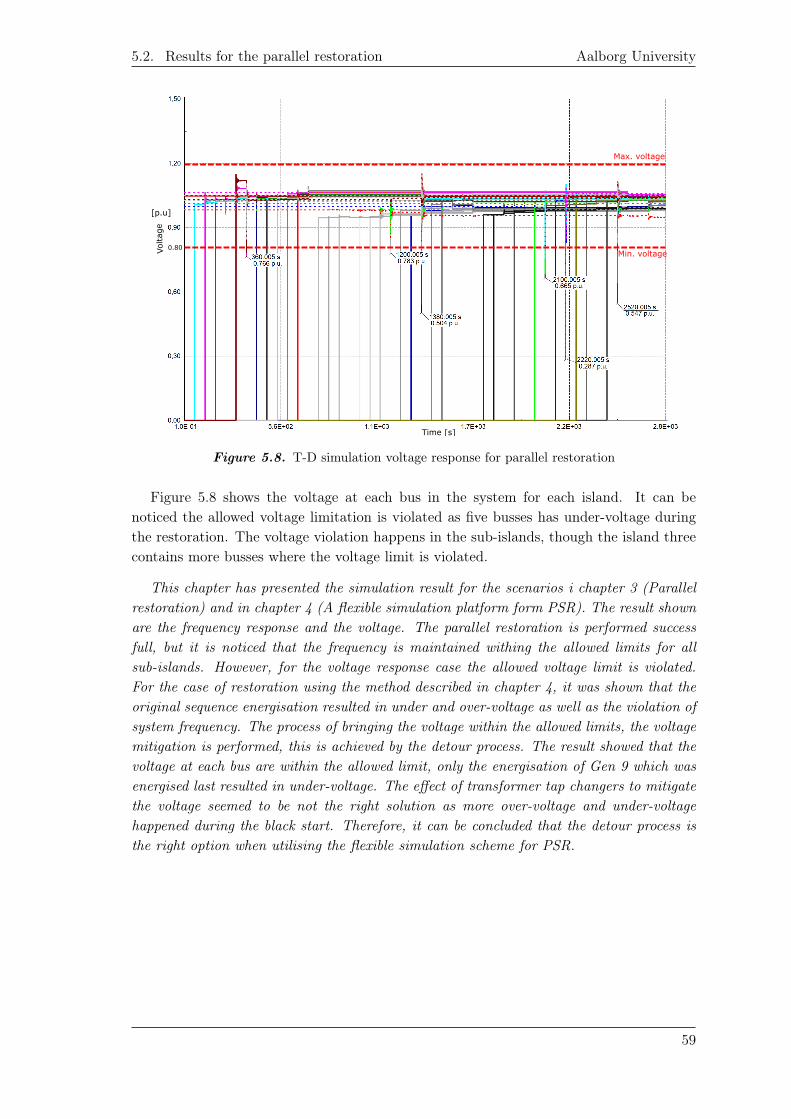
5.2. Results for the parallel restoration Aalborg University
Time [s]
Vol
tage
[p.u]
Max. voltage
Min. voltage0.80
Figure 5.8. T-D simulation voltage response for parallel restoration
Figure 5.8 shows the voltage at each bus in the system for each island. It can benoticed the allowed voltage limitation is violated as five busses has under-voltage duringthe restoration. The voltage violation happens in the sub-islands, though the island threecontains more busses where the voltage limit is violated.
This chapter has presented the simulation result for the scenarios i chapter 3 (Parallelrestoration) and in chapter 4 (A flexible simulation platform form PSR). The result shownare the frequency response and the voltage. The parallel restoration is performed successfull, but it is noticed that the frequency is maintained withing the allowed limits for allsub-islands. However, for the voltage response case the allowed voltage limit is violated.For the case of restoration using the method described in chapter 4, it was shown that theoriginal sequence energisation resulted in under and over-voltage as well as the violation ofsystem frequency. The process of bringing the voltage within the allowed limits, the voltagemitigation is performed, this is achieved by the detour process. The result showed that thevoltage at each bus are within the allowed limit, only the energisation of Gen 9 which wasenergised last resulted in under-voltage. The effect of transformer tap changers to mitigatethe voltage seemed to be not the right solution as more over-voltage and under-voltagehappened during the black start. Therefore, it can be concluded that the detour process isthe right option when utilising the flexible simulation scheme for PSR.
59

Conclusion 6This thesis has dealt with power system restoration, meaning finding the energisationpaths for restoration of electrical loads and generation. Two way for restoration weretested, the first was the parallel restoration, where the islands was divided into threesub-islands, which can be restored in parallel. The graph theory was utilised for thisrestoration strategy which focuses on restoring the critical loads before non-critical loads.The sequence energisation paths for each island were restored by focusing on the islandsbeing restored within approximately same time. After the energisation paths have beensuccessfully made, it is shown that the islands 1, 2 and 3 have restoration time of 170min, 170 min and 175 min respectively. By looking at the system frequency and voltageresponse at each bus in the sub-island, it is noticed that the frequency is maintainedwithing the allowed limits for all sub-islands. However, for the voltage response case theallowed voltage limit is violated, this happens in all sub-islands. The sub-island 1 had onebus with under-voltage, the island 2 had one and the island 3 had three busses with under-voltage. A FACTS device can be utilised during the parallel restoration, it an be installedthe busses where the voltage is violated, in this case reactive power can be injected to risethe system voltage.
For the case of restoration using the method described in chapter 4 (A flexible simulationplatform for PSR), it was shown that the original sequence energisation paths as taggedcase A, resulted in under and over-voltage as well as the violation of system frequency.The process of bringing the voltage within the allowed limits, the voltage mitigation isperformed, this is achieved by the detour process. The result showed that the voltageat each bus are within the allowed limit, only the energisation of Gen 9 which wasenergised last resulted in under-voltage. The effect of transformer tap changers to mitigatethe voltage seemed to be not the right solution as more over-voltage and under-voltagehappened during the black start. Therefore, it can be concluded that the detour processis the right option when utilising the flexible simulation scheme for PSR. The flexiblesimulation platform for PSR can be utilised in the industry to help reduce the restorationprocess. This because, after the disturbance has been occurred, the restoration platformcan find the energisation paths quickly, where the faulty line can be isolated by the detourproess.
61

Future Work 7Based on the work done in this thesis the recommendation to further the topic of hybridsimulation platform are listed bellow:
• Include an SVC in the study The parallel synchronous Var compensate is usedfor reactive power compensation Hence, it would be interesting to install one at thebusses where the system voltage is violated such as in he parallel restoration.
• Use different restoration strategies: The build up restoration strategy wasinvestigated in two main case, one for sub-islands creation and the other one inthe developed restoration platform where the system is considered as having onlyone black start unit available. Using an other strategy, such as the VSC-HVDCwhich can restore the island without the need for dividing the network, would ofinterest.
• Experiment: Only simulation was performed in this thesis, it would be interestingto experiment the hybrid strategy on a real network.
63

Bibliography
[1] IEC 60038. INTERNATIONAL STANDARD.https://webstore.iec.ch/p-preview/infoiec60038
[2] R. F. Chu C. C. Liu, K. L. Liou and A. T. Holen. Generation Capability Dispatch forBulk Power System Restoration: A Knowledge-Based Approach.https://ieeexplore-ieee-org.zorac.aub.aau.dk/stamp/stamp.jsp?tp=arnumber=221225.
[3] A. Hahn C. H. Sun and C. H. Liu. Cyber security of a power grid: State-of-the-art.https://reader.elsevier.com/reader/sd/pii/S0142061517328946?token=F239792B94EAF932F891433DEBEB884BFE47A342B9144890CF53967AE59454C97CD152BFDC0F374A042F54A8DBFB5D9D.
[4] P. Dutta C. Pang and M. Kezunovic. BEVs/PHEVs as Dispersed Energy Storage forV2B Uses in the Smart Grid.https://ieeexplore-ieee-org.zorac.aub.aau.dk/stamp/stamp.jsp?tp=arnumber=6086751.
[5] P. Kaufmann C. Shen and M. Braun. Fast network restoration by partitioning of parallelblack start zones. https://ieeexplore.ieee.org/stamp/stamp.jsp?tp=arnumber=8417076.
[6] J. E. Chadwick. How a Smarter Grid Could Have Prevented the 2003 U.S. CascadingBlackout. https://ieeexplore.ieee.org/stamp/stamp.jsp?tp=arnumber=6506036.
[7] M. S. A. Talip K. Naidu D. N. A. Talib, H. Mokhlis and H. Suyono. Power SystemRestoration Planning Strategy Based on Optimal Energizing Time of SectionalizingIslands. https://www.mdpi.com/1996-1073/11/5/1316.
[8] Geo Risks Research Department. Winter storms in Europe (II).http://www.planat.ch/fileadmin/PLANAT/planatpdf/alle2012/2001 −2005/MunichReGroup2002−W interstormsinEuropeII.pdf.
[9] J. A. Kavicky E. C. Portante, S. F. Folga and L. T. Malone. Cyber security of a powergrid: State-of-the-art.https://ieeexplore.ieee.org/stamp/stamp.jsp?tp=arnumber=7020005.
[10] R. B. Stuart E. H. Allen and T. E. Wiedman. No Light in August.https://ieeexplore-ieee-org.zorac.aub.aau.dk/stamp/stamp.jsp?tp=arnumber=6684692.
[11] C. Li Y. Cao Y. Li B. Zhou F. Wang, C. Chen and X. Dong. A Multi Stage RestorationMethod for Medium-Voltage Distribution System With DGs.https://ieeexplore.ieee.org/stamp/stamp.jsp?tp=arnumber=7428966.
[12] J. Feltes and C. Grande-Moran. Down, but Not Out.https://ieeexplore.ieee.org/stamp/stamp.jsp?tp=arnumber=6684687.
[13] E. Fuchs and M.A.S. Masoum. Power Quality in Power Systems and Electrical Machines.Number ISBN: 978-0-12-369536-9 in -. Elsevier Inc, 2008.
65
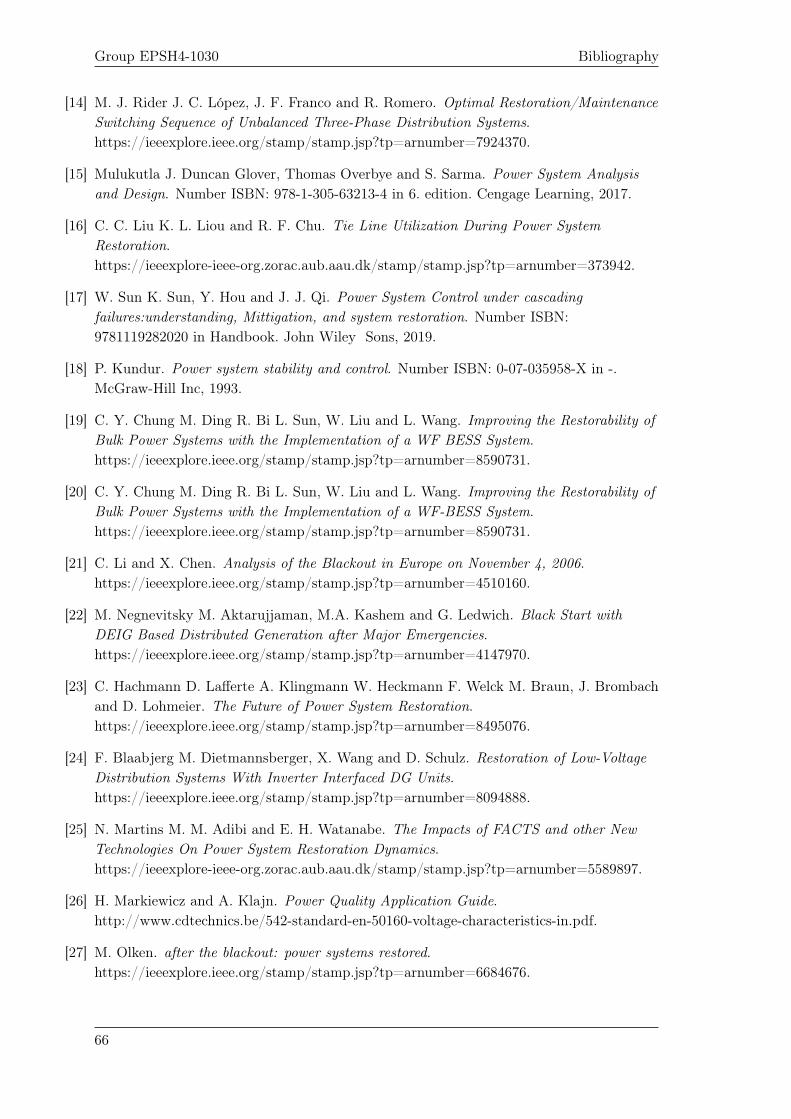
Group EPSH4-1030 Bibliography
[14] M. J. Rider J. C. López, J. F. Franco and R. Romero. Optimal Restoration/MaintenanceSwitching Sequence of Unbalanced Three-Phase Distribution Systems.https://ieeexplore.ieee.org/stamp/stamp.jsp?tp=arnumber=7924370.
[15] Mulukutla J. Duncan Glover, Thomas Overbye and S. Sarma. Power System Analysisand Design. Number ISBN: 978-1-305-63213-4 in 6. edition. Cengage Learning, 2017.
[16] C. C. Liu K. L. Liou and R. F. Chu. Tie Line Utilization During Power SystemRestoration.https://ieeexplore-ieee-org.zorac.aub.aau.dk/stamp/stamp.jsp?tp=arnumber=373942.
[17] W. Sun K. Sun, Y. Hou and J. J. Qi. Power System Control under cascadingfailures:understanding, Mittigation, and system restoration. Number ISBN:9781119282020 in Handbook. John Wiley Sons, 2019.
[18] P. Kundur. Power system stability and control. Number ISBN: 0-07-035958-X in -.McGraw-Hill Inc, 1993.
[19] C. Y. Chung M. Ding R. Bi L. Sun, W. Liu and L. Wang. Improving the Restorability ofBulk Power Systems with the Implementation of a WF BESS System.https://ieeexplore.ieee.org/stamp/stamp.jsp?tp=arnumber=8590731.
[20] C. Y. Chung M. Ding R. Bi L. Sun, W. Liu and L. Wang. Improving the Restorability ofBulk Power Systems with the Implementation of a WF-BESS System.https://ieeexplore.ieee.org/stamp/stamp.jsp?tp=arnumber=8590731.
[21] C. Li and X. Chen. Analysis of the Blackout in Europe on November 4, 2006.https://ieeexplore.ieee.org/stamp/stamp.jsp?tp=arnumber=4510160.
[22] M. Negnevitsky M. Aktarujjaman, M.A. Kashem and G. Ledwich. Black Start withDEIG Based Distributed Generation after Major Emergencies.https://ieeexplore.ieee.org/stamp/stamp.jsp?tp=arnumber=4147970.
[23] C. Hachmann D. Lafferte A. Klingmann W. Heckmann F. Welck M. Braun, J. Brombachand D. Lohmeier. The Future of Power System Restoration.https://ieeexplore.ieee.org/stamp/stamp.jsp?tp=arnumber=8495076.
[24] F. Blaabjerg M. Dietmannsberger, X. Wang and D. Schulz. Restoration of Low-VoltageDistribution Systems With Inverter Interfaced DG Units.https://ieeexplore.ieee.org/stamp/stamp.jsp?tp=arnumber=8094888.
[25] N. Martins M. M. Adibi and E. H. Watanabe. The Impacts of FACTS and other NewTechnologies On Power System Restoration Dynamics.https://ieeexplore-ieee-org.zorac.aub.aau.dk/stamp/stamp.jsp?tp=arnumber=5589897.
[26] H. Markiewicz and A. Klajn. Power Quality Application Guide.http://www.cdtechnics.be/542-standard-en-50160-voltage-characteristics-in.pdf.
[27] M. Olken. after the blackout: power systems restored.https://ieeexplore.ieee.org/stamp/stamp.jsp?tp=arnumber=6684676.
66
Bibliography Aalborg University
[28] K. BALASUBRAMANIAM P. HINES and E.C. SANCHEZ. Cascading failures in powergrids.https://ieeexplore-ieee-org.zorac.aub.aau.dk/stamp/stamp.jsp?tp=arnumber=5235532.
[29] S. G. Vennelaganti P. M. Farsani and N. R. Chaudhuri. Synchrophasor-enabled powergrid restoration with DFIG-based wind farms and VSC HVDC transmission system.https://ieeexplore.ieee.org/stamp/stamp.jsp?tp=arnumber=8319616.
[30] P. F. Coventry P. Wang, X. P. Zhang and R. Zhang. Start-up control of an offshoreintegrated MMC multi terminal HVDC system with reduced DC voltage.https://ieeexplore.ieee.org/stamp/stamp.jsp?tp=arnumber=7239652.
[31] C. E. Ugalde-Loo A. Adamczyk C. Barker R. Dantas, J. Liang and R. Whithehouse.Progressive Fault Isolation and Grid Restoration Strategy for MTDC Networks.https://ieeexplore.ieee.org/stamp/stamp.jsp?tp=arnumber=8003498.
[32] T. K. Saha-F. Bai R. Yan, N. Masood and H. Gu. The Anatomy of the 2016 SouthAustralia Blackout:A Catastrophic Event in a High Renewable Network.https://ieeexplore.ieee.org/stamp/stamp.jsp?tp=arnumber=8327538.
[33] G. Pal S. Sarkar, G. Saha and T. Karmakar. Indian Experience on Smart GridApplication in Blackout Control.https://ieeexplore.ieee.org/stamp/stamp.jsp?tp=arnumber=7489079.
[34] H. H. Iu-T. Fernando S. Yu, L. Zhang and K. P. Wong. A DSE-Based Power SystemFrequency Restoration Strategy for PV-Integrated Power Systems Considering SolarIrradiance Variations.https://ieeexplore.ieee.org/stamp/stamp.jsp?tp=arnumber=7903617.
[35] T. Sakaguchi and K. Matsumoto. DEVELOPMENT OF A KNOWLEDGE BASEDSYSTEM FOR POWER SYSTEM RESTORATION.https://ieeexplore-ieee-org.zorac.aub.aau.dk/stamp/stamp.jsp?tp=arnumber=4111937.
[36] M. Sforna and M. Delfanti. Overview of the events and causes of the 2003 Italianblackout. https://ieeexplore.ieee.org/stamp/stamp.jsp?tp=arnumber=4075762.
[37] J.D. Willson and M.E. Long. System Restoration Readiness.https://ieeexplore.ieee.org/stamp/stamp.jsp?tp=arnumber=8386982.
[38] Q. Xie and R. Zhu. Earth, Wind and Ice.https://ieeexplore-ieee-org.zorac.aub.aau.dk/stamp/stamp.jsp?tp=arnumber=5719451.
[39] M. Kato Y. Kojima, S. Warashina and H. Watanabe. THE DEVELOPMENT OFPOWER SYSTEM RESTORATION METHOD FOR A BULK POWER SYSTEM BYAPPLYING KNOWLEDGE ENGINEERING TECHNIQUES.https://ieeexplore-ieee-org.zorac.aub.aau.dk/stamp/stamp.jsp?tp=arnumber=32621.
[40] S. Nakamura Y. Kojima, S. Warashina and K. Matsumoto. DEVELOPMENT OF AGUIDANCE METHOD FOR POWER SYSTEM RESTORATION.https://ieeexplore-ieee-org.zorac.aub.aau.dk/stamp/stamp.jsp?tp=arnumber=32620.
67
Group EPSH4-1030 Bibliography
[41] K. P. Schneider F. K Tuffner Y. Xu, C. C. Liu and D. T. Ton. Microgrids for ServiceRestoration to Critical Load in a Resilient Distribution System.https://ieeexplore.ieee.org/stamp/stamp.jsp?tp=arnumber=7513408.
[42] J. Wang Z. Wang and C. Chen. A Three Phase Microgrid Restoration Model ConsideringUnbalanced Operation of Distributed Generation.https://ieeexplore.ieee.org/stamp/stamp.jsp?tp=arnumber=7776868.
68
DPL Scripts for theFlexible simulation
platform for PSR AThis chapter present the scripts developed to perform the finding of energisation paths forblack start.
A.1 Scripts for black start
69
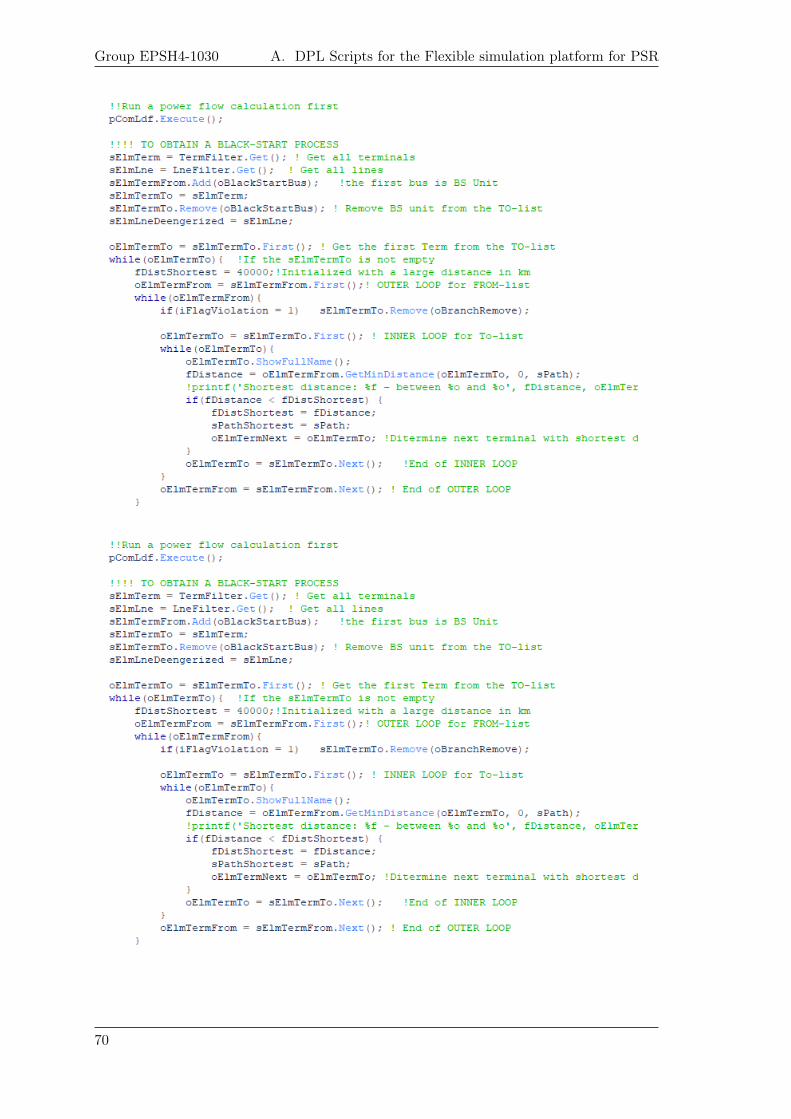
Group EPSH4-1030 A. DPL Scripts for the Flexible simulation platform for PSR
70
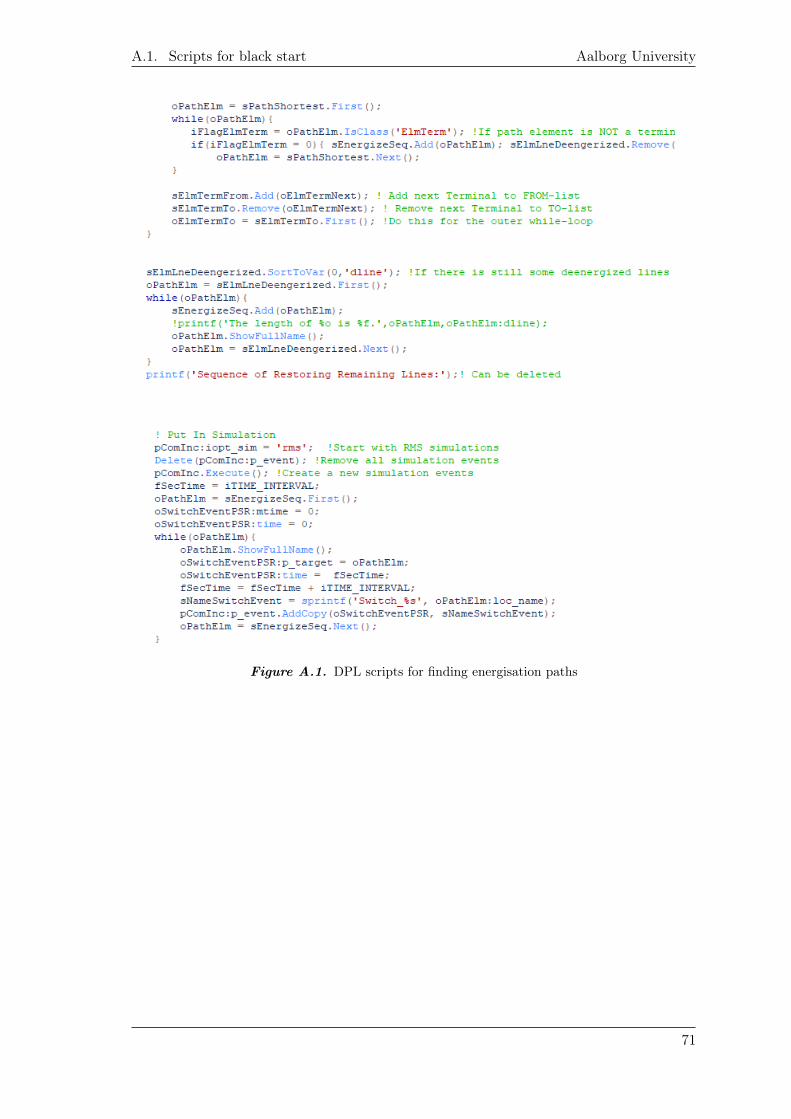
A.1. Scripts for black start Aalborg University
Figure A.1. DPL scripts for finding energisation paths
71

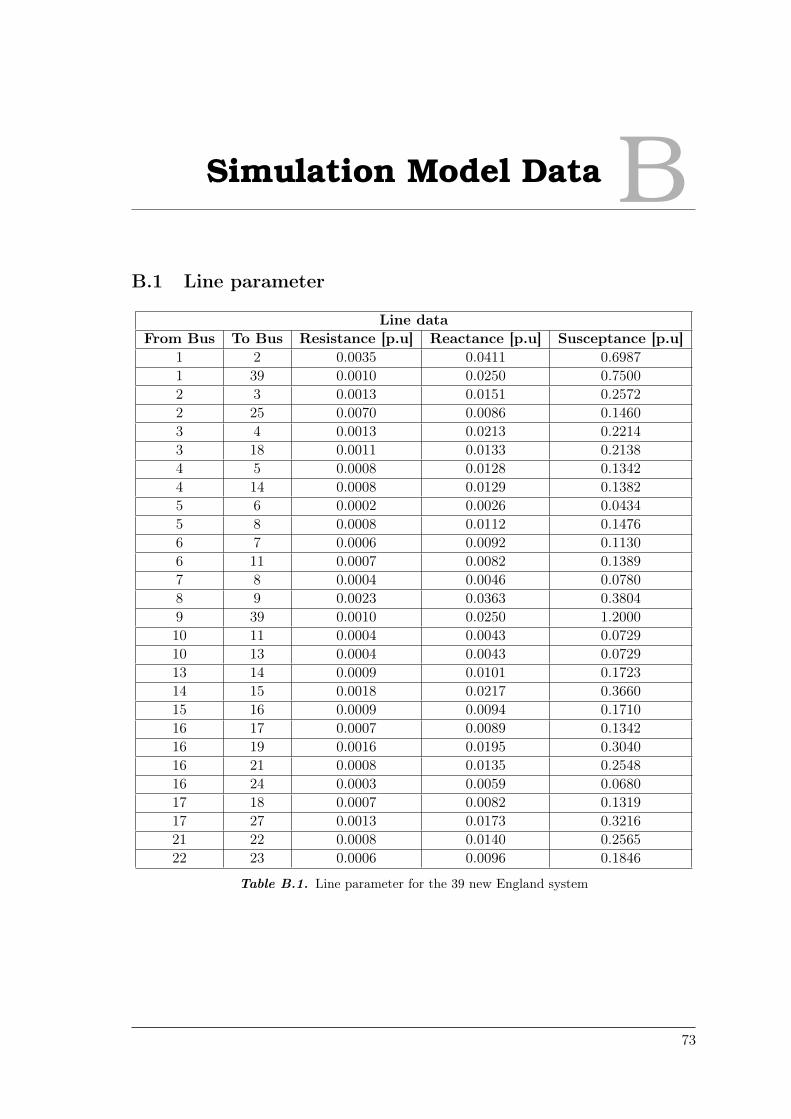
Simulation Model Data BB.1 Line parameter
Line dataFrom Bus To Bus Resistance [p.u] Reactance [p.u] Susceptance [p.u]
1 2 0.0035 0.0411 0.69871 39 0.0010 0.0250 0.75002 3 0.0013 0.0151 0.25722 25 0.0070 0.0086 0.14603 4 0.0013 0.0213 0.22143 18 0.0011 0.0133 0.21384 5 0.0008 0.0128 0.13424 14 0.0008 0.0129 0.13825 6 0.0002 0.0026 0.04345 8 0.0008 0.0112 0.14766 7 0.0006 0.0092 0.11306 11 0.0007 0.0082 0.13897 8 0.0004 0.0046 0.07808 9 0.0023 0.0363 0.38049 39 0.0010 0.0250 1.200010 11 0.0004 0.0043 0.072910 13 0.0004 0.0043 0.072913 14 0.0009 0.0101 0.172314 15 0.0018 0.0217 0.366015 16 0.0009 0.0094 0.171016 17 0.0007 0.0089 0.134216 19 0.0016 0.0195 0.304016 21 0.0008 0.0135 0.254816 24 0.0003 0.0059 0.068017 18 0.0007 0.0082 0.131917 27 0.0013 0.0173 0.321621 22 0.0008 0.0140 0.256522 23 0.0006 0.0096 0.1846
Table B.1. Line parameter for the 39 new England system
73
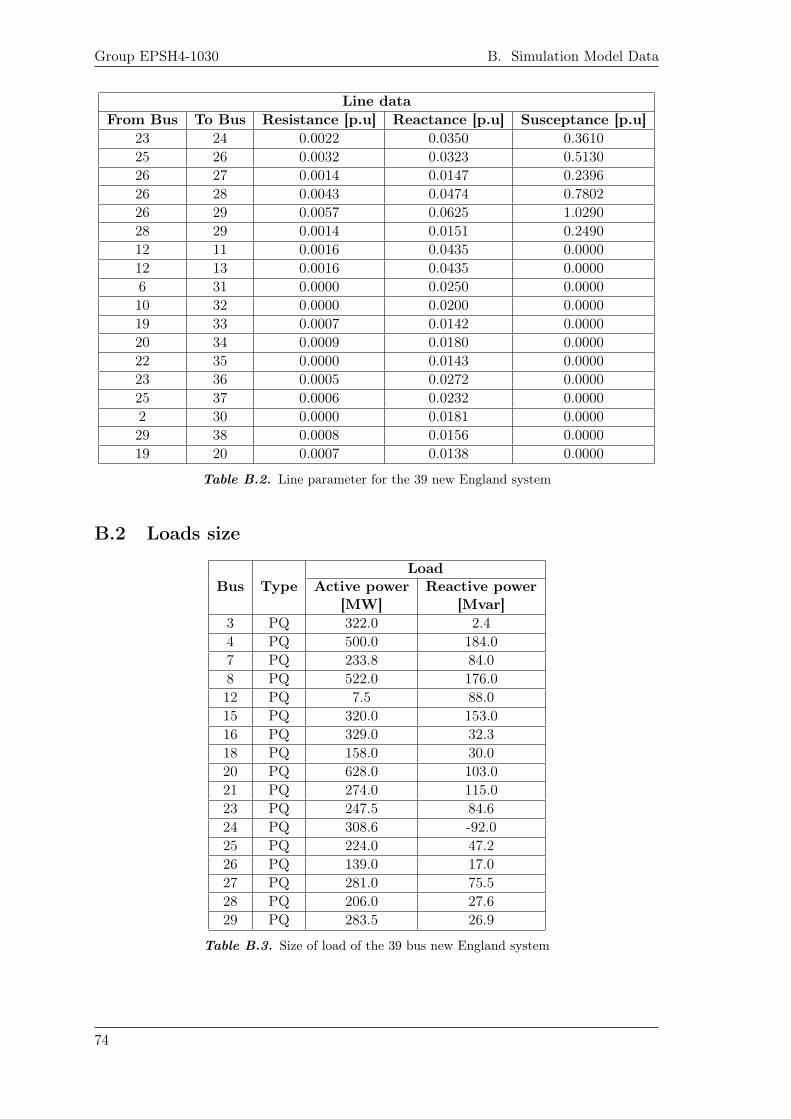
Group EPSH4-1030 B. Simulation Model Data
Line dataFrom Bus To Bus Resistance [p.u] Reactance [p.u] Susceptance [p.u]
23 24 0.0022 0.0350 0.361025 26 0.0032 0.0323 0.513026 27 0.0014 0.0147 0.239626 28 0.0043 0.0474 0.780226 29 0.0057 0.0625 1.029028 29 0.0014 0.0151 0.249012 11 0.0016 0.0435 0.000012 13 0.0016 0.0435 0.00006 31 0.0000 0.0250 0.000010 32 0.0000 0.0200 0.000019 33 0.0007 0.0142 0.000020 34 0.0009 0.0180 0.000022 35 0.0000 0.0143 0.000023 36 0.0005 0.0272 0.000025 37 0.0006 0.0232 0.00002 30 0.0000 0.0181 0.000029 38 0.0008 0.0156 0.000019 20 0.0007 0.0138 0.0000
Table B.2. Line parameter for the 39 new England system
B.2 Loads size
LoadBus Type Active power
[MW]Reactive power
[Mvar]3 PQ 322.0 2.44 PQ 500.0 184.07 PQ 233.8 84.08 PQ 522.0 176.012 PQ 7.5 88.015 PQ 320.0 153.016 PQ 329.0 32.318 PQ 158.0 30.020 PQ 628.0 103.021 PQ 274.0 115.023 PQ 247.5 84.624 PQ 308.6 -92.025 PQ 224.0 47.226 PQ 139.0 17.027 PQ 281.0 75.528 PQ 206.0 27.629 PQ 283.5 26.9
Table B.3. Size of load of the 39 bus new England system
74
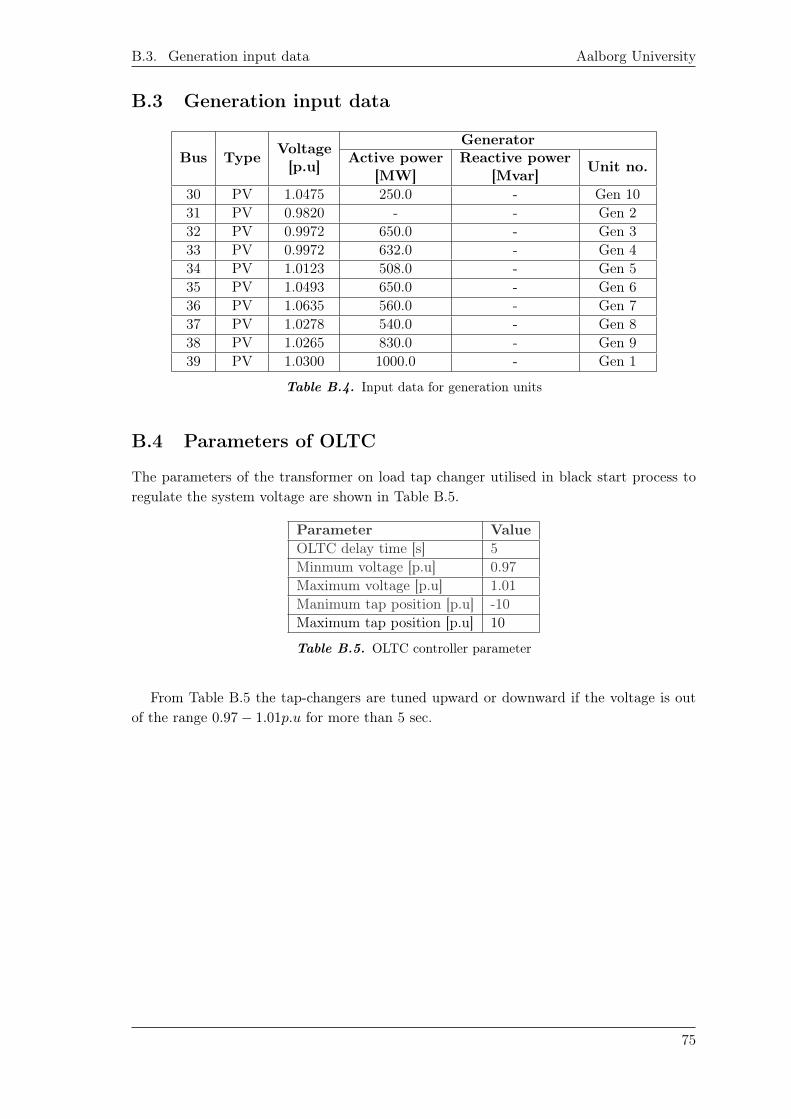
B.3. Generation input data Aalborg University
B.3 Generation input data
GeneratorBus Type Voltage
[p.u] Active power[MW]
Reactive power[Mvar] Unit no.
30 PV 1.0475 250.0 - Gen 1031 PV 0.9820 - - Gen 232 PV 0.9972 650.0 - Gen 333 PV 0.9972 632.0 - Gen 434 PV 1.0123 508.0 - Gen 535 PV 1.0493 650.0 - Gen 636 PV 1.0635 560.0 - Gen 737 PV 1.0278 540.0 - Gen 838 PV 1.0265 830.0 - Gen 939 PV 1.0300 1000.0 - Gen 1
Table B.4. Input data for generation units
B.4 Parameters of OLTC
The parameters of the transformer on load tap changer utilised in black start process toregulate the system voltage are shown in Table B.5.
Parameter ValueOLTC delay time [s] 5Minmum voltage [p.u] 0.97Maximum voltage [p.u] 1.01Manimum tap position [p.u] -10Maximum tap position [p.u] 10
Table B.5. OLTC controller parameter
From Table B.5 the tap-changers are tuned upward or downward if the voltage is outof the range 0.97 − 1.01p.u for more than 5 sec.
75