Embed Size (px)
Citation preview
A Smart Investment for a Smarter Australia: Economic analysis of universal early childhood education in the year before school in Australia
The Front Project
June 2019
Disclaimer Notice to any reader of the attached report
This report is not intended to be relied on by anyone other than The Front Project.
We prepared this report solely for The Front Project’s use and benefit in accordance with and
for the purpose set out in Section 1 of the report. In doing so, we acted exclusively for The
Front Project and considered no-one else’s interests.
We accept no responsibility, duty or liability:
to anyone other than The Front Project in connection with this report
to The Front Project for the consequences of using or relying on it for a purpose other
than that referred to above.
We make no representation concerning the appropriateness of this report for anyone other
than The Front Project. If anyone other than The Front Project chooses to use or rely on it
they do so at their own risk.
This disclaimer applies:
to the maximum extent permitted by law and, without limitation, to liability arising in
negligence or under statute; and
even if we consent to anyone other than The Front Project receiving or using this report.
Liability limited by a scheme approved under Professional Standards legislation
3 A Smart Investment for a Smarter Australia: Economic analysis of universal early childhood education in the year before school in Australia
Contents
Executive summary ................................................................................................................... 4
1 Introduction ....................................................................................................................... 7
2 Project approach ............................................................................................................... 9
3 Analytical framework....................................................................................................... 13
4 Key assumptions used in the analysis............................................................................ 19
5 Costs of early childhood education ................................................................................. 23
6 Benefits of early childhood education ............................................................................. 30
7 Results of cost-benefit analysis ...................................................................................... 43
Appendix A References .......................................................................................................... 50
Appendix B Determining effect sizes ...................................................................................... 55
Appendix C Model analysis details ......................................................................................... 58
4 A Smart Investment for a Smarter Australia: Economic analysis of universal early childhood education in the year before school in Australia
Executive summary There is an increasingly strong evidence base that demonstrates the impact of the early years on
outcomes later on in life. While early childhood experiences do not entirely dictate future
trajectories, they do create the foundations for all future learning, health and wellbeing.
Over the past 50 years, numerous international studies have shown that high quality early
childhood education can have substantial and sustained impacts on a whole range of skills that
are important for children’s futures. However, to date, no economic assessments of Australian
early childhood education programs have been undertaken. International models do not
necessarily reflect the unique nature of early child education provision in Australia or the specific
social and economic circumstances of Australian society.
The Front Project commissioned PwC to undertake an economic analysis of early childhood
education in Australia. The analysis focusses on the early childhood education provided to
children in the year before they start school – often known as either preschool or kindergarten.
Scope of the analysis
The analysis has considered the benefits of early childhood education for children, their parents
or carers, governments and employers against the costs of providing that early childhood
education. It has used a methodology that is consistent with similar past studies and accepted
approaches to economic analysis. It considers a broad range of short, medium and long-term
benefits, all of which are strongly supported by either Australian or international evidence and use
contemporary Australian data.
Benefits:
Children, their parents or carers, governments and business all benefit from the provision of a
quality early childhood education:
The benefits of early childhood education for children include increased cognitive capabilities,
which can be measured in terms of improved literacy and numeracy. These can be linked to
improved achievement at school, which in turn affect school completion rates and levels of
educational attainment. Educational attainment is in turn a strong predictor of earnings over
a lifetime.
Some of the parents and carers of children who participate in early childhood education are
able to participate in paid work, when they otherwise would not be able to, or choose to work
more hours. They benefit from higher incomes, including over an extended period as a result
of less career disruption.
Early childhood education also contributes to a more capable and highly qualified workforce,
which is a benefit to business in terms of higher productivity and greater levels of innovation.
Governments are long-term beneficiaries of the provision of early childhood education. They benefit from higher taxes paid by parents and carers who are able to work more, and children who earn more over their lifetimes. Early childhood education also reduces unemployment and the resulting payments of unemployment benefits and other forms of social expenditure. State and Territory governments are beneficiaries as a result of fewer children repeating a year of school or needing special education placements, as well as lower health and criminal justice systems costs.
5 A Smart Investment for a Smarter Australia: Economic analysis of universal early childhood education in the year before school in Australia
Whilst this study has been able to quantify in economic terms a broad range of benefits form
investment in early childhood education, there are additional benefits from early childhood
education that have not been quantified. A significant benefit of early childhood education is the
improved social and emotional skills it provides children. Social and emotional skills have a
significant and lasting impact on children and affect outcomes over their lifetime, contributing to
achievement at school and at work, to positive relationships and social cohesion, to mental health
and wellbeing. There is emerging evidence that early social and emotional capabilities developed
in early childhood education predict later outcomes, but there currently insufficient evidence to
track these benefits and quantify them in monetary terms over a lifetime. As such, our analysis is
likely to be a conservative estimate of the overall benefits of early childhood education.
Costs:
The study has focussed on children accessing 15 hours of early childhood education in the year-
before-school. Contributors to this cost include:
The Commonwealth Government, who is the major funder of early childhood education
provided through the Child Care Subsidy1 as well as payments made to State and Territory
Governments under the National Partnership Agreement on Universal Access to Early
Childhood Education (NP UAECE).
The governments of Australia’s states and territories, who contribute to the cost by directly
delivering early childhood education programs or funding other providers to do so, as well as
undertaking regulatory and policy functions.
Parents and carers, who contribute to costs in terms of fees paid to providers of early
childhood education services.
Key findings
Using 2017 as the reference year, this study has identified $2.34 billion in costs associated with
the provision of early 15 hours of early childhood education in the year-before-school. These
costs are split between government (79 per cent) and parents or carers (21 per cent).
The study has also identified $4.74 billion in benefits associated with providing this one year of
early childhood education. Some of these benefits will be realised in the short-term, including the
additional income and higher taxes paid by parents or carers who choose to work more because
early childhood education is available ($1.46 billion and $313 million respectively). Other benefits
will be realised over a much longer period. The cognitive benefits for children who receive a
quality early childhood education can be linked with to $1.06 billion in higher earnings over a
lifetime and a further $495 million in higher taxes paid to government.
The timing of the benefits has been accounted for using a discount rate of 3 per cent, which is
consistent with other studies of the long-term benefits of social programs. The
beneficiaries include:
Children - $997 million or 21 per cent of benefits
Parents and carers – $1.46 billion or 31 per cent of benefits
Governments – $1.96 billion or 41 per cent of benefits
Employers and businesses – $319 million or 7 per cent of benefits
A graphical representation of the results of the economic analysis is below.
1 This study has used 2017 data, so has calculated the costs of the Commonwealth Government’s Child Care Benefit (CCB) and the Child
Care Rebate (CCR), which were replaced by the CCS in July 2018.
6 A Smart Investment for a Smarter Australia: Economic analysis of universal early childhood education in the year before school in Australia
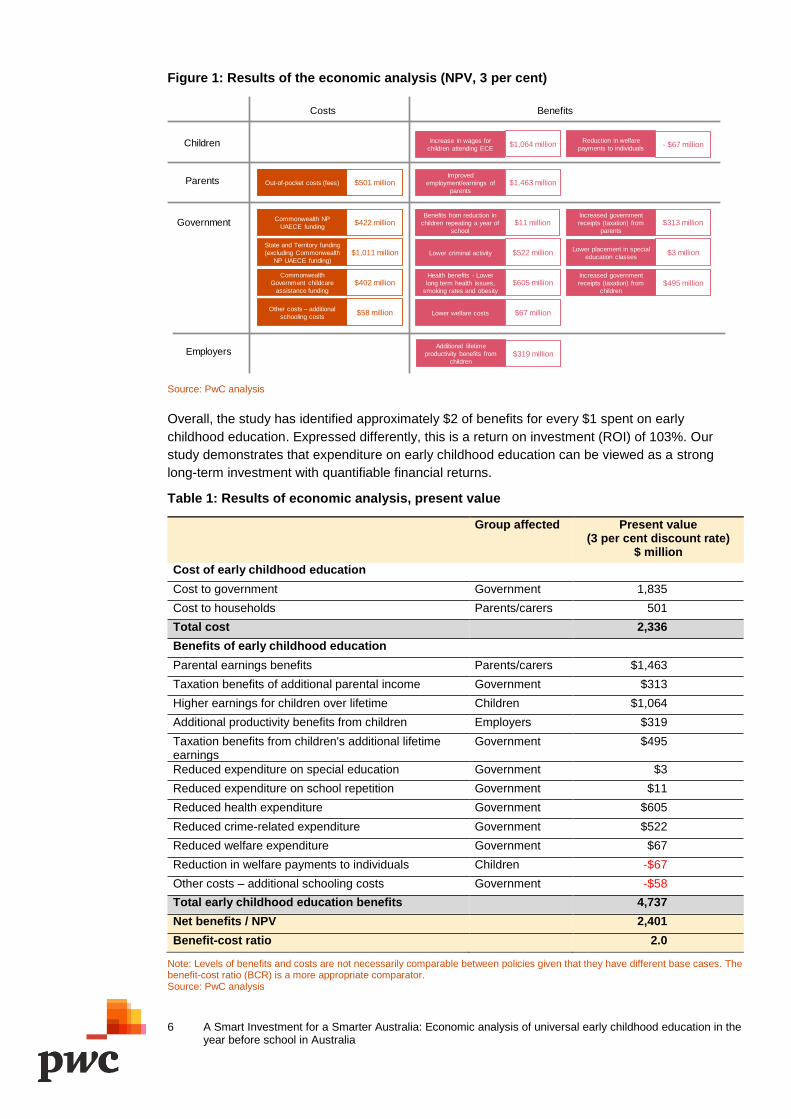
Figure 1: Results of the economic analysis (NPV, 3 per cent)
Source: PwC analysis
Overall, the study has identified approximately $2 of benefits for every $1 spent on early
childhood education. Expressed differently, this is a return on investment (ROI) of 103%. Our
study demonstrates that expenditure on early childhood education can be viewed as a strong
long-term investment with quantifiable financial returns.
Table 1: Results of economic analysis, present value
Group affected Present value (3 per cent discount rate)
$ million
Cost of early childhood education
Cost to government Government 1,835
Cost to households Parents/carers 501
Total cost 2,336
Benefits of early childhood education
Parental earnings benefits Parents/carers $1,463
Taxation benefits of additional parental income Government $313
Higher earnings for children over lifetime Children $1,064
Additional productivity benefits from children Employers $319
Taxation benefits from children's additional lifetime earnings
Government $495
Reduced expenditure on special education Government $3
Reduced expenditure on school repetition Government $11
Reduced health expenditure Government $605
Reduced crime-related expenditure Government $522
Reduced welfare expenditure Government $67
Reduction in welfare payments to individuals Children -$67
Other costs – additional schooling costs Government -$58
Total early childhood education benefits 4,737
Net benefits / NPV 2,401
Benefit-cost ratio 2.0
Note: Levels of benefits and costs are not necessarily comparable between policies given that they have different base cases. The benefit-cost ratio (BCR) is a more appropriate comparator. Source: PwC analysis
Increase in wages for
children attending ECE
Lower criminal activity
Lower welfare costs
Improved
employment/earnings of
parents
Health benefits - Lower
long term health issues,
smoking rates and obesity
Increased government
receipts (taxation) from
parents
Increased government
receipts (taxation) from
children
Lower placement in special
education classes
Benefits from reduction in
children repeating a year of
school
Out-of-pocket costs (fees)
State and Territory funding
(excluding Commonwealth
NP UAECE funding)
Commonwealth NP
UAECE funding
Commonwealth
Government childcare
assistance funding
BenefitsCosts
Children
Parents
Government
$501 million
$1,011 million
$422 million
$402 million
$1,064 million
$522 million
$67 million
$1,463 million
$605 million
$11 million
$3 million
$495 million
$313 million
Reduction in welfare
payments to individuals- $67 million
Other costs – additional
schooling costs$58 million
Additional lifetime
productivity benefits from
children
Employers $319 million
7 A Smart Investment for a Smarter Australia: Economic analysis of universal early childhood education in the year before school in Australia
1 Introduction The Front Project is an independent national enterprise working to improve quality and create
positive change in Australia’s early childhood education system. They work with government,
business and the early education sector to improve outcomes for children and in turn increase the
short and long-term gains for Australia. The Front Project aims to improve quality and
create positive change across Australia’s early childhood education system through:
activating a network of influential business and community leaders to boldly advocate for high
quality early learning
research and policy development that supports a high quality early learning system so all
children benefit and progress
convening and equipping leaders from the early learning sector to ignite change and improve
the quality of early learning for all children
campaigning for universal access to high quality early education programs that suit families
co-designing and implementing innovative program solutions that address gaps and
strengthen the early learning system.
The Front Project commissioned PwC to undertake an economic analysis of early childhood
education in Australia. The analysis focusses on the early childhood education provided to
children in the year before they start school – often known as either preschool or kindergarten.
There is an increasingly strong evidence base that demonstrates the impact of the early years on
outcomes later in life. While early childhood experiences do not entirely dictate future trajectories,
they are the foundations for future learning, health and wellbeing.
Over the past 50 years, numerous international studies have shown that high quality early
childhood education can have substantial and sustained impacts on a whole range of skills that
are important for children’s futures.
High quality early childhood education impacts children’s language, literacy and numeracy skills,
as well as their reasoning, problem-solving and analytical capabilities. It also impacts their social
and emotional development, including getting along well with others, listening and communicating
well, showing empathy, being motivated, possessing self-confidence, having initiative, paying
attention and focusing, persevering on challenging tasks, solving problems, managing emotions
and impulses, following rules (Heckman, Stixrud, & Urzua, 2006).
Improving children’s cognitive, social and emotional development can have substantial benefits
for children themselves, their families, and society and the economy. Economic analysis in the
United States and Europe has demonstrated that investments in early childhood education can
boost education achievement, employment and productivity while reducing expenditure on health,
education and justice.
To date, no economic assessments of Australian early childhood education programs have been
undertaken. International models do not necessarily reflect the nature of early child education
provision in Australia or the specific social and economic circumstances of Australian society.
This study addresses this gap by focusing on the costs and likely benefits of modern Australian
early childhood education programs, and using Australian education, employment, health and
welfare data to the greatest extent possible.
8 A Smart Investment for a Smarter Australia: Economic analysis of universal early childhood education in the year before school in Australia
There is a long history of economic analysis being used to inform decisions about public policy
initiatives and priorities for government investment. Cost-benefit analysis has been used, for
example, to document economic returns on investment for education and public health that have
led to major initiatives in these fields.
Applying an economic lens to social policy issues involves identification of benefits that are
observable, quantifiable and, importantly, able to be expressed in monetary terms. In practice,
this can mean economic analysis focuses only on a narrow range of potential benefits, leaving out
more intangible (but important) social outcomes like enhanced social cohesion or improved
wellbeing. However, a consistent approach to identifying and quantifying direct economic benefits
supports decision-makers to understand likely short and long-term impacts and make informed
decisions about where to focus their effort and place investment.
Early childhood education programs – known as preschool or kindergarten – are structured, play-
based, teacher-led early learning programs, currently attended by children in Australia for about
15 hours per week in the year before they start school. Children can attend their early childhood
education programs in long day care services, stand-alone centres, or in schools. All references
to early childhood education in this report refer to these preschool or kindergarten programs.
This report demonstrates why investment in the early years is central to Australia’s long-term
productivity and prosperity. The aim of this analysis is to answer the following research questions:
Box 1 Key research questions
Do the benefits of Australian early childhood education programs outweigh the costs of delivering them, and what is the return on investment?
What are the individual, social and government benefits of early childhood education?
The remainder of the report is structured as follows:
Chapter 2 – describes the methodology used to undertake the analysis
Chapter 3 – describes analytical framework used
Chapter 4 – outlines some the key assumptions used in the analysis
Chapter 5 – describes the calculation of the costs
Chapter 6 – describes the calculation of the benefits
Chapter 7 – sets out the results of the analysis
Appendix A – list of the references used
Appendix B – outlines the methodology for determining the effect size of early childhood
education on educational outcomes
Appendix C – sets out further details on the methodology behind the estimation of workforce
participation and societal benefits
9 A Smart Investment for a Smarter Australia: Economic analysis of universal early childhood education in the year before school in Australia
2 Project approach This chapter sets out the methodology we have used to undertake the economic analysis of early
childhood education and our consultation approach.
2.1 Economic analysis of early childhood education
This economic analysis of early childhood education in Australia compares the upfront cost of
early childhood education with the expected long-term economic benefits, such as reduced need
for special education services, improved education outcomes and higher lifetime earnings. By
undertaking this analysis, we aim to increase the evidence base for investing in early childhood
education. This in turn will enable more informed decisions about the allocation of resources for
early childhood education programs in Australia.
The contribution of early childhood education on the economy is characterised by a compelling
international evidence base. Much of the international evidence about the economic benefits of
early childhood education is drawn from a number of well known, small-scale randomised
controlled trials (RCTs) of targeted early childhood education interventions in the United States.
The cost-benefit analyses based on RCTs of targeted interventions generally provide support for
expanding early childhood education and care for disadvantaged children. These studies include:
High/Scope Perry Preschool (Heckman, Moon, Pinto, Savelyev, & Yavitz, 2010)
Abecedarian (Barnett & Masse, 2007)
Chicago Child-Parent Centers (Reynolds, 2002 and 2011) (Temple & Reynolds, 2015)
These RCTs studied high-intensity programs targeted at highly vulnerable children (in the US
around the 1960 and 70s). These programs generated a cost-benefit ratio of between 10 and 17,
with reduced crime being the most significant driver of savings (delivering 88 per cent of total
benefits), largely reflecting the social context of the United States (Schweinhart, et al., 2005). The
returns are higher the longer the children’s outcomes are measured (the children in the Perry
Preschool study are now aged over 55) (Heckman, Moon, Pinto, Savelyev, & Yavitz, 2010).
More recent cost-benefit analyses have examined universal early childhood education programs
delivered to a more socio-economically diverse cohort and generally involving lower levels of
quality (Cannon, et al., 2017) (Washington State Institute for Public Policy, 2018). These
programs have also been implemented more recently (i.e. from the mid 2000’s onwards), so
participants are much younger – and previous experience shows a large proportion of the benefits
accrue in adulthood, with proportionately small benefits from ‘education savings’. The benefit-cost
ratios for these studies have been around two to four. The majority of the benefits generated
through anticipated increases in employment, earnings and tax revenue and decreases in crime.
The reduction in expenditure on students repeating years of schooling and on special education
for children with learning difficulties was a minor component of the benefits.
In addition to the United States studies, there have also been several recent economic analyses
of universal early childhood education programs from elsewhere around the world, including:
A Cost-Benefit Analysis of Universal Preschool Education: Evidence from a Spanish Reform
(2016) (Van Huizen, Dumhs, & Plantenga, 2016)
The economic effects of pre-school education and quality, based on the EPPSE study (2014)
(Cattan, Crawford, & Dearden, 2014).
10 A Smart Investment for a Smarter Australia: Economic analysis of universal early childhood education in the year before school in Australia
The analysis of Spanish preschool reform provides causal evidence based cost-benefit analysis
of expanding universal access to preschool. This reform, implemented in Spain in the early
1990s, lowered the age of universal eligibility for publicly subsidized preschool from age four to
age three. The results showed a benefit-cost ratio of over four euros for every euro invested in
preschool. This study included the benefits from reduced grade retention (repeating a year of
school), improved lifetime earnings and increased taxation as well as benefits from increased
maternal employment (Van Huizen, Dumhs, & Plantenga, 2016).
The EPPSE project was the first large-scale British study of the effects of different preschool
experiences on children’s outcomes. Researchers looked at the impact of both preschool
education and preschool quality on short-term and long-term education outcomes, and future
labour market outcomes. It found that, on average, early childhood education increases the
probability of obtaining five or more pass grades for General Certificates of Secondary Education
(GCSE) by 8.4 percentage points, while it increases the average number of GCSEs achieved by
0.8 GCSEs (Cattan, Crawford, & Dearden, 2014). They estimate these children will go on to earn
on additional 7.9 per cent of gross earnings per individual (Hayward, Hunt, & Lord, 2014).
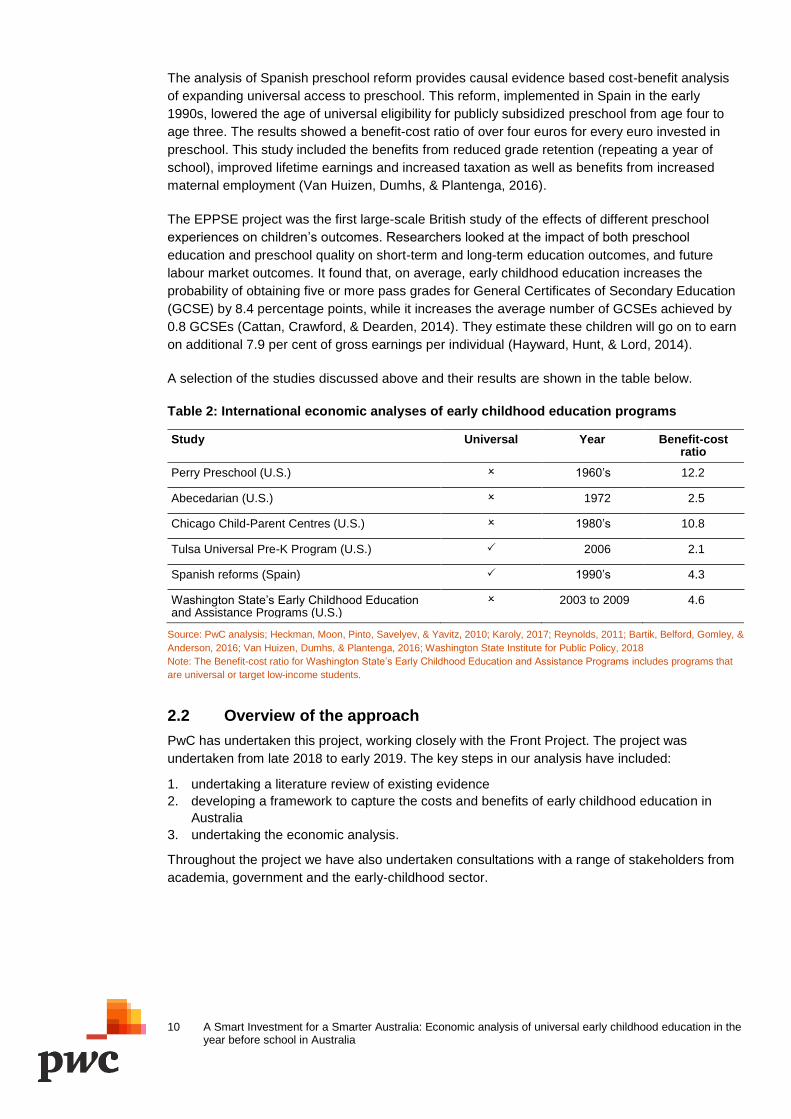
A selection of the studies discussed above and their results are shown in the table below.
Table 2: International economic analyses of early childhood education programs
Study Universal Year Benefit-cost ratio
Perry Preschool (U.S.) 1960’s 12.2
Abecedarian (U.S.) 1972 2.5
Chicago Child-Parent Centres (U.S.) 1980’s 10.8
Tulsa Universal Pre-K Program (U.S.) 2006 2.1
Spanish reforms (Spain) 1990’s 4.3
Washington State’s Early Childhood Education and Assistance Programs (U.S.)
2003 to 2009 4.6
Source: PwC analysis; Heckman, Moon, Pinto, Savelyev, & Yavitz, 2010; Karoly, 2017; Reynolds, 2011; Bartik, Belford, Gomley, &
Anderson, 2016; Van Huizen, Dumhs, & Plantenga, 2016; Washington State Institute for Public Policy, 2018
Note: The Benefit-cost ratio for Washington State’s Early Childhood Education and Assistance Programs includes programs that
are universal or target low-income students.
2.2 Overview of the approach
PwC has undertaken this project, working closely with the Front Project. The project was
undertaken from late 2018 to early 2019. The key steps in our analysis have included:
1. undertaking a literature review of existing evidence
2. developing a framework to capture the costs and benefits of early childhood education in
Australia
3. undertaking the economic analysis.
Throughout the project we have also undertaken consultations with a range of stakeholders from
academia, government and the early-childhood sector.
11 A Smart Investment for a Smarter Australia: Economic analysis of universal early childhood education in the year before school in Australia
2.3 Literature review
We have undertaken a review of the Australian and international evidence of the impacts of early
childhood education. Our review included:
evidence of the cognitive and social and emotional impacts of early childhood education, in the
short and long term
previous analysis of the economic impacts of early childhood education.
In undertaking the literature review we also identified data sources for input into our analysis. To
the greatest extent possible, we have used Australian data, so the model reflects the real costs of
delivery in Australia, as well as the impact of improved education on lifetime earnings and taxation
in Australia. However, Australian data has not been available in all cases and we have needed to
rely on some international evidence to address gaps in the Australian evidence-base. In
particular, there are few studies of the impact of modern Australian early childhood education
programs (especially after the introduction of the significant reforms 2008-2012 that introduced
the National Quality Standard and universal access to preschool), or on the health and social
impacts of early childhood education programs in Australia. Further details on the sources used
for the analysis is provided in Appendix A).
2.4 Framework development
Developing the analytical framework for the economic analysis has involved the following steps,
which are set out in more detail in Chapter 3 (and also Appendix B and C). The methodology has
been developed to be as consistent with international norms for economic analysis and Australian
Government guidance on cost-benefit analysis.
Table 3: Steps to develop the cost-benefit analysis (1)
No. Approach Description
1 Decide whose costs and benefits count
Identifying all those who contribute to the cost of early childhood education and all those who are likely to benefit in the short and long term.
2 Identify the impacts Reviewing the international and Australian literature to identify the full range of potential short and long term impacts, establishing the impacts that are backed by strong evidence and are ‘monetisable’ for the purpose of the economic analysis.
3 Predict the impacts over time
Identifying the timeframes in which the costs are incurred and the benefits are reaped, and using data to calculate the cumulative impacts over time. The approach forecasts the likely future benefits of the early childhood education provided today.
4 Monetise (attach dollar values to) impacts
Converting all of the non-monetary impacts (costs and benefits) into dollar values so the costs and benefits can be aggregated and then compared against one another. For example, calculating the dollar value of improved school achievement in respect to reduced need for expenditure on special education, and increased earnings from better jobs.
5 Discount future costs and benefits to obtain present values
As the benefits occur over a long time period, in order to compare the costs and the benefits there is a need to convert these into ‘today’s dollars’. This is done by applying a ‘discount rate’ to the values that occur in the future.
6 Compute the net present value and a benefit cost ratio
The net present value involves the summation of all impacts, costs and benefits in ‘today’s dollars’, and generates the ratio of costs to benefits.
7 Perform sensitivity analysis
This technique is used to determine how different assumptions would impact the net present value. In doing so, it tests the robustness of the model and the results of the analysis. Example scenarios include an increase of the discount rate or the size of the impacts.
8 Reach a conclusion After computing the net present value and performing a sensitivity analysis we are able to make a conclusion about the overall impact of early childhood education.
12 A Smart Investment for a Smarter Australia: Economic analysis of universal early childhood education in the year before school in Australia
2.5 Consultation approach
In developing the analysis, we undertook consultations with a range of stakeholders from
government and the early childhood sector, as well as Australian and international economists.
2.5.1 Presentation of methodology to stakeholders
Following the development of the analytical framework, a national consultation session was held
involving representatives from the early childhood education sector, the business community,
academia and government to discuss:
The framework we proposed for the analysis
Potential data sources to incorporate into the analysis
Options for presenting the results
Where possible, feedback obtained through the consultation session has been incorporated into
the final analysis.
2.5.2 Project reference group
Throughout the project, we have consulted with a reference group with expertise in economics,
government and early childhood education. This group assisted in the development of the
analysis. The Front Project and PwC engaged with the reference group at various stages of the
project, including:
Providing input on the cost-benefit analysis approach, with the aim of ensuring our approach accurately reflects established methods and approaches in early childhood education economic assessments
Helping identify suitable options for managing potential issues surrounding modelling, such as data availability, and evaluating and comparing our analysis with other studies in Australia and around the world
Framing and communicating the economic analysis
The table below lists the participants engaged in the reference group during the course of
our analysis.
Table 4: Project reference group participants
Reference group member Organisation
Professor Adrian Piccoli Gonski Institute, University of New South Wales
Emeritus Associate Professor Gordon Cleveland
University of Toronto
Dr Dan Cloney Australian Council for Educational Research
Ms Seri Renkin ten20 Foundation
Mr Mark Johnson Board Director, G8 Education, Coca-Cola Amatil and others
Professor Deborah Brennan Social Policy Research Centre, University of New South Wales
The paper was peer reviewed by two international economists with expertise in early childhood
education and the economics of education.
13 A Smart Investment for a Smarter Australia: Economic analysis of universal early childhood education in the year before school in Australia
3 Analytical framework This chapter sets out the framework we have used to undertake our analysis, including the
impacts that are counted, who these impacts relate to and the time periods in which they occur.
3.1 Overview of the approach
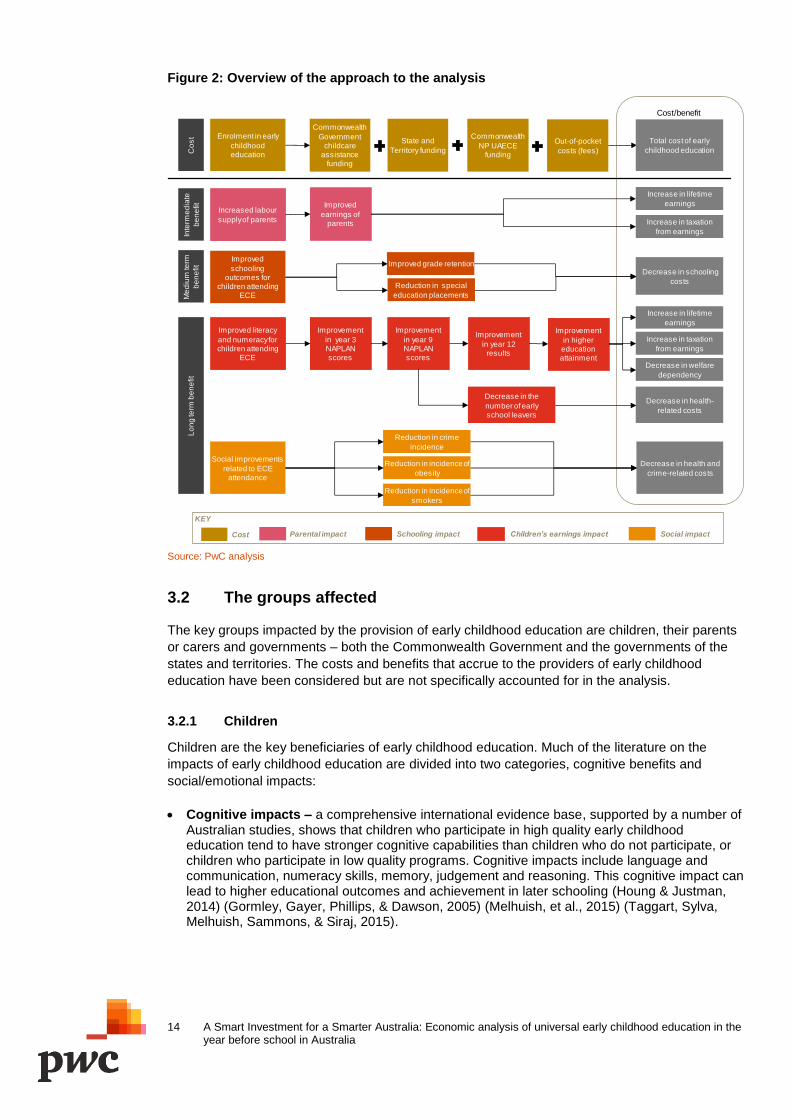
The approach to the cost benefit analysis is summarised in the figure below. In our analysis we
considered the costs and benefits of early childhood education in the year before school for
children, their parents or carers and government. The analysis has considered the cost of
providing that education and a broad range of short, medium and long-term benefits, all of which
are strongly supported by either Australian or international evidence.
In Australia, all early childhood education and care for children aged birth to age five is delivered
by qualified educators under a National Quality Framework (NQF). The NQF establishes the
requirements for children’s safety, learning wellbeing and ensures children’s learning is guided by
the Early Years Learning Framework. Australian governments make an additional investment to
enable universal access to a preschool or kindergarten program, delivered by a Bachelor-qualified
teacher for 15 hours per week, for all children in the year before formal school (children generally
aged 4-5). The Universal Access policy is a partnership between the Commonwealth and State
and Territory governments that was established in 2008 – and has made structured, play-based
early childhood education programs available to 90 per cent of children (Parliament of Australia,
2019). Our economic analysis focuses on the impact of this policy setting and all references to
early childhood education in this report refer to programs delivered in the year-before-school
(preschool/kindergarten). The base year for the analysis is 2017, the most recent year for which
full data is available.
14 A Smart Investment for a Smarter Australia: Economic analysis of universal early childhood education in the year before school in Australia
Figure 2: Overview of the approach to the analysis
Source: PwC analysis
3.2 The groups affected
The key groups impacted by the provision of early childhood education are children, their parents
or carers and governments – both the Commonwealth Government and the governments of the
states and territories. The costs and benefits that accrue to the providers of early childhood
education have been considered but are not specifically accounted for in the analysis.
3.2.1 Children
Children are the key beneficiaries of early childhood education. Much of the literature on the
impacts of early childhood education are divided into two categories, cognitive benefits and
social/emotional impacts:
Cognitive impacts – a comprehensive international evidence base, supported by a number of Australian studies, shows that children who participate in high quality early childhood education tend to have stronger cognitive capabilities than children who do not participate, or children who participate in low quality programs. Cognitive impacts include language and communication, numeracy skills, memory, judgement and reasoning. This cognitive impact can lead to higher educational outcomes and achievement in later schooling (Houng & Justman, 2014) (Gormley, Gayer, Phillips, & Dawson, 2005) (Melhuish, et al., 2015) (Taggart, Sylva, Melhuish, Sammons, & Siraj, 2015).
Improved
earnings of parents
Social improvements
related to ECE attendance
Increase in lifetime
earnings
Increase in taxation
from earnings
Cost/benefit
Decrease in health and
crime-related costs
Improvement
in year 3 NAPLAN scores
Decrease in the
number of early school leavers
Increase in lifetime
earningsImprovement
in year 9 NAPLAN scores
Decrease in health-
related costs
Improvement
in year 12 results
Improved literacy
and numeracy for children attending
ECE
Improvement
in higher education attainment
Increase in taxation
from earnings
Increased labour
supply of parents
Reduction in crime
incidence
Reduction in incidence of
obesity
Reduction in incidence of
smokers
Reduction in special
education placements
Improved grade retentionDecrease in schooling
costs
Improved
schooling outcomes for
children attending ECE
Inte
rme
dia
te
be
ne
fit
Me
diu
m te
rm
be
ne
fit
Lo
ng
term
be
ne
fit
Co
st Enrolment in early
childhood education
Commonwealth
Government childcare
assistance funding
State and
Territory funding
Commonwealth
NP UAECE funding
Out-of-pocket
costs (fees)
Total cost of early
childhood education
Cost
KEY
Parental impact Schooling impact Children’s earnings impact Social impact
Decrease in welfare
dependency
15 A Smart Investment for a Smarter Australia: Economic analysis of universal early childhood education in the year before school in Australia
Social and emotional impacts – early childhood education also impacts a range of social and emotional capabilities, including understanding and managing emotions, feeling and showing empathy for others, establishing positive relationships, confidence and self-esteem, setting goals, staying focused and managing distractions, and making responsible decisions (Morris, Mattera, Castells, Bangser, & Bierman, 2014) (Moore, et al., 2015) (Nix, Bierman, Heinrichs, Gest, & Welsh, 2016) (Taggart, Sylva, Melhuish, Sammons, & Siraj, 2015).
There is stronger evidence and data about the cognitive impacts of early childhood education,
internationally and in Australia, as this has been the exclusive focus of numerous studies over
decades. The tools for assessing cognitive abilities are also well-developed. We also have a
strong and comprehensive evidence base on the lifetime impacts of educational achievement (for
schools and tertiary education), with decades of Australian research showing education predicts
of an individual’s earnings, health and wellbeing over their life.
Social and emotional skills can have a significant and lasting impact on children and affect
outcomes over their lifetime, contributing to achievement at school and at work, to positive
relationships and social cohesion, to mental health and wellbeing. There is growing empirical
evidence that early social and emotional capabilities predict later outcomes – for example, one
study shows three year old children with good self-control have better financial security as adults,
as they are more likely to save, have built good financial building blocks for the future, and have
good credit (Moffitt et al., 2011).
These impacts potentially have even more significant influence on children’s lives and may yield
greater returns than the cognitive impacts. Yet because social and emotional capabilities are a
newer field of study they have not been systematically tracked through a lifetime in the same way
that cognitive abilities (and school achievement) have been for many decades. Although a recent
Australian study found a causal relationship between mental health competence at school entry
(via AEDC) and Year 3 NAPLAN results (O’Connor, Cloney, Kvalsvig, & Goldfeld, 2019), overall
there has been limited research on the causal relationship between social and emotional skills
gained through participation in early childhood education and potential later outcomes, like better
mental health or improved performance in the workforce. As we have not been able to quantify
their benefits in the model, the analysis should be considered a conservative estimate of the
benefits and likely long-term impacts.
3.2.2 Parents or carers
The parents or carers of children who receive early childhood education incur both a cost of that
provision and are also a beneficiary:
Fees paid to providers – in many cases, parents or carers make a financial contribution to the cost of their early child education, which is the difference between the price charged by providers and the contribution provided by governments.
Increased earnings – the availability of early childhood education allows some parents to participate in paid work, when they otherwise would not be able to, or work more hours than they would be able to otherwise. The income they receive from this work, after taxes paid to governments, is a benefit to these parents.
16 A Smart Investment for a Smarter Australia: Economic analysis of universal early childhood education in the year before school in Australia
3.2.3 Governments
Both the Commonwealth Government and the governments of Australia’s states and territories
contribute to cost of early childhood education.
The Commonwealth Government is also a beneficiary of early childhood education. It receives
higher taxes, paid by parents/carers who are able to work more because of the availability of early
childhood education, or children who earn more over their lifetimes. Early childhood education
also reduces unemployment and the payment of unemployment benefits, delivering reduced
social expenditure as well.
State and Territory governments are beneficiaries of early childhood education, to the extent that
the provision of early childhood education results in a reduction of the number of children
repeating a year of school and special education placements at school and lower levels of
demand for the health and criminal justice systems. They also benefit from a well-educated
workforce and strong economy.
3.2.4 Employers
A more capable and educated workforce will deliver higher productivity. As noted above, part of the benefit of this increase in productivity accrues to employees in the form of higher wages. However, employers and businesses are also beneficiaries in the form of increases in the value-add produced by more educated employees, which increases their competitiveness as well as profitability. A more highly educated and capable workforce is likely to lead to:
Higher levels of productivity, both of workers and of enterprises
Higher levels of future innovation and development
More attractive opportunities domestic and foreign investment, and thus job growth
3.2.5 Providers of early childhood education
The providers of early childhood education are not separately accounted for in the analysis. While
the early childhood sector makes a contribution to Australia’s economy in terms of employment,
taxes and overall economic output, it is not appropriate to count this expenditure in an economic
impact assessment like this. This is because it is must be assumed that, in the absence of
expenditure on early childhood education, this expenditure would be directed to other initiatives
and would have similar effects on overall output. To count the transfer of funds from government
and households to the sector as a separate economic impact would be double-counting the
impacts.
3.3 The nature of the impacts
The analysis has considered a broad range of costs and benefits of early childhood education on
children, their parents or carers and government. Detailed analysis of costs and benefits is set out
in Chapter 5 (costs) and Chapter 6 (benefits). They are summarised below.
17 A Smart Investment for a Smarter Australia: Economic analysis of universal early childhood education in the year before school in Australia
3.3.1 Costs
The costs we have included in the analysis relate to the cost of providing 15 hours per week of
early childhood education to children in the year before they start school – often known as either
preschool or kindergarten. These costs include:
Commonwealth Government funding under the National Partnership Agreement on Universal Access to Early Childhood Education (NP UAECE) – this is the funding the Commonwealth Government provides to the governments of the States and Territories.
Commonwealth Government funding for early childhood education provided through the Child Care Benefit (CCB) and the Child Care Rebate (CCR). The study has focussed on the component of this funding that relates to children accessing their 15 hours of early childhood
education in the year-before-school in a CCB-approved long day care service.2
State and Territory government funding for early childhood education – excluding the amount that State and Territory governments receive from the Commonwealth Government through the NP UAECE.
Private expenditure or out-of-pocket costs for households associated with the provision of early childhood education.
3.3.2 Benefits
The benefits included in the analysis are all consistent with standard international approaches to
measuring the economic impact of early childhood education.3 The benefits are set out below.
Higher levels of workforce participation by parents and carers – for the parents and carers who choose to participate in additional paid employment while their children are participating in early childhood education and who would not otherwise have done so.
Improved literacy and numeracy – for the children attending early childhood education, which in turn leads to:
– Education cost savings – due to lower levels of children repeating a year of school and reduced need for special education programs.
– Improved educational achievement, resulting in higher lifetime earnings for recipients – the improved cognitive abilities that result from participating in early childhood education can be measured in later school achievement, educational attainment and the resulting impact on employment, earnings, taxation and welfare.
– Other social benefits and costs flowing from improved education and earnings – resulting in cost savings for government due to a reduction in crime and a reduction in health care costs associated with smoking and obesity.
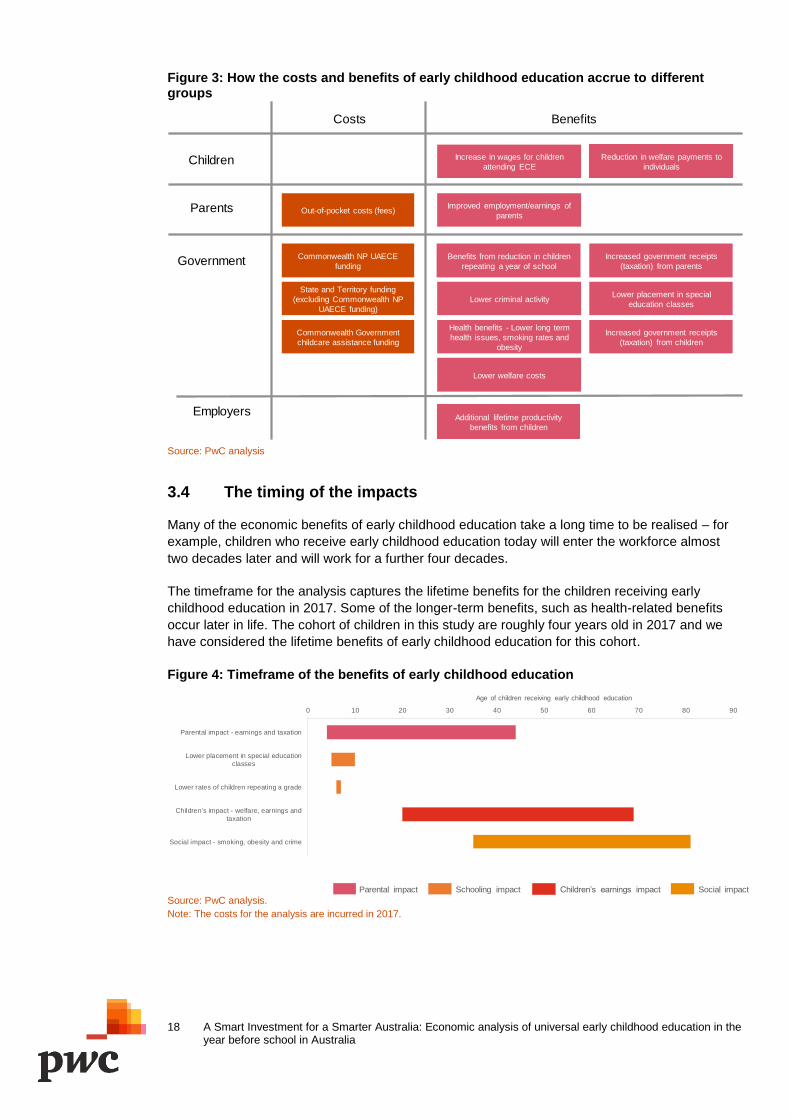
3.3.3 Summary of costs and benefits
The figure below summarises the costs and benefits that have been considered in the analysis
and who they accrue to.
2 Note: CCB and CCR have now been replaced by a single payment, the Child Care Subsidy (CCS), but because the analysis is focused on
provision in 2017, all costings are based on 2017 policy and funding settings.
3 For example, see Cannon, J., Kilburn, R., Karoly, L., Mattox, T., Muchow, A., & Buenaventura, M. (2017). Investing Early: Taking Stock of Outcomes and Economic Returns from Early Childhood Programs. RAND Corporation
18 A Smart Investment for a Smarter Australia: Economic analysis of universal early childhood education in the year before school in Australia
Figure 3: How the costs and benefits of early childhood education accrue to different groups
Source: PwC analysis
3.4 The timing of the impacts
Many of the economic benefits of early childhood education take a long time to be realised – for
example, children who receive early childhood education today will enter the workforce almost
two decades later and will work for a further four decades.
The timeframe for the analysis captures the lifetime benefits for the children receiving early
childhood education in 2017. Some of the longer-term benefits, such as health-related benefits
occur later in life. The cohort of children in this study are roughly four years old in 2017 and we
have considered the lifetime benefits of early childhood education for this cohort.
Figure 4: Timeframe of the benefits of early childhood education
Source: PwC analysis.
Note: The costs for the analysis are incurred in 2017.
Increase in wages for children
attending ECE
Lower criminal activity
Lower welfare costs
Improved employment/earnings of
parents
Health benefits - Lower long term
health issues, smoking rates and
obesity
Increased government receipts
(taxation) from parents
Increased government receipts
(taxation) from children
Lower placement in special
education classes
Benefits from reduction in children
repeating a year of school
Out-of-pocket costs (fees)
State and Territory funding
(excluding Commonwealth NP
UAECE funding)
Commonwealth NP UAECE
funding
Commonwealth Government
childcare assistance funding
BenefitsCosts
Children
Parents
Government
Reduction in welfare payments to
individuals
Additional lifetime productivity
benefits from children
Employers
0 10 20 30 40 50 60 70 80 90
Parental impact - earnings and taxation
Lower placement in special education
classes
Lower rates of children repeating a grade
Children's impact - welfare, earnings and
taxation
Social impact - smoking, obesity and crime
Age of children receiving early childhood education
Parental impact Schooling impact Children’s earnings impact Social impact
19 A Smart Investment for a Smarter Australia: Economic analysis of universal early childhood education in the year before school in Australia
4 Key assumptions used in the analysis
This chapter sets out the key assumptions used in the analysis, which related to the calculation of
both the costs (Chapter 5) and the benefits (Chapter 6) of early childhood education.
4.1 Overview
The following concepts are relevant to the analysis of the costs and benefits of early childhood
education and are explained in this chapter:
how we are defining early childhood education
how we have estimated the effect size of early childhood education
the discount rate used.
4.2 Defining early childhood education
The analysis focusses on the early childhood education programs that are provided to children in
the year before they start school. The NP UAECE specifies 15 hours per week (or 600 hours per
year) of structured, play-based learning led by a Bachelor-qualified early childhood teacher.
Depending on where you are in Australia, this is known as either preschool or kindergarten.
Focusing on educationally-focused programs for children aged four to five, prior to formal
schooling, is consistent with international evidence on the impacts of early childhood education
(Melhuish, et al., 2015) (Phillips, et al., 2017).
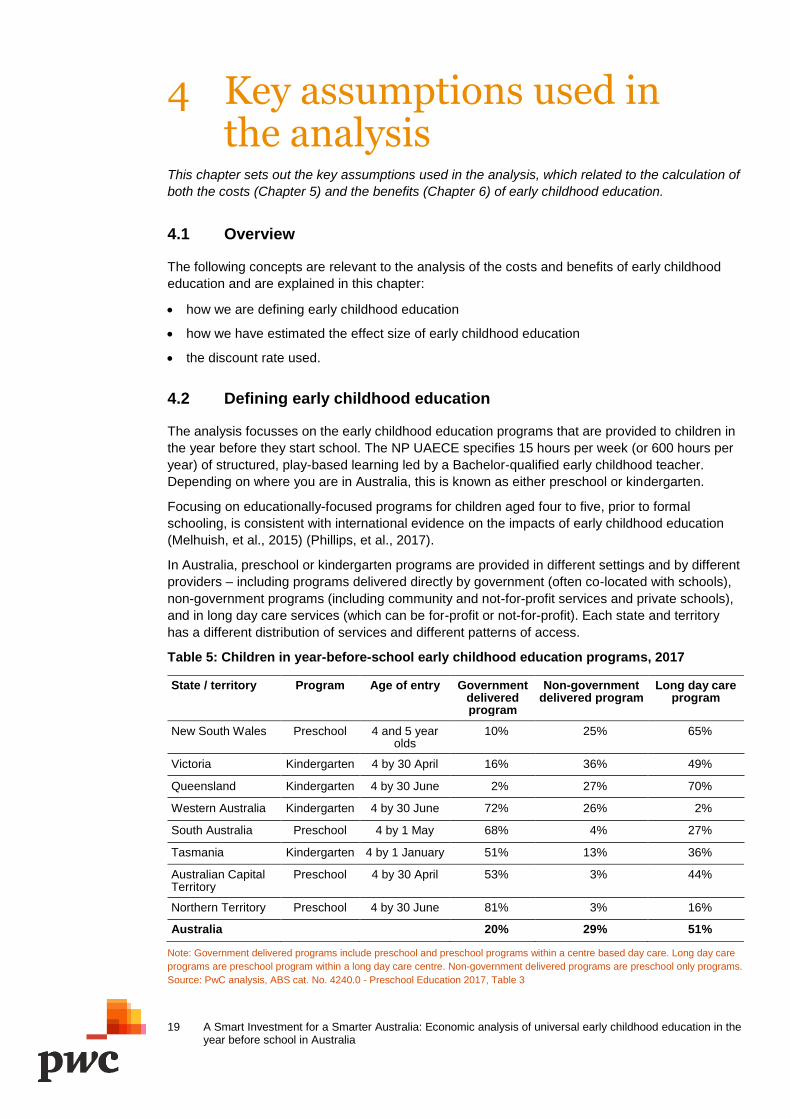
In Australia, preschool or kindergarten programs are provided in different settings and by different
providers – including programs delivered directly by government (often co-located with schools),
non-government programs (including community and not-for-profit services and private schools),
and in long day care services (which can be for-profit or not-for-profit). Each state and territory
has a different distribution of services and different patterns of access.
Table 5: Children in year-before-school early childhood education programs, 2017
State / territory Program Age of entry Government delivered program
Non-government delivered program
Long day care program
New South Wales Preschool 4 and 5 year olds
10% 25% 65%
Victoria Kindergarten 4 by 30 April 16% 36% 49%
Queensland Kindergarten 4 by 30 June 2% 27% 70%
Western Australia Kindergarten 4 by 30 June 72% 26% 2%
South Australia Preschool 4 by 1 May 68% 4% 27%
Tasmania Kindergarten 4 by 1 January 51% 13% 36%
Australian Capital Territory
Preschool 4 by 30 April 53% 3% 44%
Northern Territory Preschool 4 by 30 June 81% 3% 16%
Australia 20% 29% 51%
Note: Government delivered programs include preschool and preschool programs within a centre based day care. Long day care
programs are preschool program within a long day care centre. Non-government delivered programs are preschool only programs.
Source: PwC analysis, ABS cat. No. 4240.0 - Preschool Education 2017, Table 3
20 A Smart Investment for a Smarter Australia: Economic analysis of universal early childhood education in the year before school in Australia
4.3 Early childhood education hours
To estimate the expenditure associated with early childhood education provision, we need to
understand the total number of hours provided.
In this analysis, we have assumed 15 hours per child per week of attendance at year before-
school early childhood education. Some children attend long day care for more hours, but this
analysis only counts the costs of providing 15 hours. Conversely, not all children who are enrolled
in an early childhood education in the year-before-school are attending for the full 15 hours.
However, the analysis assumes the full cost of delivery. For further discussion, see Appendix C.
4.4 The impact (effect size) of early childhood education on early school achievement
A key component of this study is to determine the link between early childhood education and
outcomes in later life. In particular, we focus on the effect early childhood education has on future
educational and employment outcomes, based on empirical evidence. The educational outcomes
of early childhood education underpins our estimates of the majority of the benefits of early
childhood education. The link between improvement in educational outcomes and later life
benefits such as lifetime earnings, taxation, welfare and health-related costs is well-established
and particularly important for this analysis.
To establish the effect of early childhood education on education outcomes, we have estimated
the ‘effect size’ that early childhood education on children’s cognitive skills in early primary school.
Effect size is a simple way of quantifying the difference between two groups (in this case those
that receive early childhood education and those that do not), and is measured in standard
deviations between means (averages).
To determine an appropriate effect size we reviewed previously published studies that estimated
the effects of early childhood education on children’s outcomes. A range of Australian and
international studies and meta-analyses were assessed according to their relevance for this cost-
benefit analysis. Criteria in this assessment included:
whether the study was Australian or international (with a preference for Australian-located
studies)
how recently the study had been undertaken (with a preference for studies from the last 10
years)
whether the study focused on specific cohorts (with a preference for those considering
universal provision)
whether the study measured school achievement (with a preference for those linking early
childhood education experiences with standardised tests comparable to NAPLAN).
Through this assessment (detailed in Appendix B), we identified three studies that were
particularly relevant to this analysis:
Investing in Preschool Programs (Magnuson & Duncan, 2013)
Magnuson & Duncan’s study looked at the impact on cognitive or achievement-related
outcomes for 84 programs, measured at the end of each program, which is typically when the
children are commencing primary school (Magnuson & Duncan, 2013). This meta-analysis
found that the simple average effect sizes for early childhood education on cognitive and
achievement scores was a 0.35 standard deviation difference between the groups that had
received early childhood education, and those that had not.
21 A Smart Investment for a Smarter Australia: Economic analysis of universal early childhood education in the year before school in Australia
Analysis on the Introduction of the National Quality Framework (Centre for Education
Statistics and Evaluation Department of Education, 2017)
The impact of the Introduction of the National Quality Framework involved analysis of school
enrolment data collected by the New South Wales (NSW) Department of Education. While we
were not able to access detail on the statistical methods for analysis, this study reported a
statistically significant positive relationship between early childhood education attendance and
outcomes at school (Centre for Education Statistics and Evaluation Department of Education,
2017). This preliminary analysis found that at least six hours of early childhood education was
associated with about 10 additional NAPLAN points in Year 3, equivalent to a difference
between groups of between 0.14 standard deviations.
The Melbourne Institute’s “Early Bird Catches the Worm” study (Warren & Haisken-DeNew,
2013)
The Early Bird Catches the Worm study used unit record data from the Longitudinal Study of
Australian Children (LSAC) Survey to determine the link between early childhood education
and NAPLAN results. The LSAC is a major study following the development of 10,000 children
and families from all parts of Australia. The children in LSAC were aged 4-5 in 2004. This
predates the establishment of the NQF, which has substantially improved key requirements for
quality early childhood education (qualifications for educators, ratios of children to teachers,
and a national learning framework), as well as the national policy on universal access of year-
before-school early childhood education, which has significantly increased participation in
teacher-led early childhood education programs. As such, it does not fully reflect levels of
quality, attendance and impact in 2017. However, this study found the average preschool
effects were between 13.1 and 18.1 points for different NAPLAN tests, accounting for variation
in children’s ability and home learning environment. This equates to a difference of around
0.14 to 0.17 standard deviations. Importantly, the study highlighted the importance of high-
quality provision for children’s outcomes.
This project highlights the need for further research on the short and long-term impacts of
current Australian early childhood education programs.
4.4.1 Chosen effect size
Due to the lack of recent publicly available Australian data linking early childhood education and
school achievement, we took into account a broad range of available data sources, domestic and
international, to inform our chosen effect size. Our method was to prioritise studies that were from
Australia initially, but also consider the effect sizes for international studies that analysed
universal-style access to early childhood education programs, particularly programs with at least
moderate quality.4 Based on those studies and meta-analyses, we chose an estimated effect size
of 0.17 standard deviations. This is the estimated average impact for all children attending early
childhood education programs.
4 International and Australian research indicates that there is a socio-economic gradient for early childhood education impacts, with lower
socio-economic children generally benefiting more than children from wealthier backgrounds. This study focuses on the average impact across the whole population, likely understating the impact on disadvantaged children and overstating the impact on advantaged children. We were unable to analyse the impacts for each socio-economic quintile because Australia does not publish sufficiently granular data. This kind of analysis would require linking early childhood, schooling, higher education and tax data for a representative sample of the population.
22 A Smart Investment for a Smarter Australia: Economic analysis of universal early childhood education in the year before school in Australia
We believe this is a reasonable estimation, reflecting the expected average impact of moderate to
high quality universal early childhood education. It is consistent with available Australian evidence
and the much more extensive international evidence base. We note that an effect size of 0.17
standard deviations is much less than some international estimates of the impact, which can be
as large as 0.35. However, many of these studies are focused on intensive programs targeted at
disadvantaged cohorts, with these targeted programs generally demonstrating much
larger impacts.
The discount rate
Our model forecasts the future benefits of the early childhood education provided in 2017. For our
cost-benefit analysis of early childhood education, the majority of the costs occur today, while the
benefits occur over a much longer time period. In order to compare the costs and the benefits
there is a need to convert all of them into ‘today’s dollars’. This is done by applying a ‘discount
rate’ to the future values.
Because so many of the benefits in this cost-benefit analysis occur so far in the future, the choice
of discount rate has a significant impact on the overall results of the analysis. Much of the
literature on the costs and benefits or early childhood education use discount rates of three per
cent (Van Huizen, Dumhs, & Plantenga, 2016) (Temple & Reynolds, 2015) or 4 per cent (Kilburn
& Karoly, 2008). By contrast, governments in Australia use a range of different discount rates for
different purposes. These range from three to seven per cent.5 However, most guidance suggests
that for areas where benefits are not easily quantifiable (i.e. many social policy programs) the
lower three or four per cent rate should be used.
For this evaluation a three per cent discount rate has been adopted, sensitivity testing has been
undertaken at four per cent and seven per cent.
5 See for example: https://economicdevelopment.vic.gov.au/__data/assets/word_doc/0007/1492603/Guidance-on-discount-rates-
internet1.docx or https://www.pmc.gov.au/sites/default/files/publications/cosst-benefit-analysis.docx
23 A Smart Investment for a Smarter Australia: Economic analysis of universal early childhood education in the year before school in Australia
5 Costs of early childhood education
This chapter provides an overview of the costs of early childhood education and the way these
have been incorporated in the analysis
5.1 Introduction
In this analysis, the costs of providing early childhood education have been estimated by adding
up the expenditure by government (including Commonwealth, State and Territory governments),
and private or household expenditure associated with providing 15 hours of year-before-school,
teacher-led early childhood education in 2017 (as defined in the previous chapter).
This ‘expenditure approach’ to assessing cost takes the value of government and household
expenditure on early childhood education, along with assumptions about the proportion of children
attending preschool or kindergarten programs, and assumes this reflects the costs of providing
early childhood education. In our approach, profits are not separately accounted for, based on the
assumption that the market for the provision of early childhood education is relatively competitive
(Productivity Commission, 2015) (see page 373 and Appendix H).
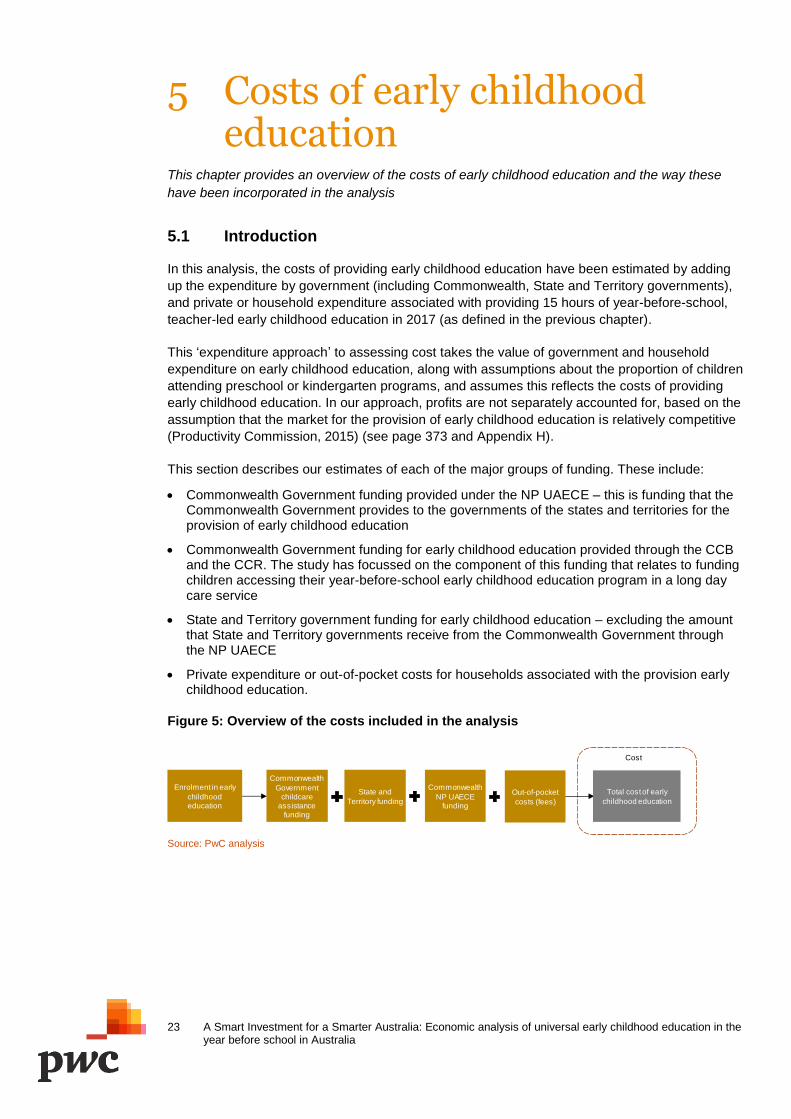
This section describes our estimates of each of the major groups of funding. These include:
Commonwealth Government funding provided under the NP UAECE – this is funding that the Commonwealth Government provides to the governments of the states and territories for the provision of early childhood education
Commonwealth Government funding for early childhood education provided through the CCB and the CCR. The study has focussed on the component of this funding that relates to funding children accessing their year-before-school early childhood education program in a long day care service
State and Territory government funding for early childhood education – excluding the amount that State and Territory governments receive from the Commonwealth Government through the NP UAECE
Private expenditure or out-of-pocket costs for households associated with the provision early childhood education.
Figure 5: Overview of the costs included in the analysis
Source: PwC analysis
Cost
Enrolment in early
childhood education
Commonwealth
Government childcare
assistance funding
State and
Territory funding
Commonwealth
NP UAECE funding
Out-of-pocket
costs (fees)
Total cost of early
childhood education
24 A Smart Investment for a Smarter Australia: Economic analysis of universal early childhood education in the year before school in Australia
5.2 Costs to government
The Commonwealth Government and State and Territory governments have different but
complementary roles in funding early childhood education programs. Both levels of government
contribute funding to early childhood services, with many preschool or kindergarten programs
funded and delivered directly by state, territory and local governments.
Total government expenditure includes three different sources of funding:
Commonwealth Government – NP UAECE funding
Commonwealth Government – CCB and CCR funding
State and Territory government funding.
The following sections set out the estimates for each expenditure group.
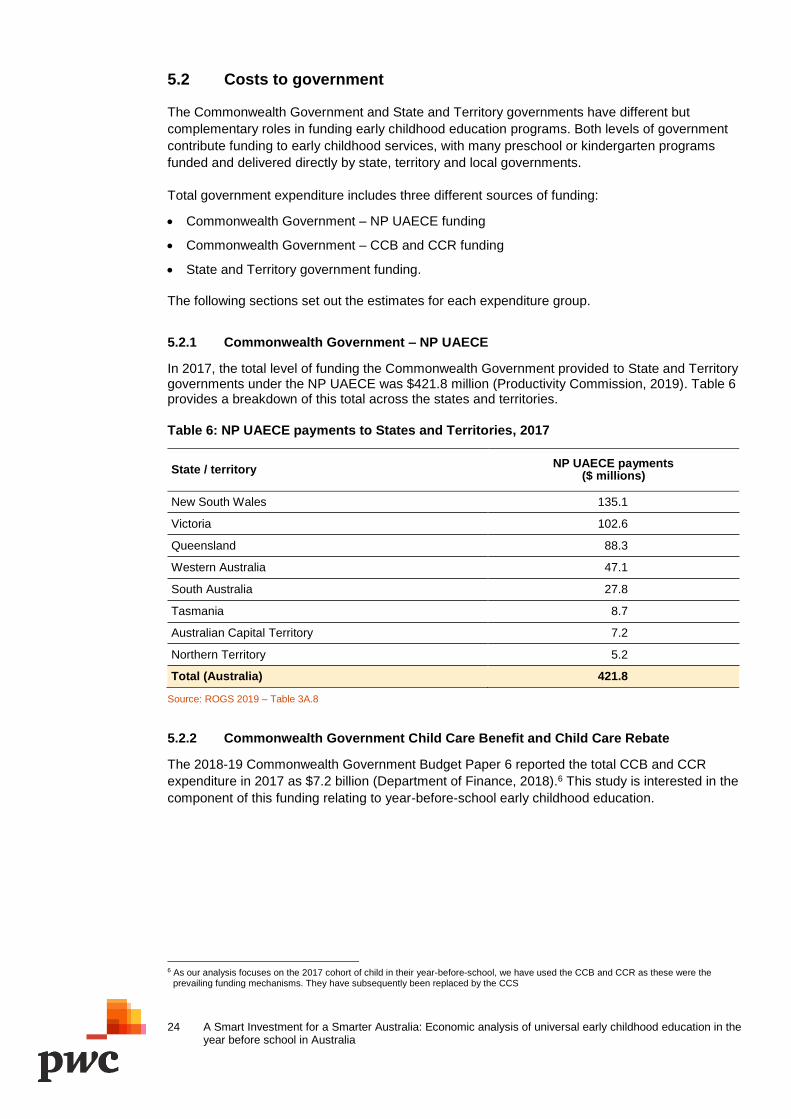
5.2.1 Commonwealth Government – NP UAECE
In 2017, the total level of funding the Commonwealth Government provided to State and Territory governments under the NP UAECE was $421.8 million (Productivity Commission, 2019). Table 6 provides a breakdown of this total across the states and territories.
Table 6: NP UAECE payments to States and Territories, 2017
State / territory NP UAECE payments
($ millions)
New South Wales 135.1
Victoria 102.6
Queensland 88.3
Western Australia 47.1
South Australia 27.8
Tasmania 8.7
Australian Capital Territory 7.2
Northern Territory 5.2
Total (Australia) 421.8
Source: ROGS 2019 – Table 3A.8
5.2.2 Commonwealth Government Child Care Benefit and Child Care Rebate
The 2018-19 Commonwealth Government Budget Paper 6 reported the total CCB and CCR
expenditure in 2017 as $7.2 billion (Department of Finance, 2018).6 This study is interested in the
component of this funding relating to year-before-school early childhood education.
6 As our analysis focuses on the 2017 cohort of child in their year-before-school, we have used the CCB and CCR as these were the
prevailing funding mechanisms. They have subsequently been replaced by the CCS
25 A Smart Investment for a Smarter Australia: Economic analysis of universal early childhood education in the year before school in Australia
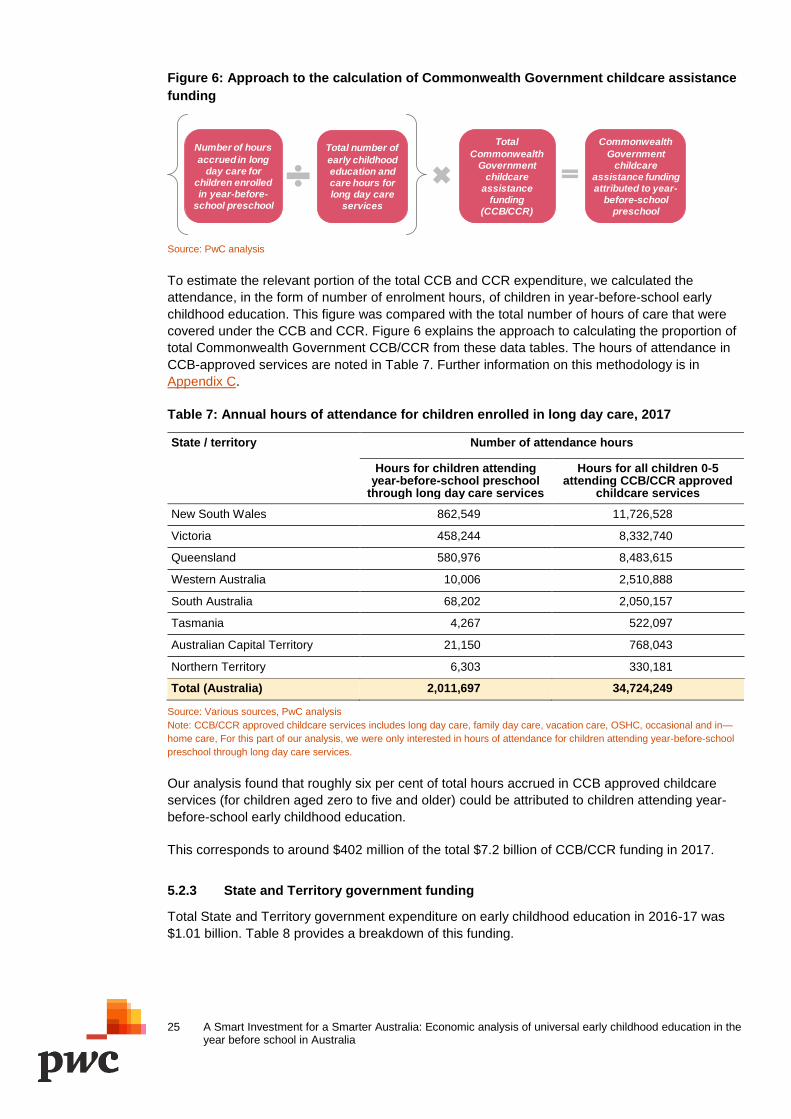
Figure 6: Approach to the calculation of Commonwealth Government childcare assistance
funding
Source: PwC analysis
To estimate the relevant portion of the total CCB and CCR expenditure, we calculated the
attendance, in the form of number of enrolment hours, of children in year-before-school early
childhood education. This figure was compared with the total number of hours of care that were
covered under the CCB and CCR. Figure 6 explains the approach to calculating the proportion of
total Commonwealth Government CCB/CCR from these data tables. The hours of attendance in
CCB-approved services are noted in Table 7. Further information on this methodology is in
Appendix C.
Table 7: Annual hours of attendance for children enrolled in long day care, 2017
State / territory Number of attendance hours
Hours for children attending year-before-school preschool
through long day care services
Hours for all children 0-5 attending CCB/CCR approved
childcare services
New South Wales 862,549 11,726,528
Victoria 458,244 8,332,740
Queensland 580,976 8,483,615
Western Australia 10,006 2,510,888
South Australia 68,202 2,050,157
Tasmania 4,267 522,097
Australian Capital Territory 21,150 768,043
Northern Territory 6,303 330,181
Total (Australia) 2,011,697 34,724,249
Source: Various sources, PwC analysis
Note: CCB/CCR approved childcare services includes long day care, family day care, vacation care, OSHC, occasional and in—
home care, For this part of our analysis, we were only interested in hours of attendance for children attending year-before-school
preschool through long day care services.
Our analysis found that roughly six per cent of total hours accrued in CCB approved childcare
services (for children aged zero to five and older) could be attributed to children attending year-
before-school early childhood education.
This corresponds to around $402 million of the total $7.2 billion of CCB/CCR funding in 2017.
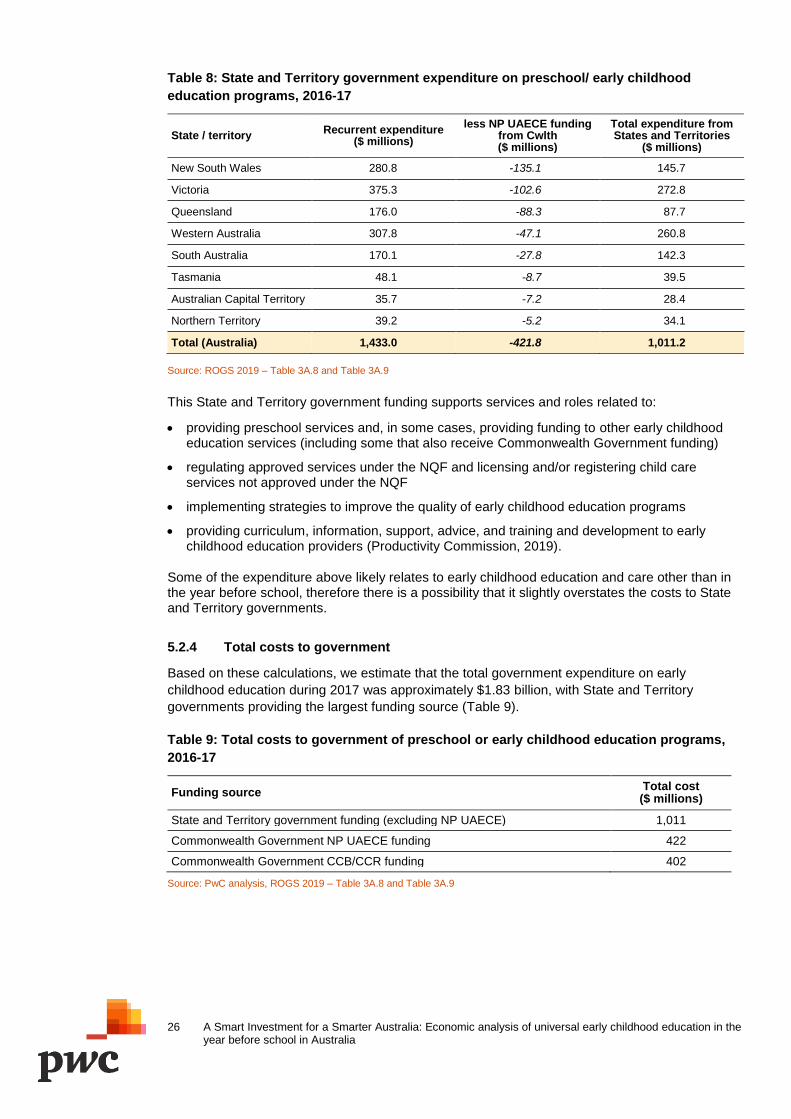
5.2.3 State and Territory government funding
Total State and Territory government expenditure on early childhood education in 2016-17 was
$1.01 billion. Table 8 provides a breakdown of this funding.
Total
Commonwealth Government
childcare assistance
funding (CCB/CCR)
Commonwealth
Government childcare
assistance funding attributed to year-
before-school preschool
Number of hours
accrued in long day care for
children enrolled in year-before-
school preschool
Total number of
early childhood education and care hours for long day care
services
26 A Smart Investment for a Smarter Australia: Economic analysis of universal early childhood education in the year before school in Australia
Table 8: State and Territory government expenditure on preschool/ early childhood
education programs, 2016-17
State / territory Recurrent expenditure
($ millions)
less NP UAECE funding from Cwlth ($ millions)
Total expenditure from States and Territories
($ millions)
New South Wales 280.8 -135.1 145.7
Victoria 375.3 -102.6 272.8
Queensland 176.0 -88.3 87.7
Western Australia 307.8 -47.1 260.8
South Australia 170.1 -27.8 142.3
Tasmania 48.1 -8.7 39.5
Australian Capital Territory 35.7 -7.2 28.4
Northern Territory 39.2 -5.2 34.1
Total (Australia) 1,433.0 -421.8 1,011.2
Source: ROGS 2019 – Table 3A.8 and Table 3A.9
This State and Territory government funding supports services and roles related to:
providing preschool services and, in some cases, providing funding to other early childhood education services (including some that also receive Commonwealth Government funding)
regulating approved services under the NQF and licensing and/or registering child care services not approved under the NQF
implementing strategies to improve the quality of early childhood education programs
providing curriculum, information, support, advice, and training and development to early childhood education providers (Productivity Commission, 2019).
Some of the expenditure above likely relates to early childhood education and care other than in the year before school, therefore there is a possibility that it slightly overstates the costs to State and Territory governments.
5.2.4 Total costs to government
Based on these calculations, we estimate that the total government expenditure on early
childhood education during 2017 was approximately $1.83 billion, with State and Territory
governments providing the largest funding source (Table 9).
Table 9: Total costs to government of preschool or early childhood education programs,
2016-17
Funding source Total cost
($ millions)
State and Territory government funding (excluding NP UAECE) 1,011
Commonwealth Government NP UAECE funding 422
Commonwealth Government CCB/CCR funding 402
Source: PwC analysis, ROGS 2019 – Table 3A.8 and Table 3A.9
27 A Smart Investment for a Smarter Australia: Economic analysis of universal early childhood education in the year before school in Australia
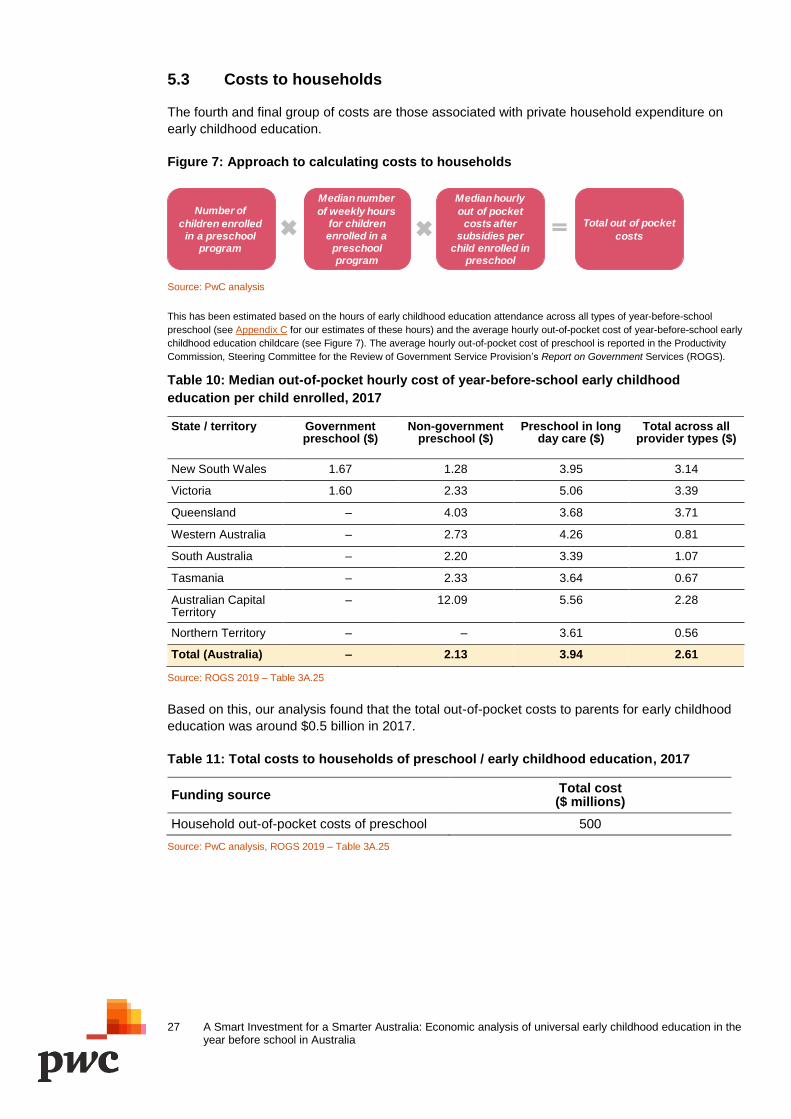
5.3 Costs to households
The fourth and final group of costs are those associated with private household expenditure on
early childhood education.
Figure 7: Approach to calculating costs to households
Source: PwC analysis
This has been estimated based on the hours of early childhood education attendance across all types of year-before-school
preschool (see Appendix C for our estimates of these hours) and the average hourly out-of-pocket cost of year-before-school early
childhood education childcare (see Figure 7). The average hourly out-of-pocket cost of preschool is reported in the Productivity
Commission, Steering Committee for the Review of Government Service Provision’s Report on Government Services (ROGS).
Table 10: Median out-of-pocket hourly cost of year-before-school early childhood
education per child enrolled, 2017
State / territory Government preschool ($)
Non-government preschool ($)
Preschool in long day care ($)
Total across all provider types ($)
New South Wales 1.67 1.28 3.95 3.14
Victoria 1.60 2.33 5.06 3.39
Queensland – 4.03 3.68 3.71
Western Australia – 2.73 4.26 0.81
South Australia – 2.20 3.39 1.07
Tasmania – 2.33 3.64 0.67
Australian Capital Territory
– 12.09 5.56 2.28
Northern Territory – – 3.61 0.56
Total (Australia) – 2.13 3.94 2.61
Source: ROGS 2019 – Table 3A.25
Based on this, our analysis found that the total out-of-pocket costs to parents for early childhood
education was around $0.5 billion in 2017.
Table 11: Total costs to households of preschool / early childhood education, 2017
Funding source Total cost ($ millions)
Household out-of-pocket costs of preschool 500
Source: PwC analysis, ROGS 2019 – Table 3A.25
Number of
children enrolled in a preschool
program
Median number
of weekly hours for children enrolled in a
preschool program
Total out of pocket
costs
Median hourly
out of pocket costs after
subsidies per child enrolled in
preschool
28 A Smart Investment for a Smarter Australia: Economic analysis of universal early childhood education in the year before school in Australia
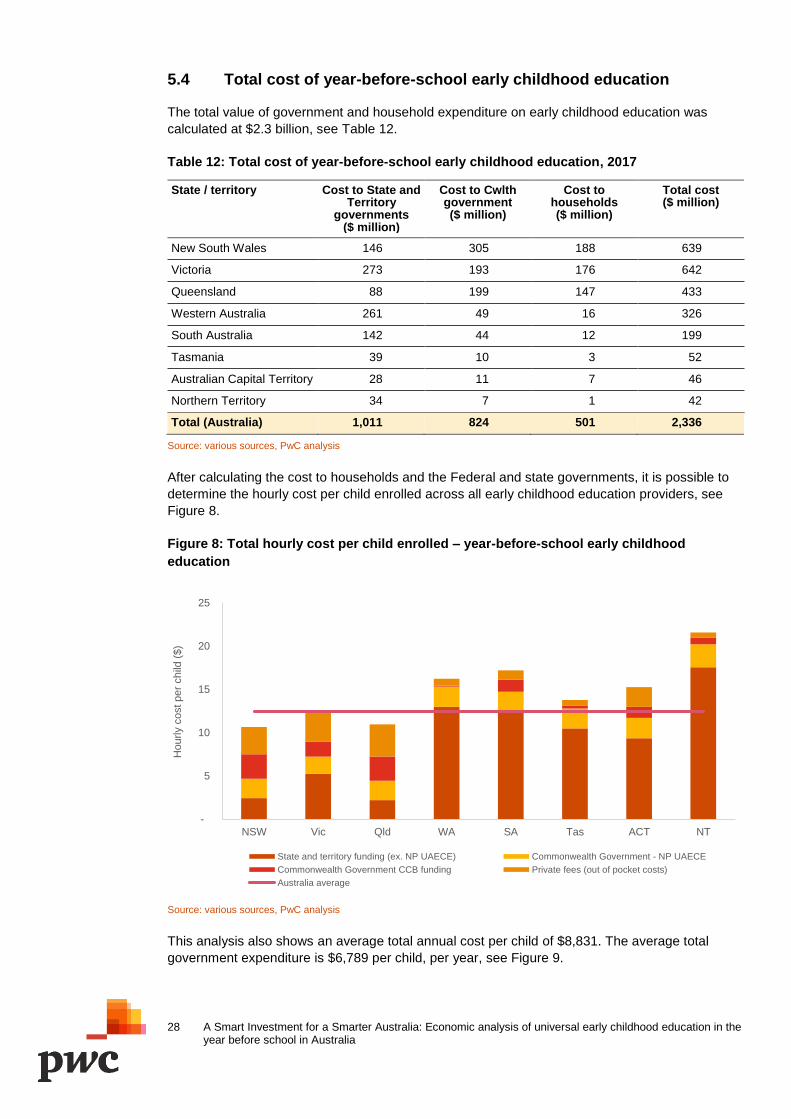
5.4 Total cost of year-before-school early childhood education
The total value of government and household expenditure on early childhood education was
calculated at $2.3 billion, see Table 12.
Table 12: Total cost of year-before-school early childhood education, 2017
State / territory Cost to State and Territory
governments ($ million)
Cost to Cwlth government ($ million)
Cost to households ($ million)
Total cost ($ million)
New South Wales 146 305 188 639
Victoria 273 193 176 642
Queensland 88 199 147 433
Western Australia 261 49 16 326
South Australia 142 44 12 199
Tasmania 39 10 3 52
Australian Capital Territory 28 11 7 46
Northern Territory 34 7 1 42
Total (Australia) 1,011 824 501 2,336
Source: various sources, PwC analysis
After calculating the cost to households and the Federal and state governments, it is possible to
determine the hourly cost per child enrolled across all early childhood education providers, see
Figure 8.
Figure 8: Total hourly cost per child enrolled – year-before-school early childhood
education
Source: various sources, PwC analysis
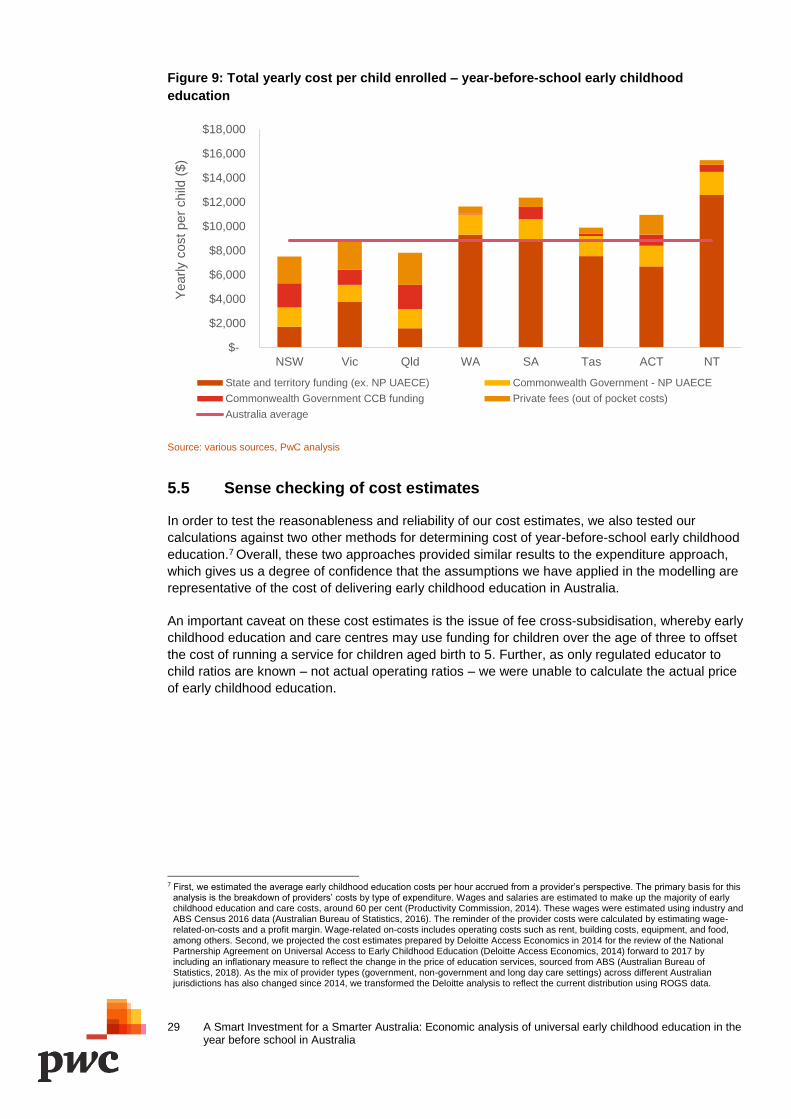
This analysis also shows an average total annual cost per child of $8,831. The average total
government expenditure is $6,789 per child, per year, see Figure 9.
-
5
10
15
20
25
NSW Vic Qld WA SA Tas ACT NT
Hourly c
ost per
child
($)
State and territory funding (ex. NP UAECE) Commonwealth Government - NP UAECE
Commonwealth Government CCB funding Private fees (out of pocket costs)
Australia average
29 A Smart Investment for a Smarter Australia: Economic analysis of universal early childhood education in the year before school in Australia
Figure 9: Total yearly cost per child enrolled – year-before-school early childhood
education
Source: various sources, PwC analysis
5.5 Sense checking of cost estimates
In order to test the reasonableness and reliability of our cost estimates, we also tested our
calculations against two other methods for determining cost of year-before-school early childhood
education.7 Overall, these two approaches provided similar results to the expenditure approach,
which gives us a degree of confidence that the assumptions we have applied in the modelling are
representative of the cost of delivering early childhood education in Australia.
An important caveat on these cost estimates is the issue of fee cross-subsidisation, whereby early
childhood education and care centres may use funding for children over the age of three to offset
the cost of running a service for children aged birth to 5. Further, as only regulated educator to
child ratios are known – not actual operating ratios – we were unable to calculate the actual price
of early childhood education.
7 First, we estimated the average early childhood education costs per hour accrued from a provider’s perspective. The primary basis for this
analysis is the breakdown of providers’ costs by type of expenditure. Wages and salaries are estimated to make up the majority of early childhood education and care costs, around 60 per cent (Productivity Commission, 2014). These wages were estimated using industry and ABS Census 2016 data (Australian Bureau of Statistics, 2016). The reminder of the provider costs were calculated by estimating wage-related-on-costs and a profit margin. Wage-related on-costs includes operating costs such as rent, building costs, equipment, and food, among others. Second, we projected the cost estimates prepared by Deloitte Access Economics in 2014 for the review of the National Partnership Agreement on Universal Access to Early Childhood Education (Deloitte Access Economics, 2014) forward to 2017 by including an inflationary measure to reflect the change in the price of education services, sourced from ABS (Australian Bureau of Statistics, 2018). As the mix of provider types (government, non-government and long day care settings) across different Australian jurisdictions has also changed since 2014, we transformed the Deloitte analysis to reflect the current distribution using ROGS data.
$-
$2,000
$4,000
$6,000
$8,000
$10,000
$12,000
$14,000
$16,000
$18,000
NSW Vic Qld WA SA Tas ACT NT
Yearly c
ost per
child
($)
State and territory funding (ex. NP UAECE) Commonwealth Government - NP UAECE
Commonwealth Government CCB funding Private fees (out of pocket costs)
Australia average
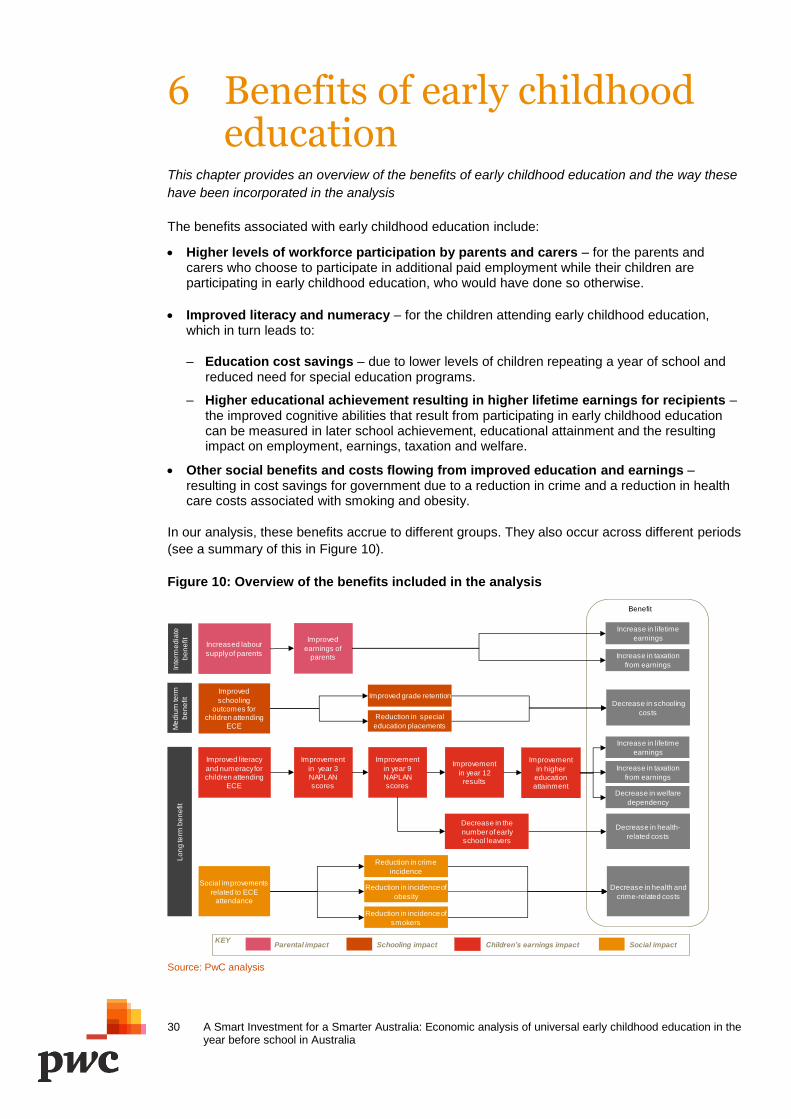
30 A Smart Investment for a Smarter Australia: Economic analysis of universal early childhood education in the year before school in Australia
6 Benefits of early childhood education
This chapter provides an overview of the benefits of early childhood education and the way these
have been incorporated in the analysis
The benefits associated with early childhood education include:
Higher levels of workforce participation by parents and carers – for the parents and carers who choose to participate in additional paid employment while their children are participating in early childhood education, who would have done so otherwise.
Improved literacy and numeracy – for the children attending early childhood education, which in turn leads to:
– Education cost savings – due to lower levels of children repeating a year of school and reduced need for special education programs.
– Higher educational achievement resulting in higher lifetime earnings for recipients – the improved cognitive abilities that result from participating in early childhood education can be measured in later school achievement, educational attainment and the resulting impact on employment, earnings, taxation and welfare.
Other social benefits and costs flowing from improved education and earnings – resulting in cost savings for government due to a reduction in crime and a reduction in health care costs associated with smoking and obesity.
In our analysis, these benefits accrue to different groups. They also occur across different periods
(see a summary of this in Figure 10).
Figure 10: Overview of the benefits included in the analysis
Source: PwC analysis
Improved
earnings of parents
Social improvements
related to ECE attendance
Increase in lifetime
earnings
Increase in taxation
from earnings
Benefit
Decrease in health and
crime-related costs
Improvement
in year 3 NAPLAN scores
Decrease in the
number of early school leavers
Increase in lifetime
earningsImprovement
in year 9 NAPLAN scores
Decrease in health-
related costs
Improvement
in year 12 results
Improved literacy
and numeracy for children attending
ECE
Improvement
in higher education attainment
Increase in taxation
from earnings
Increased labour
supply of parents
Reduction in crime
incidence
Reduction in incidence of
obesity
Reduction in incidence of
smokers
Reduction in special
education placements
Improved grade retentionDecrease in schooling
costs
Improved
schooling outcomes for
children attending ECE
Inte
rme
dia
te
be
ne
fit
Me
diu
m te
rm
be
ne
fit
Lo
ng
term
be
ne
fit
KEYParental impact Schooling impact Children’s earnings impact Social impact
Decrease in welfare
dependency
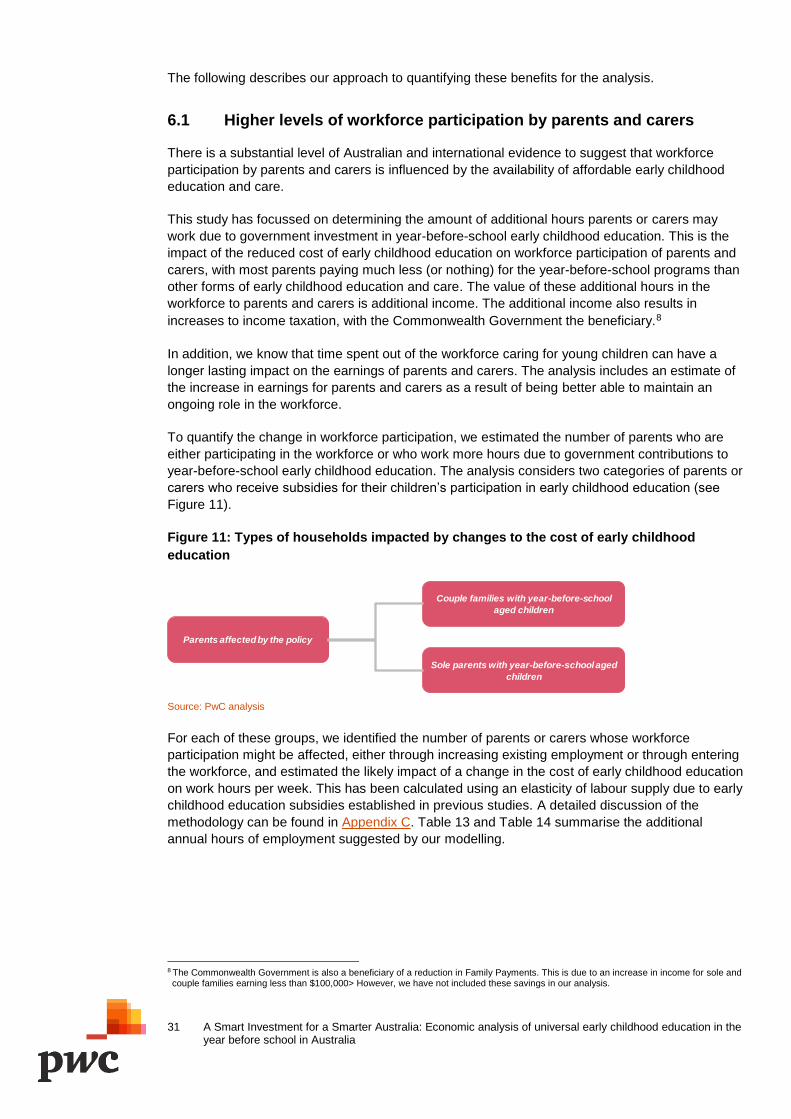
31 A Smart Investment for a Smarter Australia: Economic analysis of universal early childhood education in the year before school in Australia
The following describes our approach to quantifying these benefits for the analysis.
6.1 Higher levels of workforce participation by parents and carers
There is a substantial level of Australian and international evidence to suggest that workforce
participation by parents and carers is influenced by the availability of affordable early childhood
education and care.
This study has focussed on determining the amount of additional hours parents or carers may
work due to government investment in year-before-school early childhood education. This is the
impact of the reduced cost of early childhood education on workforce participation of parents and
carers, with most parents paying much less (or nothing) for the year-before-school programs than
other forms of early childhood education and care. The value of these additional hours in the
workforce to parents and carers is additional income. The additional income also results in
increases to income taxation, with the Commonwealth Government the beneficiary.8
In addition, we know that time spent out of the workforce caring for young children can have a
longer lasting impact on the earnings of parents and carers. The analysis includes an estimate of
the increase in earnings for parents and carers as a result of being better able to maintain an
ongoing role in the workforce.
To quantify the change in workforce participation, we estimated the number of parents who are
either participating in the workforce or who work more hours due to government contributions to
year-before-school early childhood education. The analysis considers two categories of parents or
carers who receive subsidies for their children’s participation in early childhood education (see
Figure 11).
Figure 11: Types of households impacted by changes to the cost of early childhood
education
Source: PwC analysis
For each of these groups, we identified the number of parents or carers whose workforce
participation might be affected, either through increasing existing employment or through entering
the workforce, and estimated the likely impact of a change in the cost of early childhood education
on work hours per week. This has been calculated using an elasticity of labour supply due to early
childhood education subsidies established in previous studies. A detailed discussion of the
methodology can be found in Appendix C. Table 13 and Table 14 summarise the additional
annual hours of employment suggested by our modelling.
8 The Commonwealth Government is also a beneficiary of a reduction in Family Payments. This is due to an increase in income for sole and couple families earning less than $100,000> However, we have not included these savings in our analysis.
Parents affected by the policy
Couple families with year-before-school
aged children
Sole parents with year-before-school aged
children
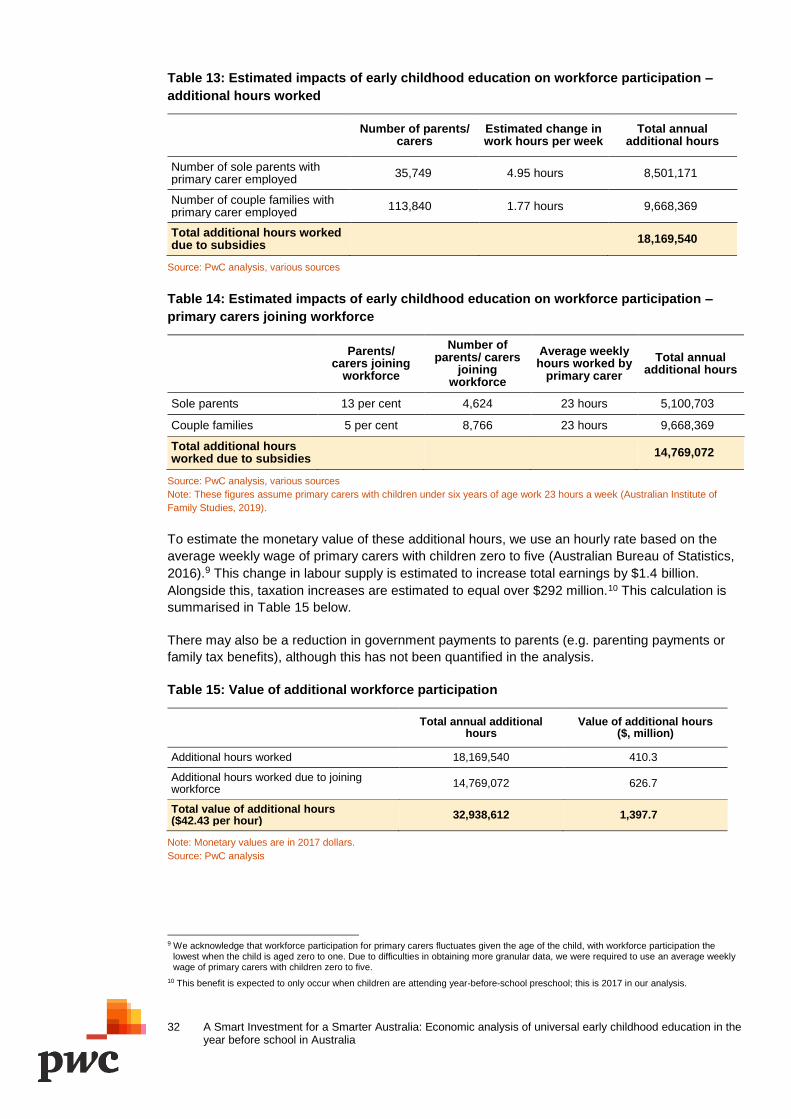
32 A Smart Investment for a Smarter Australia: Economic analysis of universal early childhood education in the year before school in Australia
Table 13: Estimated impacts of early childhood education on workforce participation –
additional hours worked
Number of parents/
carers Estimated change in work hours per week
Total annual additional hours
Number of sole parents with primary carer employed
35,749 4.95 hours 8,501,171
Number of couple families with primary carer employed
113,840 1.77 hours 9,668,369
Total additional hours worked due to subsidies
18,169,540
Source: PwC analysis, various sources
Table 14: Estimated impacts of early childhood education on workforce participation –
primary carers joining workforce
Parents/
carers joining workforce
Number of parents/ carers
joining workforce
Average weekly hours worked by
primary carer
Total annual additional hours
Sole parents 13 per cent 4,624 23 hours 5,100,703
Couple families 5 per cent 8,766 23 hours 9,668,369
Total additional hours worked due to subsidies
14,769,072
Source: PwC analysis, various sources
Note: These figures assume primary carers with children under six years of age work 23 hours a week (Australian Institute of
Family Studies, 2019).
To estimate the monetary value of these additional hours, we use an hourly rate based on the
average weekly wage of primary carers with children zero to five (Australian Bureau of Statistics,
2016).9 This change in labour supply is estimated to increase total earnings by $1.4 billion.
Alongside this, taxation increases are estimated to equal over $292 million.10 This calculation is
summarised in Table 15 below.
There may also be a reduction in government payments to parents (e.g. parenting payments or
family tax benefits), although this has not been quantified in the analysis.
Table 15: Value of additional workforce participation
Total annual additional hours
Value of additional hours ($, million)
Additional hours worked 18,169,540 410.3
Additional hours worked due to joining workforce
14,769,072 626.7
Total value of additional hours ($42.43 per hour)
32,938,612 1,397.7
Note: Monetary values are in 2017 dollars.
Source: PwC analysis
9 We acknowledge that workforce participation for primary carers fluctuates given the age of the child, with workforce participation the
lowest when the child is aged zero to one. Due to difficulties in obtaining more granular data, we were required to use an average weekly wage of primary carers with children zero to five.
10 This benefit is expected to only occur when children are attending year-before-school preschool; this is 2017 in our analysis.
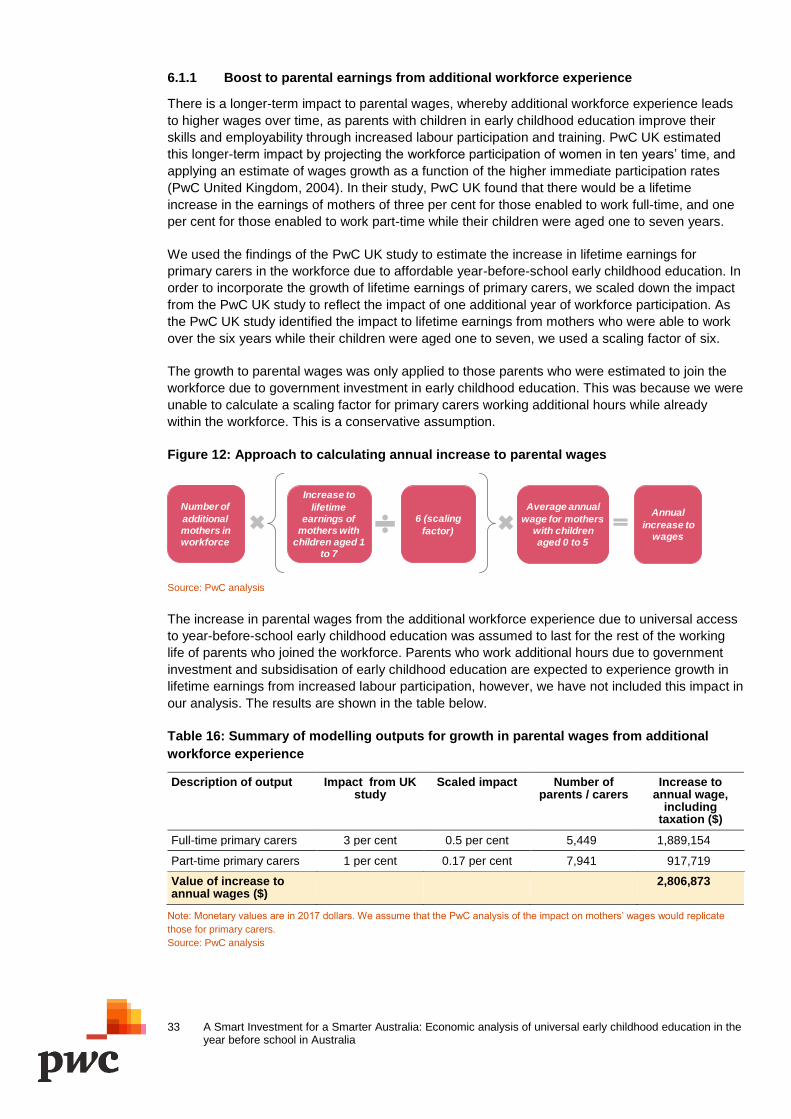
33 A Smart Investment for a Smarter Australia: Economic analysis of universal early childhood education in the year before school in Australia
6.1.1 Boost to parental earnings from additional workforce experience
There is a longer-term impact to parental wages, whereby additional workforce experience leads
to higher wages over time, as parents with children in early childhood education improve their
skills and employability through increased labour participation and training. PwC UK estimated
this longer-term impact by projecting the workforce participation of women in ten years’ time, and
applying an estimate of wages growth as a function of the higher immediate participation rates
(PwC United Kingdom, 2004). In their study, PwC UK found that there would be a lifetime
increase in the earnings of mothers of three per cent for those enabled to work full-time, and one
per cent for those enabled to work part-time while their children were aged one to seven years.
We used the findings of the PwC UK study to estimate the increase in lifetime earnings for
primary carers in the workforce due to affordable year-before-school early childhood education. In
order to incorporate the growth of lifetime earnings of primary carers, we scaled down the impact
from the PwC UK study to reflect the impact of one additional year of workforce participation. As
the PwC UK study identified the impact to lifetime earnings from mothers who were able to work
over the six years while their children were aged one to seven, we used a scaling factor of six.
The growth to parental wages was only applied to those parents who were estimated to join the
workforce due to government investment in early childhood education. This was because we were
unable to calculate a scaling factor for primary carers working additional hours while already
within the workforce. This is a conservative assumption.
Figure 12: Approach to calculating annual increase to parental wages
Source: PwC analysis
The increase in parental wages from the additional workforce experience due to universal access
to year-before-school early childhood education was assumed to last for the rest of the working
life of parents who joined the workforce. Parents who work additional hours due to government
investment and subsidisation of early childhood education are expected to experience growth in
lifetime earnings from increased labour participation, however, we have not included this impact in
our analysis. The results are shown in the table below.
Table 16: Summary of modelling outputs for growth in parental wages from additional
workforce experience
Description of output Impact from UK study
Scaled impact Number of parents / carers
Increase to annual wage,
including taxation ($)
Full-time primary carers 3 per cent 0.5 per cent 5,449 1,889,154
Part-time primary carers 1 per cent 0.17 per cent 7,941 917,719
Value of increase to annual wages ($)
2,806,873
Note: Monetary values are in 2017 dollars. We assume that the PwC analysis of the impact on mothers’ wages would replicate
those for primary carers.
Source: PwC analysis
Number of
additional mothers in workforce
Average annual
wage for mothers with children aged 0 to 5
Annual
increase to wages
Increase to
lifetime earnings of
mothers with children aged 1
to 7
6 (scaling
factor)
34 A Smart Investment for a Smarter Australia: Economic analysis of universal early childhood education in the year before school in Australia
6.2 Improvements in literacy and numeracy: education cost savings
The development of a strong foundation of cognitive and social skills has been demonstrated to be an important factor in early primary school outcomes. Analysis of the Australian Early Development Census shows that children who are experience developmental vulnerabilities at school entry are much less likely to score in the top bands of NAPLAN at Year 3, with language, communication and social competence having the largest impacts (Pascoe & Brennan, 2017). The monetisable benefits of stronger cognitive and social skills on school entry include:
reduced need for special education placements
number of children repeating a year of school.
6.2.1 Special education requirements
Early childhood education can reduce children’s likelihood of needing additional education
support, with demonstrated reductions in children with mild intellectual disabilities or significant
behavioural challenges being placed into special education programs. There are currently no
public Australian sources that demonstrate the relationship between early childhood education
and special education placement. However, a U.S. meta-analysis of 22 studies conducted
between 1960 and 2016 found that, on average, participation in early childhood education leads
to significant reductions in special education placement for children with mild cognitive
impairments. The effect size noted was 0.33 standard deviations or 8.1 percentage points (McCoy
& et al, 2017). A recent analysis of the UK’s EPPSE data has demonstrated similar impacts in a
UK context, with substantial reduction in children’s risk of needing additional support (Philpott,
Young, Maich, Penney, & & Butler, 2019).
Our approach has been to apply the average impact identified in the international meta-analysis
to the prevalence rate in Australia, to take into account potential differences in diagnosis and
access to additional support for children with disability in Australia.11 A change in propensity of 8.1
percentage points would mean that 54 fewer children in the cohort require special schooling, with
an annual cost saving of approximately $8,500. Over the five-year period from 2018 until 2023,
when the cohort is aged 10, this amounts to a total annual reduction in special education costs
from early childhood education of around $475,000.
6.2.2 Children repeating a year of school
Improvement in school readiness and early achievement can also reduce the requirement for
children to repeat a year in primary school. The U.S. meta-analysis cited above also found that
participation in early childhood education leads to statistically significant decreases in the number
of children repeating a year of school, with the effect size roughly equal to 0.26 standard
deviations or 8.3 percentage points (McCoy & et al, 2017).
Australia has lower rates of children being held back a year than the US. Our approach has been
to apply the size of the impact identified in the meta-analysis and apply it to the proportion of
children who repeat a year in Australia. Currently, around 2.5 per cent of Australian children
repeat a year of school (Anderson R. , 2014). If this was reduced by 8.3 percentage points due to
participation in early childhood education, it would mean 662 fewer children repeating, with a cost
saving of around $17,275 each. The total annual reduction in the costs from children repeating a
year of school would therefore be approximately $11.8 million.
11 Around 6.8 per cent of children aged five to 14 years have a disability that restricts their schooling education, with 1.48 per cent of those
children experiencing mild schooling restrictions. Our analysis assumes that this cohort of children will be the best placed to be assisted by year-before-school early childhood education.
35 A Smart Investment for a Smarter Australia: Economic analysis of universal early childhood education in the year before school in Australia
6.3 Improvements in literacy and numeracy: higher educational attainment and lifetime earnings
Experiences early in life can significantly influence outcomes later in life. Early childhood
education outcomes shape school experiences and outcomes, which in turn affect higher
education experiences and outcomes, which affect employment and earnings potential in the long
term. This section describes how we have estimated the scale of this benefit – and the difference
that early childhood education might make to children’s education, employment and earnings
throughout their lives. Additional detail is also provided in Appendix C.
Our analysis explains the link between early childhood education and primary school NAPLAN
scores, which then link to Year 3 and Year 9 NAPLAN scores and finally Australian Tertiary
Admission Rank (ATAR) results (Goss & Sonnemann, 2016) (Department of Education and
Training, 2018). There is evidence that higher ATAR results are associated with higher education
completion and greater attainment, which then impacts employment and earnings (Leigh, 2008).
6.3.1 Improvements in literacy and numeracy: early childhood to NAPLAN results
We have already discussed approaches to measuring the impact of early childhood education on
school outcomes, in particular on primary school literacy and numeracy as measured in
standardised test scores such as NAPLAN results (see Section 4.4 and Appendix B).
Our projections of how literacy and numeracy at Year 3 predicts achievement at Year 9,
measured using NAPLAN scores, draws on earlier work by the Grattan Institute. Their study
showed the link between NAPLAN results over time and also demonstrated that the gap between
low and high achievers increases with time.12 This suggests that if early childhood education puts
students ahead at the start of primary school, this will have increasingly larger impacts as they
move through the education system.
Using the early childhood education effect size of 0.17 standard deviations, we projected this
impact on to low, medium and high achievers from Years 3 to Year 9. When comparing against
our baseline of not receiving year-before-school early childhood education, the impact was an
increase in the number of children receiving higher levels of Year 9 NAPLAN results, see Figure
13.
12 Grattan Institute de-identified linked student-level NAPLAN data, 2009 Year 3 cohort from the Victorian Curriculum and Assessment
Authority and Australian Curriculum Assessment and Reporting Authority de-identified student-level NAPLAN data, 2014 results linked to 2012.
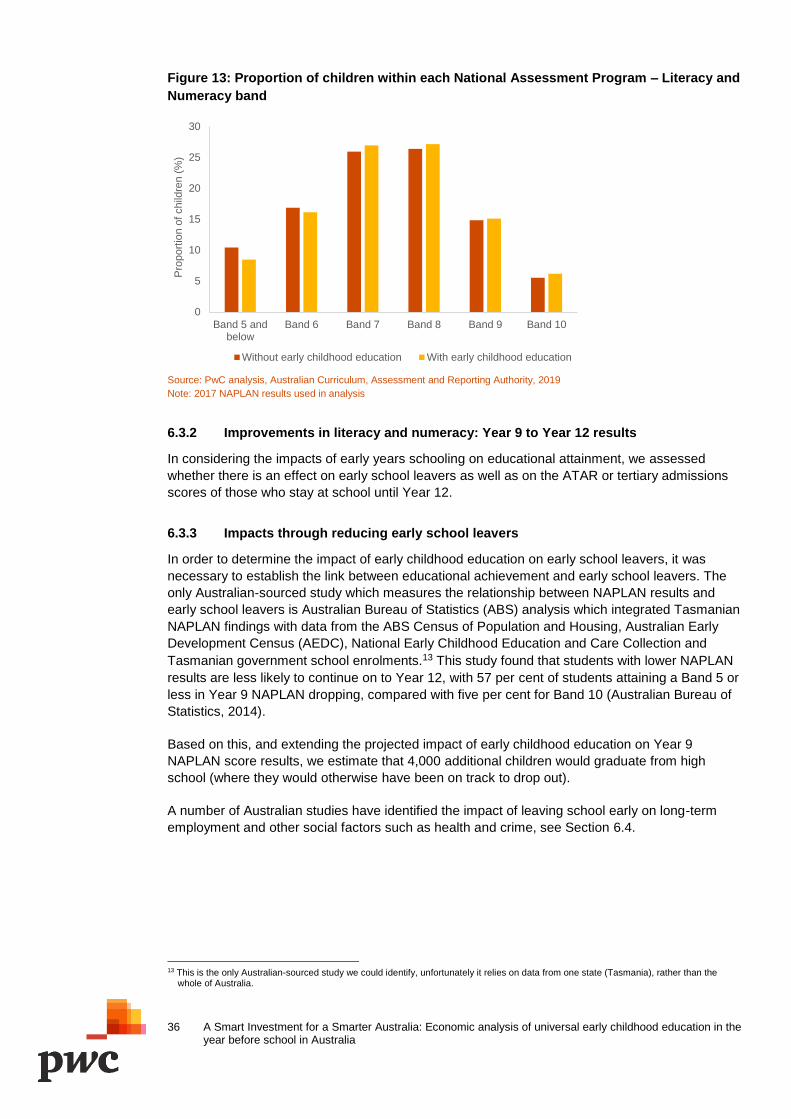
36 A Smart Investment for a Smarter Australia: Economic analysis of universal early childhood education in the year before school in Australia
Figure 13: Proportion of children within each National Assessment Program – Literacy and
Numeracy band
Source: PwC analysis, Australian Curriculum, Assessment and Reporting Authority, 2019
Note: 2017 NAPLAN results used in analysis
6.3.2 Improvements in literacy and numeracy: Year 9 to Year 12 results
In considering the impacts of early years schooling on educational attainment, we assessed
whether there is an effect on early school leavers as well as on the ATAR or tertiary admissions
scores of those who stay at school until Year 12.
6.3.3 Impacts through reducing early school leavers
In order to determine the impact of early childhood education on early school leavers, it was
necessary to establish the link between educational achievement and early school leavers. The
only Australian-sourced study which measures the relationship between NAPLAN results and
early school leavers is Australian Bureau of Statistics (ABS) analysis which integrated Tasmanian
NAPLAN findings with data from the ABS Census of Population and Housing, Australian Early
Development Census (AEDC), National Early Childhood Education and Care Collection and
Tasmanian government school enrolments.13 This study found that students with lower NAPLAN
results are less likely to continue on to Year 12, with 57 per cent of students attaining a Band 5 or
less in Year 9 NAPLAN dropping, compared with five per cent for Band 10 (Australian Bureau of
Statistics, 2014).
Based on this, and extending the projected impact of early childhood education on Year 9
NAPLAN score results, we estimate that 4,000 additional children would graduate from high
school (where they would otherwise have been on track to drop out).
A number of Australian studies have identified the impact of leaving school early on long-term
employment and other social factors such as health and crime, see Section 6.4.
13 This is the only Australian-sourced study we could identify, unfortunately it relies on data from one state (Tasmania), rather than the
whole of Australia.
0
5
10
15
20
25
30
Band 5 andbelow
Band 6 Band 7 Band 8 Band 9 Band 10
Pro
port
ion o
f child
ren (
%)
Without early childhood education With early childhood education
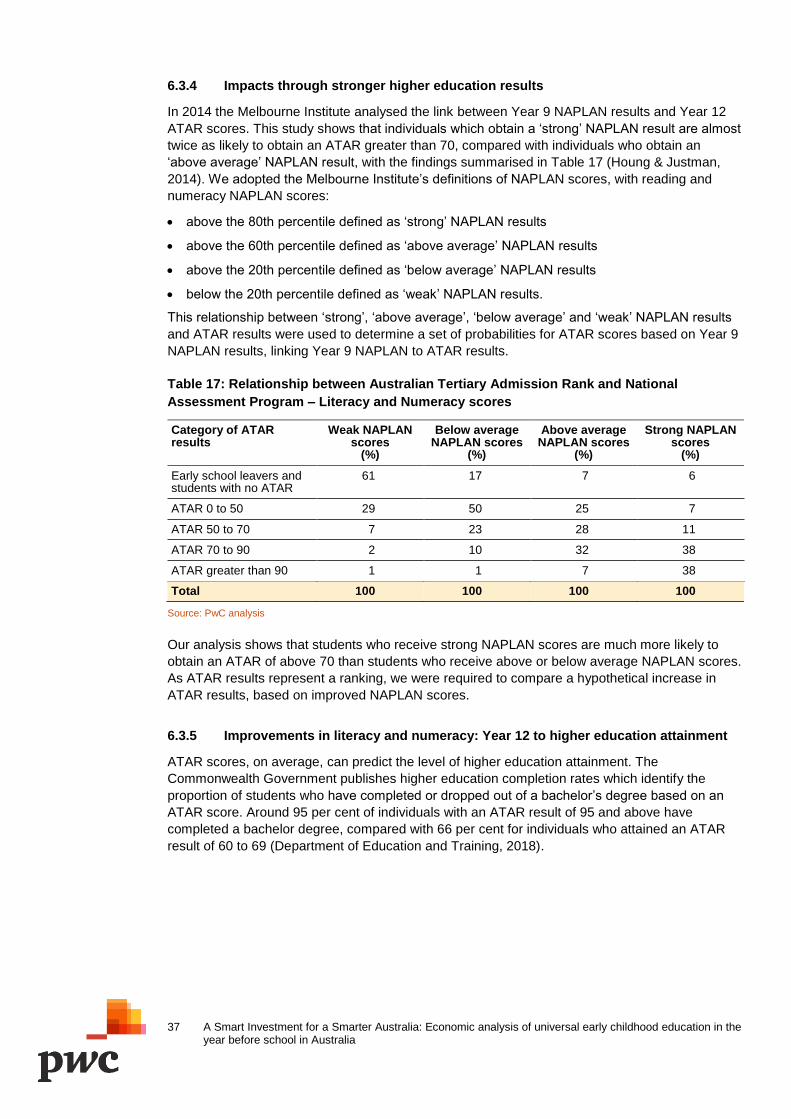
37 A Smart Investment for a Smarter Australia: Economic analysis of universal early childhood education in the year before school in Australia
6.3.4 Impacts through stronger higher education results
In 2014 the Melbourne Institute analysed the link between Year 9 NAPLAN results and Year 12
ATAR scores. This study shows that individuals which obtain a ‘strong’ NAPLAN result are almost
twice as likely to obtain an ATAR greater than 70, compared with individuals who obtain an
‘above average’ NAPLAN result, with the findings summarised in Table 17 (Houng & Justman,
2014). We adopted the Melbourne Institute’s definitions of NAPLAN scores, with reading and
numeracy NAPLAN scores:
above the 80th percentile defined as ‘strong’ NAPLAN results
above the 60th percentile defined as ‘above average’ NAPLAN results
above the 20th percentile defined as ‘below average’ NAPLAN results
below the 20th percentile defined as ‘weak’ NAPLAN results.
This relationship between ‘strong’, ‘above average’, ‘below average’ and ‘weak’ NAPLAN results
and ATAR results were used to determine a set of probabilities for ATAR scores based on Year 9
NAPLAN results, linking Year 9 NAPLAN to ATAR results.
Table 17: Relationship between Australian Tertiary Admission Rank and National
Assessment Program – Literacy and Numeracy scores
Category of ATAR results
Weak NAPLAN scores
(%)
Below average NAPLAN scores
(%)
Above average NAPLAN scores
(%)
Strong NAPLAN scores
(%)
Early school leavers and students with no ATAR
61 17 7 6
ATAR 0 to 50 29 50 25 7
ATAR 50 to 70 7 23 28 11
ATAR 70 to 90 2 10 32 38
ATAR greater than 90 1 1 7 38
Total 100 100 100 100
Source: PwC analysis
Our analysis shows that students who receive strong NAPLAN scores are much more likely to
obtain an ATAR of above 70 than students who receive above or below average NAPLAN scores.
As ATAR results represent a ranking, we were required to compare a hypothetical increase in
ATAR results, based on improved NAPLAN scores.
6.3.5 Improvements in literacy and numeracy: Year 12 to higher education attainment
ATAR scores, on average, can predict the level of higher education attainment. The
Commonwealth Government publishes higher education completion rates which identify the
proportion of students who have completed or dropped out of a bachelor’s degree based on an
ATAR score. Around 95 per cent of individuals with an ATAR result of 95 and above have
completed a bachelor degree, compared with 66 per cent for individuals who attained an ATAR
result of 60 to 69 (Department of Education and Training, 2018).
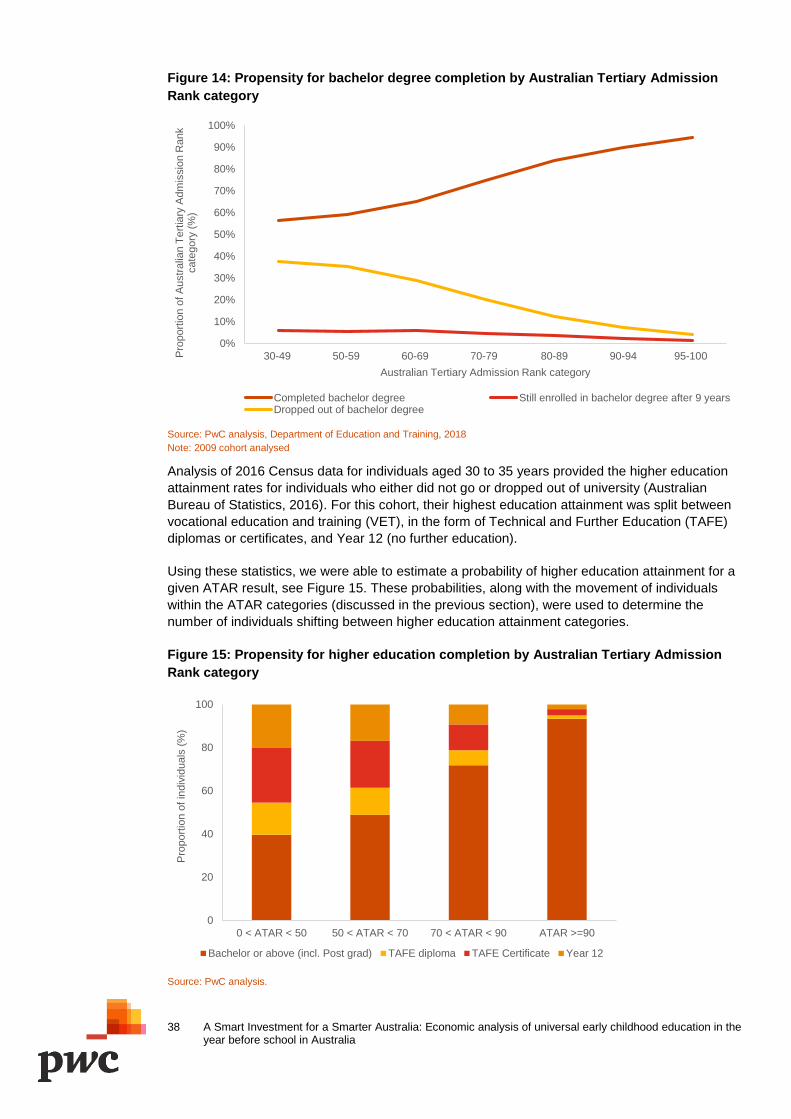
38 A Smart Investment for a Smarter Australia: Economic analysis of universal early childhood education in the year before school in Australia
Figure 14: Propensity for bachelor degree completion by Australian Tertiary Admission
Rank category
Source: PwC analysis, Department of Education and Training, 2018
Note: 2009 cohort analysed
Analysis of 2016 Census data for individuals aged 30 to 35 years provided the higher education
attainment rates for individuals who either did not go or dropped out of university (Australian
Bureau of Statistics, 2016). For this cohort, their highest education attainment was split between
vocational education and training (VET), in the form of Technical and Further Education (TAFE)
diplomas or certificates, and Year 12 (no further education).
Using these statistics, we were able to estimate a probability of higher education attainment for a
given ATAR result, see Figure 15. These probabilities, along with the movement of individuals
within the ATAR categories (discussed in the previous section), were used to determine the
number of individuals shifting between higher education attainment categories.
Figure 15: Propensity for higher education completion by Australian Tertiary Admission
Rank category
Source: PwC analysis.
0%
10%
20%
30%
40%
50%
60%
70%
80%
90%
100%
30-49 50-59 60-69 70-79 80-89 90-94 95-100Pro
port
ion o
f A
ustr
alia
n T
ert
iary
Adm
issio
n R
ank
cate
gory
(%
)
Australian Tertiary Admission Rank category
Completed bachelor degree Still enrolled in bachelor degree after 9 yearsDropped out of bachelor degree
0
20
40
60
80
100
0 < ATAR < 50 50 < ATAR < 70 70 < ATAR < 90 ATAR >=90
Pro
port
ion o
f in
div
iduals
(%
)
Bachelor or above (incl. Post grad) TAFE diploma TAFE Certificate Year 12
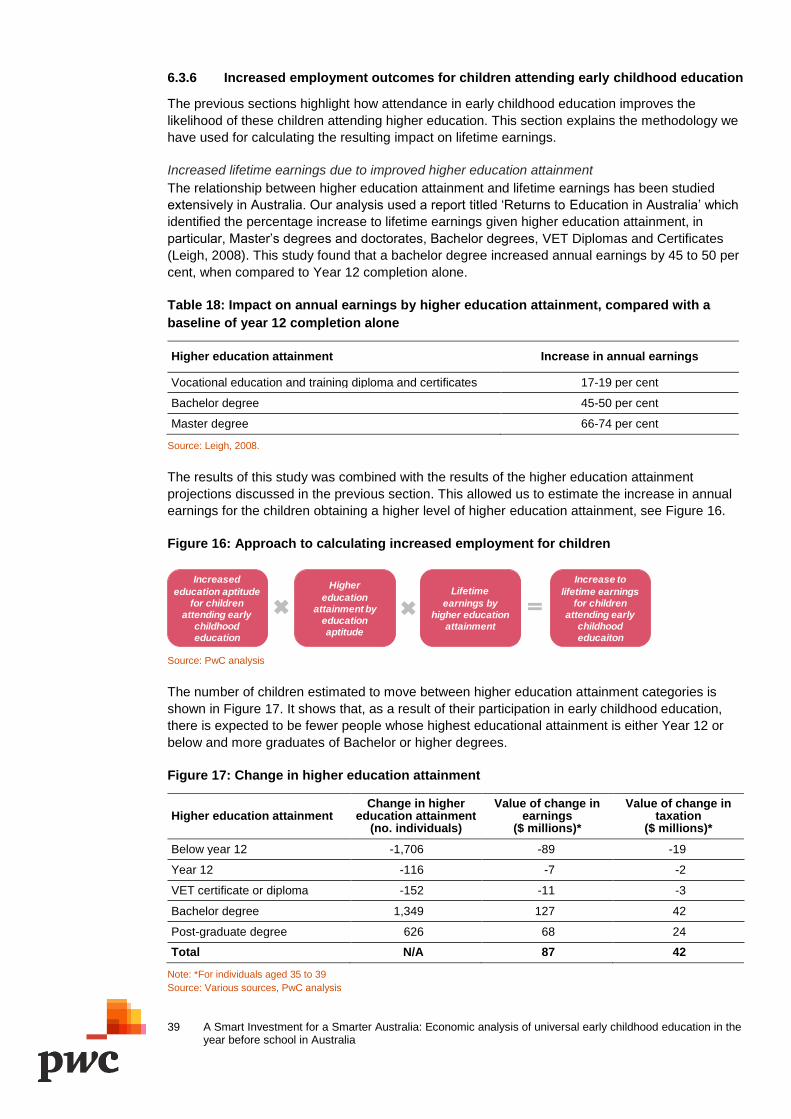
39 A Smart Investment for a Smarter Australia: Economic analysis of universal early childhood education in the year before school in Australia
6.3.6 Increased employment outcomes for children attending early childhood education
The previous sections highlight how attendance in early childhood education improves the
likelihood of these children attending higher education. This section explains the methodology we
have used for calculating the resulting impact on lifetime earnings.
Increased lifetime earnings due to improved higher education attainment
The relationship between higher education attainment and lifetime earnings has been studied
extensively in Australia. Our analysis used a report titled ‘Returns to Education in Australia’ which
identified the percentage increase to lifetime earnings given higher education attainment, in
particular, Master’s degrees and doctorates, Bachelor degrees, VET Diplomas and Certificates
(Leigh, 2008). This study found that a bachelor degree increased annual earnings by 45 to 50 per
cent, when compared to Year 12 completion alone.
Table 18: Impact on annual earnings by higher education attainment, compared with a
baseline of year 12 completion alone
Higher education attainment Increase in annual earnings
Vocational education and training diploma and certificates 17-19 per cent
Bachelor degree 45-50 per cent
Master degree 66-74 per cent
Source: Leigh, 2008.
The results of this study was combined with the results of the higher education attainment
projections discussed in the previous section. This allowed us to estimate the increase in annual
earnings for the children obtaining a higher level of higher education attainment, see Figure 16.
Figure 16: Approach to calculating increased employment for children
Source: PwC analysis
The number of children estimated to move between higher education attainment categories is
shown in Figure 17. It shows that, as a result of their participation in early childhood education,
there is expected to be fewer people whose highest educational attainment is either Year 12 or
below and more graduates of Bachelor or higher degrees.
Figure 17: Change in higher education attainment
Higher education attainment Change in higher
education attainment (no. individuals)
Value of change in earnings
($ millions)*
Value of change in taxation
($ millions)*
Below year 12 -1,706 -89 -19
Year 12 -116 -7 -2
VET certificate or diploma -152 -11 -3
Bachelor degree 1,349 127 42
Post-graduate degree 626 68 24
Total N/A 87 42
Note: *For individuals aged 35 to 39
Source: Various sources, PwC analysis
Increased
education aptitude for children
attending early childhood education
Higher
education attainment by
education aptitude
Increase to
lifetime earnings for children
attending early childhood educaiton
Lifetime
earnings by higher education
attainment
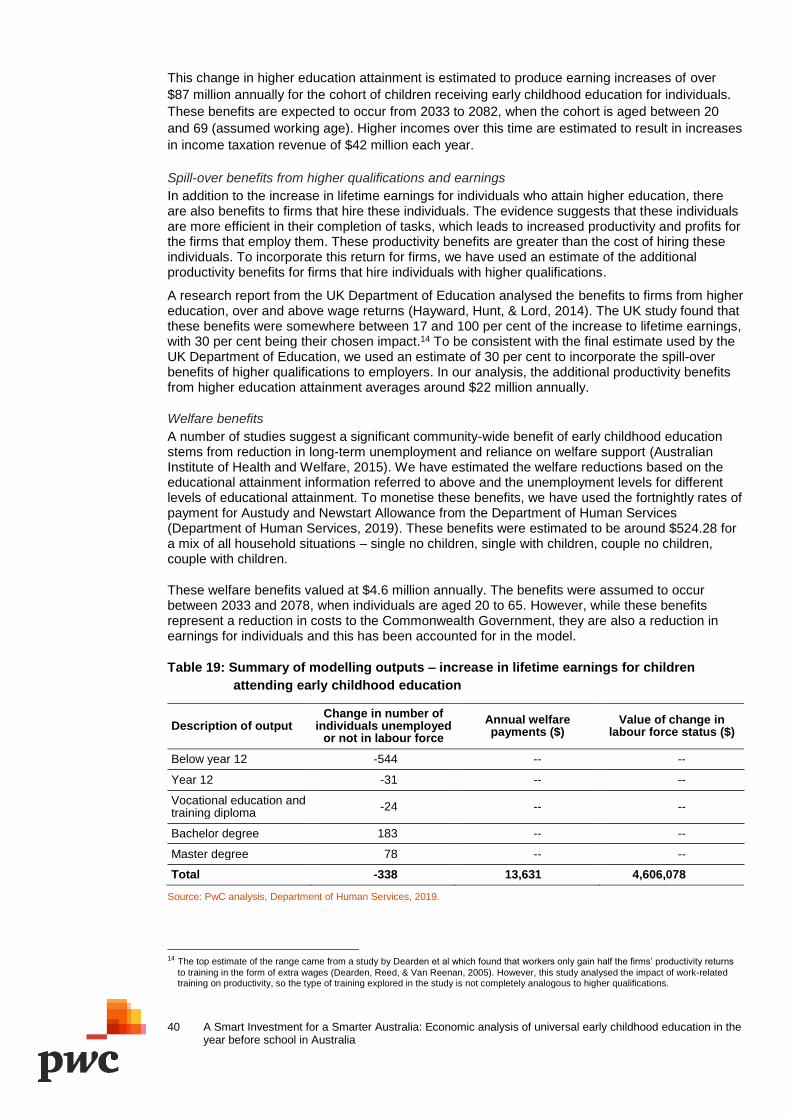
40 A Smart Investment for a Smarter Australia: Economic analysis of universal early childhood education in the year before school in Australia
This change in higher education attainment is estimated to produce earning increases of over
$87 million annually for the cohort of children receiving early childhood education for individuals.
These benefits are expected to occur from 2033 to 2082, when the cohort is aged between 20
and 69 (assumed working age). Higher incomes over this time are estimated to result in increases
in income taxation revenue of $42 million each year.
Spill-over benefits from higher qualifications and earnings
In addition to the increase in lifetime earnings for individuals who attain higher education, there are also benefits to firms that hire these individuals. The evidence suggests that these individuals are more efficient in their completion of tasks, which leads to increased productivity and profits for the firms that employ them. These productivity benefits are greater than the cost of hiring these individuals. To incorporate this return for firms, we have used an estimate of the additional productivity benefits for firms that hire individuals with higher qualifications.
A research report from the UK Department of Education analysed the benefits to firms from higher education, over and above wage returns (Hayward, Hunt, & Lord, 2014). The UK study found that these benefits were somewhere between 17 and 100 per cent of the increase to lifetime earnings, with 30 per cent being their chosen impact.14 To be consistent with the final estimate used by the UK Department of Education, we used an estimate of 30 per cent to incorporate the spill-over benefits of higher qualifications to employers. In our analysis, the additional productivity benefits from higher education attainment averages around $22 million annually.
Welfare benefits
A number of studies suggest a significant community-wide benefit of early childhood education stems from reduction in long-term unemployment and reliance on welfare support (Australian Institute of Health and Welfare, 2015). We have estimated the welfare reductions based on the educational attainment information referred to above and the unemployment levels for different levels of educational attainment. To monetise these benefits, we have used the fortnightly rates of payment for Austudy and Newstart Allowance from the Department of Human Services (Department of Human Services, 2019). These benefits were estimated to be around $524.28 for a mix of all household situations – single no children, single with children, couple no children, couple with children.
These welfare benefits valued at $4.6 million annually. The benefits were assumed to occur between 2033 and 2078, when individuals are aged 20 to 65. However, while these benefits represent a reduction in costs to the Commonwealth Government, they are also a reduction in earnings for individuals and this has been accounted for in the model.
Table 19: Summary of modelling outputs – increase in lifetime earnings for children
attending early childhood education
Description of output Change in number of
individuals unemployed or not in labour force
Annual welfare payments ($)
Value of change in labour force status ($)
Below year 12 -544 -- --
Year 12 -31 -- --
Vocational education and training diploma
-24 -- --
Bachelor degree 183 -- --
Master degree 78 -- --
Total -338 13,631 4,606,078
Source: PwC analysis, Department of Human Services, 2019.
14 The top estimate of the range came from a study by Dearden et al which found that workers only gain half the firms’ productivity returns
to training in the form of extra wages (Dearden, Reed, & Van Reenan, 2005). However, this study analysed the impact of work-related training on productivity, so the type of training explored in the study is not completely analogous to higher qualifications.
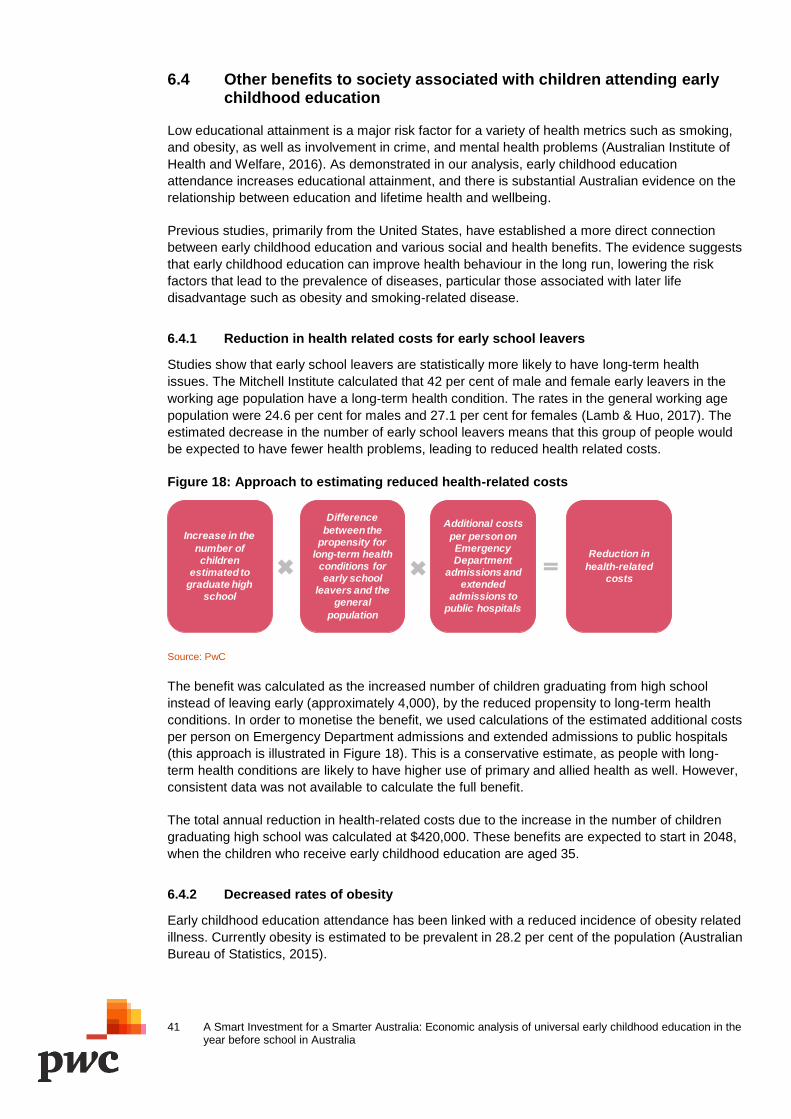
41 A Smart Investment for a Smarter Australia: Economic analysis of universal early childhood education in the year before school in Australia
6.4 Other benefits to society associated with children attending early childhood education
Low educational attainment is a major risk factor for a variety of health metrics such as smoking,
and obesity, as well as involvement in crime, and mental health problems (Australian Institute of
Health and Welfare, 2016). As demonstrated in our analysis, early childhood education
attendance increases educational attainment, and there is substantial Australian evidence on the
relationship between education and lifetime health and wellbeing.
Previous studies, primarily from the United States, have established a more direct connection
between early childhood education and various social and health benefits. The evidence suggests
that early childhood education can improve health behaviour in the long run, lowering the risk
factors that lead to the prevalence of diseases, particular those associated with later life
disadvantage such as obesity and smoking-related disease.
6.4.1 Reduction in health related costs for early school leavers
Studies show that early school leavers are statistically more likely to have long-term health
issues. The Mitchell Institute calculated that 42 per cent of male and female early leavers in the
working age population have a long‐term health condition. The rates in the general working age
population were 24.6 per cent for males and 27.1 per cent for females (Lamb & Huo, 2017). The
estimated decrease in the number of early school leavers means that this group of people would
be expected to have fewer health problems, leading to reduced health related costs.
Figure 18: Approach to estimating reduced health-related costs
Source: PwC
The benefit was calculated as the increased number of children graduating from high school
instead of leaving early (approximately 4,000), by the reduced propensity to long-term health
conditions. In order to monetise the benefit, we used calculations of the estimated additional costs
per person on Emergency Department admissions and extended admissions to public hospitals
(this approach is illustrated in Figure 18). This is a conservative estimate, as people with long-
term health conditions are likely to have higher use of primary and allied health as well. However,
consistent data was not available to calculate the full benefit.
The total annual reduction in health-related costs due to the increase in the number of children
graduating high school was calculated at $420,000. These benefits are expected to start in 2048,
when the children who receive early childhood education are aged 35.
6.4.2 Decreased rates of obesity
Early childhood education attendance has been linked with a reduced incidence of obesity related
illness. Currently obesity is estimated to be prevalent in 28.2 per cent of the population (Australian
Bureau of Statistics, 2015).
Increase in the
number of children
estimated to graduate high
school
Difference
between the propensity for
long-term health conditions for early school
leavers and the general
population
Reduction in
health-related costs
Additional costs
per person on Emergency Department
admissions and extended
admissions to public hospitals
42 A Smart Investment for a Smarter Australia: Economic analysis of universal early childhood education in the year before school in Australia
The Head Start study from the U.S. found that early childhood education is estimated to reduce
rates of obesity by 28 per cent (Frisvold, 2006). For our study, we reduced this rate and
incorporated a 9.2 per cent decrease in obesity propensity to better reflect the Australian context.
This implies that around 8,500 children who would otherwise be expected to be obese will,
instead, be of healthy weight. The estimated benefit in monetary terms is calculated by
determining the reduced healthcare expenditure from lower prevalence of obesity related
illnesses. Healthcare expenditure associated with obesity-related illnesses was almost $8,000 per
person ($2017-18) per annum (PwC Australia, 2015).
The total annual reduction in obesity related costs due to early childhood education attendance
was calculated at over $67 million. This benefit was assumed to start in 2048, when the study
cohort is aged 35 and continue until they are aged 81.
6.4.3 Decreased rates of smoking
Early childhood education attendance has also been linked with a reduced incidence of smoking
related illness. Currently, around 12.2 per cent of the Australian population smokes. The Head
Start study from the U.S. found that early childhood education is estimated to reduce rates of
smoking by 6.2 per cent. We reduced the size of this expected benefit by 50 per cent, to better
reflect the Australian context. This results in an estimated 2,300 fewer children who will grow up
to be smokers. Healthcare expenditure associated with smoking-related illnesses was over
$8,000 per person (2017-18) per annum.
The total annual reduction in crime, smoking and obesity related costs due to early childhood
education attendance was calculated at over $19 million. These benefits are assumed to start in
2048, when the cohort is aged 35 and continue until they are aged 81.
6.4.4 Decreased rates of crime
Children who participate in quality early childhood education have been shown in a number of
studies to be less likely to commit crimes either as juveniles or as adults (Heckman, Moon, Pinto,
Savelyev, & Yavitz, 2010). In Australia, one of the most significant predictors of involvement in the
justice system is low educational attainment, with a 2015 report showing two in three prisoners
had not studied past Year 10 (Prichard & Payne, 2005) (Australian Institute of Health and
Welfare, 2015).
Our estimate of the impact of early childhood education on crime is based on a reduced
propensity to commit a crime of 8.6 per cent (see Appendix C for details of the approach to
estimating this rate). This assumes that approximately 760 children will not go on to commit a
crime (where they would otherwise be expected to). To monetise the benefits of this shift, we
included the following costs which would be reduced:
social costs to the community from reduced rates of crime
policing costs to government, with less need to respond to reported crimes
court costs to government from reduced rates of offending
prison costs to government from reduced rates of offending resulting in prison.
We estimate that the benefits associated with reduced crime were valued at close to $40,000 per
person, for a total annual reduction in criminal costs linked to early childhood education of around
$19 million for individuals aged 35 to 39. These benefits are assumed to start in 2033, when the
cohort is aged 20 and continue until they are aged 65.
43 A Smart Investment for a Smarter Australia: Economic analysis of universal early childhood education in the year before school in Australia
7 Results of cost-benefit analysis
This chapter presents the results of the cost-benefit analysis and the study’s conclusions.
The aim of our analysis was to answer the following research questions:
Box 2 Key research questions
Do the benefits of Australian early childhood education programs outweigh the costs of delivering them, and what is the return on investment?
What are the individual, social and government benefits of early childhood education?
In answering these questions, we estimated the present value (NPV) to society of early childhood
education in Australia, the benefit-cost ratio (BCR) and return on investment (ROI) of investment
in early childhood education. The definitions of these concepts are:
Net present value – represents the discounted value of benefits net of costs. Discounting is
the process of determining the present value of a payment or a number of payments that is to
be received in the future. Given the time value of money, a dollar is worth more today than it
would be worth tomorrow.
Benefit cost ratio – an indicator used in cost-benefit analysis to show the relationship
between the relative costs and benefits, expressed in monetary terms. If a project has a BCR
greater than 1.0, the project is expected to deliver a positive net present value.
Return on investment – a performance measure used to evaluate the efficiency of an
investment. ROI tries to directly measure the amount of return on a particular investment,
relative to the investment’s cost. To calculate ROI, the benefit (or return) of an investment is
divided by the cost of the investment. The result is expressed as a percentage or a ratio.
7.1 Overall results
Using 2017 as the reference year, this study has identified $2.36 billion in costs associated with
the provision of early 15 hours of early childhood education in the year-before-school. These
costs are split between government (79 per cent) and parents or carers (21 per cent).
The study has also identified $4.74 billion in benefits associated with providing this one year of
providing early childhood education. Some of these benefits will be realised in the short-term,
including the additional income and higher taxes paid by parents or carers who choose to work
more because early childhood education is available ($1.46 billion and $313 million respectively).
Other benefits will be realised over a much longer period. The cognitive benefits for children who
receive a quality early childhood education can be linked with to $1.064 billion in higher earnings
over a lifetime and a further $495 million in higher taxes paid to government. The beneficiaries
include:
Children - $997 million or 21 per cent of benefits
Governments – $1.958 billion or 41 per cent of benefits
Parents and carers – $1.463 billion or 31 per cent of benefits
Employers and businesses – $319 million or 7 per cent of benefits
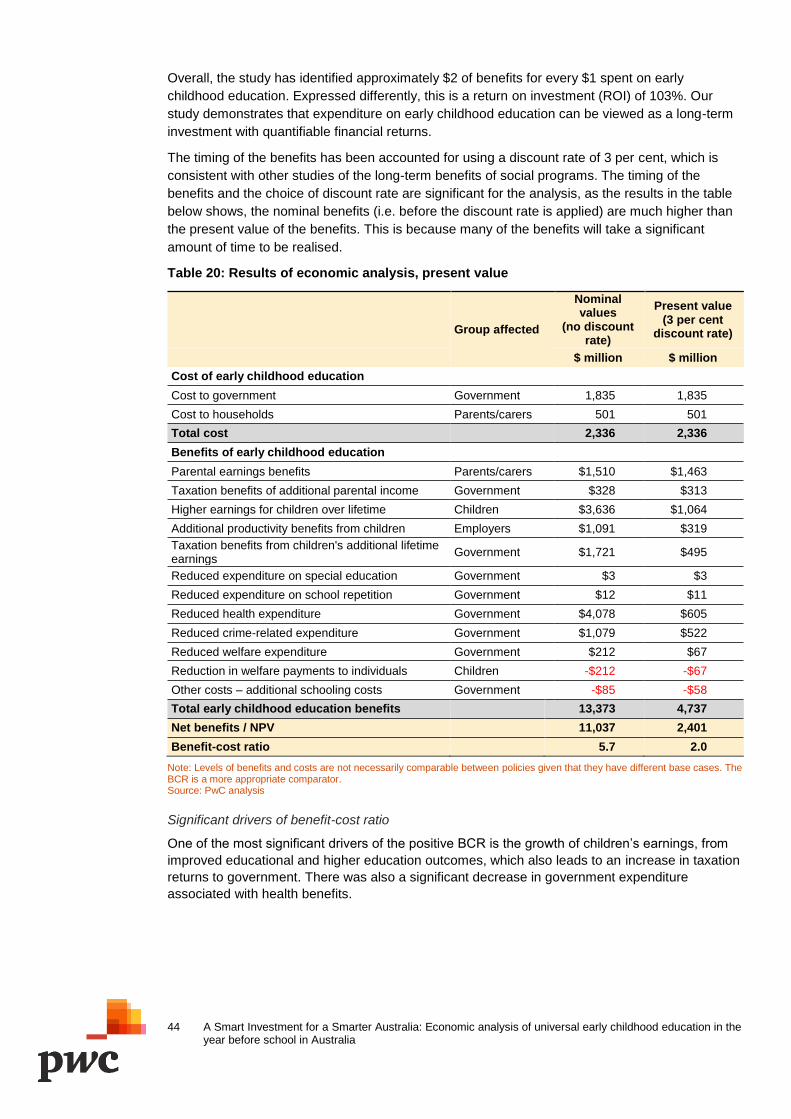
44 A Smart Investment for a Smarter Australia: Economic analysis of universal early childhood education in the year before school in Australia
Overall, the study has identified approximately $2 of benefits for every $1 spent on early
childhood education. Expressed differently, this is a return on investment (ROI) of 103%. Our
study demonstrates that expenditure on early childhood education can be viewed as a long-term
investment with quantifiable financial returns.
The timing of the benefits has been accounted for using a discount rate of 3 per cent, which is
consistent with other studies of the long-term benefits of social programs. The timing of the
benefits and the choice of discount rate are significant for the analysis, as the results in the table
below shows, the nominal benefits (i.e. before the discount rate is applied) are much higher than
the present value of the benefits. This is because many of the benefits will take a significant
amount of time to be realised.
Table 20: Results of economic analysis, present value
Group affected
Nominal values
(no discount rate)
Present value (3 per cent
discount rate)
$ million $ million
Cost of early childhood education
Cost to government Government 1,835 1,835
Cost to households Parents/carers 501 501
Total cost 2,336 2,336
Benefits of early childhood education
Parental earnings benefits Parents/carers $1,510 $1,463
Taxation benefits of additional parental income Government $328 $313
Higher earnings for children over lifetime Children $3,636 $1,064
Additional productivity benefits from children Employers $1,091 $319
Taxation benefits from children's additional lifetime earnings
Government $1,721 $495
Reduced expenditure on special education Government $3 $3
Reduced expenditure on school repetition Government $12 $11
Reduced health expenditure Government $4,078 $605
Reduced crime-related expenditure Government $1,079 $522
Reduced welfare expenditure Government $212 $67
Reduction in welfare payments to individuals Children -$212 -$67
Other costs – additional schooling costs Government -$85 -$58
Total early childhood education benefits 13,373 4,737
Net benefits / NPV 11,037 2,401
Benefit-cost ratio 5.7 2.0
Note: Levels of benefits and costs are not necessarily comparable between policies given that they have different base cases. The BCR is a more appropriate comparator. Source: PwC analysis
Significant drivers of benefit-cost ratio
One of the most significant drivers of the positive BCR is the growth of children’s earnings, from
improved educational and higher education outcomes, which also leads to an increase in taxation
returns to government. There was also a significant decrease in government expenditure
associated with health benefits.
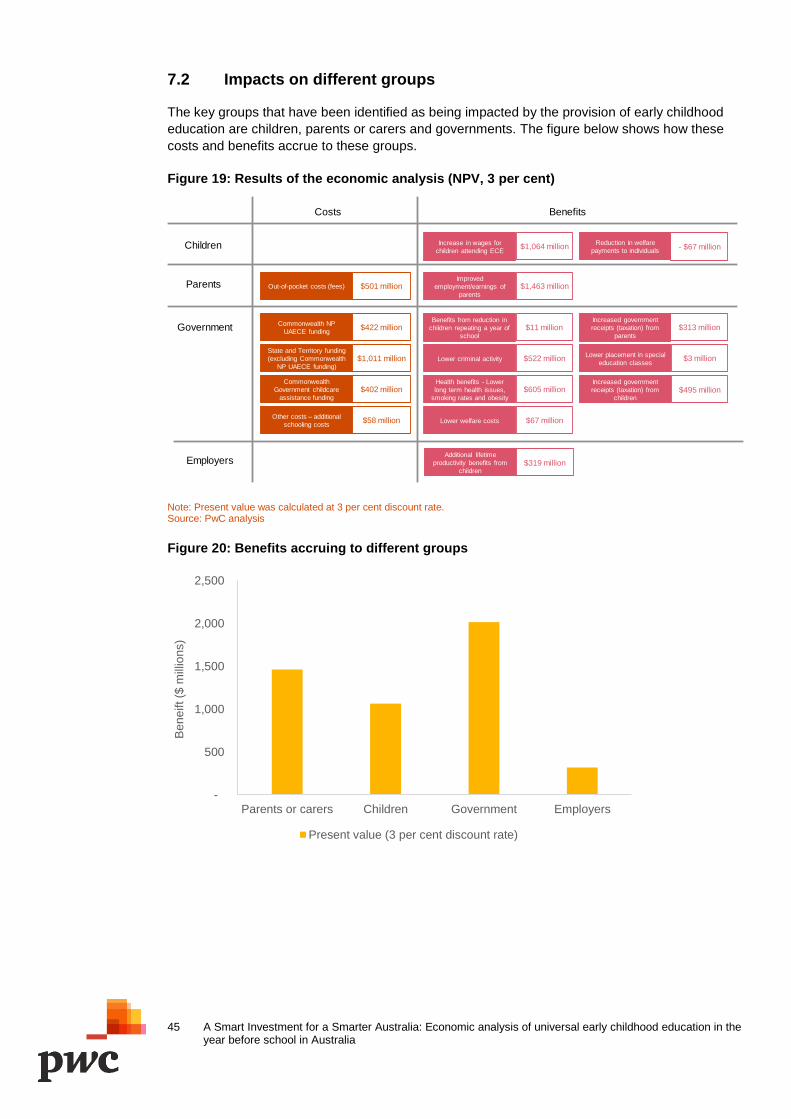
45 A Smart Investment for a Smarter Australia: Economic analysis of universal early childhood education in the year before school in Australia
7.2 Impacts on different groups
The key groups that have been identified as being impacted by the provision of early childhood
education are children, parents or carers and governments. The figure below shows how these
costs and benefits accrue to these groups.
Figure 19: Results of the economic analysis (NPV, 3 per cent)
Note: Present value was calculated at 3 per cent discount rate. Source: PwC analysis
Figure 20: Benefits accruing to different groups
Increase in wages for
children attending ECE
Lower criminal activity
Lower welfare costs
Improved
employment/earnings of
parents
Health benefits - Lower
long term health issues,
smoking rates and obesity
Increased government
receipts (taxation) from
parents
Increased government
receipts (taxation) from
children
Lower placement in special
education classes
Benefits from reduction in
children repeating a year of
school
Out-of-pocket costs (fees)
State and Territory funding
(excluding Commonwealth
NP UAECE funding)
Commonwealth NP
UAECE funding
Commonwealth
Government childcare
assistance funding
BenefitsCosts
Children
Parents
Government
$501 million
$1,011 million
$422 million
$402 million
$1,064 million
$522 million
$67 million
$1,463 million
$605 million
$11 million
$3 million
$495 million
$313 million
Reduction in welfare
payments to individuals- $67 million
Other costs – additional
schooling costs$58 million
Additional lifetime
productivity benefits from
children
Employers $319 million
-
500
1,000
1,500
2,000
2,500
Parents or carers Children Government Employers
Be
ne
ift ($
mill
ion
s)
Present value (3 per cent discount rate)
46 A Smart Investment for a Smarter Australia: Economic analysis of universal early childhood education in the year before school in Australia
7.2.1 Government
The Commonwealth Government and State and Territory governments contribute a sizeable
share of the funding for early childhood education, estimated at $1.8 billion.
The Commonwealth Government is also a beneficiary of early childhood education, in the form of
higher taxes paid by parents/carers who are able to work more because of the availability of early
childhood education, or children who earn more over their lifetimes. The Commonwealth
Government is also a beneficiary of reduced social expenditure, including, reduction in welfare
payments, health and crime-related expenditure. Many of these social benefits are also positives
for society in general, particularly the reduction in criminality.
The reduced social expenditure and increase in taxation was estimated at $7.3 billion over the
analysis period, $2.0 billion when discounted at 3 per cent. By assuming the welfare and taxation
benefits accrue to the Commonwealth Government and the health, crime and schooling-related
benefits go to the state governments, we were able to split up the total return to the
Commonwealth and state governments of early childhood education. The value of early childhood
education to the Commonwealth Government is $2.3 billion over the analysis period, $0.9 billion
when discounted at 3 per cent, with the state government obtaining $5.1 billion over the analysis
period, $1.1 billion when discounted at 3 per cent.
7.2.2 Children
The cost-benefit analysis has focussed on quantifying the economic impacts of improvements in the cognitive performance of children who receive early childhood education, as these can be linked to educational achievement, which then also relates to higher earnings over a lifetime. The increase in lifetime earnings was calculated at $3.6 billion nominal over the total analysis period, $1.1 billion when discounted at 3 per cent.
7.2.3 Parents/carers
In most cases, parents or carers make a financial contribution to the cost of their early child education, which is the difference between the price charged by providers and the rate of subsidies provided by governments. Our analysis calculated this financial contribution as $0.5 billion in 2017.
The availability of early childhood education allows some parents participate in paid work, when they otherwise would not be able to. The income they receive from this work, less taxes paid to governments is a benefit to these parents. Over the analysis period, the increase in earnings was calculated at $1.5 billion nominal, $1.5 billion when discounted at 3 per cent.
7.2.4 Employers
In addition to the higher earnings estimated for the children who received a high quality early childhood education, the higher productivity of these workers over their lifetime is estimated to result in benefits of $1.1 billion in nominal terms, or $319 million when discounted at 3 per cent.
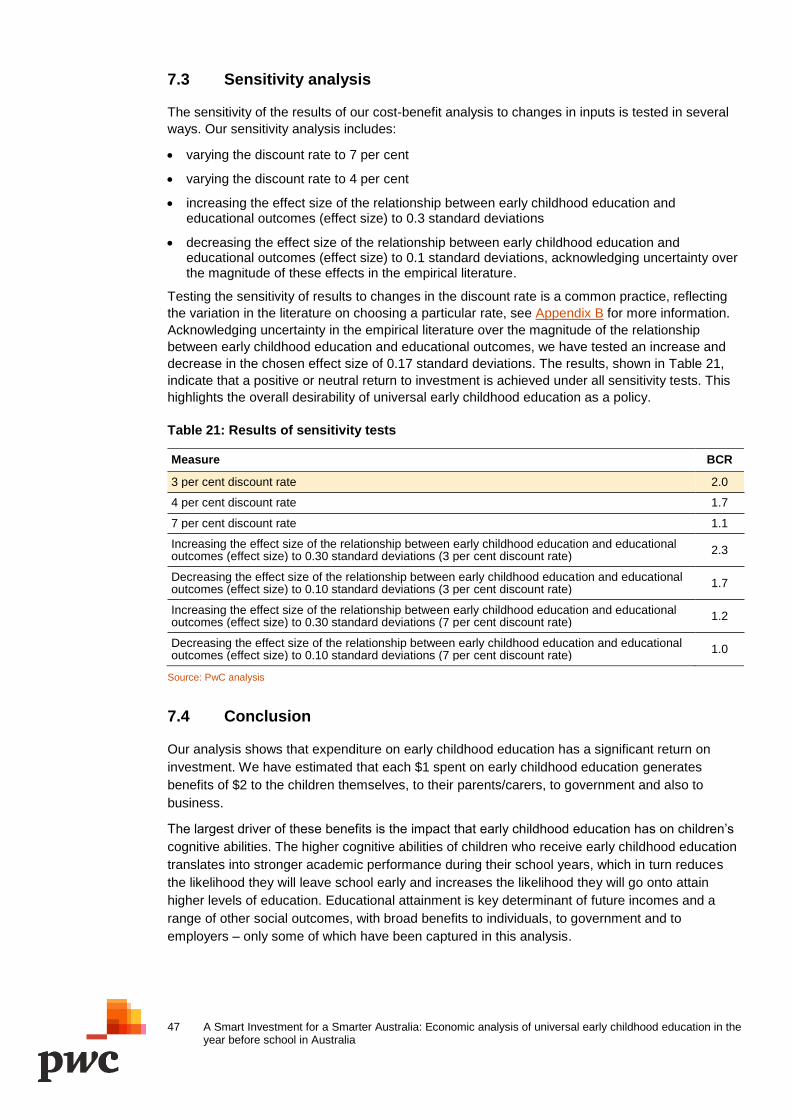
47 A Smart Investment for a Smarter Australia: Economic analysis of universal early childhood education in the year before school in Australia
7.3 Sensitivity analysis
The sensitivity of the results of our cost-benefit analysis to changes in inputs is tested in several
ways. Our sensitivity analysis includes:
varying the discount rate to 7 per cent
varying the discount rate to 4 per cent
increasing the effect size of the relationship between early childhood education and educational outcomes (effect size) to 0.3 standard deviations
decreasing the effect size of the relationship between early childhood education and educational outcomes (effect size) to 0.1 standard deviations, acknowledging uncertainty over the magnitude of these effects in the empirical literature.
Testing the sensitivity of results to changes in the discount rate is a common practice, reflecting
the variation in the literature on choosing a particular rate, see Appendix B for more information.
Acknowledging uncertainty in the empirical literature over the magnitude of the relationship
between early childhood education and educational outcomes, we have tested an increase and
decrease in the chosen effect size of 0.17 standard deviations. The results, shown in Table 21,
indicate that a positive or neutral return to investment is achieved under all sensitivity tests. This
highlights the overall desirability of universal early childhood education as a policy.
Table 21: Results of sensitivity tests
Measure BCR
3 per cent discount rate 2.0
4 per cent discount rate 1.7
7 per cent discount rate 1.1
Increasing the effect size of the relationship between early childhood education and educational outcomes (effect size) to 0.30 standard deviations (3 per cent discount rate)
2.3
Decreasing the effect size of the relationship between early childhood education and educational outcomes (effect size) to 0.10 standard deviations (3 per cent discount rate)
1.7
Increasing the effect size of the relationship between early childhood education and educational outcomes (effect size) to 0.30 standard deviations (7 per cent discount rate)
1.2
Decreasing the effect size of the relationship between early childhood education and educational outcomes (effect size) to 0.10 standard deviations (7 per cent discount rate)
1.0
Source: PwC analysis
7.4 Conclusion
Our analysis shows that expenditure on early childhood education has a significant return on
investment. We have estimated that each $1 spent on early childhood education generates
benefits of $2 to the children themselves, to their parents/carers, to government and also to
business.
The largest driver of these benefits is the impact that early childhood education has on children’s
cognitive abilities. The higher cognitive abilities of children who receive early childhood education
translates into stronger academic performance during their school years, which in turn reduces
the likelihood they will leave school early and increases the likelihood they will go onto attain
higher levels of education. Educational attainment is key determinant of future incomes and a
range of other social outcomes, with broad benefits to individuals, to government and to
employers – only some of which have been captured in this analysis.
48 A Smart Investment for a Smarter Australia: Economic analysis of universal early childhood education in the year before school in Australia
It is significant that early childhood education programs are delivering a clear return on investment
even though there is not yet enough Australian data to directly quantify and monetise the broader
social and emotional impacts of early childhood education.
The study demonstrates the impact of Australian’s investment in universal early childhood
education, with each cohort of children attending a quality early education program generating
returns now and into the future. But there is still room for improvement.
There are persistent issues with affordability, access for the most vulnerable children, and
ensuring consistent quality across the system. There is an opportunity to increase the return on
investment by:
Investing in raising the quality of early education programs.
Offering two years of quality early education in the years before school.
Ensuring children in disadvantaged communities have access to quality early childhood
education.
This study has used more Australian evidence and data than previous analyses of the impacts of
early childhood education. However, there is still a relatively significant gap in our understanding
of the overall impacts that the universal provision of early childhood education is having on
children’s outcomes in Australia. Several states and territories have done work to link children’s
early childhood education data with their later school achievement. But to-date, this information
has not been made publicly available. If it were to be made available to researchers, this
information would be useful in helping to explain the impacts of early childhood education in later
life. It would also be a useful resource for program review and design.
49 A Smart Investment for a Smarter Australia: Economic analysis of universal early childhood education in the year before school in Australia
Appendix
Appendix A References
Appendix B Determining effect size
Appendix C Model analysis details
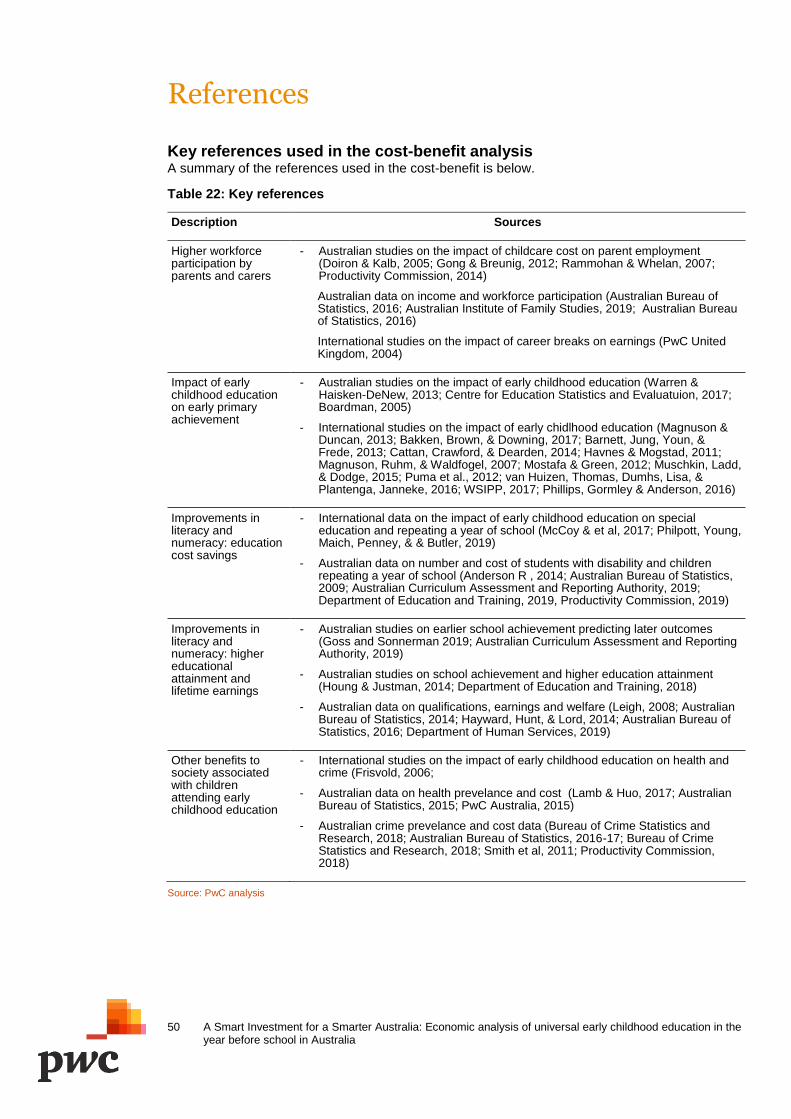
50 A Smart Investment for a Smarter Australia: Economic analysis of universal early childhood education in the year before school in Australia
References
Key references used in the cost-benefit analysis
A summary of the references used in the cost-benefit is below.
Table 22: Key references
Description Sources
Higher workforce participation by parents and carers
- Australian studies on the impact of childcare cost on parent employment (Doiron & Kalb, 2005; Gong & Breunig, 2012; Rammohan & Whelan, 2007; Productivity Commission, 2014)
Australian data on income and workforce participation (Australian Bureau of Statistics, 2016; Australian Institute of Family Studies, 2019; Australian Bureau of Statistics, 2016)
International studies on the impact of career breaks on earnings (PwC United Kingdom, 2004)
Impact of early childhood education on early primary achievement
- Australian studies on the impact of early childhood education (Warren & Haisken-DeNew, 2013; Centre for Education Statistics and Evaluatuion, 2017; Boardman, 2005)
- International studies on the impact of early chidlhood education (Magnuson & Duncan, 2013; Bakken, Brown, & Downing, 2017; Barnett, Jung, Youn, & Frede, 2013; Cattan, Crawford, & Dearden, 2014; Havnes & Mogstad, 2011; Magnuson, Ruhm, & Waldfogel, 2007; Mostafa & Green, 2012; Muschkin, Ladd, & Dodge, 2015; Puma et al., 2012; van Huizen, Thomas, Dumhs, Lisa, & Plantenga, Janneke, 2016; WSIPP, 2017; Phillips, Gormley & Anderson, 2016)
Improvements in literacy and numeracy: education cost savings
- International data on the impact of early childhood education on special education and repeating a year of school (McCoy & et al, 2017; Philpott, Young, Maich, Penney, & & Butler, 2019)
- Australian data on number and cost of students with disability and children repeating a year of school (Anderson R , 2014; Australian Bureau of Statistics, 2009; Australian Curriculum Assessment and Reporting Authority, 2019; Department of Education and Training, 2019, Productivity Commission, 2019)
Improvements in literacy and numeracy: higher educational attainment and lifetime earnings
- Australian studies on earlier school achievement predicting later outcomes (Goss and Sonnerman 2019; Australian Curriculum Assessment and Reporting Authority, 2019)
- Australian studies on school achievement and higher education attainment (Houng & Justman, 2014; Department of Education and Training, 2018)
- Australian data on qualifications, earnings and welfare (Leigh, 2008; Australian Bureau of Statistics, 2014; Hayward, Hunt, & Lord, 2014; Australian Bureau of Statistics, 2016; Department of Human Services, 2019)
Other benefits to society associated with children attending early childhood education
- International studies on the impact of early childhood education on health and crime (Frisvold, 2006;
- Australian data on health prevelance and cost (Lamb & Huo, 2017; Australian Bureau of Statistics, 2015; PwC Australia, 2015)
- Australian crime prevelance and cost data (Bureau of Crime Statistics and Research, 2018; Australian Bureau of Statistics, 2016-17; Bureau of Crime Statistics and Research, 2018; Smith et al, 2011; Productivity Commission, 2018)
Source: PwC analysis
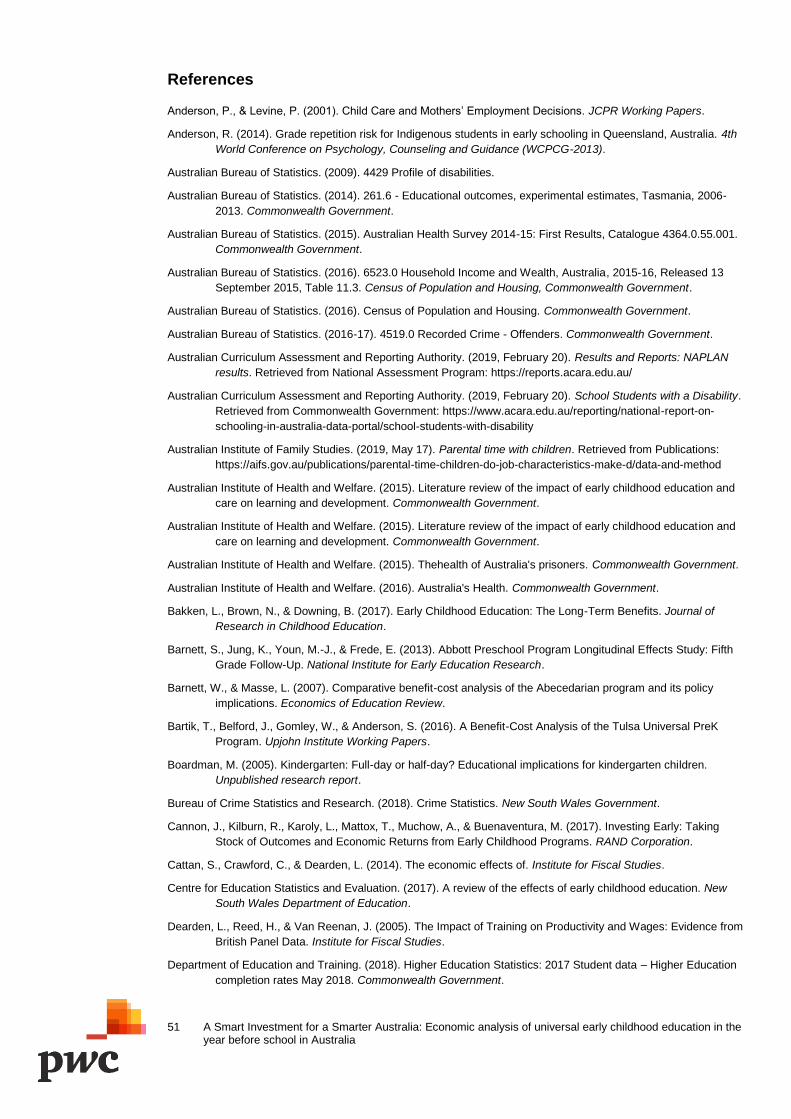
51 A Smart Investment for a Smarter Australia: Economic analysis of universal early childhood education in the year before school in Australia
References
Anderson, P., & Levine, P. (2001). Child Care and Mothers’ Employment Decisions. JCPR Working Papers.
Anderson, R. (2014). Grade repetition risk for Indigenous students in early schooling in Queensland, Australia. 4th
World Conference on Psychology, Counseling and Guidance (WCPCG-2013).
Australian Bureau of Statistics. (2009). 4429 Profile of disabilities.
Australian Bureau of Statistics. (2014). 261.6 - Educational outcomes, experimental estimates, Tasmania, 2006-
2013. Commonwealth Government.
Australian Bureau of Statistics. (2015). Australian Health Survey 2014-15: First Results, Catalogue 4364.0.55.001.
Commonwealth Government.
Australian Bureau of Statistics. (2016). 6523.0 Household Income and Wealth, Australia, 2015-16, Released 13
September 2015, Table 11.3. Census of Population and Housing, Commonwealth Government.
Australian Bureau of Statistics. (2016). Census of Population and Housing. Commonwealth Government.
Australian Bureau of Statistics. (2016-17). 4519.0 Recorded Crime - Offenders. Commonwealth Government.
Australian Curriculum Assessment and Reporting Authority. (2019, February 20). Results and Reports: NAPLAN
results. Retrieved from National Assessment Program: https://reports.acara.edu.au/
Australian Curriculum Assessment and Reporting Authority. (2019, February 20). School Students with a Disability.
Retrieved from Commonwealth Government: https://www.acara.edu.au/reporting/national-report-on-
schooling-in-australia-data-portal/school-students-with-disability
Australian Institute of Family Studies. (2019, May 17). Parental time with children. Retrieved from Publications:
https://aifs.gov.au/publications/parental-time-children-do-job-characteristics-make-d/data-and-method
Australian Institute of Health and Welfare. (2015). Literature review of the impact of early childhood education and
care on learning and development. Commonwealth Government.
Australian Institute of Health and Welfare. (2015). Literature review of the impact of early childhood education and
care on learning and development. Commonwealth Government.
Australian Institute of Health and Welfare. (2015). Thehealth of Australia's prisoners. Commonwealth Government.
Australian Institute of Health and Welfare. (2016). Australia's Health. Commonwealth Government.
Bakken, L., Brown, N., & Downing, B. (2017). Early Childhood Education: The Long-Term Benefits. Journal of
Research in Childhood Education.
Barnett, S., Jung, K., Youn, M.-J., & Frede, E. (2013). Abbott Preschool Program Longitudinal Effects Study: Fifth
Grade Follow-Up. National Institute for Early Education Research.
Barnett, W., & Masse, L. (2007). Comparative benefit-cost analysis of the Abecedarian program and its policy
implications. Economics of Education Review.
Bartik, T., Belford, J., Gomley, W., & Anderson, S. (2016). A Benefit-Cost Analysis of the Tulsa Universal PreK
Program. Upjohn Institute Working Papers.
Boardman, M. (2005). Kindergarten: Full-day or half-day? Educational implications for kindergarten children.
Unpublished research report.
Bureau of Crime Statistics and Research. (2018). Crime Statistics. New South Wales Government.
Cannon, J., Kilburn, R., Karoly, L., Mattox, T., Muchow, A., & Buenaventura, M. (2017). Investing Early: Taking
Stock of Outcomes and Economic Returns from Early Childhood Programs. RAND Corporation.
Cattan, S., Crawford, C., & Dearden, L. (2014). The economic effects of. Institute for Fiscal Studies.
Centre for Education Statistics and Evaluation. (2017). A review of the effects of early childhood education. New
South Wales Department of Education.
Dearden, L., Reed, H., & Van Reenan, J. (2005). The Impact of Training on Productivity and Wages: Evidence from
British Panel Data. Institute for Fiscal Studies.
Department of Education and Training. (2018). Higher Education Statistics: 2017 Student data – Higher Education
completion rates May 2018. Commonwealth Government.
52 A Smart Investment for a Smarter Australia: Economic analysis of universal early childhood education in the year before school in Australia
Department of Finance. (2018). Budget Paper Statement 6: Expenses and Net Capital Investment 2018-19.
Commonwealth Government.
Department of Human Services. (2019, February 20). Payment Rates: Austudy and Newstart Allowance. Retrieved
from Centrelink:
https://www.humanservices.gov.au/individuals/services/centrelink/austudy/payments/payment-rates ;
https://www.humanservices.gov.au/individuals/services/centrelink/newstart-allowance/how-much-you-
can-get
Doiron, D., & Kalb, G. (2005). Child Care and Mothers’ Employment Decisions. The Economic Record, Volume 1,
No. 254, 228.
Frisvold, D. (2006). Head Start Participation and Childhood Obesity. SSRN Electronic Journal.
Gong, X., & Breunig, R. (2012). Child care assistance: Are subsidies or tax credits better? Institute for the Study of
Labor, Discussion paper no. 6606.
Gormley, W. T., Gayer, T., Phillips, D., & Dawson, B. (2005). The Effects of Universal Pre-K on Cognitive
Development. Development Psychology.
Goss, P., & Sonnemann, J. (2016). Widening gaps: What NAPLAN tells us about student progress. Grattan
Institute.
Havnes, T., & Mogstad, M. (2011). No Child Left Behind: Subsidized Child Care and Children's Long-Run
Outcomes. American Economic Journal: Economic Policy.
Hayward, H., Hunt, E., & Lord, A. (2014). The economic value of key intermediate qualifications: estimating the
returns and lifetime productivity gains to GCSEs, A levels and apprenticeships. UK Department of
Education.
Heckman, J., Moon, S. H., Pinto, R., Savelyev, P., & Yavitz, A. (2010). The Rate of Return to the High/Scope Perry
Preschool Program. J Public Econ.
Heckman, J., Stixrud, J., & Urzua, S. (2006). The Effects of Cognitive and Noncognitive Abilities on Labor Market
Outcomes and Social Behavior. Journal of Labor Economics.
Houng, B., & Justman, M. (2014). NAPLAN Scores as Predictors of Access to Higher Education in Victoria.
Melbourne Institute Working Paper Series.
Houng, B., Jeon, S., & Kalb, G. (2011). The effects of childcare on child development. Melbourne Institute of
Applied Economic and Social Research, 63.
Karoly, L. (2017). Investing in the early years. RAND Corporation.
Kilburn, M. R., & Karoly, L. A. (2008). The Economics of Early Childhood Policy. Research and Development
Corporation, United States.
Lamb, S., & Huo, S. (2017). Counting the costs of lost opportunity in Australian education. Mitchell Institute Report
No. 02/2017.
Leigh, A. (2008). Returns to Education in Australia. Economic Papers Volume 27, Issue 3, 233-249.
Magnuson, K., & Duncan, G. J. (2013). Investing in Preschool Programs. Journal of Economic Perspectives—
Volume 27, 109-132.
Magnuson, K., Ruhm, C., & Waldfogel, J. (2007). The persistence of preschool effects: Do subsequent classroom
experiences matter? Early Childhood Research Quarterly.
McCoy, D., & et al. (2017). Impacts of Early Childhood Education on Medium- and Long-Term Educational
Outcomes. Educational Researcher, American Educational Research Association.
53 A Smart Investment for a Smarter Australia: Economic analysis of universal early childhood education in the year before school in Australia
Melhuish, E., Ereky-Stevens, K., Petrogiannis, K., Ariescu, A., Penderi, E., Rentzou, K., & Broekhuisen, M. (2015).
A Review of the Research on the Effects of Early Childhood Education and Care (ECEC) on Child
Development. European Union: Curriculum and Quality Analysis and Impact Review of European Early
Childhood Education and Care.
Moore, J. E., Domitrovich, C. E., Morgan, N. R., Cleveland, M. J., Shah, H., & Greenberg, M. T. (2015). The effects
of exposure to an enhanced preschool program on the social-emotional functioning of at-risk children.
Early Childhood Research Quarterly.
Morris, P., Mattera, S., Castells, N., Bangser, M., & Bierman, K. (2014). Impact Findings from the Head Start Cares
Demonstration: National Evaluation. OPRE Report No.2014-44.
Mostafa, T., & Green, A. (2012). Measuring the Impact of Universal Pre-School Education and Care on Literacy
Performance Scores. LLAKES Research Paper.
Muschkin, C., Ladd, H., & Dodge, K. (2015). Impact of North Carolina’s Early Childhood Initiatives on Special
Education Placements in Third Grade. National Center for Analysis of Longitudinal Data in Education
Research.
Nix, R. L., Bierman, K. L., Heinrichs, B. S., Gest, S. D., & Welsh, J. A. (2016). The Randomized Controlled Trial of
Head Start REDI: Sustained Effects on Developmental Trajectories of Social–Emotional Functioning.
Journal of Consulting and Clinical Psychology.
O’Connor, M., Cloney, D., Kvalsvig, A., & Goldfeld, S. (2019). Positive Mental Health and Academic Achievement
in Elementary School: New Evidence from a Matching Analysis. Educational Researcher, Vol. 48 No. 4,
205-216.
Parliament of Australia. (2019, March 20). Universal access to early childhood education: a quick guide. Retrieved
from Commonwealth Government:
https://www.aph.gov.au/About_Parliament/Parliamentary_Departments/Parliamentary_Library/pubs/rp/rp1
314/QG/ChildhoodEducatAccess
Phillips, D., Gormley, W., & Anderson, S. (2016). The effects of Tulsa's CAP Head Start program on middle-school
academic outcomes and progress. Development Psychology.
Phillips, D., Lipsey, M., Dodge, K. A., Haskins, R., Bassok, D., Burchinal, M., & Weiland, C. (2017). The Current
State of Scientific Knowledge on Pre-Kindergarten Effects. New York: Brookings Institution and Duke
Center for Child and Family Policy.
Philpott, D., Young, D., Maich, D., Penney, D., & & Butler, E. (2019). The Preemptive Nature of Quality Early Child
Education on Special Educational Needs in Children. Memorial University of Newfoundland, St. John's,
Newfoundland and Labrador.
Prichard, J., & Payne, J. (2005). Alcohol, drugs and crime: a study of juveniles in detention Research and public
policy series No.67. Australian Institute of Criminology.
Productivity Commission. (2014). Modelling the effects of childcare policy changes. Technical supplement to the
draft report: Childcare and early childhood learning, Commonwealth Government, 3.
Productivity Commission. (2015). Childcare and Early Childhood Learning Public inquiry - Appendix H.
Commonwealth Government.
Productivity Commission. (2018). Report on Government Services Justice - Part C, Chapter 6, 7 and 8.
Commonwealth Government.
Productivity Commission. (2019). Report on Government Services Child care, Education and Training - Part B,
Chapter 3 . Commonwealth Government.
Puma et al, M. (2012). Third Grade Follow-up to the Head Start Impact Study. OPRE Report 2012-45.
PwC Australia. (2015). Weighing the cost of obesity: A case for action.
PwC United Kingdom. (2004). Universal Early Education and Care in 2020: Costs, Benefits and Funding Options.
Social Market Foundation and Daycare.
54 A Smart Investment for a Smarter Australia: Economic analysis of universal early childhood education in the year before school in Australia
Rammohan, A., & Whelan, S. (2007). The impact of childcare costs on the full-time/part-time employment decisions
of Australian mothers. Australian Economic Papers, Volume 46, Issue 2, 152-169.
Reynolds, A. (2002 and 2011). The Chicago Child-Parent Centers: A Longitudinal Study of Extended Early
Childhood Intervention. Institute for Research on Poverty Discussion Papers .
Schweinhart, L. J., Montie, J., Xiang, Z., Barnett, W. S., Belfield, C. R., & Nores, M. (2005). Lifetime effects: The
High/Scope Perry Preschool study through age 40. High/Scope Educational Research Foundation.
Smith et al. (2011). Counting the Costs of Crime in Australia. Australian Institute of Criminology, 18 and 64.
Taggart, B., Sylva, K., Melhuish, E., Sammons, P., & Siraj, I. (2015). Effective Pre-School, Primary and Secondary
Education Project (Eppse 3-16+): How Pre-School Influences Children and Young People’s Attainment
and Developmental Outcomes Over Time. London: Department for Education.
Taggart, B., Sylva, K., Melhuish, E., Sammons, P., & Siraj, I. (2015). Effective Pre-School, Primary and Secondary
Education Project (Eppse 3-16+): How Pre-School Influences Children and Young People’s Attainment
and Developmental Outcomes Over Time. London: Department for Education.
Temple, J. A., & Reynolds, A. J. (2015). Using Benefit-Cost Analysis to Scale Up Early Childhood Programs
through Pay-for-Success Financing. Journal of benefit-cost analysis vol. 6.3, 628-653.
Van Huizen, T., Dumhs, L., & Plantenga, J. (2016). A Cost-Benefit Analysis of Universal Preschool Education
Evidence from a Spanish Reform. U.S.E. Discussion paper series, volume 16-11, issue 11.
Warren, D., & Haisken-DeNew, J. P. (2013). Early Bird Catches the Worm: The Causal Impact of Pre-school
Participation and Teacher Qualifications on Year 3 National NAPLAN Cognitive Tests. Melbourne Institute
Working Paper Series.
Washington State Institute for Public Policy. (2018, December 20). Pre-K to 12 Education. Retrieved from State
and district early childhood education programs: https://www.wsipp.wa.gov/BenefitCost/Program/270
55 A Smart Investment for a Smarter Australia: Economic analysis of universal early childhood education in the year before school in Australia
Determining effect sizes
A key component of this study is to determine the link between schooling and educational
outcomes. This drives our estimates of the majority of the benefits of early childhood education,
particularly later life benefits such as lifetime earnings, taxation, welfare and health-related costs.
There are no publicly available studies or datasets quantifying the impact that contemporary
Australian early childhood education has on early school achievement that could form the basis of
the economic analysis. There are Australian studies that indicate early childhood education
reduces developmental vulnerability in the first year of school (AEDC, 2014), and there is
Victorian research showing nearly 60 per cent of children who are on track (not developmentally
vulnerable) score in the highest bands in Year 3 NAPLAN test results (Pascoe & Brennan, 2017).
However, these studies do not draw a sufficiently direct link between early childhood education
and early school achievement and show a clear, average impact that could be utilised for the
economic analysis.
Similarly, there are several Australian studies that look at the impact of early childhood education
on NAPLAN, but they either are not reported with sufficient granularity or were undertaken before
the introduction of the National Quality Framework (NQF) and Universal Access policies – and
therefore do not fully reflect the likely impact of the contemporary Australian early childhood
education system. It is critical to take into account the impact of the NQF as the research
literature is very clear that only high quality programs achieve a positive and sustained impact.
Because an appropriate Australian study was not available, we decided to draw on the best
available evidence to determine the likely impact of Australia’s model of universal provision.To
determine an appropriate effect size (or range of effect sizes), we reviewed previously published
studies that estimated the effects of early childhood education on children’s outcomes.
Effect size is a simple way of quantifying the difference between two groups, which emphasises
the size of the difference by accounting for sample size within the calculation of the magnitude.
Effect size is measured in terms of the number of standard deviations, in other words, it takes into
account the variation, or how spread out a group is from the average.
Estimating the effect of early childhood education: review of available literature
Our review of previously published studies included various international and domestic analyses. The studies have been assessed according to their relevance for this economic analysis in order to identify a range for the effect size to use in the analysis. The criteria to assess the relevance of the studies included:
The location – there is a preference to use studies that are located in Australia, followed by those with similar models of delivery of early childhood programs and similar social and economic contacts (Canada, New Zealand and the UK are the most relevant comparators). However, the majority of the research is from the United States. Studies on the impact of early childhood education from the US are still highly relevant to Australia, as the teaching approaches and delivery models are relatively consistent. It is the longer-term impacts that cannot be directly translated to an Australian context, because of fundamentally different patterns of disadvantage; different approaches to the provision of schooling, social welfare and health services; and different income and taxation arrangements.
How recent the study was – there is a preference to use studies from the last 10 years, as these are more likely to reflect the experiences of children attending early childhood education in Australia today.
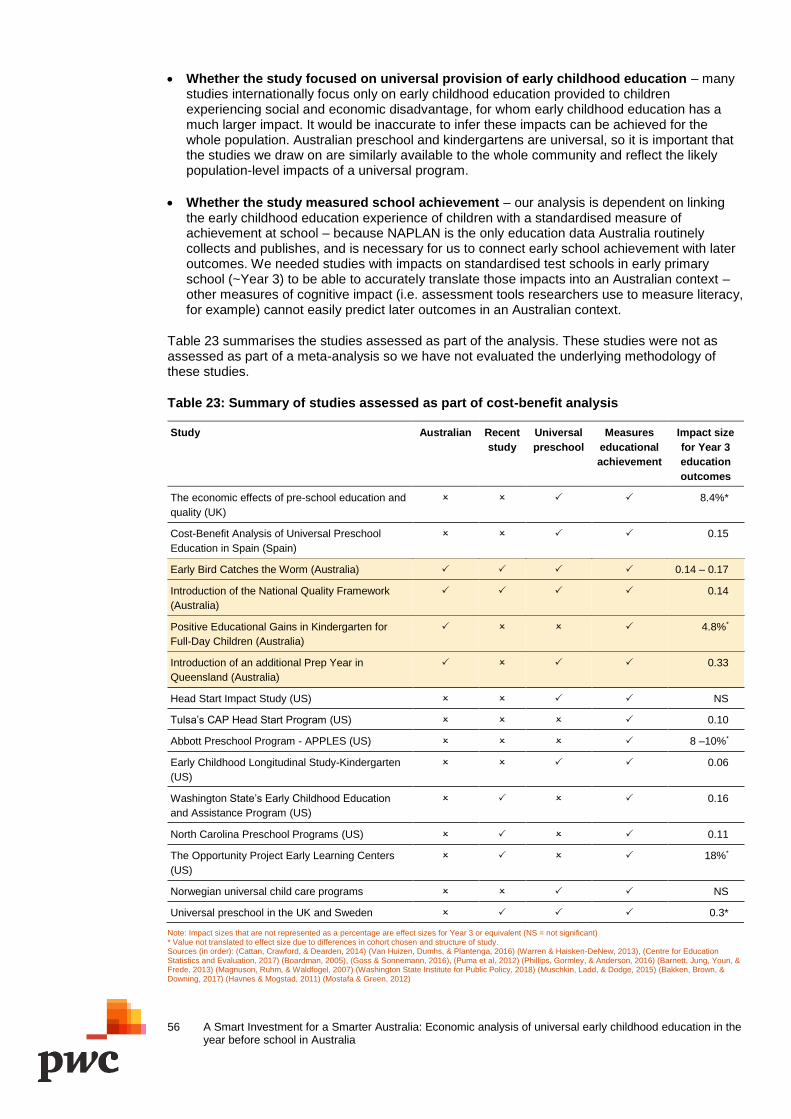
56 A Smart Investment for a Smarter Australia: Economic analysis of universal early childhood education in the year before school in Australia
Whether the study focused on universal provision of early childhood education – many studies internationally focus only on early childhood education provided to children experiencing social and economic disadvantage, for whom early childhood education has a much larger impact. It would be inaccurate to infer these impacts can be achieved for the whole population. Australian preschool and kindergartens are universal, so it is important that the studies we draw on are similarly available to the whole community and reflect the likely population-level impacts of a universal program.
Whether the study measured school achievement – our analysis is dependent on linking the early childhood education experience of children with a standardised measure of achievement at school – because NAPLAN is the only education data Australia routinely collects and publishes, and is necessary for us to connect early school achievement with later outcomes. We needed studies with impacts on standardised test schools in early primary school (~Year 3) to be able to accurately translate those impacts into an Australian context – other measures of cognitive impact (i.e. assessment tools researchers use to measure literacy, for example) cannot easily predict later outcomes in an Australian context.
Table 23 summarises the studies assessed as part of the analysis. These studies were not as assessed as part of a meta-analysis so we have not evaluated the underlying methodology of these studies.
Table 23: Summary of studies assessed as part of cost-benefit analysis
Study Australian Recent
study
Universal
preschool
Measures
educational
achievement
Impact size
for Year 3
education
outcomes
The economic effects of pre-school education and
quality (UK)
8.4%*
Cost-Benefit Analysis of Universal Preschool
Education in Spain (Spain)
0.15
Early Bird Catches the Worm (Australia) 0.14 – 0.17
Introduction of the National Quality Framework
(Australia)
0.14
Positive Educational Gains in Kindergarten for
Full-Day Children (Australia)
4.8%*
Introduction of an additional Prep Year in
Queensland (Australia)
0.33
Head Start Impact Study (US) NS
Tulsa’s CAP Head Start Program (US) 0.10
Abbott Preschool Program - APPLES (US) 8 –10%*
Early Childhood Longitudinal Study-Kindergarten
(US)
0.06
Washington State’s Early Childhood Education
and Assistance Program (US)
0.16
North Carolina Preschool Programs (US) 0.11
The Opportunity Project Early Learning Centers
(US)
18%*
Norwegian universal child care programs NS
Universal preschool in the UK and Sweden 0.3*
Note: Impact sizes that are not represented as a percentage are effect sizes for Year 3 or equivalent (NS = not significant) * Value not translated to effect size due to differences in cohort chosen and structure of study. Sources (in order): (Cattan, Crawford, & Dearden, 2014) (Van Huizen, Dumhs, & Plantenga, 2016) (Warren & Haisken-DeNew, 2013), (Centre for Education Statistics and Evaluation, 2017) (Boardman, 2005), (Goss & Sonnemann, 2016), (Puma et al, 2012) (Phillips, Gormley, & Anderson, 2016) (Barnett, Jung, Youn, & Frede, 2013) (Magnuson, Ruhm, & Waldfogel, 2007) (Washington State Institute for Public Policy, 2018) (Muschkin, Ladd, & Dodge, 2015) (Bakken, Brown, & Downing, 2017) (Havnes & Mogstad, 2011) (Mostafa & Green, 2012)
57 A Smart Investment for a Smarter Australia: Economic analysis of universal early childhood education in the year before school in Australia
Chosen effect size
To choose an effect size for our analysis we prioritised Australia-sourced effect sizes of universal
early childhood education programs. However, there were some issues associated with
Australian-sourced studies noted in Table 23. Some of these sources were published as a stand-
alone report that did not include a great deal of information on the type of analysis completed or
provide sufficiently granular data, in particular Introduction of the National Quality Framework and
Introduction of an additional Prep Year in Queensland. Other studies were conducted prior to the
introduction of the National Quality Framework and Positive Educational Gains in Kindergarten for
Full-Day Children produced results that were not translatable for the purposes of our analysis.
Numerous meta-analyses (a statistical analyses that combines the results of multiple scientific
studies) have examined studies identifying the impact of early childhood education on children’s
cognitive and achievement outcomes. One such study looked at the impact on cognitive or
achievement-related outcomes for 84 programs, measured at the end of each program, which is
typically when the children are commencing primary school (Magnuson & Duncan, 2013). This
meta-analysis found that the simple average effect sizes for early childhood education on
cognitive and achievement scores was a 0.35 standard deviation.
Based on the three key Australian studies and the results of the international studies and meta-
analyses, we chose an estimated effect size of 0.17 standard deviations. This is the estimated
average impact for all children attending early childhood education programs.
We believe this is a reasonable estimation, reflecting the expected average impact of moderate to
high quality universal early childhood education. It is consistent with available Australian evidence
and the much more extensive international evidence base. We note that an effect size of 0.17
standard deviations is much less than international estimates of the impact, which can be as large
as 0.35 standard deviations. However, many of these studies are focused on programs targeted
at disadvantage cohorts, where larger impacts are generally seen
The effect size is used to determine the link between Year 3 standardised test scores and year-
before-school early childhood education. The estimated increase in NAPLAN Year 3 scores were
calculated to be around 14 NAPLAN points for Reading and Numeracy.15
15 In our analysis, we were required to quantify educational achievement in order to determine the potential scale of the economic benefits
from early childhood education. We note the limitations of NAPLAN as measure of educational performance at an individual level. By nature, aggregate measures simplify a complex economy to a singular criterion and can hide nuances around the performance of the States and Territories, rural and metropolitan areas and individuals from different socioeconomic backgrounds. However, it is the only available source in Australia that tracks educational achievement at a holistic level.
58 A Smart Investment for a Smarter Australia: Economic analysis of universal early childhood education in the year before school in Australia
Model analysis details
Further details on the modelling methodology is contained in this chapter. This chapter includes
our approach to quantifying the costs and benefits of early childhood education, particularly the
value of:
Higher workforce participation by parents and carers
Societal benefits and costs avoided.
Higher workforce participation by parents and carers
There is a substantial level of Australian and international evidence to suggest that workforce
participation by parents and carers is dependent on the availability of affordable early childhood
education and care.
In international studies, the magnitude of the impact that the cost of childhood education and care
has on workforce participation varies. However, studies generally show that the more expensive
early childhood education is, the less parents and carers will work (Anderson & Levine, 2001).
The same results have been found in Australia, where a negative relationship between child care
costs and female labour force participation has been established (Doiron & Kalb, 2005) (Gong &
Breunig, 2012) (Rammohan & Whelan, 2007).
In Australia, the Commonwealth and State and Territory governments make an additional
investment in year-before-school early childhood education, over and above child care subsidies
for children aged 0-5, either by contributing funding to services or delivering services directly. This
investment creates substantial additional subsidies for year-before-school early childhood
education for parents and carers in the form of a reduction in out-of-pocket costs – including free
provision for some families. Without government investment in year-before-school early childhood
education, either through direct funding or delivering services, the cost for parents would be
substantially higher.
This study has focussed on determining the amount of additional hours parents of carers work
due to government investment in year-before-school early childhood education. This is the impact
of the reduced cost of early childhood education on workforce participation of parents and carers.
The value of these additional hours to parents and carers is additional income. The additional
income also results in increases to income taxation, with the Commonwealth Government the
beneficiary.
In addition, we know that time spent out of the workforce caring for young children can have a
longer lasting impact on the earnings of parents and carers. The analysis includes an estimate of
the increase in earnings for parents and carers as a result of being able to maintain an ongoing
role in the workforce.
The impact of government investment in early childhood education on workforce participation
To quantify the change in workforce participation, we have estimated the number of parents who
are either participating in the workforce or who work more hours due to government contributions
to early childhood education. To do this, we need to estimate the elasticity of labour supply due to
early childhood education subsidies. This elasticity can be interpreted as:
The additional hours that a parent or carer will work for a one per cent decrease in net
childcare costs.
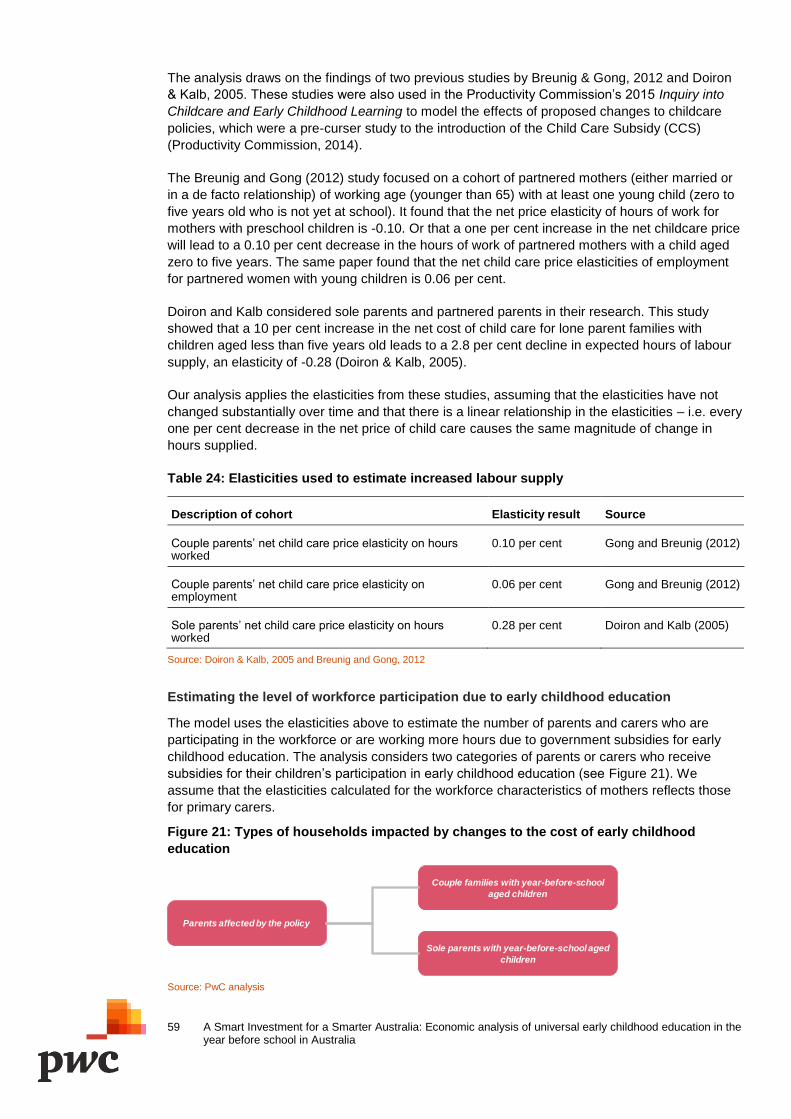
59 A Smart Investment for a Smarter Australia: Economic analysis of universal early childhood education in the year before school in Australia
The analysis draws on the findings of two previous studies by Breunig & Gong, 2012 and Doiron
& Kalb, 2005. These studies were also used in the Productivity Commission’s 2015 Inquiry into
Childcare and Early Childhood Learning to model the effects of proposed changes to childcare
policies, which were a pre-curser study to the introduction of the Child Care Subsidy (CCS)
(Productivity Commission, 2014).
The Breunig and Gong (2012) study focused on a cohort of partnered mothers (either married or
in a de facto relationship) of working age (younger than 65) with at least one young child (zero to
five years old who is not yet at school). It found that the net price elasticity of hours of work for
mothers with preschool children is -0.10. Or that a one per cent increase in the net childcare price
will lead to a 0.10 per cent decrease in the hours of work of partnered mothers with a child aged
zero to five years. The same paper found that the net child care price elasticities of employment
for partnered women with young children is 0.06 per cent.
Doiron and Kalb considered sole parents and partnered parents in their research. This study
showed that a 10 per cent increase in the net cost of child care for lone parent families with
children aged less than five years old leads to a 2.8 per cent decline in expected hours of labour
supply, an elasticity of -0.28 (Doiron & Kalb, 2005).
Our analysis applies the elasticities from these studies, assuming that the elasticities have not
changed substantially over time and that there is a linear relationship in the elasticities – i.e. every
one per cent decrease in the net price of child care causes the same magnitude of change in
hours supplied.
Table 24: Elasticities used to estimate increased labour supply
Description of cohort Elasticity result Source
Couple parents’ net child care price elasticity on hours worked
0.10 per cent Gong and Breunig (2012)
Couple parents’ net child care price elasticity on employment
0.06 per cent Gong and Breunig (2012)
Sole parents’ net child care price elasticity on hours worked
0.28 per cent Doiron and Kalb (2005)
Source: Doiron & Kalb, 2005 and Breunig and Gong, 2012
Estimating the level of workforce participation due to early childhood education
The model uses the elasticities above to estimate the number of parents and carers who are
participating in the workforce or are working more hours due to government subsidies for early
childhood education. The analysis considers two categories of parents or carers who receive
subsidies for their children’s participation in early childhood education (see Figure 21). We
assume that the elasticities calculated for the workforce characteristics of mothers reflects those
for primary carers.
Figure 21: Types of households impacted by changes to the cost of early childhood
education
Source: PwC analysis
Parents affected by the policy
Couple families with year-before-school
aged children
Sole parents with year-before-school aged
children
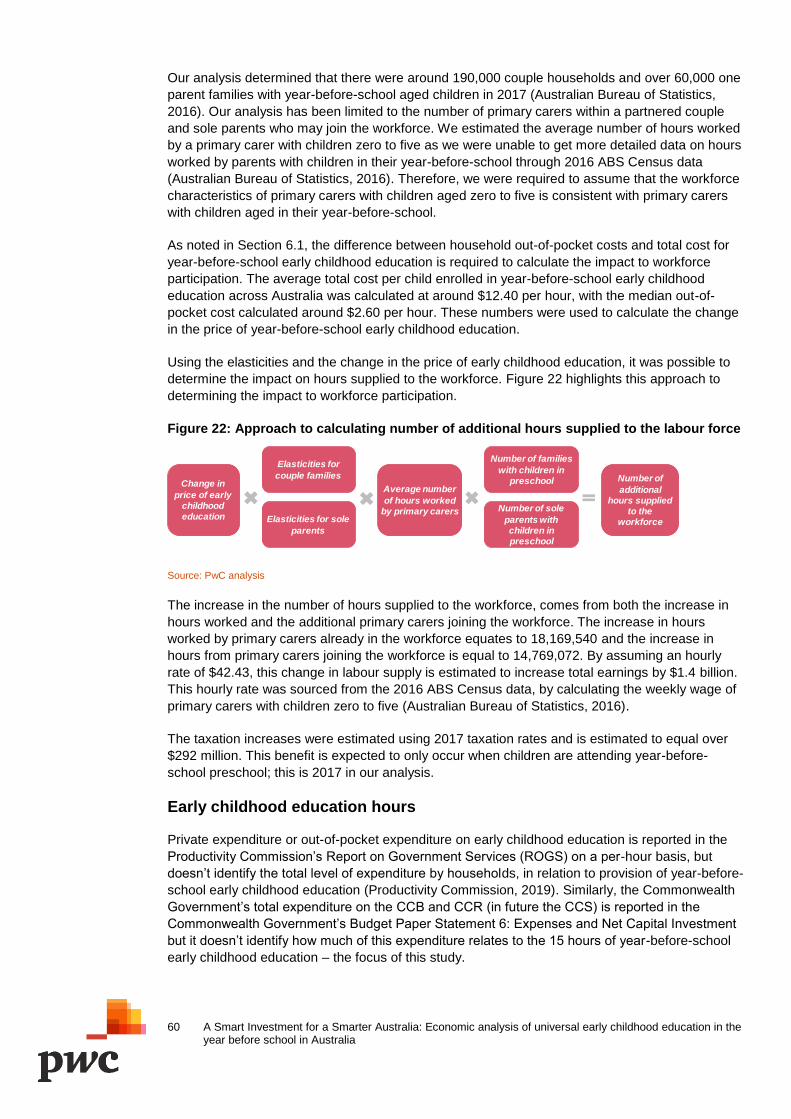
60 A Smart Investment for a Smarter Australia: Economic analysis of universal early childhood education in the year before school in Australia
Our analysis determined that there were around 190,000 couple households and over 60,000 one
parent families with year-before-school aged children in 2017 (Australian Bureau of Statistics,
2016). Our analysis has been limited to the number of primary carers within a partnered couple
and sole parents who may join the workforce. We estimated the average number of hours worked
by a primary carer with children zero to five as we were unable to get more detailed data on hours
worked by parents with children in their year-before-school through 2016 ABS Census data
(Australian Bureau of Statistics, 2016). Therefore, we were required to assume that the workforce
characteristics of primary carers with children aged zero to five is consistent with primary carers
with children aged in their year-before-school.
As noted in Section 6.1, the difference between household out-of-pocket costs and total cost for
year-before-school early childhood education is required to calculate the impact to workforce
participation. The average total cost per child enrolled in year-before-school early childhood
education across Australia was calculated at around $12.40 per hour, with the median out-of-
pocket cost calculated around $2.60 per hour. These numbers were used to calculate the change
in the price of year-before-school early childhood education.
Using the elasticities and the change in the price of early childhood education, it was possible to
determine the impact on hours supplied to the workforce. Figure 22 highlights this approach to
determining the impact to workforce participation.
Figure 22: Approach to calculating number of additional hours supplied to the labour force
Source: PwC analysis
The increase in the number of hours supplied to the workforce, comes from both the increase in
hours worked and the additional primary carers joining the workforce. The increase in hours
worked by primary carers already in the workforce equates to 18,169,540 and the increase in
hours from primary carers joining the workforce is equal to 14,769,072. By assuming an hourly
rate of $42.43, this change in labour supply is estimated to increase total earnings by $1.4 billion.
This hourly rate was sourced from the 2016 ABS Census data, by calculating the weekly wage of
primary carers with children zero to five (Australian Bureau of Statistics, 2016).
The taxation increases were estimated using 2017 taxation rates and is estimated to equal over
$292 million. This benefit is expected to only occur when children are attending year-before-
school preschool; this is 2017 in our analysis.
Early childhood education hours
Private expenditure or out-of-pocket expenditure on early childhood education is reported in the
Productivity Commission’s Report on Government Services (ROGS) on a per-hour basis, but
doesn’t identify the total level of expenditure by households, in relation to provision of year-before-
school early childhood education (Productivity Commission, 2019). Similarly, the Commonwealth
Government’s total expenditure on the CCB and CCR (in future the CCS) is reported in the
Commonwealth Government’s Budget Paper Statement 6: Expenses and Net Capital Investment
but it doesn’t identify how much of this expenditure relates to the 15 hours of year-before-school
early childhood education – the focus of this study.
Change in
price of early childhood education
Average number
of hours worked by primary carers
Number of
additional hours supplied
to the workforce
Number of families
with children in preschool
Number of sole
parents with children in preschool
Elasticities for
couple families
Elasticities for sole
parents
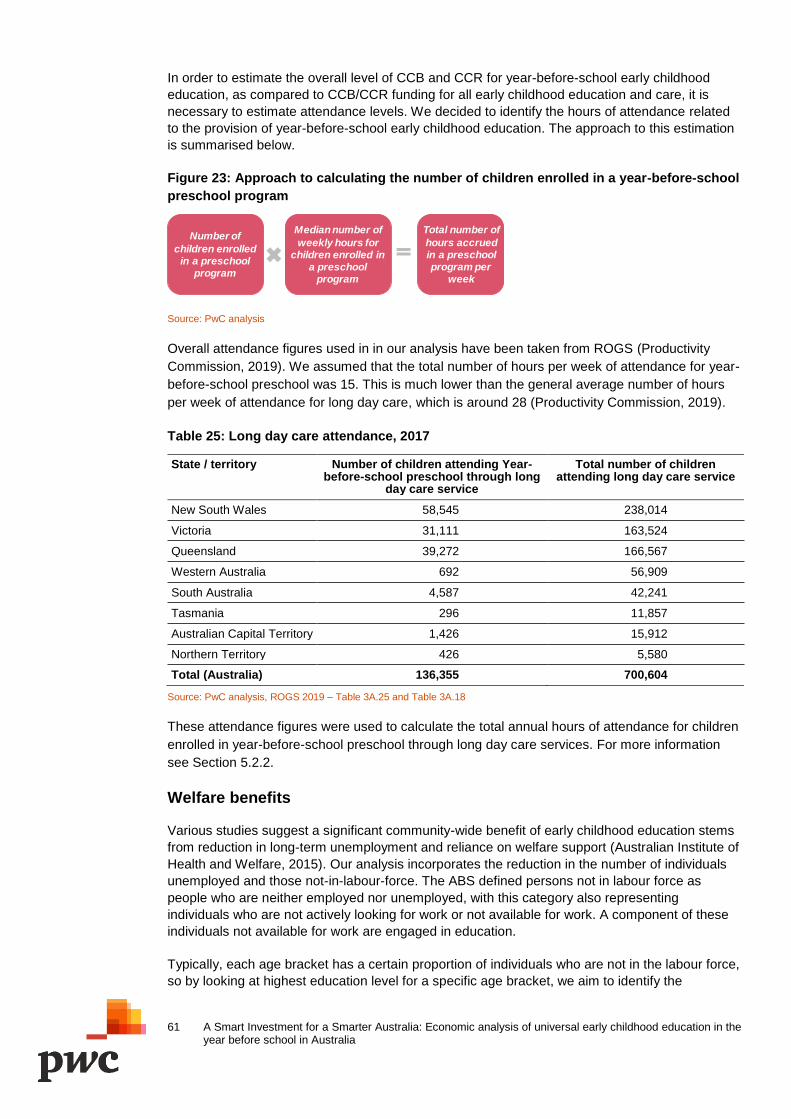
61 A Smart Investment for a Smarter Australia: Economic analysis of universal early childhood education in the year before school in Australia
In order to estimate the overall level of CCB and CCR for year-before-school early childhood
education, as compared to CCB/CCR funding for all early childhood education and care, it is
necessary to estimate attendance levels. We decided to identify the hours of attendance related
to the provision of year-before-school early childhood education. The approach to this estimation
is summarised below.
Figure 23: Approach to calculating the number of children enrolled in a year-before-school
preschool program
Source: PwC analysis
Overall attendance figures used in in our analysis have been taken from ROGS (Productivity
Commission, 2019). We assumed that the total number of hours per week of attendance for year-
before-school preschool was 15. This is much lower than the general average number of hours
per week of attendance for long day care, which is around 28 (Productivity Commission, 2019).
Table 25: Long day care attendance, 2017
State / territory Number of children attending Year-before-school preschool through long
day care service
Total number of children attending long day care service
New South Wales 58,545 238,014
Victoria 31,111 163,524
Queensland 39,272 166,567
Western Australia 692 56,909
South Australia 4,587 42,241
Tasmania 296 11,857
Australian Capital Territory 1,426 15,912
Northern Territory 426 5,580
Total (Australia) 136,355 700,604
Source: PwC analysis, ROGS 2019 – Table 3A.25 and Table 3A.18
These attendance figures were used to calculate the total annual hours of attendance for children
enrolled in year-before-school preschool through long day care services. For more information
see Section 5.2.2.
Welfare benefits
Various studies suggest a significant community-wide benefit of early childhood education stems
from reduction in long-term unemployment and reliance on welfare support (Australian Institute of
Health and Welfare, 2015). Our analysis incorporates the reduction in the number of individuals
unemployed and those not-in-labour-force. The ABS defined persons not in labour force as
people who are neither employed nor unemployed, with this category also representing
individuals who are not actively looking for work or not available for work. A component of these
individuals not available for work are engaged in education.
Typically, each age bracket has a certain proportion of individuals who are not in the labour force,
so by looking at highest education level for a specific age bracket, we aim to identify the
Number of
children enrolled in a preschool
program
Total number of
hours accrued in a preschool program per
week
Median number of
weekly hours for children enrolled in
a preschool program
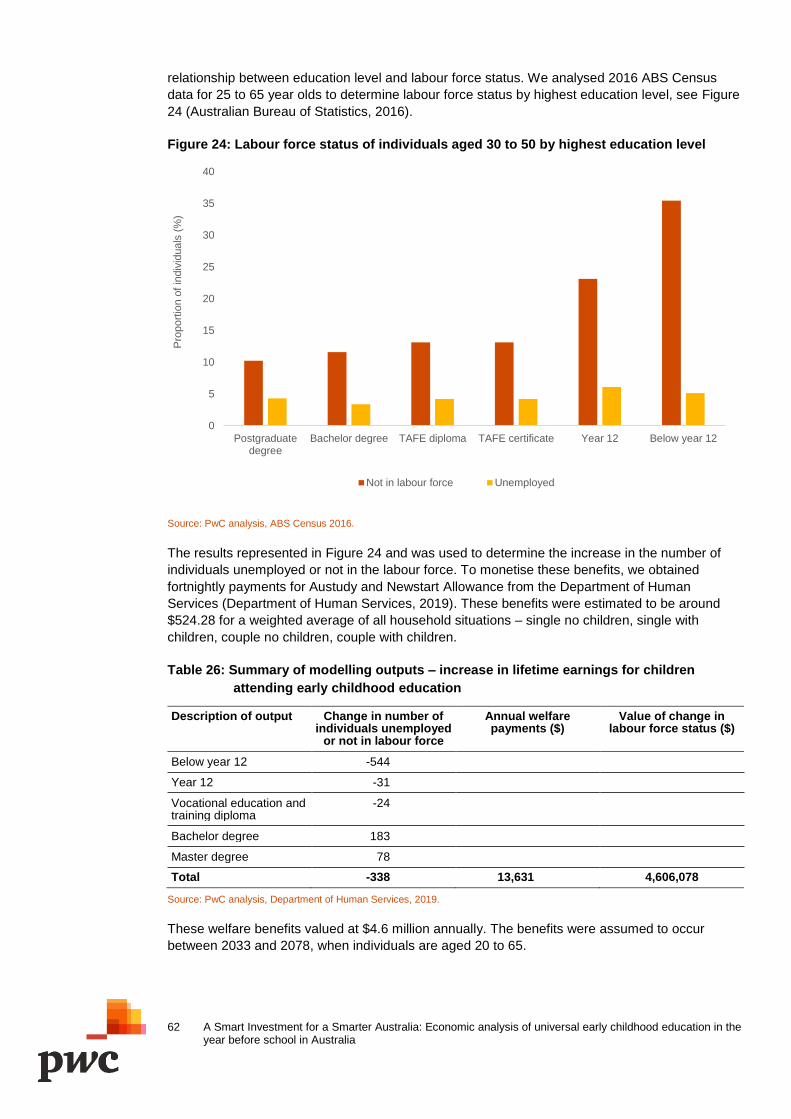
62 A Smart Investment for a Smarter Australia: Economic analysis of universal early childhood education in the year before school in Australia
relationship between education level and labour force status. We analysed 2016 ABS Census
data for 25 to 65 year olds to determine labour force status by highest education level, see Figure
24 (Australian Bureau of Statistics, 2016).
Figure 24: Labour force status of individuals aged 30 to 50 by highest education level
Source: PwC analysis, ABS Census 2016.
The results represented in Figure 24 and was used to determine the increase in the number of
individuals unemployed or not in the labour force. To monetise these benefits, we obtained
fortnightly payments for Austudy and Newstart Allowance from the Department of Human
Services (Department of Human Services, 2019). These benefits were estimated to be around
$524.28 for a weighted average of all household situations – single no children, single with
children, couple no children, couple with children.
Table 26: Summary of modelling outputs – increase in lifetime earnings for children
attending early childhood education
Description of output Change in number of individuals unemployed
or not in labour force
Annual welfare payments ($)
Value of change in labour force status ($)
Below year 12 -544
Year 12 -31
Vocational education and training diploma
-24
Bachelor degree 183
Master degree 78
Total -338 13,631 4,606,078
Source: PwC analysis, Department of Human Services, 2019.
These welfare benefits valued at $4.6 million annually. The benefits were assumed to occur
between 2033 and 2078, when individuals are aged 20 to 65.
0
5
10
15
20
25
30
35
40
Postgraduatedegree
Bachelor degree TAFE diploma TAFE certificate Year 12 Below year 12
Pro
port
ion o
f in
div
iduals
(%
)
Not in labour force Unemployed
63 A Smart Investment for a Smarter Australia: Economic analysis of universal early childhood education in the year before school in Australia
Societal benefits and costs avoided
Reduction in health-related costs for early school leavers
Section 6.4.1 states the relationship between early school leavers and long-term health issues.
Around 42 per cent of male and female early leavers in the working age population have a long‐
term health condition, as compared with 25.9 per cent of the general working age population
(Lamb & Huo, 2017).
The modelled decrease in early school leavers enabled us to calculate the subsequent reduction
in health related costs from early childhood education attendance. The benefit was calculated as
the difference between the propensity for long-term health conditions for early school leavers and
the general population, scaled by the reduction in the number of early school leavers.
In order to monetise the benefit, we used calculations of the estimated additional costs per person
on Emergency Department admissions and extended admissions to public hospitals. The total
annual reduction in health-related costs due to the increase in the number of children graduating
high school was calculated at $420,000. These benefits are expected to start in 2048, when the
cohort is aged 35, till 2094.
Decreased rates of crime
Children who have higher participation in early childhood education are less likely to commit
crimes either as a juvenile or adult. As noted in Section 6.4.4, the Head Start study from the U.S.
found that early childhood education reduced the probability that an individual will commit a crime
by 8.6 per cent. As the U.S. has a difference economic structure to Australia, in order to
determine the impact of early childhood education on Australian children, we reduced the size of
this expected benefit by 50 per cent.
The likelihood that an individual commits a crime changes with age, therefore, the methodology
for incorporating this benefit must take into consideration that the probability of committing a crime
is significantly greater for younger individuals than older individuals. Please note that due to data
availability, the propensity for committing a crime at different age groups was calculated using
NSW statistics from the Bureau of Crime Statistics and Research (Bureau of Crime Statistics and
Research, 2018).
The key inputs into this calculation include:
the probabilities of committing a crime for each age bracket - calculated using the total number of offenders and offender rates per 100,000 for the Australian population (Australian Bureau of Statistics, 2016-17)
crime rates for the general population was calculated as the product of Australian population by age, corresponding offender rates and the total crimes (Bureau of Crime Statistics and Research, 2018).
To monetise the benefit, we determined the following costs into the model:
reduced social costs to the community from reduced rates of crime
reduced policing costs to government, with less need to respond to reported crimes
reduced court costs to government from reduced rates of offending
reduced prison costs to government from reduced rates of offending resulting in prison.
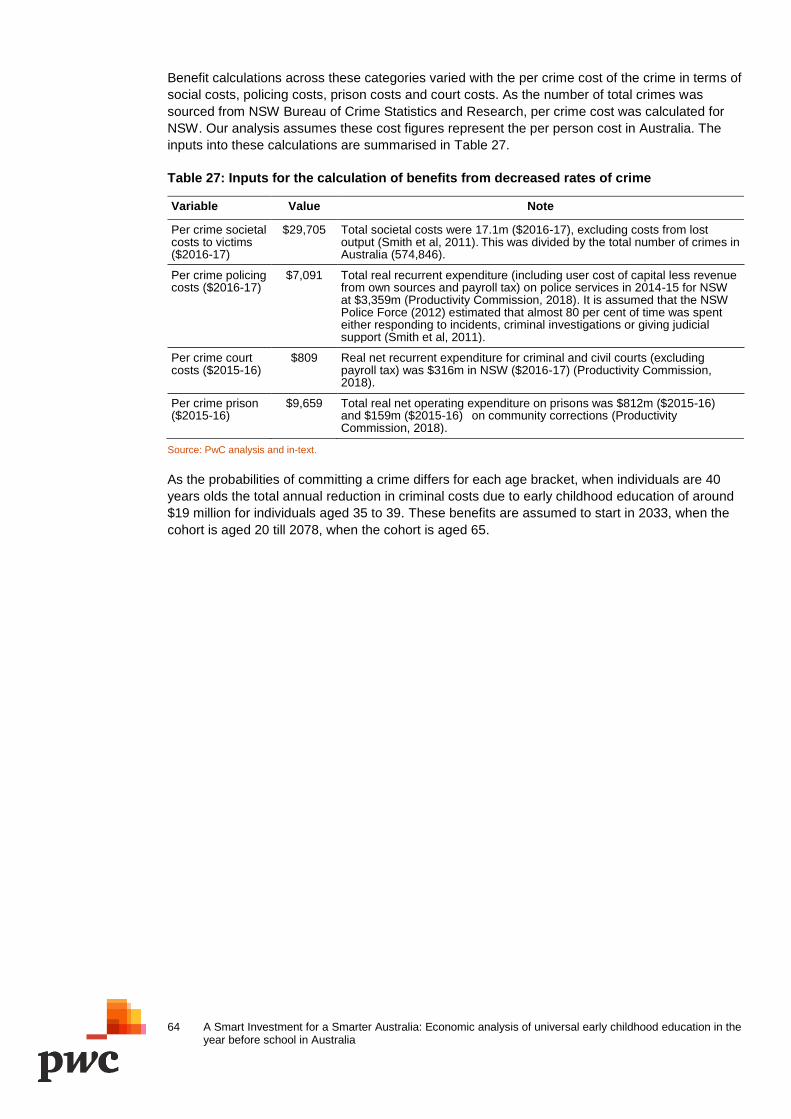
64 A Smart Investment for a Smarter Australia: Economic analysis of universal early childhood education in the year before school in Australia
Benefit calculations across these categories varied with the per crime cost of the crime in terms of
social costs, policing costs, prison costs and court costs. As the number of total crimes was
sourced from NSW Bureau of Crime Statistics and Research, per crime cost was calculated for
NSW. Our analysis assumes these cost figures represent the per person cost in Australia. The
inputs into these calculations are summarised in Table 27.
Table 27: Inputs for the calculation of benefits from decreased rates of crime
Variable Value Note
Per crime societal costs to victims ($2016-17)
$29,705 Total societal costs were 17.1m ($2016-17), excluding costs from lost output (Smith et al, 2011). This was divided by the total number of crimes in Australia (574,846).
Per crime policing costs ($2016-17)
$7,091 Total real recurrent expenditure (including user cost of capital less revenue from own sources and payroll tax) on police services in 2014-15 for NSW at $3,359m (Productivity Commission, 2018). It is assumed that the NSW Police Force (2012) estimated that almost 80 per cent of time was spent either responding to incidents, criminal investigations or giving judicial support (Smith et al, 2011).
Per crime court costs ($2015-16)
$809 Real net recurrent expenditure for criminal and civil courts (excluding payroll tax) was $316m in NSW ($2016-17) (Productivity Commission, 2018).
Per crime prison ($2015-16)
$9,659 Total real net operating expenditure on prisons was $812m ($2015-16) and $159m ($2015-16) on community corrections (Productivity Commission, 2018).
Source: PwC analysis and in-text.
As the probabilities of committing a crime differs for each age bracket, when individuals are 40
years olds the total annual reduction in criminal costs due to early childhood education of around
$19 million for individuals aged 35 to 39. These benefits are assumed to start in 2033, when the
cohort is aged 20 till 2078, when the cohort is aged 65.

www.pwc.com.au
© 2019 PricewaterhouseCoopers. All rights reserved.
PwC refers to the Australian member firm, and may sometimes refer to the PwC network.
Each member firm is a separate legal entity. Please see www.pwc.com/structure for further details.
Liability limited by a scheme approved under Professional Standards Legislation
PWC190004991


![Investment Management Industry in Australia[1]](https://img.pdfslide.net/doc/110x75/5571ff8149795991699d670b/investment-management-industry-in-australia1.jpg)