Embed Size (px)
Citation preview
A Stochastic Planning Model for Manufacturing Environments
KASHI R. BALACHANDRAN AND B ~ SRINIDHI*
Traditional models of planning for capacity have generally ignored uncertainties in timing of demand and in the time required to process each demand. Ignoring these aspects of uncertainty leads to anomalies such as the co-existence of congestion and idle time in a service center. Efficient operation of a service center balances some idle time with delays at some times when timing uncertainties are considered. Moreover, the capacity planned to satisfy the average demand becomes sub-optimal under timing uncertainties. Deterministic logic also provides no rationale under information symmetry for fixed service center charge applications.
This paper examines the impact of uncertainties in the timing of demands and service times on the managerial planning function. The paper presents a detailed application of the general queuing model and the issue of why and how fixed service center charges must be applied to users.
Section I introduces the issue of fixed charge application in a service center. Section II develops a model for the multiple class case. Section III compares the suggested fixed charge scheme to several methods of cost allocation in current use. Section IV examines the capacity planning issue and some generalizations of the model. Concluding remarks are given in section V.
I. Fixed Charge Applications in Service Centers
Service centers in firms provide several types of services to user departments. The profits z of user departments generally show a charge for the service, either as allocated service center cost or as a transfer price. This charge often includes a component which is invariant with the duration of service as documented in Govindarajan and Anthony [1983] and Fremgen and Liao [1981]. For the purposes of this study, a fixed charge is defined as the fixed component of the charge for a single service. Variable charges are charges which vary in direct proportion to the duration of service. Those charges which do not vary with the number of arrivals are not examined in this study. This practice of applying fixed charges has prompted researchers to try to find an economic rationale for it. Researchers have assumed the application of fixed charge as inevitable and developed allocation schemes which are not dysfunctional. Moriarity [1975], Louderback [1976], Jensen [1977], Kaplan and Thompson [1971], and Hamlen and Hamlen [1981] are examples of such studies. Most of these studies assume the occurrence of demand (called arrivals in this paper), as well as service durations to be deterministic.
This study seeks to explain fixed charge application as rational equilibrium behavior to mitigate the necessary delay costs due to uncertainties in arrivals and service times. A class of users is defined as those having similar characteristics. Classes are defined more formally later in the paper. Balachandran and Srinidhi [1987] show that for a single class of users of the service center who individually decide whether to use the internal service center or not, fixed charge application is necessary to optimally regulate the service center utilization. Here, it is shown that if multiple
*New York University and Rutgers University.
l Divisional profits computed after deducting the service charges are typically used in evaluating the performance of divisions and are therefore relevant to the manager of that division.
48
BALACHANDRAN AND SRU~IDHI: MANUFACTURING ENVIRONMENTS 49
classes of users demand service, non-application of fixed charge may result in sub-optimal utilization with the wrong class of users dominating the center. An appropriate fixed charge application is suggested in order to shift the dominance to a class of users who contribute the maximum benefit to the finn. The regulation is achieved through the incentive effects of the pricing mechanism. It is assumed that physical regulation is either not possible or not desirable.
H. Heterogeneous User Classes
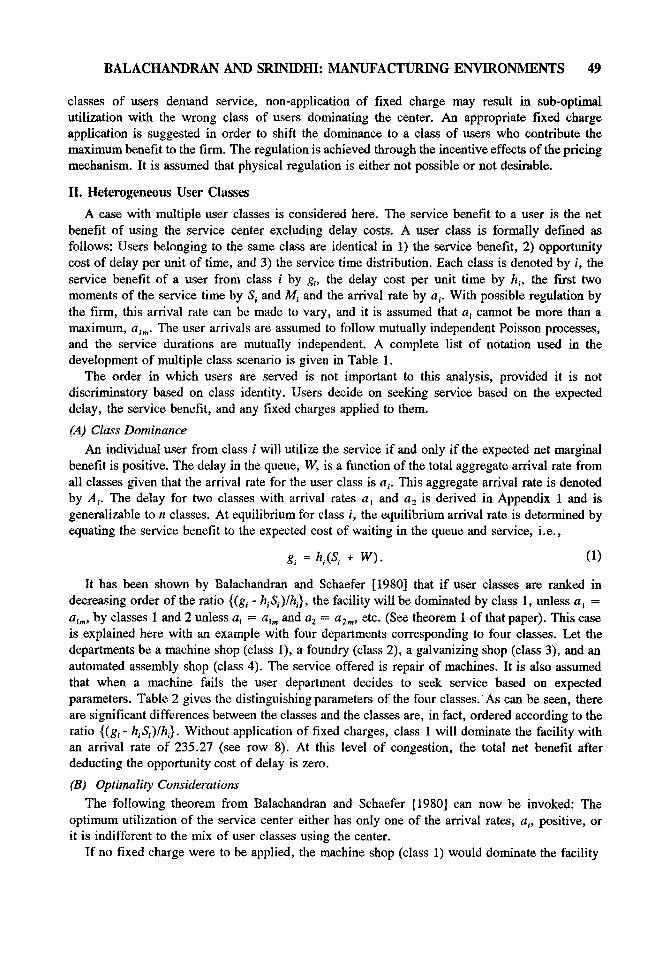
A case with multiple user classes is considered here. The service benefit to a user is the net benefit of using the service center excluding delay costs. A user class is formally defined as follows: Users belonging to the same class are identical in 1) the service benefit, 2) opportunity cost of delay per unit of time, and 3) the service time distribution. Each class is denoted by i, the service benefit of a user from class i by g, the delay cost per unit time by h , the first two moments of the service time by S i and M~ and the arrival rate by a i. With possible regulation by the firm, this arrival rate can be made to vary, and it is assumed that a i cannot be more than a maximum, aim. The user arrivals are assumed to follow mutually independent Poisson processes, and the service durations are mutually independent. A complete list of notation used in the development of multiple class scenario is given in Table 1.
The order in which users are served is not important to this analysis, provided it is not discriminatory based on class identity. Users decide on seeking service based on the expected delay, the service benefit, and any fixed charges applied to them.
(A) Class Dominance An individual user from class i will utilize the service if and only if the expected net marginal
benefit is positive. The delay in the queue, W, is a function of the total aggregate arrival rate from all classes given that the arrival rate for the user class is ai. This aggregate arrival rate is denoted by A~. The delay for two classes with arrival rates a I and a 2 is derived in Appendix 1 and is generalizable to n classes. At equilibrium for class i, the equilibrium arrival rate is determined by equating the service benefit to the expected cost of waiting in the queue and service, i.e.,
g, = h,(S~ + W). (1)
It has been shown by Balachandran and Schaefer [1980] that if user classes are ranked in decreasing order of the ratio {(gl "h~Si)lhi}, the facility will be dominated by class 1, unless a t = al,,, by classes 1 and 2 unless a~ = a~,~ and a 2 = a2,,, etc. (See theorem 1 of that paper). This case is explained here with an example with four departments corresponding to four classes. Let the departments be a machine shop (class 1), a foundry (class 2), a galvanizing shop (class 3), and an automated assembly shop (class 4). The service offered is repair of machines. It is also assumed that when a machine fails the user department decides to seek service based on expected parameters. Table 2 gives the distinguishing parameters of the four classes. A s can be seen, there are significant differences between the classes and the classes are, in fact, ordered according to the ratio {(gi- hiSi)/hi}. Without application of fixed charges, class 1 will dominate the facility with an arrival rate of 235.27 (see row 8). At this level of congestion, the total net benefit after deducting the opportunity cost of delay is zero.
(B) Optimality Considerations The following theorem from Balachandran and Schaefer [1980] can now be invoked: The
optimum utilization of the service center either has only one of the arrival rates, a~, positive, or it is indifferent to the mix of user classes using the center.
If no fixed charge were to be applied, the machine shop (class 1) would dominate the facility
50 AEJ: MARCH 1992, VOL. 20, NO. 1
TABLE 1
Notation Used in the Multiple Class Case
Symbol Description
i s~ M, gi hi ai Al
aim W~orW
F
f
Subscript e Subscript * Subscript other than e and * ' a n d "
Refers to class i. Often used as subscript. Expected service time for a class i user. Second moment of service time for a class i user. Service benefit from service for a class i user. Opportunity cost of delay/unit of time for a class i user. Arrival rate of users from class i. Aggregate arrival rate from all classes given that the arrival rate for class i is a i. Maximum arrival rate for class i users. Expected waiting time till the beginning of service for any class given that the arrival rates for classes i are a i. Expected total net benefit; also the total expected applied fixed charge under optimum. Applied fixed charge per usage. Sometimes used with a subscript denoting the point on the figure. For example, f~ is the applied fixed charge at the point N in the figure. Denotes equilibrium. Denotes optimum.
Denotes partial derivative. Denote first and second derivative, respectively.
TABLE 2
Example with Four Classesa-Parameters and Results
Class Class Class Class No. Description 1 2 3 4
1 Service benefit (g~) $30 $60 $75 $60
2 Expected service time 48 48 48 48 (S~ in minutes)
3 Cost of delay (hl) per month $15 $35 $45 $40 (per minute) (.00125) (.00292) (.00375) (.00333)
BALACHANDRAN AND SRINIDHI: MANUFACTURING ENVIRONMENTS 51
TABLE 2 (CONT.)
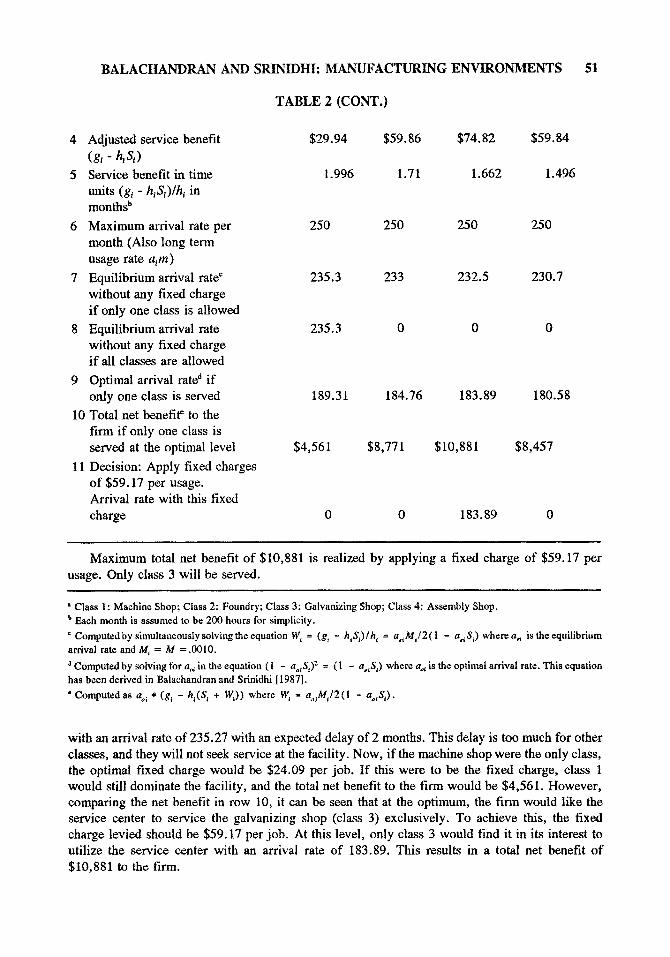
4 Adjusted service benefit $29.94 $59.86 $74.82 $59.84 (g , - h,S,)
5 Service benefit in time 1.996 1.71 1.662 1.496 units (gl - htSi)/h~ in months b
6 Maximum arrival rate per 250 250 250 250 month (Also long term usage rate aim )
7 Equilibrium arrival rate ¢ 235.3 233 232.5 230.7 without any fixed charge if only one class is allowed
8 Equilibrium arrival rate 235.3 0 0 0 without any fixed charge if all classes are allowed
9 Optimal arrival rate d if only one class is served 189.31 184.76 183.89 180.58
10 Total net benefit* to the finn if only one class is served at the optimal level $4,561 $8,771 $10,881 $8,457
11 Decision: Apply fixed charges of $59.17 per usage. Arrival rate with this fixed charge 0 0 183.89 0
Maximum total net benefit of $10,881 is realized by applying a fixed charge of $59.17 per usage. Only class 3 will be served.
" Class 1: Machine Shop; Class 2: Foundry; Class 3: Galvanizing Shop; Class 4: Assembly Shop. b Each month is assumed to be 200 hours for simplicity.
Computed by simultaneously solving the equation W~ = (g~ - hiss) / h i = a,~M~/2 ( 1 - ae~ S~) where a m is the equilibrium
arrival rate and M~ = M = .0010.
a Computed by solving for ao~ in the equation ( t - ao~Si)2 = (1 - a iS~) where ao~ is the optimal arrival rate. This equation has been derived in Balachandran and Srinidhi [1987].
° Computedas ao~ * (g, - h,(S~ + W~)) where W~ ffi ao~MJ2(I - ao,S~).
with an arrival rate of 235.27 with an expected delay of 2 months. This delay is too much for other classes, and they will not seek service at the facility. Now, if the machine shop were the only class, the optimal fixed charge would be $24.09 per job. If this were to be the fixed charge, class 1 would still dominate the facility, and the total net benefit to the firm would be $4,561. However, comparing the net benefit in row 10, it can be seen that at the optimum, the firm would like the service center to service the galvanizing shop (class 3) exclusively. To achieve this, the fixed charge levied should be $59.17 per job. At this level, only class 3 would find it in its interest to utilize the service center with an arrival rate of 183.89. This results in a total net benefit of $10,881 to the firm.
52 AEJ: MARCH 1992, VOL. 20, NO. 1
I~ . Comparison to other Methods
(A) Nature of FCS The nature of the fixed charges scheme (FCS) is examined at both the planning and the control
stages. At the planning stage, the FCS is based on parameters communicated by the users or on past documented data. For the scheme to be effective, the parameters need to be truthfully communicated. To ensure this, two types of possible misrepresentations need to be prevented: 1) a non-optimal class could pretend to possess the characteristics of the optimal class and 2) the optimal class would find it beneficial to misrepresent its parameters. The first type of misrepresentation is clearly not in the interest of the non-optimal class. For example, let class 1 in Table 2 pretend that it possesses the characteristics of class 3. This would still result in a charge of $59.17 per usage, and therefore, class 1 will not use the service center or get any other benefit. The second type of misrepresentation by the optimal class can lead to penalties from an ex post verification of actual usage. For example, if class 3 under-reports g, the fixed charge will be less and utilization of the service center will be, on the average, more than 183.89. A consistent over- utilization will signal to the headquarters that the parameters were not properly reported. Users of class 3 themselves will not get any additional benefit from such misrepresentation, and therefore, any small penalty for consistent over-utilization or under-utilization will have an effect of deterring this type of misrepresentation.
At the control stage, i.e., when a user requires the service, the question of misrepresentation by any individual user does not arise because the same fixed charge is applied to every user. This system is preferable to physical control because a physical system is not self-enforcing, is costly, and there could be misrepresentations at the control stage in case of physical verification. Moreover, it may not be organizationally wise to physically turn back an internal user who seeks service.
An important aspect of the cases presented here is the resulting specialization of the service center. In this scenario, even without fixed charge application, specialization will result. Therefore, this is particular to the scenario and not to FCS.
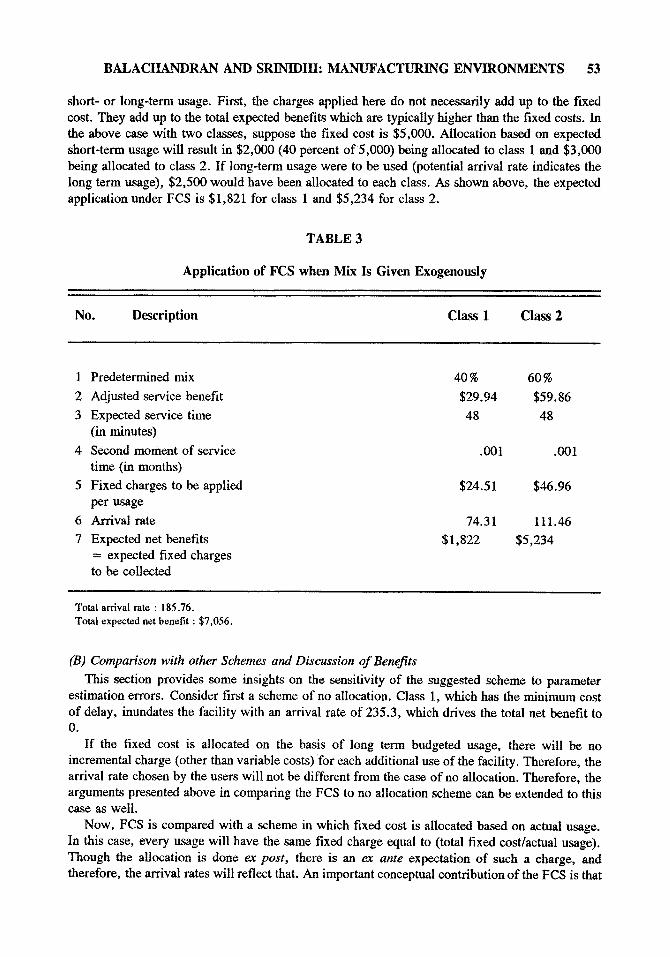
Now, a situation can be considered in which multiple classes have to be served because of non- economic considerations. For this discussion, consider the first two classes of the example presented earlier. The non-economic requirement could be that on the average, 40 percent of class 1 and 60 percent of class 2 need to be served (these could be the short-term usage rates as agreed upon in the budget). The derivations of the formulas for optimal waiting time and optimal fixed charges are given in Appendix 1. In this case, it is necessary to identify the class of every user by the service center for ex post verification of whether the actual usage corresponds to the planned usage. Yet, physical regulation is not feasible since the service center cannot determine which specific user demands from class 1 should be turned back without service. A regulating price mechanism is still more practical. Table 3 shows that this would require fixed charges per usage of $24.52 for class 1 and $46.96 for class 2. In other words, according to FCS, the transfer price for the use of the service center is ($24.52 + variable cost per hour times actual service time) for class 1 and ($46.96 + variable cost per hour times actual service time) for class 2. This results in total expected fixed charges of $1,822 for class 1 and $5,234 for class 2. The applied fixed charges also represent the net benefit from service center usage. Therefore, the benefit to the firm from the usage of the service center is $7,056. Note that this is less than the benefit from specialization in class 2, which is $8,771 (from Table 2). The difference between the specialization net benefit and the expected net benefit from exogenous rule represents one of the costs of the rule. The other costs include the cost of monitoring the classes for usage which was unnecessary in case of specialization.
This fixed charge application is clearly different from the allocation of fixed costs based on
BALACHANDRAN AND SRINIDHI: MANUFACTURING ENVIRONMENTS 53
short- or long-term usage. First, the charges applied here do not necessarily add up to the fixed cost. They add up to the total expected benefits which are typically higher than the fixed costs. In the above case with two classes, suppose the fixed cost is $5,000. Allocation based on expected short-term usage will result in $2,000 (40 percent of 5,000) being allocated to class 1 and $3,000 being allocated to class 2. If long-term usage were to be used (potential arrival rate indicates the long term usage), $2,500 would have been allocated to each class. As shown above, the expected application under FCS is $1,821 for class 1 and $5,234 for class 2.
T A B L E 3
Application of FCS when Mix Is Given Exogenously
No. Description Class 1 Class 2
1 Predetermined mix 40 % 60%
2 Adjusted service benefit $29.94 $59.86
3 Expected service time 48 48 (in minutes)
4 Second moment of service .001 .001 time (in months)
5 Fixed charges to be applied $24.51 $46.96 per usage
6 Arrival rate 74.31 111.46
7 Expected net benefits $1,822 $5,234 = expected fixed charges to be collected
Total arrival rate : 185.76. Total expected net benefit : $7,056.
(13) Comparison with other Schemes and Discussion of Benefits This section provides some insights on the sensitivity of the suggested scheme to parameter
estimation errors. Consider first a scheme of no allocation. Class 1, which has the minimum cost of delay, inundates the facility with an arrival rate of 235.3, which drives the total net benefit to 0.
If the fixed cost is allocated on the basis of long term budgeted usage, there will be no incremental charge (other than variable costs) for each additional use of the facility. Therefore, the arrival rate chosen by the users will not be different from the case of no allocation. Therefore, the arguments presented above in comparing the FCS to no allocation scheme can be extended to this case as well.
Now, FCS is compared with a scheme in which fixed cost is allocated based on actual usage. In this case, every usage will have the same fixed charge equal to (total fixed cost/actual usage). Though the allocation is done ex post, there is an ex ante expectation of such a charge, and therefore, the arrival rates will reflect that. An important conceptual contribution of the FCS is that
54 AEJ: MARCH 1992, VOL. 20, NO. 1
it considers the reaction of the users to fixed charges. Equilibrium will be achieved such that if an arrival rate is decided upon in anticipation of such an allocation scheme, it should satisfy the following condition:
gi - h~(S~ + W) = (total fixed cost) / a~ for a i > 0.
This will be satisfied for only one class, and the other classes will simply choose not to use the facility.
In the example presented in Table 2, assume that the fixed cost to be allocated is $8,000. For any given set of class parameters, this leads to a simultaneous determination of arrival rates by the users and their expectation of what the per-usage fixed cost allocation will be. For the values of parameters specified in Table 2, FCS will result in only class 3 using the facility with a usage rate of 183.89 and an expected charge of $59.17 per usage. However, if the cost to be allocated is constrained to be $8,000 and equal per-usage allocation is followed, class 3 will still dominate the facility but with a usage rate of 217.67 and an expected charge of $36.76 per usage. The expected incremental benefit of using FCS over the usage based allocation scheme is $2,881, which amounts to about 36 percent of the overall benefit when usage based scheme is employed. The usage rates, the amount of incremental benefit and even the class using the facility change when the parameters are changed.
A sensitivity analysis was conducted to study the impact of changes in the service benefit, g, the delay cost per unit time, h, expected service time, S, and second moment, M, on the incremental benefit of using FCS. The incremental benefit is very sensitive to changes in service benefit, g. An increase in g of 35.7 percent increases incremental benefits by as much as 235.79 percent. On the other hand, the incremental benefits are not that sensitive to changes in h, S, and M. In the case of h and S, the magnitude of percentage change in net benefit is about the same as the magnitude of percentage change in the parameters. Interestingly, the net benefit is even less sensitive to the second moment M. Therefore, it can be concluded that the incremental value of FCS vis-a-vis fixed cost allocation based on actual usage increases sharply when the service benefits become higher. Correspondingly, the uncertainty in the estimated benefits of FCS increase if there are errors in the estimation of g. In order to decide on whether to deviate from the optimal policy for non-economic reasons (such as a desire to serve multiple classes), the cost of such deviation should be known. This sensitivity analysis helps in determining the parameters which have to be estimated more accurately for a proper determination of this cost.
Sensitivity analysis of FCS when the mix is exogenously specified was conducted using the example of two classes given in Table 3. One parameter was changed at a time, keeping the others at default values. It can be shown that the net benefit from FCS (compared to no allocation) is robust to small changes in the mix but is highly sensitive to changes in service benefit, g. As in the case where the mix is not exogenously specified, the net benefit is not very sensitive to changes in opportunity costs, h, or expected service time, S, or to second moment of service time distribution, M. This reinforces the results from the previous analysis that accurate estimation of service benefit is crucial to the quantification of benefits from FCS.
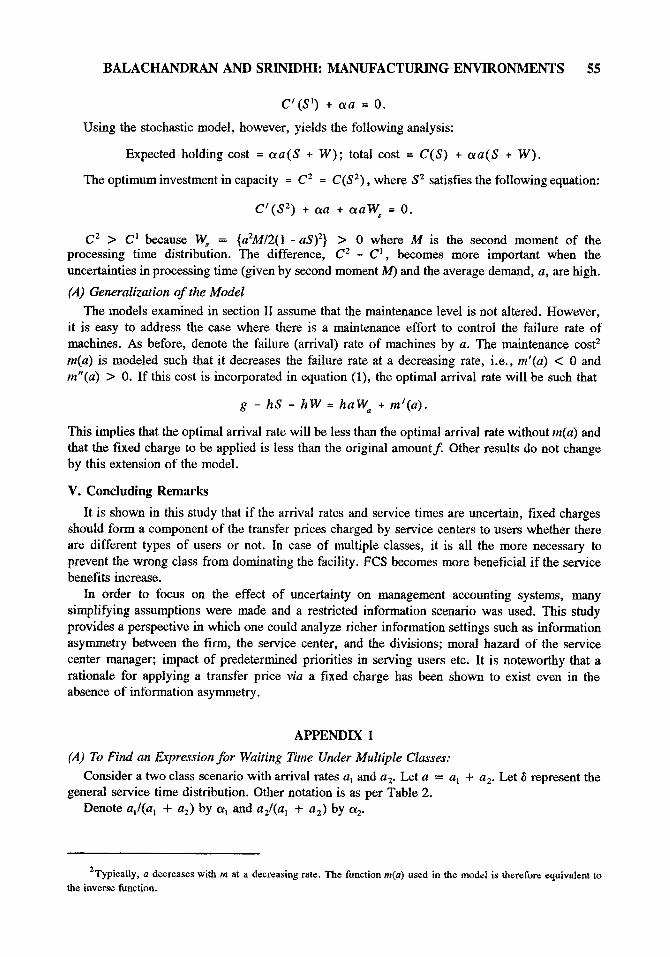
IV. Capacity Planning
A simple analysis is given here to highlight the importance of using the stochastic model. Consider a production center which processes one class of products. Let the cost of setting up the production center be C(S), such that C'(S) < 0 and C"(S) < O. Let the average annual demand for the product be a and the holding cost per unit be ct. Under deterministic logic, expected holding cost = eraS; total cost = C(S) + eraS. Minimizing the total cost, the optimal investment in capacity is C I .-- C(S 1) where S I satisfies the following equation:
BALACHANDRAN AND SRINIDHI: MANUFACTURING ENVIRONMENTS 55
C/ (S l) + cla = O.
Using the stochastic model, however, yields the following analysis:
Expected holding cost = cxa(S + W); total cost = C ( S ) + o ta(S + W ) .
The optimum investment in capacity = C z = C($2) , where S 2 satisfies the following equation:
C / ( S z) + cxa + e t a W = O.
C 2 > C I because IV, = {a2MI2( l - aS) z} > 0 where M is the second moment of the processing time distribution. The difference, C z - C 1 , becomes more important when the uncertainties in processing time (given by second moment M) and the average demand, a, are high.
(A) Generalization o f the Model
The models examined in section II assume that the maintenance level is not altered. However, it is easy to address the case where there is a maintenance effort to control the failure rate of machines. As before, denote the failure (arrival) rate of machines by a. The maintenance cost 2 re(a) is modeled such that it decreases the failure rate at a decreasing rate, i.e., m'(a) < 0 and
m"(a) > 0. If this cost is incorporated in equation (1), the optimal arrival rate will be such that
g - h S - h W = h a W a + m / ( a ) .
This implies that the optimal arrival rate will be less than the optimal arrival rate without m(a) and that the fixed charge to be applied is less than the original amount f Other results do not change by this extension of the model.
V. Concluding Remarks
It is shown in this study that if the arrival rates and service times are uncertain, fixed charges should form a component of the transfer prices charged by service centers to users whether there are different types of users or not. In case of multiple classes, it is all the more necessary to prevent the wrong class from dominating the facility. FCS becomes more beneficial if the service benefits increase.
In order to focus on the effect of uncertainty on management accounting systems, many simplifying assumptions were made and a restricted information scenario was used. This study provides a perspective in which one could analyze richer information settings such as information asymmetry between the firm, the service center, and the divisions; moral hazard of the service center manager; impact of predetermined priorities in serving users etc. It is noteworthy that a rationale for applying a transfer price via a fixed charge has been shown to exist even in the absence of information asymmetry.
APPENDIX 1
(A) To Find an Expression f o r Waiting Time Under Mult iple Classes:
Consider a two class scenario with arrival rates a I and a z, Let a = al + a:. Let ~ represent the general service time distribution. Other notation is as per Table 2.
Denote al/(a n + az) by cx~ and a J ( a I + az) by ot 2.
ZTypically, a decreases with m at a decreasing rate. The function re(a) used in the model is therefore equivalent to the inverse function.
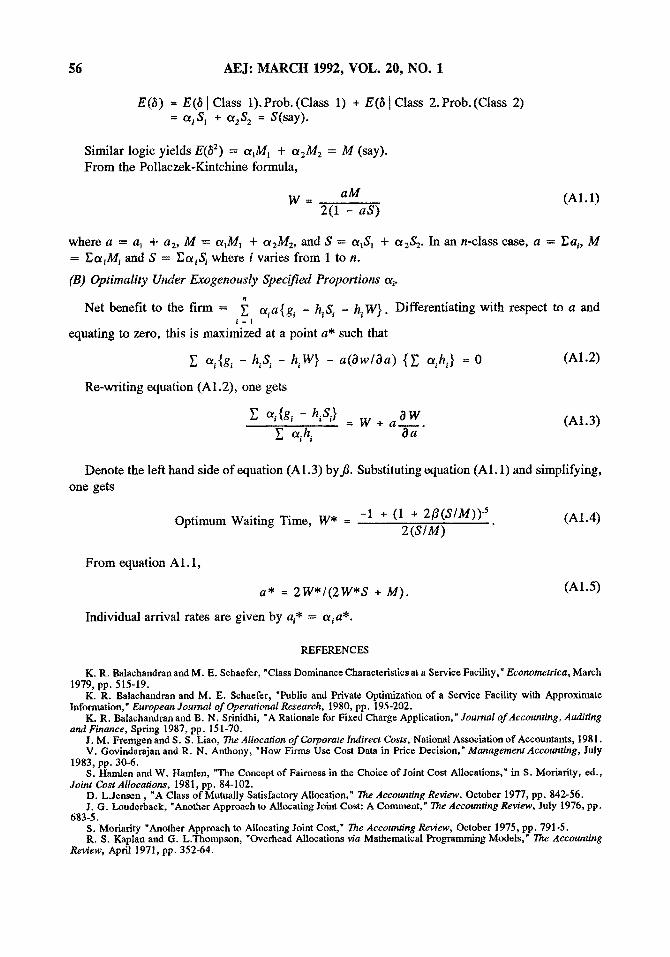
56 AEJ: ~L~RCH 1992, VOL. 20, NO. 1
E(8) = EOI Class 1).Prob.(Class 1) + E(~I Class 2.Prob.(Class 2) = eelS l + % S 2 = S(say).
Similar logic yields E(b 2) = a i M 1 + a2M2 = M (say). F rom the Pollaczek-Kintchine formula,
W - a M (A1.1) 2(1 - a S )
where a = al + a2, M = t~lMl + ot2M2, and S = oqSl + ct2S2. In an n-class case, a = ~a~, M = ~txiM~ and S = EcqS~ where i varies from 1 to n.
(B) Optimality Under Exogenously Specified Proportions a i.
Net benefit to the f inn = ~ ct, a{g~ - h~S~ - h , W } . Differentiating with respect to a and t = 1
equating to zero, this is maximized at a point a* such that
~] ot,{g, - h~S~ - h ,W} - a ( 3 w l O a ) { ~ ath,} =- 0 (A1.2)
Re-writing equation (A1.2), one gets
E ~ , { g , - h ,S ,} = W + a O W . . . . . (A1.3) ot~h~ O a
Denote the left hand side of equation (AI. 3) byfl . Substituting equation (A1.1) and simplifying,
one gets
Optimum Waiting Time, W* = -1 + (1 + 213(S/M)) "~ (A1.4) 2 ( S / M )
From equation A1.1,
a * = 2 W * / ( 2 W * S + M ) .
Individual arrival rates are given by at* = aia*.
(A1.5)
REFERENCES
K. R. Balachandran and M. E. Schaefer, "Class Dominance Characteristics at a Service Facility," Econometrica, March 1979, pp. 515-19.
K. R. Balachandran and M. E. Schaefer, "Public and Private Optimization of a Service Facility with Approximate Information," European Journal of Operational Research, 1980, pp. 195-202.
K. R. Balachandran and B. N. Srinidhi, "A Rationale for Fixed Charge Application," Journal of Accounting, Auditing and Finance, Spring 1987, pp. 151-70.
J. M. Fremgen and S. S. Liao, The Allocation of Corporate Indirect Costs, National Association of Accountants, 1981. V. Govindarajan and R. N. Anthony, "How Firms Use Cost Data in Price Decision," Management Accounting, July
1983, pp. 30-6. S. Hamlen and W. Hamlen, "The Concept of Fairness in the Choice of Joint Cost Allocations," in S. Moriarity, ed.,
Joint Cost Allocations, 1981, pp. 84-102. D. L.Jensen, "A Class of Mutually Satisfactory Allocation," The Accounting Review, October 1977, pp. 842-56. J. G. Louderback, "Another Approach to Allocating Joint Cost: A Comment," The Accounting Review, July 1976, pp.
683-5. S. Moriarity "Another Approach to Allocating Joint Cost," The Accounting Review, October 1975, pp. 791-5. R. S. Kaplan and G. L.Thompson, "Overhead Allocations via Malhematical Programming Models," The Accounting
Review, April 1971, pp. 352-64.


![Advanced Engineering Environments for Small Manufacturing ... · (computer-aided manufacturing [CAM]), project management tools, data repositories (prod-uct data management [PDM],](https://img.pdfslide.net/doc/110x75/5e5b0127a652ea4bb255a728/advanced-engineering-environments-for-small-manufacturing-computer-aided-manufacturing.jpg)