Embed Size (px)
Citation preview
A Study of the Flipped Math Classroom in
the Elementary Grades
March 2014 Debra Ingram, Ph.D. Bethann Wiley Christina Miller Terry Wyberg, Ph.D.
Center for Applied Research and Educational Improvement University of Minnesota
Acknowledgements The authors would like to express their gratitude to the superintendent and the technology staff of the Stillwater Area Public Schools for inviting them to conduct this study and actively supporting the data collection process in the classrooms. We would like to thank the principals and teachers who warmly welcomed us to observe math instruction in their classrooms and helped administer the student survey. We also want to thank the students who completed the survey and the students who participated in small group discussions. Finally, we greatly appreciated the support of the district technology staff who helped us design the study and the data collection instruments. How to Cite this Report Ingram, D., Wiley, B., Miller, C. & Wyberg, T. (2014). A Study of the Flipped Math Classroom in the Elementary Grades. Saint Paul, MN: University of Minnesota, College of Education and Human Development, Center for Applied Research and Educational Improvement. Contact Information Center for Applied Research and Educational Improvement College of Education and Human Development University of Minnesota 1954 Buford Avenue, Suite 425 Saint Paul, MN 55108 USA Telephone: (612) 624-0300 Email: [email protected]
Center for Applied Research and Educational Improvement i University of Minnesota – March 2014
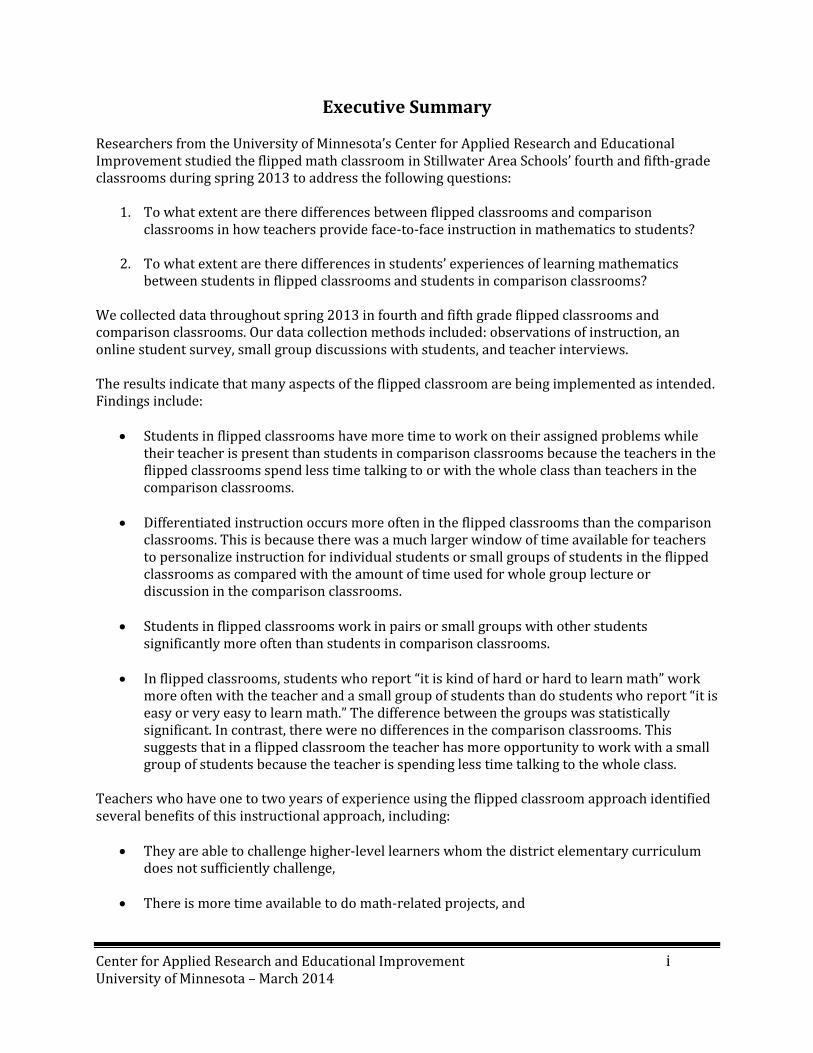
Executive Summary Researchers from the University of Minnesota’s Center for Applied Research and Educational Improvement studied the flipped math classroom in Stillwater Area Schools’ fourth and fifth-grade classrooms during spring 2013 to address the following questions:
1. To what extent are there differences between flipped classrooms and comparison classrooms in how teachers provide face-to-face instruction in mathematics to students?
2. To what extent are there differences in students’ experiences of learning mathematics
between students in flipped classrooms and students in comparison classrooms? We collected data throughout spring 2013 in fourth and fifth grade flipped classrooms and comparison classrooms. Our data collection methods included: observations of instruction, an online student survey, small group discussions with students, and teacher interviews. The results indicate that many aspects of the flipped classroom are being implemented as intended. Findings include:
Students in flipped classrooms have more time to work on their assigned problems while their teacher is present than students in comparison classrooms because the teachers in the flipped classrooms spend less time talking to or with the whole class than teachers in the comparison classrooms.
Differentiated instruction occurs more often in the flipped classrooms than the comparison
classrooms. This is because there was a much larger window of time available for teachers to personalize instruction for individual students or small groups of students in the flipped classrooms as compared with the amount of time used for whole group lecture or discussion in the comparison classrooms.
Students in flipped classrooms work in pairs or small groups with other students
significantly more often than students in comparison classrooms.
In flipped classrooms, students who report “it is kind of hard or hard to learn math” work more often with the teacher and a small group of students than do students who report “it is easy or very easy to learn math.” The difference between the groups was statistically significant. In contrast, there were no differences in the comparison classrooms. This suggests that in a flipped classroom the teacher has more opportunity to work with a small group of students because the teacher is spending less time talking to the whole class.
Teachers who have one to two years of experience using the flipped classroom approach identified several benefits of this instructional approach, including:
They are able to challenge higher-level learners whom the district elementary curriculum does not sufficiently challenge,
There is more time available to do math-related projects, and
Center for Applied Research and Educational Improvement ii University of Minnesota – March 2014
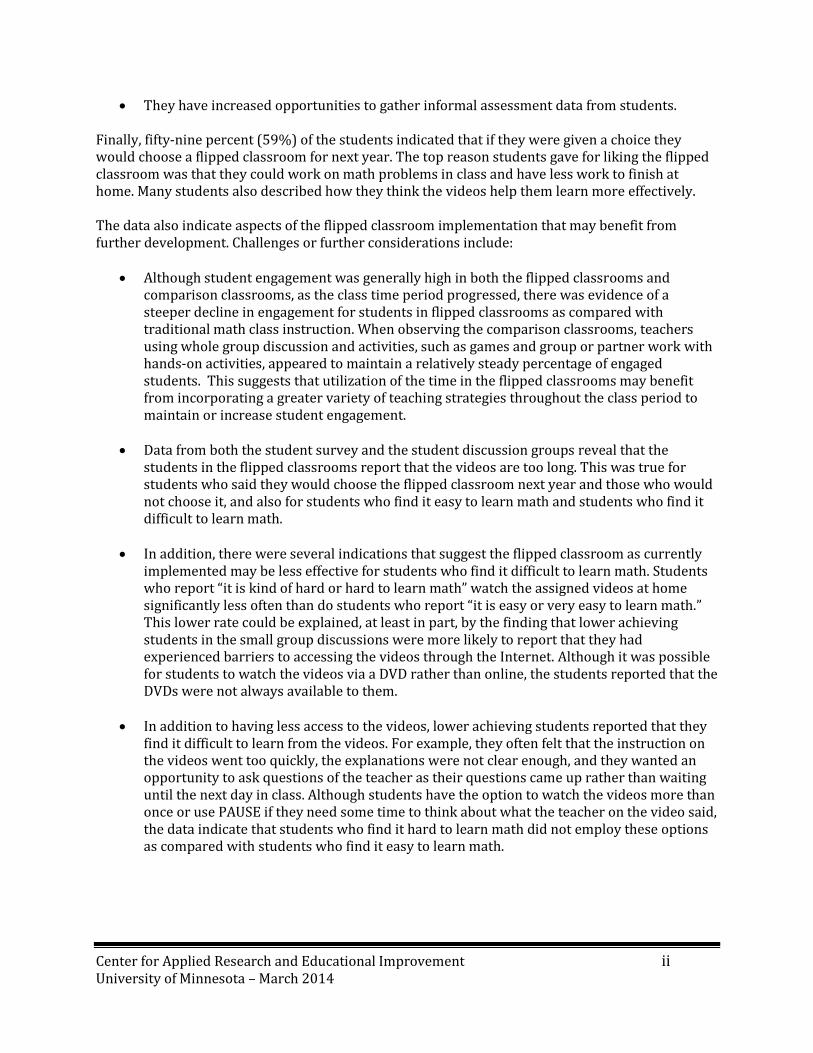
They have increased opportunities to gather informal assessment data from students. Finally, fifty-nine percent (59%) of the students indicated that if they were given a choice they would choose a flipped classroom for next year. The top reason students gave for liking the flipped classroom was that they could work on math problems in class and have less work to finish at home. Many students also described how they think the videos help them learn more effectively. The data also indicate aspects of the flipped classroom implementation that may benefit from further development. Challenges or further considerations include:
Although student engagement was generally high in both the flipped classrooms and comparison classrooms, as the class time period progressed, there was evidence of a steeper decline in engagement for students in flipped classrooms as compared with traditional math class instruction. When observing the comparison classrooms, teachers using whole group discussion and activities, such as games and group or partner work with hands-on activities, appeared to maintain a relatively steady percentage of engaged students. This suggests that utilization of the time in the flipped classrooms may benefit from incorporating a greater variety of teaching strategies throughout the class period to maintain or increase student engagement.
Data from both the student survey and the student discussion groups reveal that the
students in the flipped classrooms report that the videos are too long. This was true for students who said they would choose the flipped classroom next year and those who would not choose it, and also for students who find it easy to learn math and students who find it difficult to learn math.
In addition, there were several indications that suggest the flipped classroom as currently
implemented may be less effective for students who find it difficult to learn math. Students who report “it is kind of hard or hard to learn math” watch the assigned videos at home significantly less often than do students who report “it is easy or very easy to learn math.” This lower rate could be explained, at least in part, by the finding that lower achieving students in the small group discussions were more likely to report that they had experienced barriers to accessing the videos through the Internet. Although it was possible for students to watch the videos via a DVD rather than online, the students reported that the DVDs were not always available to them.
In addition to having less access to the videos, lower achieving students reported that they
find it difficult to learn from the videos. For example, they often felt that the instruction on the videos went too quickly, the explanations were not clear enough, and they wanted an opportunity to ask questions of the teacher as their questions came up rather than waiting until the next day in class. Although students have the option to watch the videos more than once or use PAUSE if they need some time to think about what the teacher on the video said, the data indicate that students who find it hard to learn math did not employ these options as compared with students who find it easy to learn math.
Center for Applied Research and Educational Improvement iii University of Minnesota – March 2014
Table of Contents
Introduction ................................................................................................................................................................ 1 Results ........................................................................................................................................................................... 2 Discussion ................................................................................................................................................................. 21
Center for Applied Research and Educational Improvement iv University of Minnesota – March 2014
List of Tables Table 1: Three Approaches to the Flipped Mathematics Classroom ................................................... 3 Table 2: How Students Watch the Videos ....................................................................................................... 4 Table 3: Student Engagement Levels ............................................................................................................... 9 Table 4: Small Group Activity ........................................................................................................................... 12 Table 5: Getting Help and Finishing Assignments ................................................................................... 13 Table 6: Student Satisfaction with Flipped Instruction ......................................................................... 15 Table 7: Small Group Activity by Ease of Learning Math ...................................................................... 18 Table 8: Getting Help and Finishing Assignments by Ease of Learning Math .............................. 19 Table 9: How Students Watch Videos by Ease of Learning Math ...................................................... 20
List of Figures Figure 1: Instructional Activities in Flipped Classrooms and Comparison Classrooms ............. 8 Figure 2: Student Engagement Levels in Flipped Classrooms and Comparison Classrooms 10
Center for Applied Research and Educational Improvement 1 University of Minnesota – March 2014
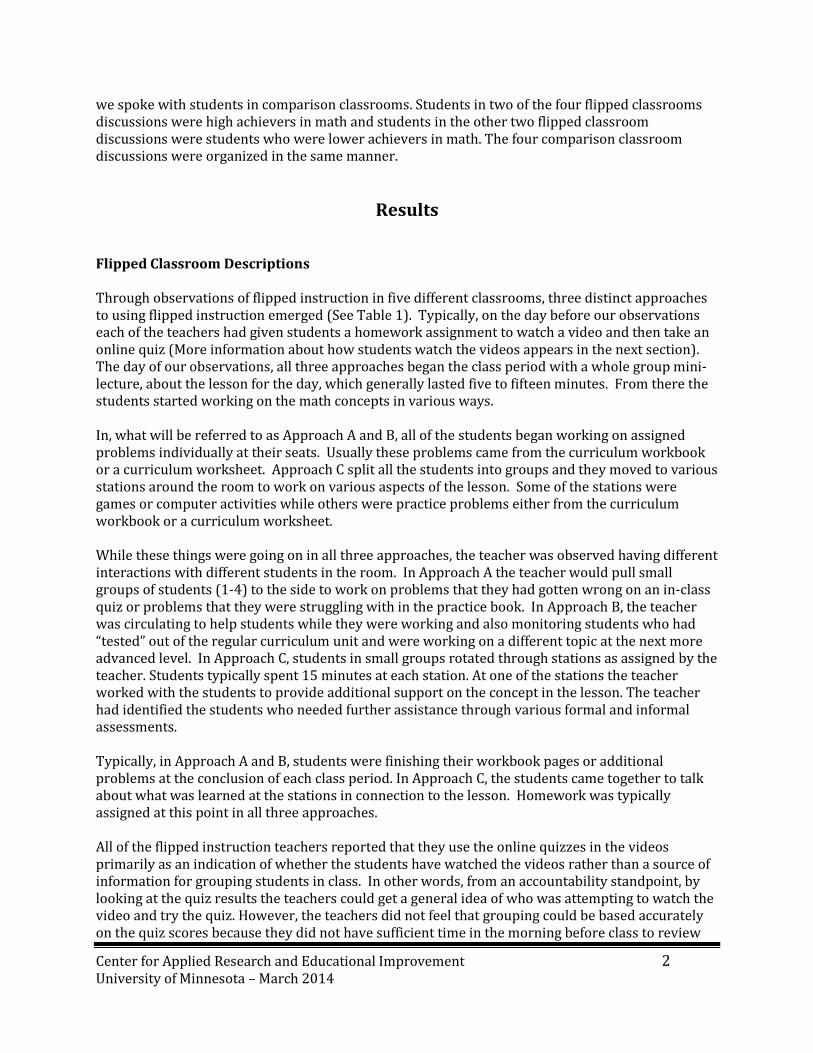
Introduction In the fall of 2011, the Stillwater Area Public Schools conducted a pilot test of flipped math instruction in six fifth-grade classrooms in five different schools. The six teachers worked collaboratively with each other and with the district technology staff to develop videos and online quizzes for the fifth grade math curriculum. The team met regularly throughout the fall to share what they were learning as they implemented this new approach to math instruction and address any unexpected issues that came up. The pilot grew out of discussions between district technology staff and classroom teachers who wanted to explore how they could employ technology to improve mathematics instruction. The aim of flipped instruction in math is to decrease the amount of time that a teacher needs to lecture and increase the amount of class time available for students to work on the assigned math problems while the teacher is present and available to assist them. By reducing the proportion of the class period needed for lecture, the teachers can personalize instruction for students. Based on positive results from the initial pilot test, the district expanded the pilot in the spring of 2012 to include 80% of the fifth grade classrooms, plus some fourth and sixth grade classrooms. By the end of the 2011-2012 school-year, the fifth grade teachers in the pilot had created a video for every lesson in the curriculum. The district offered a summer institute on the flipped math classroom in June 2012, for teachers who were interested in using flipped instruction in math and ten teachers attended. By the fall of 2012, teachers in many of the district’s fourth, fifth, and sixth-grade classrooms were implementing flipped instruction in math. In the spring of 2012 the district contacted researchers at the University of Minnesota’s Center for Applied Research and Educational Improvement (CAREI) and invited them to study instruction in the flipped classrooms during the 2012-2013 school year. CAREI accepted the invitation and offered to fund the study. We began to work with district technology staff in the summer of 2012 to design the study and develop data collection tools. The purpose of the study was to address the following questions:
1. To what extent are there differences between flipped classrooms and comparison classrooms in how teachers provide face-to-face instruction in mathematics to students?
2. To what extent are there differences in students’ experiences of learning mathematics
between students in flipped classrooms and students in comparison classrooms? To address these questions we collected data throughout spring 2013 in fourth and fifth grade flipped classrooms and comparison classrooms. Our data collection methods included: observations of instruction, an online student survey, small group discussions with students, and teacher interviews. We observed instruction in five flipped classrooms and three comparison classrooms, visiting each classroom on three separate days. We briefly interviewed the teachers after each observation and conducted a longer interview with them after the three observations were complete in their classroom. The online survey was administered to students in all of the district’s fourth and fifth grade classrooms. We held small group discussions with eight groups of students. In four of the discussions we talked with students in flipped classrooms and in four of the discussions
Center for Applied Research and Educational Improvement 2 University of Minnesota – March 2014
we spoke with students in comparison classrooms. Students in two of the four flipped classrooms discussions were high achievers in math and students in the other two flipped classroom discussions were students who were lower achievers in math. The four comparison classroom discussions were organized in the same manner.
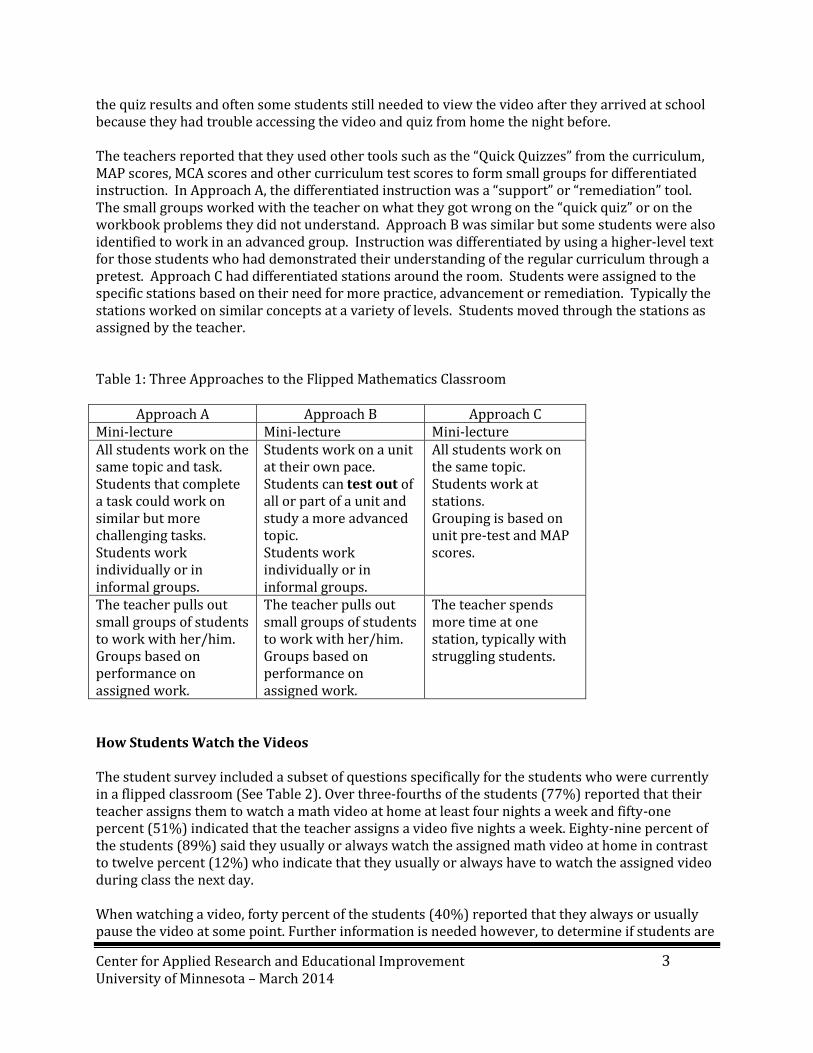
Results Flipped Classroom Descriptions Through observations of flipped instruction in five different classrooms, three distinct approaches to using flipped instruction emerged (See Table 1). Typically, on the day before our observations each of the teachers had given students a homework assignment to watch a video and then take an online quiz (More information about how students watch the videos appears in the next section). The day of our observations, all three approaches began the class period with a whole group mini-lecture, about the lesson for the day, which generally lasted five to fifteen minutes. From there the students started working on the math concepts in various ways. In, what will be referred to as Approach A and B, all of the students began working on assigned problems individually at their seats. Usually these problems came from the curriculum workbook or a curriculum worksheet. Approach C split all the students into groups and they moved to various stations around the room to work on various aspects of the lesson. Some of the stations were games or computer activities while others were practice problems either from the curriculum workbook or a curriculum worksheet. While these things were going on in all three approaches, the teacher was observed having different interactions with different students in the room. In Approach A the teacher would pull small groups of students (1-4) to the side to work on problems that they had gotten wrong on an in-class quiz or problems that they were struggling with in the practice book. In Approach B, the teacher was circulating to help students while they were working and also monitoring students who had “tested” out of the regular curriculum unit and were working on a different topic at the next more advanced level. In Approach C, students in small groups rotated through stations as assigned by the teacher. Students typically spent 15 minutes at each station. At one of the stations the teacher worked with the students to provide additional support on the concept in the lesson. The teacher had identified the students who needed further assistance through various formal and informal assessments. Typically, in Approach A and B, students were finishing their workbook pages or additional problems at the conclusion of each class period. In Approach C, the students came together to talk about what was learned at the stations in connection to the lesson. Homework was typically assigned at this point in all three approaches. All of the flipped instruction teachers reported that they use the online quizzes in the videos primarily as an indication of whether the students have watched the videos rather than a source of information for grouping students in class. In other words, from an accountability standpoint, by looking at the quiz results the teachers could get a general idea of who was attempting to watch the video and try the quiz. However, the teachers did not feel that grouping could be based accurately on the quiz scores because they did not have sufficient time in the morning before class to review
Center for Applied Research and Educational Improvement 3 University of Minnesota – March 2014
the quiz results and often some students still needed to view the video after they arrived at school because they had trouble accessing the video and quiz from home the night before. The teachers reported that they used other tools such as the “Quick Quizzes” from the curriculum, MAP scores, MCA scores and other curriculum test scores to form small groups for differentiated instruction. In Approach A, the differentiated instruction was a “support” or “remediation” tool. The small groups worked with the teacher on what they got wrong on the “quick quiz” or on the workbook problems they did not understand. Approach B was similar but some students were also identified to work in an advanced group. Instruction was differentiated by using a higher-level text for those students who had demonstrated their understanding of the regular curriculum through a pretest. Approach C had differentiated stations around the room. Students were assigned to the specific stations based on their need for more practice, advancement or remediation. Typically the stations worked on similar concepts at a variety of levels. Students moved through the stations as assigned by the teacher.
Table 1: Three Approaches to the Flipped Mathematics Classroom
Approach A Approach B Approach C Mini-lecture Mini-lecture Mini-lecture All students work on the same topic and task. Students that complete a task could work on similar but more challenging tasks. Students work individually or in informal groups.
Students work on a unit at their own pace. Students can test out of all or part of a unit and study a more advanced topic. Students work individually or in informal groups.
All students work on the same topic. Students work at stations. Grouping is based on unit pre-test and MAP scores.
The teacher pulls out small groups of students to work with her/him. Groups based on performance on assigned work.
The teacher pulls out small groups of students to work with her/him. Groups based on performance on assigned work.
The teacher spends more time at one station, typically with struggling students.
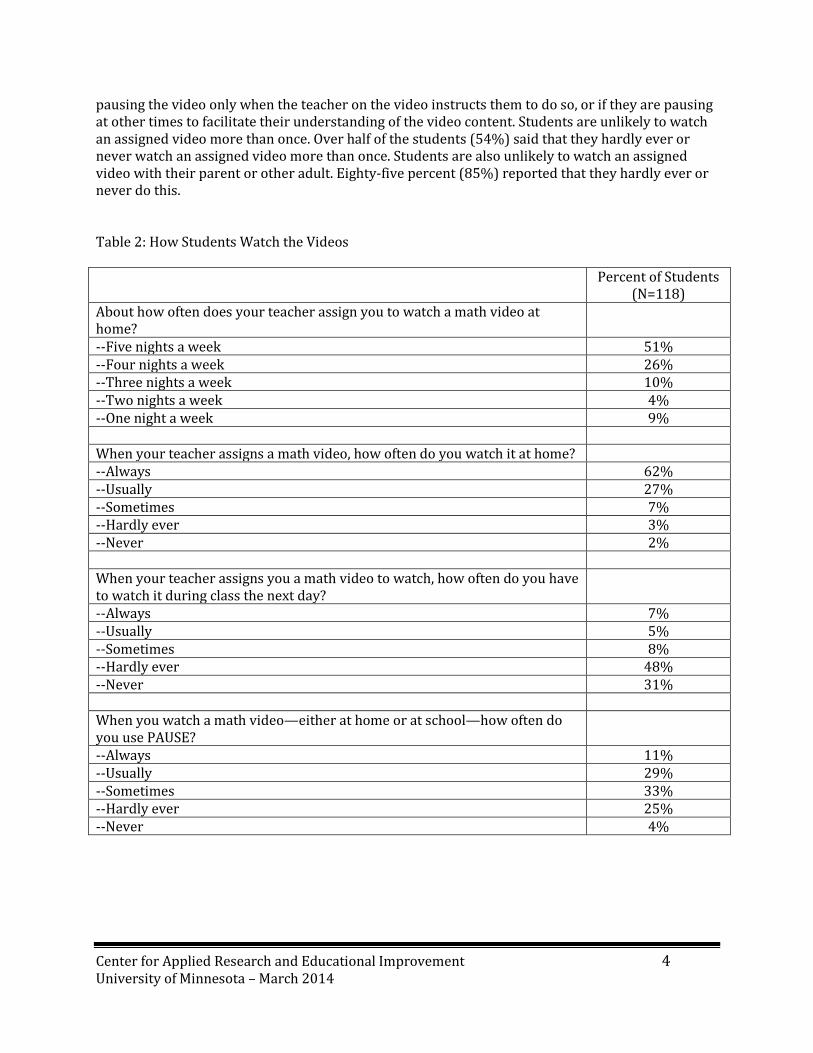
How Students Watch the Videos The student survey included a subset of questions specifically for the students who were currently in a flipped classroom (See Table 2). Over three-fourths of the students (77%) reported that their teacher assigns them to watch a math video at home at least four nights a week and fifty-one percent (51%) indicated that the teacher assigns a video five nights a week. Eighty-nine percent of the students (89%) said they usually or always watch the assigned math video at home in contrast to twelve percent (12%) who indicate that they usually or always have to watch the assigned video during class the next day. When watching a video, forty percent of the students (40%) reported that they always or usually pause the video at some point. Further information is needed however, to determine if students are
Center for Applied Research and Educational Improvement 4 University of Minnesota – March 2014
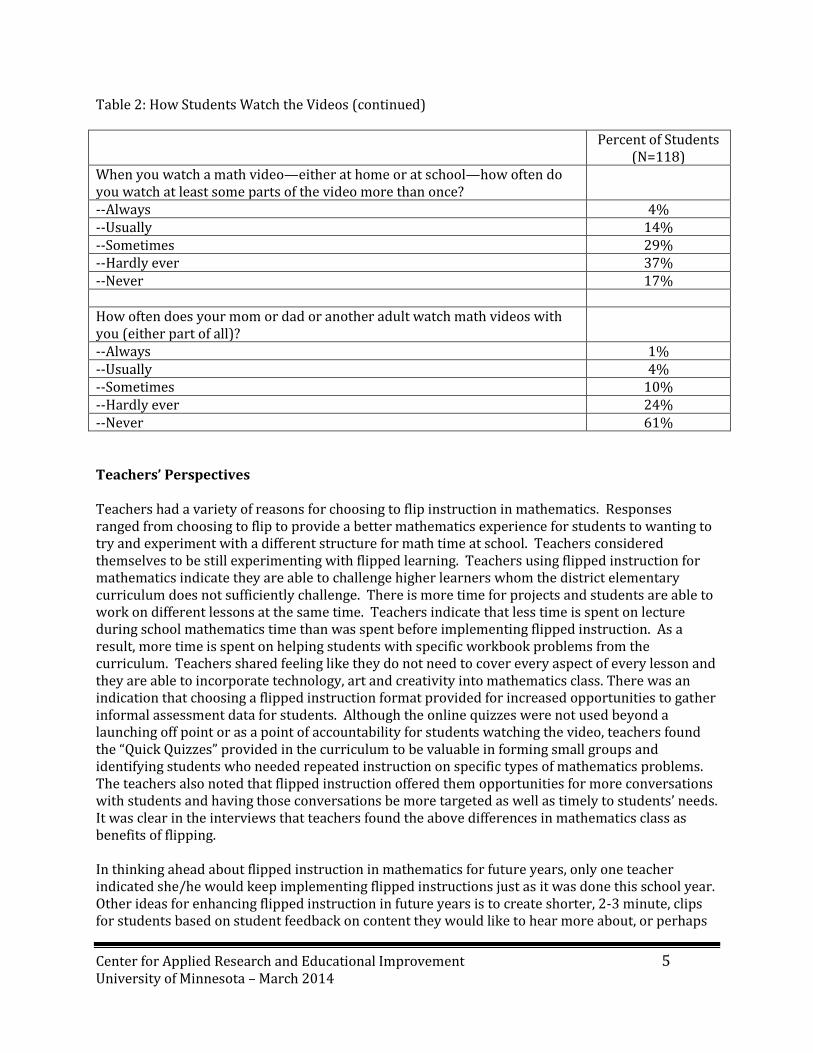
pausing the video only when the teacher on the video instructs them to do so, or if they are pausing at other times to facilitate their understanding of the video content. Students are unlikely to watch an assigned video more than once. Over half of the students (54%) said that they hardly ever or never watch an assigned video more than once. Students are also unlikely to watch an assigned video with their parent or other adult. Eighty-five percent (85%) reported that they hardly ever or never do this. Table 2: How Students Watch the Videos Percent of Students
(N=118) About how often does your teacher assign you to watch a math video at home?
--Five nights a week 51% --Four nights a week 26% --Three nights a week 10% --Two nights a week 4% --One night a week 9% When your teacher assigns a math video, how often do you watch it at home? --Always 62% --Usually 27% --Sometimes 7% --Hardly ever 3% --Never 2% When your teacher assigns you a math video to watch, how often do you have to watch it during class the next day?
--Always 7% --Usually 5% --Sometimes 8% --Hardly ever 48% --Never 31% When you watch a math video—either at home or at school—how often do you use PAUSE?
--Always 11% --Usually 29% --Sometimes 33% --Hardly ever 25% --Never 4%
Center for Applied Research and Educational Improvement 5 University of Minnesota – March 2014
Table 2: How Students Watch the Videos (continued) Percent of Students
(N=118) When you watch a math video—either at home or at school—how often do you watch at least some parts of the video more than once?
--Always 4% --Usually 14% --Sometimes 29% --Hardly ever 37% --Never 17% How often does your mom or dad or another adult watch math videos with you (either part of all)?
--Always 1% --Usually 4% --Sometimes 10% --Hardly ever 24% --Never 61% Teachers’ Perspectives Teachers had a variety of reasons for choosing to flip instruction in mathematics. Responses ranged from choosing to flip to provide a better mathematics experience for students to wanting to try and experiment with a different structure for math time at school. Teachers considered themselves to be still experimenting with flipped learning. Teachers using flipped instruction for mathematics indicate they are able to challenge higher learners whom the district elementary curriculum does not sufficiently challenge. There is more time for projects and students are able to work on different lessons at the same time. Teachers indicate that less time is spent on lecture during school mathematics time than was spent before implementing flipped instruction. As a result, more time is spent on helping students with specific workbook problems from the curriculum. Teachers shared feeling like they do not need to cover every aspect of every lesson and they are able to incorporate technology, art and creativity into mathematics class. There was an indication that choosing a flipped instruction format provided for increased opportunities to gather informal assessment data for students. Although the online quizzes were not used beyond a launching off point or as a point of accountability for students watching the video, teachers found the “Quick Quizzes” provided in the curriculum to be valuable in forming small groups and identifying students who needed repeated instruction on specific types of mathematics problems. The teachers also noted that flipped instruction offered them opportunities for more conversations with students and having those conversations be more targeted as well as timely to students’ needs. It was clear in the interviews that teachers found the above differences in mathematics class as benefits of flipping. In thinking ahead about flipped instruction in mathematics for future years, only one teacher indicated she/he would keep implementing flipped instructions just as it was done this school year. Other ideas for enhancing flipped instruction in future years is to create shorter, 2-3 minute, clips for students based on student feedback on content they would like to hear more about, or perhaps
Center for Applied Research and Educational Improvement 6 University of Minnesota – March 2014
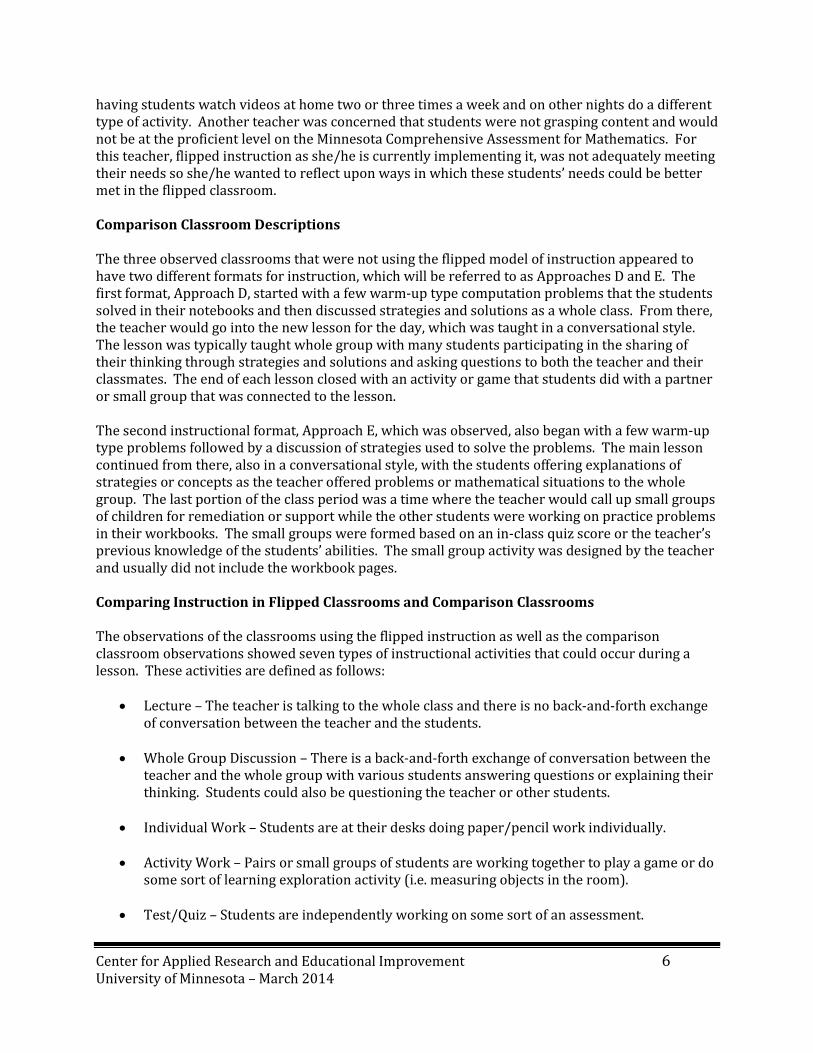
having students watch videos at home two or three times a week and on other nights do a different type of activity. Another teacher was concerned that students were not grasping content and would not be at the proficient level on the Minnesota Comprehensive Assessment for Mathematics. For this teacher, flipped instruction as she/he is currently implementing it, was not adequately meeting their needs so she/he wanted to reflect upon ways in which these students’ needs could be better met in the flipped classroom. Comparison Classroom Descriptions The three observed classrooms that were not using the flipped model of instruction appeared to have two different formats for instruction, which will be referred to as Approaches D and E. The first format, Approach D, started with a few warm-up type computation problems that the students solved in their notebooks and then discussed strategies and solutions as a whole class. From there, the teacher would go into the new lesson for the day, which was taught in a conversational style. The lesson was typically taught whole group with many students participating in the sharing of their thinking through strategies and solutions and asking questions to both the teacher and their classmates. The end of each lesson closed with an activity or game that students did with a partner or small group that was connected to the lesson. The second instructional format, Approach E, which was observed, also began with a few warm-up type problems followed by a discussion of strategies used to solve the problems. The main lesson continued from there, also in a conversational style, with the students offering explanations of strategies or concepts as the teacher offered problems or mathematical situations to the whole group. The last portion of the class period was a time where the teacher would call up small groups of children for remediation or support while the other students were working on practice problems in their workbooks. The small groups were formed based on an in-class quiz score or the teacher’s previous knowledge of the students’ abilities. The small group activity was designed by the teacher and usually did not include the workbook pages. Comparing Instruction in Flipped Classrooms and Comparison Classrooms The observations of the classrooms using the flipped instruction as well as the comparison classroom observations showed seven types of instructional activities that could occur during a lesson. These activities are defined as follows:
Lecture – The teacher is talking to the whole class and there is no back-and-forth exchange of conversation between the teacher and the students.
Whole Group Discussion – There is a back-and-forth exchange of conversation between the
teacher and the whole group with various students answering questions or explaining their thinking. Students could also be questioning the teacher or other students.
Individual Work – Students are at their desks doing paper/pencil work individually.
Activity Work – Pairs or small groups of students are working together to play a game or do
some sort of learning exploration activity (i.e. measuring objects in the room).
Test/Quiz – Students are independently working on some sort of an assessment.
Center for Applied Research and Educational Improvement 7 University of Minnesota – March 2014
Differentiated Learning Experience – Students are working in small groups. The groups are doing different tasks and the tasks are at different levels of difficulty.
Small Group Work – Students are working in small groups. The groups are working on the
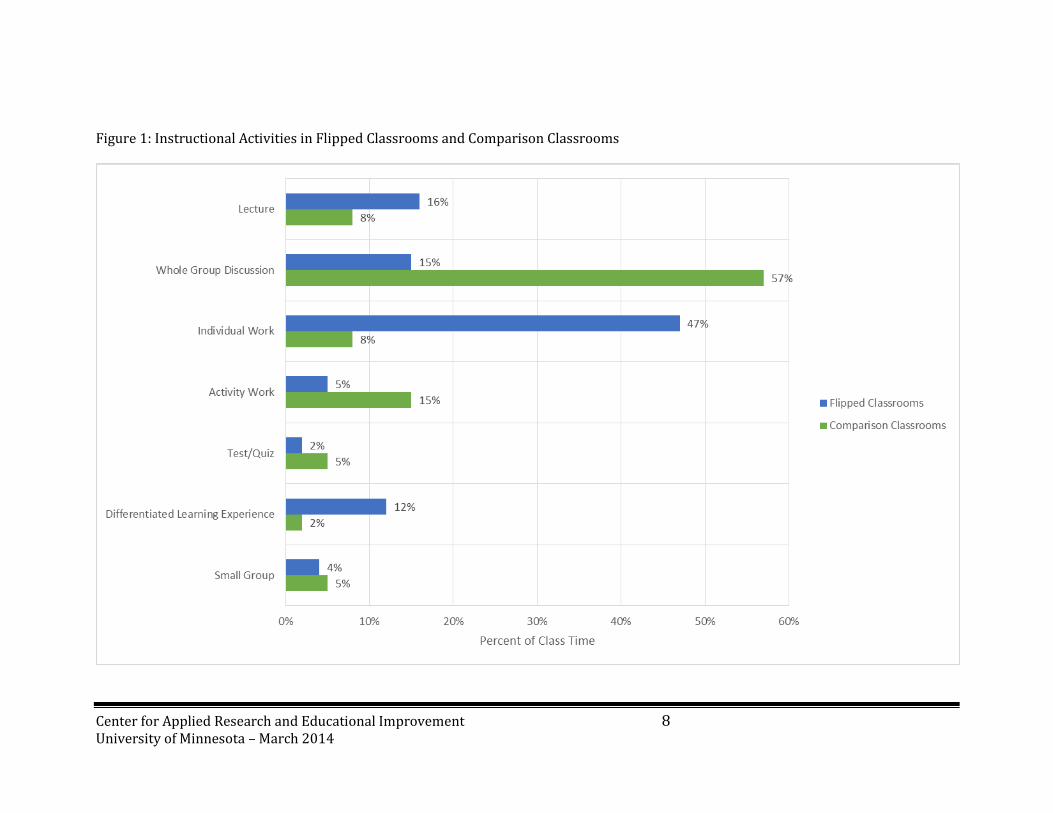
same task. Figure 1 shows the percent of class time devoted to each activity in the flipped classrooms and the comparison classrooms. Two very distinct characteristics emerged for both the flipped classrooms and the comparison classrooms. The first notable difference is in the area of whole group discussion and individual work. A very limited amount of time was dedicated to whole group discussion in the flipped classrooms while it was the dominant mode of instruction in the comparison classrooms. Conversely individual work was the main student activity in the flipped classrooms while in the comparison classrooms there was only a minimal amount of time given to individual work. Lecture was observed in both the flipped and the comparison classrooms with slightly more time given to this teaching mode in the flipped classrooms than in the comparison classrooms. The second distinct difference between the flipped classrooms and the comparison classrooms was the use of small group and differentiated learning experiences as an instructional strategy. Flipped classroom approaches A and B used these instructional strategies on a limited basis whereas Approach C used these as the main instructional strategies. When observing the comparison classrooms, differentiated learning experiences were rarely or never observed. Likely, this is connected to the limited amount of individual work time in the comparison classrooms as noted above.
Center for Applied Research and Educational Improvement 8 University of Minnesota – March 2014
Figure 1: Instructional Activities in Flipped Classrooms and Comparison Classrooms
Center for Applied Research and Educational Improvement 9 University of Minnesota – March 2014
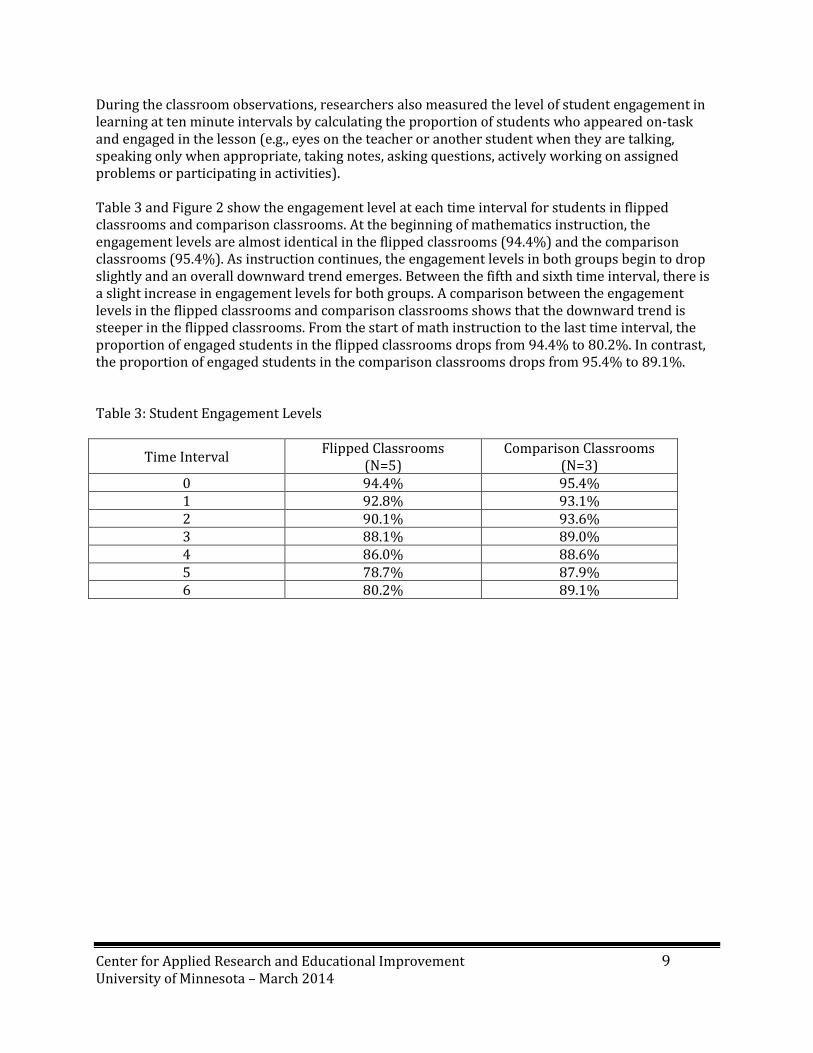
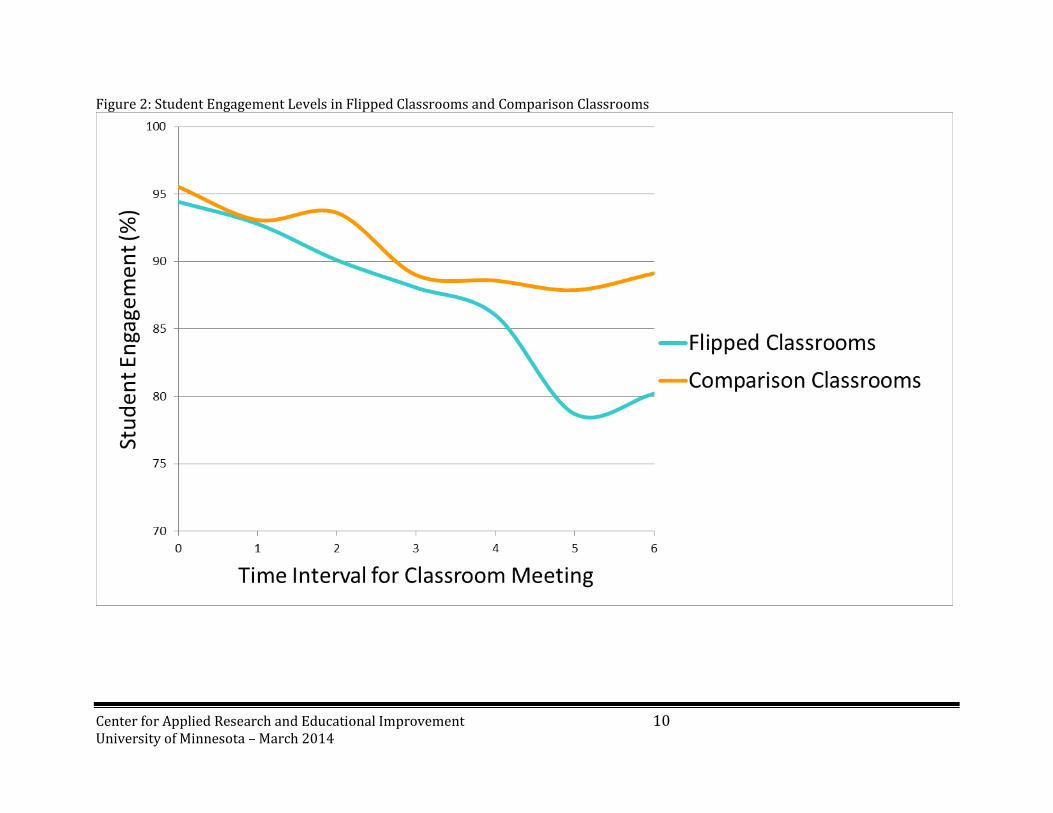
During the classroom observations, researchers also measured the level of student engagement in learning at ten minute intervals by calculating the proportion of students who appeared on-task and engaged in the lesson (e.g., eyes on the teacher or another student when they are talking, speaking only when appropriate, taking notes, asking questions, actively working on assigned problems or participating in activities). Table 3 and Figure 2 show the engagement level at each time interval for students in flipped classrooms and comparison classrooms. At the beginning of mathematics instruction, the engagement levels are almost identical in the flipped classrooms (94.4%) and the comparison classrooms (95.4%). As instruction continues, the engagement levels in both groups begin to drop slightly and an overall downward trend emerges. Between the fifth and sixth time interval, there is a slight increase in engagement levels for both groups. A comparison between the engagement levels in the flipped classrooms and comparison classrooms shows that the downward trend is steeper in the flipped classrooms. From the start of math instruction to the last time interval, the proportion of engaged students in the flipped classrooms drops from 94.4% to 80.2%. In contrast, the proportion of engaged students in the comparison classrooms drops from 95.4% to 89.1%. Table 3: Student Engagement Levels
Time Interval Flipped Classrooms
(N=5) Comparison Classrooms
(N=3) 0 94.4% 95.4% 1 92.8% 93.1% 2 90.1% 93.6% 3 88.1% 89.0% 4 86.0% 88.6% 5 78.7% 87.9% 6 80.2% 89.1%
Center for Applied Research and Educational Improvement 10 University of Minnesota – March 2014
Figure 2: Student Engagement Levels in Flipped Classrooms and Comparison Classrooms
Center for Applied Research and Educational Improvement 11
University of Minnesota
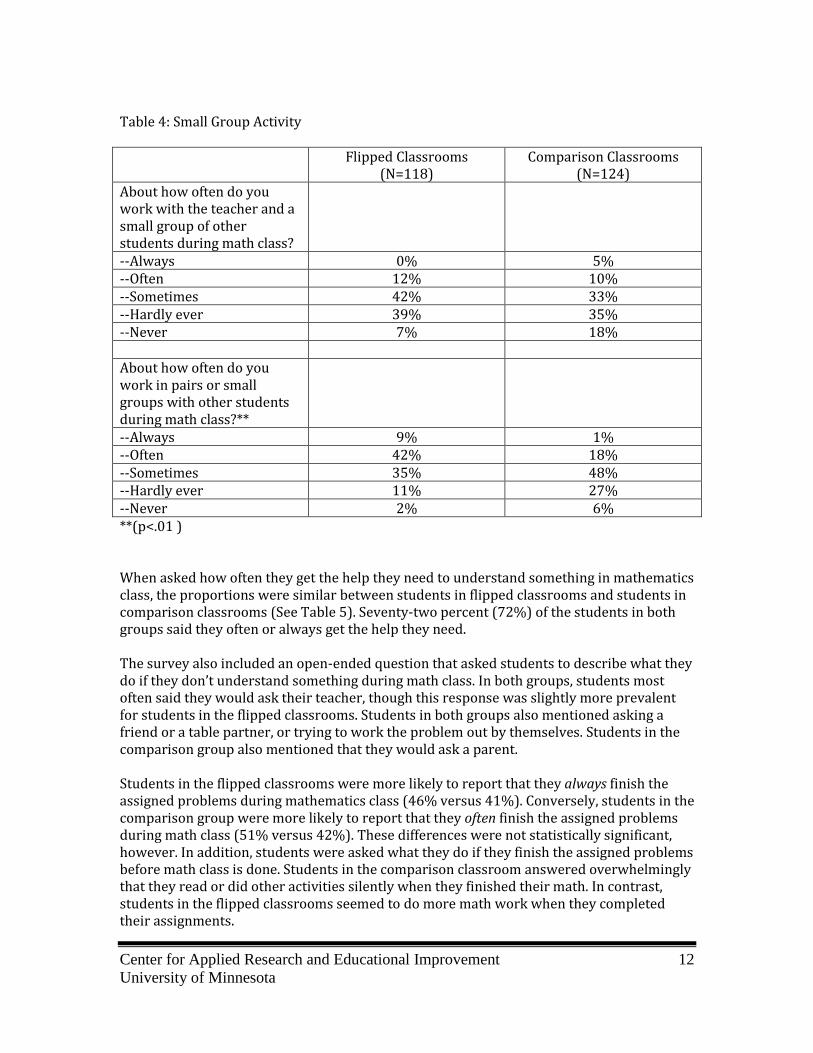
Additional information on mathematics instruction in the flipped classrooms and the comparison classrooms is available from student responses to an online survey. The survey asked students to estimate the number of minutes of their mathematics class that the teacher talks to the whole class and how many minutes the students spend working by themselves on the assigned problems. On average, students reported that the teacher is talking to the whole class for 34% of the time in a flipped classroom and 56% of the time, on average, in a comparison classroom. Students in the flipped classrooms reported that, on average, they are working by themselves on the assigned problems for 53% of the class period. This contrasts with an average of 31% of the time in a comparison classroom. These results are consistent with the data from classroom observations if the activities of lecture and whole group discussion from the observations are combined. In both activities, the teacher is talking to the whole class and the student survey did not ask students to differentiate between lecture and whole class discussion. Table 4 shows how often students in flipped classrooms and comparison classrooms have the opportunity to work with the teacher and a small group of other students, and how often they work in pairs or small groups with other students. The data show that students in flipped classrooms more often work with the teacher and a small group of other students than students in comparison classrooms; however, the difference was not statistically significant on a Pearson Chi-Square test. Over half (54%) of the students in flipped classrooms indicated that they work with the teacher and a small group of other students at least sometimes; this contrasts with a figure of forty-eight percent (48%) for the comparison students. In addition, eighteen percent (18%) of the comparison students said they never work with the teacher and a small group of other students versus seven percent (7%) for the flipped classroom students. There is a marked difference in how often students in the flipped classrooms and students in the comparison classrooms reported that they work in pairs or small groups with other students. Fifty-one percent (51%) of the students in the flipped classrooms said they often or always work in pairs or small groups in contrast to nineteen percent (19%) of students in the comparison classrooms. The differences between the groups were statistically significant on a Pearson Chi-Square test (p<.01).
Center for Applied Research and Educational Improvement 12
University of Minnesota
Table 4: Small Group Activity Flipped Classrooms
(N=118) Comparison Classrooms
(N=124) About how often do you work with the teacher and a small group of other students during math class?
--Always 0% 5% --Often 12% 10% --Sometimes 42% 33% --Hardly ever 39% 35% --Never 7% 18% About how often do you work in pairs or small groups with other students during math class?**
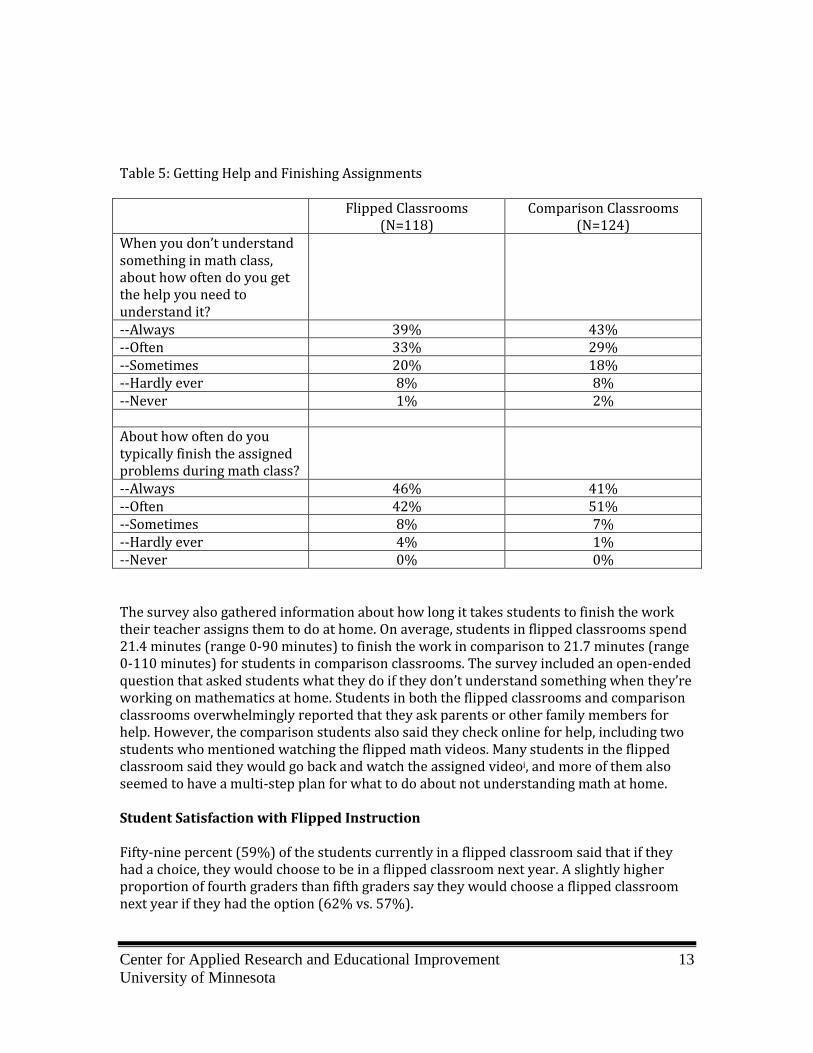
--Always 9% 1% --Often 42% 18% --Sometimes 35% 48% --Hardly ever 11% 27% --Never 2% 6% **(p<.01 ) When asked how often they get the help they need to understand something in mathematics class, the proportions were similar between students in flipped classrooms and students in comparison classrooms (See Table 5). Seventy-two percent (72%) of the students in both groups said they often or always get the help they need. The survey also included an open-ended question that asked students to describe what they do if they don’t understand something during math class. In both groups, students most often said they would ask their teacher, though this response was slightly more prevalent for students in the flipped classrooms. Students in both groups also mentioned asking a friend or a table partner, or trying to work the problem out by themselves. Students in the comparison group also mentioned that they would ask a parent. Students in the flipped classrooms were more likely to report that they always finish the assigned problems during mathematics class (46% versus 41%). Conversely, students in the comparison group were more likely to report that they often finish the assigned problems during math class (51% versus 42%). These differences were not statistically significant, however. In addition, students were asked what they do if they finish the assigned problems before math class is done. Students in the comparison classroom answered overwhelmingly that they read or did other activities silently when they finished their math. In contrast, students in the flipped classrooms seemed to do more math work when they completed their assignments.
Center for Applied Research and Educational Improvement 13
University of Minnesota
Table 5: Getting Help and Finishing Assignments Flipped Classrooms
(N=118) Comparison Classrooms
(N=124) When you don’t understand something in math class, about how often do you get the help you need to understand it?
--Always 39% 43% --Often 33% 29% --Sometimes 20% 18% --Hardly ever 8% 8% --Never 1% 2% About how often do you typically finish the assigned problems during math class?
--Always 46% 41% --Often 42% 51% --Sometimes 8% 7% --Hardly ever 4% 1% --Never 0% 0% The survey also gathered information about how long it takes students to finish the work their teacher assigns them to do at home. On average, students in flipped classrooms spend 21.4 minutes (range 0-90 minutes) to finish the work in comparison to 21.7 minutes (range 0-110 minutes) for students in comparison classrooms. The survey included an open-ended question that asked students what they do if they don’t understand something when they’re working on mathematics at home. Students in both the flipped classrooms and comparison classrooms overwhelmingly reported that they ask parents or other family members for help. However, the comparison students also said they check online for help, including two students who mentioned watching the flipped math videos. Many students in the flipped classroom said they would go back and watch the assigned videoi, and more of them also seemed to have a multi-step plan for what to do about not understanding math at home. Student Satisfaction with Flipped Instruction Fifty-nine percent (59%) of the students currently in a flipped classroom said that if they had a choice, they would choose to be in a flipped classroom next year. A slightly higher proportion of fourth graders than fifth graders say they would choose a flipped classroom next year if they had the option (62% vs. 57%).
Center for Applied Research and Educational Improvement 14
University of Minnesota
All of the students currently in a flipped classroom were asked to describe what they like about the flipped classroom and what they don’t like about the flipped classroom. The top thing that students liked about the flipped classroom was that they could work on math problems in class and have less to finish at home. As one student said, “I like it that when we get home I only have to watch a short video and then I get to hang out.” Many students also described how they think the videos help them learn; for example:
I like how they give examples. The video because less distractions take attention away from the explanation. You can re-watch it or pause it or fast-forward it but if the teacher was talking in class instead of a video you could not do that.
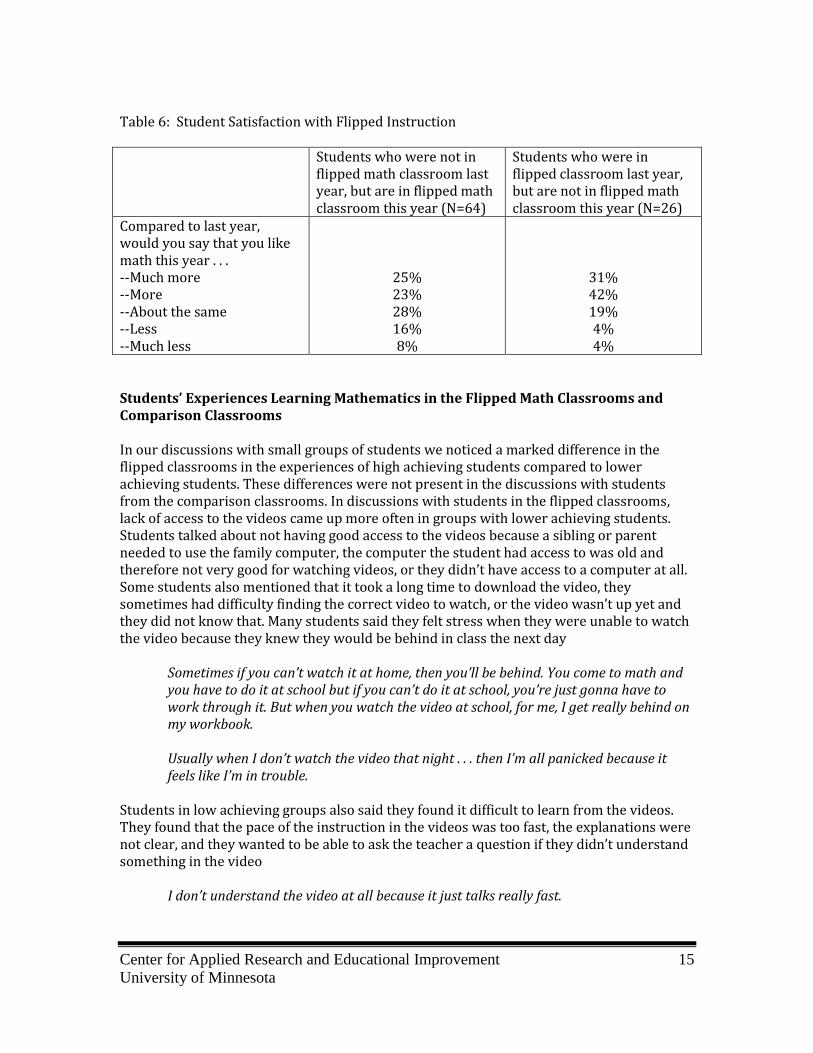
Many students like the technology aspect of the flipped classroom. One student said, “I like that I can do it on my iPod” and another wrote, “It’s fun because you don’t have to sit down at a table and write you get to type on the computer.” Some students appreciate that by watching the video they can understand what will take place in class the next day. Others like that they can work at their own pace or that the teacher spends less time talking to the class. Finally, some students mentioned that they are more challenged and learn more in the flipped classroom. When students were asked what they didn’t like about the flipped classroom, the most frequent reason by far was the length of the videos. Many students felt the flipped classroom resulted in more homework or too much homework. A student wrote, “I think having a math sheet to do at home is much easier than having to get on your computer, log on, watch the video, and take the quiz.” Another student said, “I can get the regular math work done faster than the flipped math.” Many students expressed frustration with the technology aspect of the flipped classroom, such as the videos not working, not having Internet access, or having difficulty finding the videos. Other students said that they wanted more time with their teacher to ask questions or they wanted their teacher to be on the video. Some students did not like the repetition of watching the video the night before and then having the teacher address the same content again in class the next day. Additional information on student satisfaction with flipped instruction comes from the subset of students who had flipped math instruction for either fourth or fifth grade, but not both years (See Table 6). These students were asked how much they like math this year compared to last year. Of the twenty-six students who completed the survey that had flipped math last year in fourth grade but not currently in fifth grade seventy-three percent (73%) reported that they like math more or much more in fifth grade when they are not in a flipped classroom. Of the sixty-four students who did not have flipped math last year in fourth grade but do have flipped math currently in fifth grade forty-eight percent (48%) reported that they like math more or much more in fifth grade when they are in a flipped classroom.
Center for Applied Research and Educational Improvement 15
University of Minnesota
Table 6: Student Satisfaction with Flipped Instruction Students who were not in
flipped math classroom last year, but are in flipped math classroom this year (N=64)
Students who were in flipped classroom last year, but are not in flipped math classroom this year (N=26)
Compared to last year, would you say that you like math this year . . . --Much more --More --About the same --Less --Much less
25% 23% 28% 16% 8%
31% 42% 19% 4% 4%
Students’ Experiences Learning Mathematics in the Flipped Math Classrooms and Comparison Classrooms In our discussions with small groups of students we noticed a marked difference in the flipped classrooms in the experiences of high achieving students compared to lower achieving students. These differences were not present in the discussions with students from the comparison classrooms. In discussions with students in the flipped classrooms, lack of access to the videos came up more often in groups with lower achieving students. Students talked about not having good access to the videos because a sibling or parent needed to use the family computer, the computer the student had access to was old and therefore not very good for watching videos, or they didn’t have access to a computer at all. Some students also mentioned that it took a long time to download the video, they sometimes had difficulty finding the correct video to watch, or the video wasn’t up yet and they did not know that. Many students said they felt stress when they were unable to watch the video because they knew they would be behind in class the next day
Sometimes if you can’t watch it at home, then you’ll be behind. You come to math and you have to do it at school but if you can’t do it at school, you’re just gonna have to work through it. But when you watch the video at school, for me, I get really behind on my workbook. Usually when I don’t watch the video that night . . . then I’m all panicked because it feels like I’m in trouble.
Students in low achieving groups also said they found it difficult to learn from the videos. They found that the pace of the instruction in the videos was too fast, the explanations were not clear, and they wanted to be able to ask the teacher a question if they didn’t understand something in the video
I don’t understand the video at all because it just talks really fast.
Center for Applied Research and Educational Improvement 16
University of Minnesota
I don’t like the videos because if you do need help with something in the video you can’t ask the teacher. Usually when I watch the video they don’t really explain it that clearly, they just write it down. Ever since we did the flipped math I just feel like I’m not understanding it as well as I was.
The students also found it harder to learn from the video because, unlike in the classroom with their teacher, the video would only show one way to solve a problem and then they would be at a loss if they didn’t comprehend that explanation
Videos only give you one way to do it and if you don’t get it, there’s no way you’re going to be able to do it because you don’t know how to do it that one way.
Although it was usually the lower achieving students that expressed difficulty learning from the videos, some of the high achieving students also felt they learned more effectively without the flipped instruction. For example, one high achieving student suggested doing the first half of the year without the flip “because I usually don’t get it. It’s kind of just sinking in, the new math problems and stuff, but then the rest of the year I would kind of know more about it.” Students in low achieving groups would like more time with their teacher, yet they also expressed some frustration at spending so much time in a small group with the teacher while other students got to do other things that they perceived were more enjoyable
Sometimes we split in groups. Like she always has [student points to self and then names two other students in the group] at the table and all the other kids get to play fun little math games and everything. We feel trapped. I feel like I’m behind and under where I’m supposed to be.
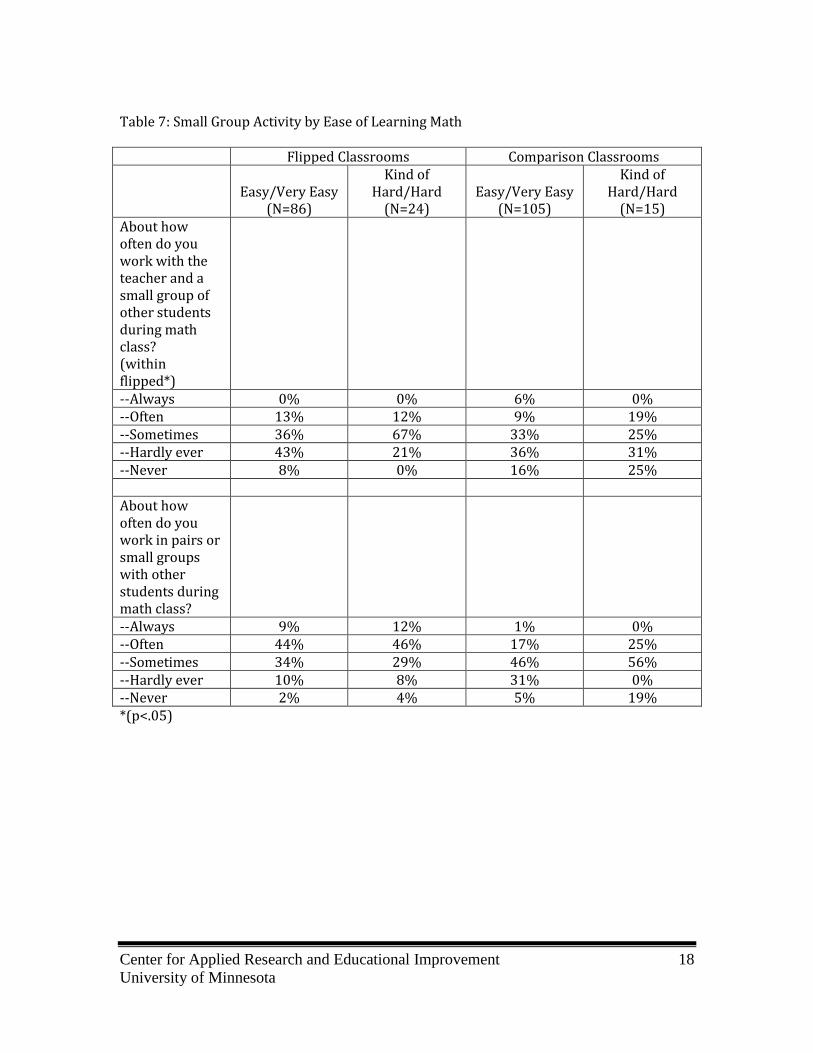
Given the results of the focus groups with students, further analyses of the student survey were conducted to compare responses between students who reported it was “very easy or easy for them to learn math” and students who reported it was “kind of hard or hard for them to learn math.” Overall, 82% of the students who completed the survey indicated that it was “easy or very easy for them to learn math” and eighteen percent (18%) of the students said it was “kind of hard or hard for them to learn math.” In the flipped classrooms, students who report it’s “kind of hard or hard for them to learn math” more often work with the teacher and a small group of other students than students who report it’s “easy or very easy for them to learn math” (See Table 7). In the flipped classroom seventy-nine percent (79%) of the students who report it’s kind of hard or hard to learn math work with the teacher and a small group of other students at least sometimes versus forty-nine percent (49%) of the students who report it’s easy or very easy to learn math. The differences were statistically significant on a Pearson Chi-Square test. In the comparison classrooms, the differences between the two groups of students were not statistically significant. Forty-eight percent (48%) of the students who report “it is easy or
Center for Applied Research and Educational Improvement 17
University of Minnesota
very easy to learn math” work with the teacher and a small group of other students at least sometimes versus forty-four percent (44%) of the students who report it’s kind of hard or hard to learn math. In both the flipped classrooms and the comparison classrooms, there were no significant differences in how often students work in pairs or small groups between students who say “it is easy or very easy to learn math” and students who say it is kind of hard of hard to learn math (See Table 7). Likewise, in both the flipped classrooms and comparison classrooms students who say “it is easy or very easy to learn math” get help when they don’t understand something as often as students who say “it is kind of hard or hard to learn math” (See Table 8). In the flipped classrooms, there were significant differences between the groups, however, in the frequency with which students complete the assigned problems during class. Students who report it’s “easy or very easy to learn math” more often finish the assigned problems during math class as compared with students who report “it is kind of hard or hard to learn math” (See Table 8). Ninety-two percent (92%) of the students who report it is easy to learn math indicate that they often or always complete the assigned problems during math class versus 76% of the students who report it is hard to learn math. These differences were statistically significant on a Pearson Chi-Square test. In the comparison classrooms, the differences between the two groups of students were not statistically significant. Ninety-four percent (94%) of the students who report it is easy to learn math indicate that they often or always complete the assigned problems during math class. Eighty-six percent (86%) of the students who report it is hard to learn math indicate that they often or always complete the assigned problems during math class.
Center for Applied Research and Educational Improvement 18
University of Minnesota
Table 7: Small Group Activity by Ease of Learning Math
Flipped Classrooms Comparison Classrooms
Easy/Very Easy (N=86)
Kind of Hard/Hard
(N=24)
Easy/Very Easy
(N=105)
Kind of Hard/Hard
(N=15) About how often do you work with the teacher and a small group of other students during math class? (within flipped*)
--Always 0% 0% 6% 0% --Often 13% 12% 9% 19% --Sometimes 36% 67% 33% 25% --Hardly ever 43% 21% 36% 31% --Never 8% 0% 16% 25% About how often do you work in pairs or small groups with other students during math class?
--Always 9% 12% 1% 0% --Often 44% 46% 17% 25% --Sometimes 34% 29% 46% 56% --Hardly ever 10% 8% 31% 0% --Never 2% 4% 5% 19% *(p<.05)
Center for Applied Research and Educational Improvement 19
University of Minnesota
Table 8: Getting Help and Finishing Assignments by Ease of Learning Math Flipped Classrooms Comparison Classrooms
Easy/Very Easy (N=86)
Kind of Hard/Hard
(N=24)
Easy/Very Easy
(N=105)
Kind of Hard/Hard
(N=15) When you don’t understand something in math class, about how often do you get the help you need to understand it?
--Always 41% 32% 46% 31% --Often 34% 32% 29% 25% --Sometimes 17% 28% 15% 31% --Hardly ever 7% 8% 7% 12% --Never 1% 0% 2% 0% About how often do you typically finish the assigned problems during math class? (within flipped*)
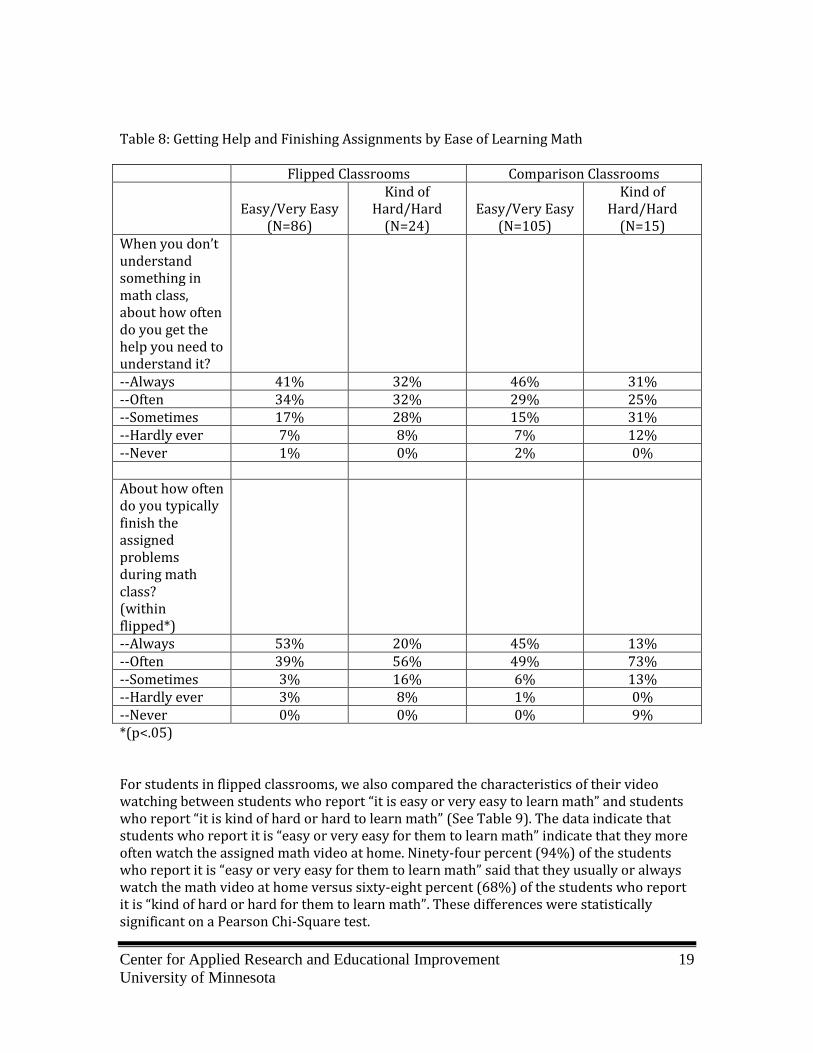
--Always 53% 20% 45% 13% --Often 39% 56% 49% 73% --Sometimes 3% 16% 6% 13% --Hardly ever 3% 8% 1% 0% --Never 0% 0% 0% 9% *(p<.05) For students in flipped classrooms, we also compared the characteristics of their video watching between students who report “it is easy or very easy to learn math” and students who report “it is kind of hard or hard to learn math” (See Table 9). The data indicate that students who report it is “easy or very easy for them to learn math” indicate that they more often watch the assigned math video at home. Ninety-four percent (94%) of the students who report it is “easy or very easy for them to learn math” said that they usually or always watch the math video at home versus sixty-eight percent (68%) of the students who report it is “kind of hard or hard for them to learn math”. These differences were statistically significant on a Pearson Chi-Square test.
Center for Applied Research and Educational Improvement 20
University of Minnesota
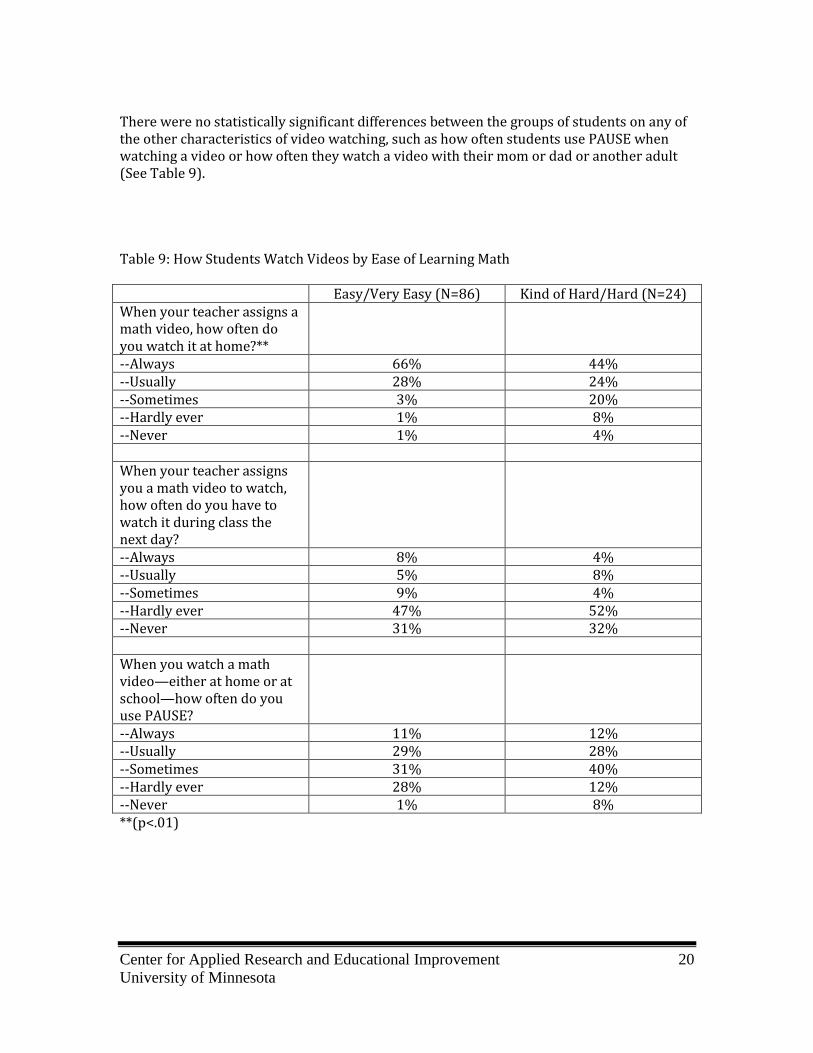
There were no statistically significant differences between the groups of students on any of the other characteristics of video watching, such as how often students use PAUSE when watching a video or how often they watch a video with their mom or dad or another adult (See Table 9). Table 9: How Students Watch Videos by Ease of Learning Math Easy/Very Easy (N=86) Kind of Hard/Hard (N=24) When your teacher assigns a math video, how often do you watch it at home?**
--Always 66% 44% --Usually 28% 24% --Sometimes 3% 20% --Hardly ever 1% 8% --Never 1% 4% When your teacher assigns you a math video to watch, how often do you have to watch it during class the next day?
--Always 8% 4% --Usually 5% 8% --Sometimes 9% 4% --Hardly ever 47% 52% --Never 31% 32% When you watch a math video—either at home or at school—how often do you use PAUSE?
--Always 11% 12% --Usually 29% 28% --Sometimes 31% 40% --Hardly ever 28% 12% --Never 1% 8% **(p<.01)
Center for Applied Research and Educational Improvement 21
University of Minnesota
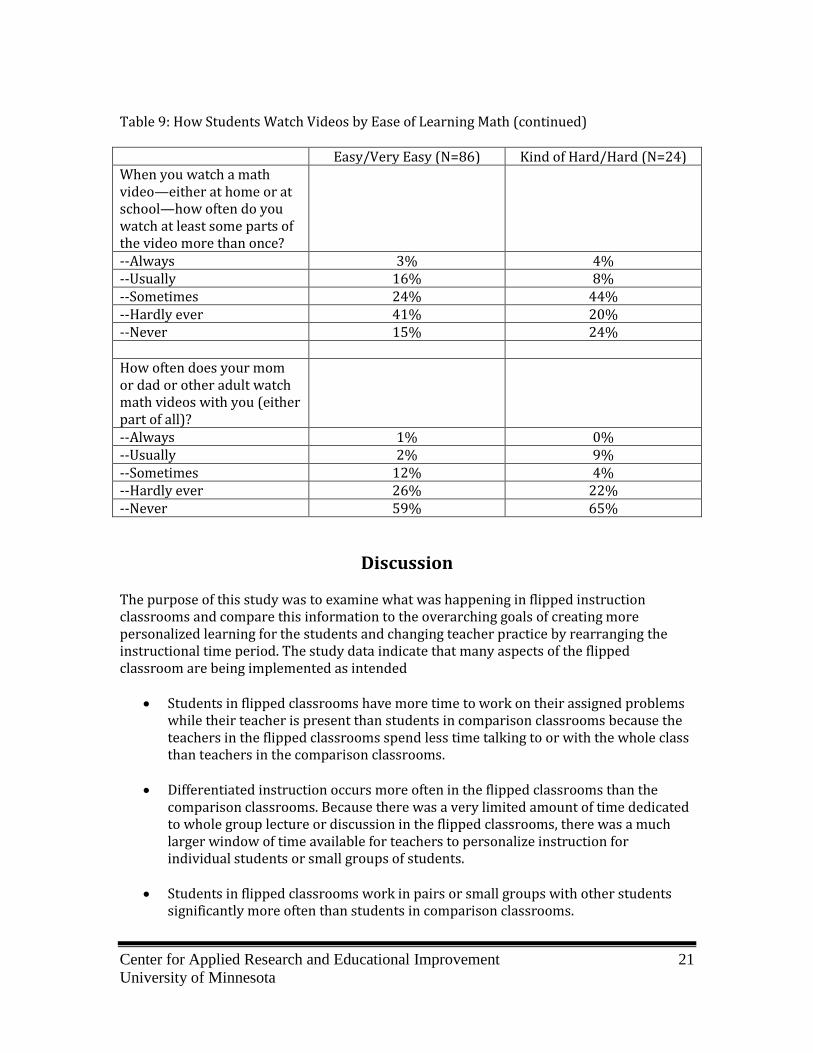
Table 9: How Students Watch Videos by Ease of Learning Math (continued) Easy/Very Easy (N=86) Kind of Hard/Hard (N=24) When you watch a math video—either at home or at school—how often do you watch at least some parts of the video more than once?
--Always 3% 4% --Usually 16% 8% --Sometimes 24% 44% --Hardly ever 41% 20% --Never 15% 24% How often does your mom or dad or other adult watch math videos with you (either part of all)?
--Always 1% 0% --Usually 2% 9% --Sometimes 12% 4% --Hardly ever 26% 22% --Never 59% 65%
Discussion The purpose of this study was to examine what was happening in flipped instruction classrooms and compare this information to the overarching goals of creating more personalized learning for the students and changing teacher practice by rearranging the instructional time period. The study data indicate that many aspects of the flipped classroom are being implemented as intended
Students in flipped classrooms have more time to work on their assigned problems while their teacher is present than students in comparison classrooms because the teachers in the flipped classrooms spend less time talking to or with the whole class than teachers in the comparison classrooms.
Differentiated instruction occurs more often in the flipped classrooms than the
comparison classrooms. Because there was a very limited amount of time dedicated to whole group lecture or discussion in the flipped classrooms, there was a much larger window of time available for teachers to personalize instruction for individual students or small groups of students.
Students in flipped classrooms work in pairs or small groups with other students
significantly more often than students in comparison classrooms.
Center for Applied Research and Educational Improvement 22
University of Minnesota
In flipped classrooms, students who report “it is kind of hard or hard to learn math” more often work with the teacher and a small group of students than students who report “it is easy or very easy to learn math.” The difference between the groups was statistically significant. In contrast, there were no differences in the comparison classrooms. This suggests that in a flipped classroom the teacher has more opportunity to work with a small group of students because the teacher is spending less time talking to the whole class.
The study also identified other differences between the flipped classrooms and the comparison classrooms. Students in flipped classrooms are more likely to do additional math work when they finish their assignment in class than students in comparison classrooms. This may be occur because teachers in flipped classrooms are more likely to have prepared other problems or math activities for students to work on once they have completed the assigned problems given that in the flipped classroom students are working at their own pace on the assignment for a large portion of the math period. There was some evidence to suggest that students in the flipped classrooms may take more responsibility for their learning. Many students in the flipped classroom said if they didn’t understand something while working on math at home they would go back and re-watch the assigned videoii. In contrast to students in the comparison classrooms, more of the students in the flipped classrooms seemed to have a multi-step plan for what to do about not understanding math at home. This suggests that students in the flipped classrooms may feel more responsible for their learning and recognize that they need to have multiple options available for the times that they don’t understand something. Teachers who have one to two years of experience using the flipped classroom approach identified several benefits of this instructional approach, including: they are able to challenge higher-level learners whom the district elementary curriculum does not sufficiently challenge; there is more time available to do math-related projects; and they have increased opportunities to gather informal assessment data from students as they move about the classroom. Finally, fifty-nine percent (59%) of the students indicated that if they were given a choice they would choose a flipped classroom for next year. The top reason students gave for liking the flipped classroom was that they could work on math problems in class and have less work to finish at home. Many students also described how they think the videos help them learn more effectively. The data also indicate aspects of the flipped classroom implementation that may benefit from further development. Although student engagement was generally high in both the flipped classrooms and comparison classrooms, as the class time period progressed, there was evidence of a steeper decline in engagement for students in flipped classrooms as compared with traditional math class instruction. When observing the comparison classrooms, teachers using whole group discussion and activities, such as games and group or partner work with hands-on activities, appeared to maintain a relatively steady percentage of engaged students. This suggests that utilization of the time in the flipped classrooms may benefit from incorporating a greater variety of teaching strategies throughout the class period to maintain or increase student engagement.
Center for Applied Research and Educational Improvement 23
University of Minnesota
Data from both the student survey and the student discussion groups reveal that the students in the flipped classrooms report that the videos are too long. This was true for students who said they would choose the flipped classroom next year and those who would not choose it, and also for students who find it easy to learn math and students who find it difficult to learn math. In addition, there were several indications that suggest the flipped classroom as currently implemented may be less effective for students who find it difficult to learn math. Students who report “it is kind of hard or hard to learn math” watch the assigned videos at home significantly less often than do students who report “it is easy or very easy to learn math.” This lower rate could be explained, at least in part, by the finding that lower achieving students in the small group discussions were more likely to report that they had experienced barriers to accessing the videos through the Internet. Although it was possible for students to watch the videos via a DVD rather than online, the students reported that the DVDs were not always available to them. In addition to having less access to the videos, lower achieving students reported that they find it difficult to learn from the videos. For example, they often felt that the instruction on the videos went too quickly, the explanations were not clear enough, and they wanted an opportunity to ask questions of the teacher as their questions came up rather than waiting until the next day in class. Although students have the option to watch the videos more than once or use PAUSE if they need some time to think about what the teacher on the video said, the data indicate that students who find it hard to learn math did not employ these options as compared with students who find it easy to learn math. The data also revealed that, in the flipped classrooms, students who find it difficult to learn math significantly less often finish the assigned problems during class than their peers who find it easy to learn math. Although this difference is not completely unexpected because it makes sense that students who struggle with math would need more time to complete their assignments, we would expect to find the same result in the comparison classrooms. This was not the case, however. There was no significant difference in the comparison classrooms between students who struggle with math and students who find it easy to learn math. Further study is needed to understand the factors that may explain these differences. Although the cause of these differences cannot be determined from the data in this study, these differences may contribute to lower satisfaction with flipped instruction among lower achieving students. As noted earlier, one strength of the flipped classroom is that it allows the teacher more time to work with small groups of students to provide differentiated and more personalized instruction. However, some of the lower achieving students expressed frustration with having to spend so much time working with the teacher while their peers were doing other things that appeared to be more enjoyable. As the flipped classroom model continues to develop, teachers may want to broaden the mix of instructional strategies employed to address the needs of lower achieving students. This report is based on data collected about math instruction in fourth and fifth grades and therefore the results may not be generalizable to math instruction occurring at other grade levels. Caution is recommended when applying the study results to instruction in other grade levels because both the content of the curriculum and the developmental level of the
Center for Applied Research and Educational Improvement 24
University of Minnesota
students would be different in other grade level classrooms. In addition, because the study focused on instruction in mathematics, the results are not intended to apply to other areas of the curriculum. During the study, we observed math instruction in eight classrooms and visited each classroom on three separate days. When interpreting the results of the observation data, caution is recommended because the observation data may not fully represent the math instruction that occurred in those classrooms during other days of the year. In addition, the math instruction in the classrooms that we observed might not fully match the math instruction that occurs in other flipped classrooms or other comparison classrooms. The student survey, in contrast, was administered to all classrooms at the fourth and fifth grade level and therefore may provide a more complete picture of mathematics instruction across the district at these grade levels.
i In Table 2, earlier in the report, we displayed students’ responses to a fixed-response survey question that asked, “When you watch a math video—either at home or at school—how often do you watch at least some parts of the video more than once?” That question differs slightly from the open-ended question discussed here, which asked, “What do you do if you don’t understand something when you’re working on math at home?” On the latter question, many students in the flipped classrooms said they would go back and watch the assigned video, whereas on the fixed-response question, only 18% of the students in the flipped classrooms chose a response of “usually” or “always.” An explanation for why a higher proportion of students said they would watch the video again on the open-ended question as compared to the fixed-response question could be that the open-ended question referred specifically to times when students don’t understand something when they’re working on math at home versus the fixed-response question that referred to their overall video-watching behavior. We would expect that students would be more likely to watch the video again if they found themselves in a situation where they did not understand something. ii See above explanation.