Embed Size (px)
Citation preview
A study on the lipid fraction of Adriatic sardine filets(Sardina pilchardus)
Antonella De Leonardis and Vincenzo Macciola
1 Introduction
Man has always benefited from fish consumption due itshigh content of x-3 long chain polyunsaturated fatty acids(PUFA-n3), especially from eicosapentaenoic (20:5n3; EPA)and docosahexaenoic (20:6n3; DHA) acids [1–6]. Some fishspecies in the Mediterranean region are considered as x-3 fattyacid sources [7–10]. Sardine (Sardina pilchardus Walb.) is agregarious plankton-eating fish that lives in the open sea, atdifferent sea depth levels [11] and is one of the most importantcommercial fish species in the Mediterranean Sea and, in parti-cular, in the Adriatic Sea [12–15]. The sardine lipid contentchanges seasonally in function of animal biology, food avail-ability and sea water temperature [16–19]. The nutritionalproperties of sardines could be changed in relation to theirlipid content and therefore in function of fishing time. In thisstudy, the relationship between lipid content and its composi-tion in filets of Adriatic sardines was estimated. The resultsobtained were discussed considering some nutritional aspects,in particular, human needs of fatty acids and cholesterol.
2 Materials and methods
2.1 Materials
Sardines, fished randomly in the Adriatic Sea and alreadyeviscerated and filleted, were purchased in a local market attwo different periods: January–March 2002 and August–Octo-ber 2002. Eight samples (each in double replicate) for both ofthe aforementioned periods were respectively analysed and infunction of the average content of total lipid (TL) the sampleswere designated as follows: (i) lean sardines, TL 2.7 l 1.2%(samples of January–March 2002), and (ii) fat sardines, TL13.8 l 4.5% (samples of August–October 2002). In our labora-tory, sardine fillets were ground with an electric mill and
stored at –188C. All chemical reagents, when not otherwisespecified, were purchased from Carlo Erba (Milan, Italy),while fatty acid standards and stigmasterol were bought fromSigma-Aldrich (St. Louis, MO, USA).
2.2 Methods
Sardine total lipid content was determined by Soxhletextraction with petroleum ether at 40–608C as solvent, whilethe study of different lipid components was carried out oncrude sardine lipids extracted at room temperature in 1:5volumes of n-hexane: isopropanol 3 :2 v/v solution [20]. Crudesardine total lipids were fractioned by solid-phase extraction(SPE) using Strata-NH2 500 mg/3 mL cartridges (Phenomenex,Torrance, CA, USA) in aminopropyl silica gel. The cartridgewas conditioned with 10 mL chloroform, then 25 mg sample,dissolved in 0.5 mL of chloroform, was loaded. In sequence,neutral lipids (NLs) were eluted in chloroform, free fatty acids(FFAs) in diethyl ether :acetic acid 98:2 solution and polarlipids (PL) in methanol. TLC analysis was performed usingAlungram Sil G/UV254 (Macherey-Nagel, D�ren, Germany)aluminum plates (size 20620 cm, layer thickness 0.20 mm).Elution solution was n-hexane:ethylic ether :acetic acid(70 :30:1 v/v/v), the visualisation reagent was a 4% sulphuricacid in 20% ammonium sulphate solution. Fatty acid analysiswas performed on a Thermo Finnigan gas-cromatographModel 8000 (Milan, Italy) equipped with a capillary column(Supelcowax 10; Bellefonte, PA, USA) with carbowax 20Mpolyethylene glycol phase, 30 m length, 0.32 mm ID, 0.5 lmfilm. Experimental conditions: carrier gas He at 50 kPa; splitinjection system with 1:40 splitting ratio; FID detector sys-tem; injector and detector temperatures 2508C; oven tempera-ture, 1508C–2408C at 78C/min. Methyl esters were identifiedby comparison with known standards and by reference to pub-lished data [7]. The internal standard was tricosanoic acid(C23:0). Transesterification of total, neutral and polar lipidswas realized at cold with KOH 2N methanol solution, whilemethylation of free fatty acids was carried out with 0.2 M tri-methylsulphonium hydroxide (TMSH) in methanol (Mache-rey-Nagel). For the determination of cholesterol, 150 mg offats, exactly weighed, with 100 lL of stigmasterol standardsolution (5.4 mg NmL–1) were diluted with 1 mL of KOH satu-rated ethanol solution and saponified in a water bath at 808C
i 2004 WILEY-VCH Verlag GmbH & Co. KGaA, Weinheim DOI: 10.1002/food.200300408 Nahrung/Food 48 (2004) No. 3, pp. 209–212 209
Sardine (Sardina pilchardus Walb.) is an important Mediterraneancommercial fish species. In this study, the lipids of sardine filets, fishedin the Adriatic Sea at different times, were examined. In function oftheir total lipid (TL) content, sardine filet samples were grouped intolean (TL a 4%) and fat (TL A 4%). It was demonstrated that the differ-ences of TL were exclusively due to a seasonal cyclical increase of neu-tral lipids. In fact, during moderate-hot months, sardines accumulatedreserve fat that was metabolised during the winter months. The fattyacid composition was similar in both sardine sample groups and thefatty acid profile was equally distributed among saturated fatty acids, onaverage 38.3%, 31.2% monounsaturated, and 30.4% polyunsaturated.The polyunsaturated fatty acid n3 (PUFA-n3) represented on average
20.9%, always higher than PUFA-n6. C20 :5n3 eicosapentaenoic acid,(EPA) and C22 :6n3 docosahexaenoic acid (DHA) were the must abun-dant PUFA-n3. Under nutritional aspects, the lipids of 100 g of fat-sar-dines provided PUFA-n3 quantities, in particular EPA and DHA, signif-icantly higher than human daily requirements. In lean-sardines, thePUFA-n3 input drastically decreased and was estimated that EPA andDHA inputs in 100 g of sardines covered around 17% and 50% of dailyrequirements, respectively. Finally, cholesterol was equal to 93 mg/100 g of sardines, ranging from 67 to 131 and it did not increase in rela-tion to the total lipid content. In conclusion, this study has highlightedthat, under nutritional aspects, regarding EPA and DHA inputs, it is pre-ferable to consume sardines with at least 4% total lipids.
Correspondence: Antonella De Leonardis, Dipartimento di Scienze eTecnologie Agro-Alimentari, Ambientali e Microbiologiche, Universi-t� del Molise, Via De Sanctis, I-86100 Campobasso, ItalyE-mail: [email protected]: +39-0874-404652
Keywords: Nutritional fatty acid / Sardine lipids /
De Leonardis and Macciola
210 Nahrung/Food 48 (2004) No. 3, pp. 209–212 i 2004 WILEY-VCH Verlag GmbH & Co. KGaA, Weinheim
for 30 min, mixing at ten-drafts. After cooling and adding3 mL distilled water and 3 mL n-hexane, the saponified samplewas carefully stirred and centrifuged at 30006g for 15 min.The upper hexane layer was drawn, while on the water layer3 mL hexane extraction was repeated twice more in the sameway. The hexane extract was dried at 508C, directly silylated at808C for 30 min with 300 lL pyridine :hexamethyldisilazane :trimethylchlorosilane 40:36:24 v/v/v and then analysed(1 lL) by GC. GC analysis was performed by the gas chroma-tograph cited above, equipped with a CP SIL 8CB column(Chrompack, Middelburb, Holland), 25 m length, 0.25 mm ID,0.12 lm film. Experimental conditions: split injection systemwith 1:25 splitting ratio; FID detection system; temperatures:oven in isotherms at 2908C, injector 3008C, detector 3258C;gas carrier He at 60 kPa flow. For each sample, two independ-ent measurements were taken and the mean and deviation stan-dard were calculated. Difference significance (P a 0.05) offatty acid was determined by one-way analysis of variance(ANOVA). Statistical analysis was carried out by SPSS soft-ware (Chicago, IL, USA).
3 Results and discussion
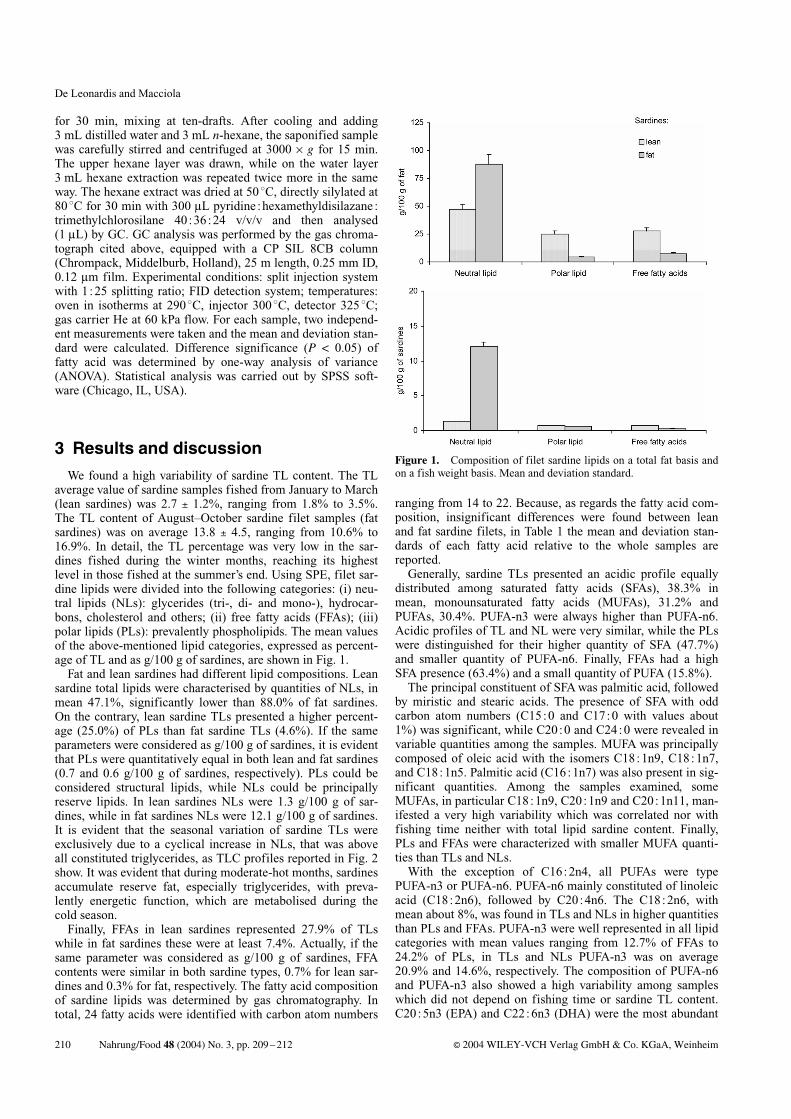
We found a high variability of sardine TL content. The TLaverage value of sardine samples fished from January to March(lean sardines) was 2.7 l 1.2%, ranging from 1.8% to 3.5%.The TL content of August–October sardine filet samples (fatsardines) was on average 13.8 l 4.5, ranging from 10.6% to16.9%. In detail, the TL percentage was very low in the sar-dines fished during the winter months, reaching its highestlevel in those fished at the summer’s end. Using SPE, filet sar-dine lipids were divided into the following categories: (i) neu-tral lipids (NLs): glycerides (tri-, di- and mono-), hydrocar-bons, cholesterol and others; (ii) free fatty acids (FFAs); (iii)polar lipids (PLs): prevalently phospholipids. The mean valuesof the above-mentioned lipid categories, expressed as percent-age of TL and as g/100 g of sardines, are shown in Fig. 1.Fat and lean sardines had different lipid compositions. Lean
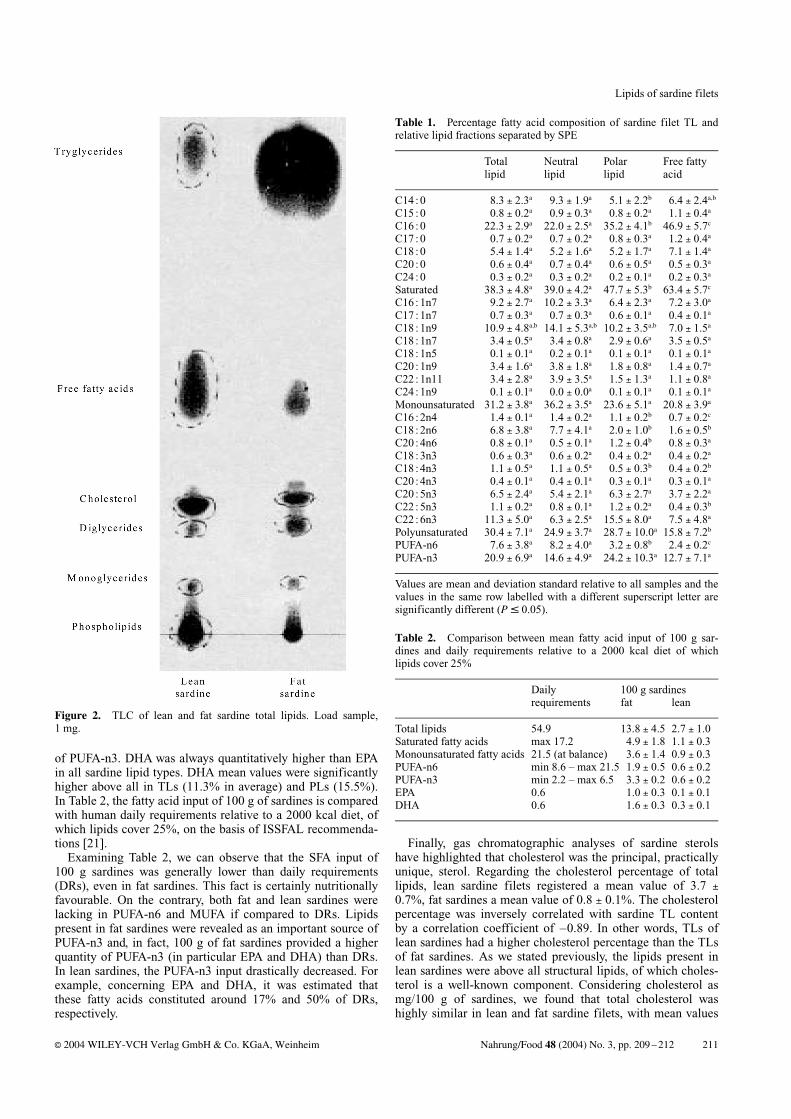
sardine total lipids were characterised by quantities of NLs, inmean 47.1%, significantly lower than 88.0% of fat sardines.On the contrary, lean sardine TLs presented a higher percent-age (25.0%) of PLs than fat sardine TLs (4.6%). If the sameparameters were considered as g/100 g of sardines, it is evidentthat PLs were quantitatively equal in both lean and fat sardines(0.7 and 0.6 g/100 g of sardines, respectively). PLs could beconsidered structural lipids, while NLs could be principallyreserve lipids. In lean sardines NLs were 1.3 g/100 g of sar-dines, while in fat sardines NLs were 12.1 g/100 g of sardines.It is evident that the seasonal variation of sardine TLs wereexclusively due to a cyclical increase in NLs, that was aboveall constituted triglycerides, as TLC profiles reported in Fig. 2show. It was evident that during moderate-hot months, sardinesaccumulate reserve fat, especially triglycerides, with preva-lently energetic function, which are metabolised during thecold season.Finally, FFAs in lean sardines represented 27.9% of TLs
while in fat sardines these were at least 7.4%. Actually, if thesame parameter was considered as g/100 g of sardines, FFAcontents were similar in both sardine types, 0.7% for lean sar-dines and 0.3% for fat, respectively. The fatty acid compositionof sardine lipids was determined by gas chromatography. Intotal, 24 fatty acids were identified with carbon atom numbers
ranging from 14 to 22. Because, as regards the fatty acid com-position, insignificant differences were found between leanand fat sardine filets, in Table 1 the mean and deviation stan-dards of each fatty acid relative to the whole samples arereported.Generally, sardine TLs presented an acidic profile equally
distributed among saturated fatty acids (SFAs), 38.3% inmean, monounsaturated fatty acids (MUFAs), 31.2% andPUFAs, 30.4%. PUFA-n3 were always higher than PUFA-n6.Acidic profiles of TL and NL were very similar, while the PLswere distinguished for their higher quantity of SFA (47.7%)and smaller quantity of PUFA-n6. Finally, FFAs had a highSFA presence (63.4%) and a small quantity of PUFA (15.8%).The principal constituent of SFAwas palmitic acid, followed
by miristic and stearic acids. The presence of SFA with oddcarbon atom numbers (C15:0 and C17:0 with values about1%) was significant, while C20:0 and C24:0 were revealed invariable quantities among the samples. MUFA was principallycomposed of oleic acid with the isomers C18:1n9, C18:1n7,and C18:1n5. Palmitic acid (C16:1n7) was also present in sig-nificant quantities. Among the samples examined, someMUFAs, in particular C18:1n9, C20:1n9 and C20:1n11, man-ifested a very high variability which was correlated nor withfishing time neither with total lipid sardine content. Finally,PLs and FFAs were characterized with smaller MUFA quanti-ties than TLs and NLs.With the exception of C16:2n4, all PUFAs were type
PUFA-n3 or PUFA-n6. PUFA-n6 mainly constituted of linoleicacid (C18:2n6), followed by C20:4n6. The C18:2n6, withmean about 8%, was found in TLs and NLs in higher quantitiesthan PLs and FFAs. PUFA-n3 were well represented in all lipidcategories with mean values ranging from 12.7% of FFAs to24.2% of PLs, in TLs and NLs PUFA-n3 was on average20.9% and 14.6%, respectively. The composition of PUFA-n6and PUFA-n3 also showed a high variability among sampleswhich did not depend on fishing time or sardine TL content.C20:5n3 (EPA) and C22:6n3 (DHA) were the most abundant
Figure 1. Composition of filet sardine lipids on a total fat basis andon a fish weight basis. Mean and deviation standard.
Lipids of sardine filets
i 2004 WILEY-VCH Verlag GmbH & Co. KGaA, Weinheim Nahrung/Food 48 (2004) No. 3, pp. 209–212 211
of PUFA-n3. DHA was always quantitatively higher than EPAin all sardine lipid types. DHA mean values were significantlyhigher above all in TLs (11.3% in average) and PLs (15.5%).In Table 2, the fatty acid input of 100 g of sardines is comparedwith human daily requirements relative to a 2000 kcal diet, ofwhich lipids cover 25%, on the basis of ISSFAL recommenda-tions [21].Examining Table 2, we can observe that the SFA input of
100 g sardines was generally lower than daily requirements(DRs), even in fat sardines. This fact is certainly nutritionallyfavourable. On the contrary, both fat and lean sardines werelacking in PUFA-n6 and MUFA if compared to DRs. Lipidspresent in fat sardines were revealed as an important source ofPUFA-n3 and, in fact, 100 g of fat sardines provided a higherquantity of PUFA-n3 (in particular EPA and DHA) than DRs.In lean sardines, the PUFA-n3 input drastically decreased. Forexample, concerning EPA and DHA, it was estimated thatthese fatty acids constituted around 17% and 50% of DRs,respectively.
Finally, gas chromatographic analyses of sardine sterolshave highlighted that cholesterol was the principal, practicallyunique, sterol. Regarding the cholesterol percentage of totallipids, lean sardine filets registered a mean value of 3.7 l0.7%, fat sardines a mean value of 0.8 l 0.1%. The cholesterolpercentage was inversely correlated with sardine TL contentby a correlation coefficient of –0.89. In other words, TLs oflean sardines had a higher cholesterol percentage than the TLsof fat sardines. As we stated previously, the lipids present inlean sardines were above all structural lipids, of which choles-terol is a well-known component. Considering cholesterol asmg/100 g of sardines, we found that total cholesterol washighly similar in lean and fat sardine filets, with mean values
Table 1. Percentage fatty acid composition of sardine filet TL andrelative lipid fractions separated by SPE
Totallipid
Neutrallipid
Polarlipid
Free fattyacid
C14 :0 8.3 l 2.3a 9.3 l 1.9a 5.1 l 2.2b 6.4 l 2.4a,b
C15 :0 0.8 l 0.2a 0.9 l 0.3a 0.8 l 0.2a 1.1 l 0.4a
C16 :0 22.3 l 2.9a 22.0 l 2.5a 35.2 l 4.1b 46.9 l 5.7c
C17 :0 0.7 l 0.2a 0.7 l 0.2a 0.8 l 0.3a 1.2 l 0.4a
C18 :0 5.4 l 1.4a 5.2 l 1.6a 5.2 l 1.7a 7.1 l 1.4a
C20 :0 0.6 l 0.4a 0.7 l 0.4a 0.6 l 0.5a 0.5 l 0.3a
C24 :0 0.3 l 0.2a 0.3 l 0.2a 0.2 l 0.1a 0.2 l 0.3a
Saturated 38.3 l 4.8a 39.0 l 4.2a 47.7 l 5.3b 63.4 l 5.7c
C16 :1n7 9.2 l 2.7a 10.2 l 3.3a 6.4 l 2.3a 7.2 l 3.0a
C17 :1n7 0.7 l 0.3a 0.7 l 0.3a 0.6 l 0.1a 0.4 l 0.1a
C18 :1n9 10.9 l 4.8a,b 14.1 l 5.3a,b 10.2 l 3.5a,b 7.0 l 1.5a
C18 :1n7 3.4 l 0.5a 3.4 l 0.8a 2.9 l 0.6a 3.5 l 0.5a
C18 :1n5 0.1 l 0.1a 0.2 l 0.1a 0.1 l 0.1a 0.1 l 0.1a
C20 :1n9 3.4 l 1.6a 3.8 l 1.8a 1.8 l 0.8a 1.4 l 0.7a
C22 :1n11 3.4 l 2.8a 3.9 l 3.5a 1.5 l 1.3a 1.1 l 0.8a
C24 :1n9 0.1 l 0.1a 0.0 l 0.0a 0.1 l 0.1a 0.1 l 0.1a
Monounsaturated 31.2 l 3.8a 36.2 l 3.5a 23.6 l 5.1a 20.8 l 3.9a
C16 :2n4 1.4 l 0.1a 1.4 l 0.2a 1.1 l 0.2b 0.7 l 0.2c
C18 :2n6 6.8 l 3.8a 7.7 l 4.1a 2.0 l 1.0b 1.6 l 0.5b
C20 :4n6 0.8 l 0.1a 0.5 l 0.1a 1.2 l 0.4b 0.8 l 0.3a
C18 :3n3 0.6 l 0.3a 0.6 l 0.2a 0.4 l 0.2a 0.4 l 0.2a
C18 :4n3 1.1 l 0.5a 1.1 l 0.5a 0.5 l 0.3b 0.4 l 0.2b
C20 :4n3 0.4 l 0.1a 0.4 l 0.1a 0.3 l 0.1a 0.3 l 0.1a
C20 :5n3 6.5 l 2.4a 5.4 l 2.1a 6.3 l 2.7a 3.7 l 2.2a
C22 :5n3 1.1 l 0.2a 0.8 l 0.1a 1.2 l 0.2a 0.4 l 0.3b
C22 :6n3 11.3 l 5.0a 6.3 l 2.5a 15.5 l 8.0a 7.5 l 4.8a
Polyunsaturated 30.4 l 7.1a 24.9 l 3.7a 28.7 l 10.0a 15.8 l 7.2b
PUFA-n6 7.6 l 3.8a 8.2 l 4.0a 3.2 l 0.8b 2.4 l 0.2c
PUFA-n3 20.9 l 6.9a 14.6 l 4.9a 24.2 l 10.3a 12.7 l 7.1a
Values are mean and deviation standard relative to all samples and thevalues in the same row labelled with a different superscript letter aresignificantly different (P f 0.05).
Figure 2. TLC of lean and fat sardine total lipids. Load sample,1 mg.
Table 2. Comparison between mean fatty acid input of 100 g sar-dines and daily requirements relative to a 2000 kcal diet of whichlipids cover 25%
Daily 100 g sardinesrequirements fat lean
Total lipids 54.9 13.8 l 4.5 2.7 l 1.0Saturated fatty acids max 17.2 4.9 l 1.8 1.1 l 0.3Monounsaturated fatty acids 21.5 (at balance) 3.6 l 1.4 0.9 l 0.3PUFA-n6 min 8.6 – max 21.5 1.9 l 0.5 0.6 l 0.2PUFA-n3 min 2.2 – max 6.5 3.3 l 0.2 0.6 l 0.2EPA 0.6 1.0 l 0.3 0.1 l 0.1DHA 0.6 1.6 l 0.3 0.3 l 0.1
De Leonardis and Macciola
212 Nahrung/Food 48 (2004) No. 3, pp. 209–212 i 2004 WILEY-VCH Verlag GmbH & Co. KGaA, Weinheim
of 88.0 l 12.2 and 97.5 l 9.2, respectively. In conclusion, thetotal cholesterol of 100 g sardine filets did not increase in rela-tion to the TL content and was on average significantly lowerthan the 300 mg DRs in both the lean and fat samples.
4 Concluding remarks
We examined the lipid composition of sardine filets fishedin the Adriatic Sea at different seasons. It was confirmed thatthe TL content of sardines is strongly subjected to seasonalfluctuations during the year. For this reason, based on the lipidcontent, it is preferable to classify sardines as lean (total lipidsa 4%) and fat (total lipids A 4%) ones. Seasonal variation ofsardine TL content is due exclusively to cyclical increasing ofNLs, particularly triglycerides. In general, Adriatic sardines inwinter-spring seasons are lean while in summer-autumn theyare fat. The TL content has an effect on the nutritional value ofsardines. The principal nutritional characteristics of sardinelipids are the presence of PUFA-n3, particularly EPA andDHA. Fat sardines provide significantly higher quantities ofEPA and DHA than the human DRs. Moreover, we can alsopoint out that in fat sardines, saturated fatty acids are presentin harmless quantities. In lean sardines, PUFA-n3 are drasti-cally reduced. In fact, lean sardine samples examined providedquantities of EPA and DHA meanly equal to 17% and 50% ofDRs. Finally, we also demonstrated that sardine cholesterol didnot increase in relation to the TL content.In conclusion, this study has highlighted that, under nutri-
tional aspects, in particular with regard to EPA and DHA input,it is preferable to consume sardines with at least 4% of TLs,those fished in summer. However, in the Adriatic Sea, sardinefishing is usually practiced in winter-spring months, when alsosardine reproduction is in process. Summer sardine fishing ishighly reduced because of the suspension of fishing activities,as established in an European Union agreement. Actually, inthe Adriatic Sea, this suspension, unfortunately, coincides withthe summer-autumn months. Without entering into a politicaldebate, our study suggests that the Adriatic sardine fishingcalendar should be reviewed in function of the sardine’s biolo-gical cycle and its nutritional properties.
This study was financially supported by a University of Moliseresearch fund for the year 2000.
5 References[1] Rafflenbeul, W., Eur. J. Lipid Sci. Technol. 2001, 103, 315–317.[2] Pigott, G., Tucker, B., Food Rev. Int. 1987, 3, 105–138.[3] Lands, W. E. M. (Ed.), Fish and Human Health, Academic Press,
Orlando, FL 1986.[4] Amerio, M., Ruggi, C., Baldini, C., It. J. Food Sci. 1996, 8, 221–
228.[5] International Society for the Study of Fatty Acids and Lipids:
Health message statement, ISSFAL Newsletter 1994, 1, 3–4.[6] British Nutrition Foundation Task Force: Unsaturated Fatty
Acids. Nutritional and Physiological Significance, BNF-Report,Chapman & Hall, London 1992.
[7] Ackman, R. G., in: Connell, J. J. (Ed.), Advances in Fish Sciencesand Technology, Fishing News Books Ltd., Farnham, UK 1980,pp. 86–103.
[8] Renon, P., Mortari, A., Mortarino, M., Biondi, P. A., IndustrieAlimentari 1991, 45, 1066–1071.
[9] Ruiz-Roso, B., Cuesta, I., Perez, M., Borrego, E., P�rez-Olleros,L., Varala, V., J. Sci. Food Agric. 1998, 77, 244–250.
[10] Saglik, S., Imre, S., J. Food Sci. 2001, 66, 210–212.[11] Whitehead, P. J. P., FAO Species Catalogue, Vol. 7, Pt. 1, 1985,
p. 303.[12] Arneri, E., FAO Fish. Rep. 1996, 553 (Suppl.) pp. 7–20.[13] Cingolani, N., Arneri, E., Giannetti, G., Santojanni, G., Belardi-
nelli, A., Biol. Mar. Medit. 1998, 5, 321–330.[14] Stamatopoulos, C., FAO Fish. Circ. 1995, 855.4 (Suppl.), p. 55.[15] Santojanni, A., Arneri, E., Belardinelli, A., Cingolani, N., Gian-
netti, G., Acta Adriatica 2001, 42, 52–60.[16] Bandarra, N. M., Batista, I., Nunes, M. L., Empis, J. M., Christie,
W. W., J. Food Sci. 1997, 62, 40–42.[17] G�mez-Meza, N., Higuera-Ciapara, I., Calderon del la Barca, A.
M., V�zquez-Moreno, L., Noriega-Rodriguez, J., Angulo-Guer-rero, O., Lipids 1999, 34, 639–642.
[18] Krzynowek, J., Uljua, D. S., Panunzio, L. J., Maney, R. S., J.Food Sci. 1992, 57, 63–65.
[19] Henderson, R. J., Tocher, D. R., Progr. Lipid Res. 1987, 26, 281–347.
[20] Nelson, G. J., in: Perkins, E. G. (Ed.), Analysis of Fats, Oils andDerivatives, AOCS Press, IL, USA 1993, pp. 20–59.
[21] International Society for the Study of Fatty Acids and Lipids:Recommendations for the essential fatty acid requirements forinfant formulae, ISSFAL Newsletter 1994, 1, 4–5.
Received September 29, 2003Accepted January 13, 2004