Embed Size (px)
Citation preview
A Tale of Minorities: Evidence on Religious Ethics andEntrepreneurship∗
Luca Nunziata†1,2 and Lorenzo Rocco‡1
1University of Padua2IZA
February 15, 2015
Abstract
Does Protestantism favour entrepreneurship more than Catholicism does? We provide
a novel way to answer this question by comparing Protestant and Catholic minorities
using Swiss census data from 1970 to 2000. Exploiting the strong adhesion of religious
minorities to their confessions’ ethical principles and the historical determination of the
geographical distribution of confessions across Swiss cantons, we find that Protestantism
is associated with a significantly higher propensity for entrepreneurship. The estimated
difference ranges between 1.5 and 3.6 percentage points. Our findings are robust to a
number of robustness checks, including a placebo test.
Keywords: Entrepreneurship, Self-employment, Religion, Culture, Protestantism, Catholi-
cism, Switzerland.
JEL Codes: Z12, J24, J21, Z13.
∗We thank Giulia Tura for excellent research assistance and two anonymous referees and the seminar partic-ipants at the University of Bologna, at the conference of the Association for the Study of Religion, Economics,and Culture in Orange, California and the European Society for Population Economics in Braga for commentsand suggestions. The usual disclaimer applies.†[email protected]‡[email protected]
1
1 Introduction
Economists and social scientists have often argued about the implications of religious ethics
on economic activity. In Weber’s view (Weber, 1904) the root of capitalism could be related
to the emergence of Protestant ethical principles. These principles were more compatible with
the secular activities attached to the new economic order than were those of Catholicism,
since the Protestant principles emphasised individualism and work ethic and were favourable
to individual achievement and success. However, some authors criticised Weber’s analysis
arguing that capitalistic development pre-dated the Reformation (Tawney, 1926) and most of
the evidence to date has failed to confirm Weber’s hypothesis.
Recent contributions have renewed the debate about the correctness of Weber’s thesis.
Becker and Woessmann (2009) suggest that Protestantism affected economic activity in Prussia
by increasing education through the precept of personal reading of the Bible rather than through
the ethical principles suggested by Weber. Andersen, Bentzen, Dalgaard, and Sharp (2013)
argue that the distribution of preferences for hard work and thrift in Europe nowadays fits
better with the distribution of the Cistercian monasteries (whose diffusion largely pre-dated
Reformation), than with the distribution of Reformation. Cantoni (2010)’s analysis of historical
German data finds no effect of Protestant ethic on economic growth. Arrunada (2010) points
out that Protestants work longer hours and have a stronger sense of the rule of law than
Catholics do. Basten and Betz (2013) exploit the conversion to Protestantism of part of a
previously homogeneous region in Western Switzerland occurred in the Sixtheen Century to
find that the area that remained Catholic is nowadays characterized by stronger preferences for
leisure and redistribution compared to that converted to Protestantism.
We add to this debate by investigating the relationship between religious ethic and one
fundamental feature of capitalism and the market economy, i.e. entrepreneurship. We broadly
define entrepreneurs to include all those individuals that risk on their own, self-organize their
work schedule, often manage dependent employees and are residual claimants of the results
of their ventures, in good and bad times. Hence, the entrepreneurs are captains of industry,
business leaders in any economic sector but also professionals and small business owners.
What are the individual motives for becoming an entrepreneur and does religious ethic play a
2
role? According to the economic literature on entrepreneurship, the fundamental determinants
of the individual decision to become entrepreneur are the presence of a generic entrepreneurship
ability and risk attitude. (See Parker, 2005 for a review). According to the psychological
literature, a propensity for entrepreneurship depends on individual psychological traits, such
as determination, risk aversion, the need for achievement, resilience, self-confidence, a sense
of independence and sense of life (McClelland, 1961; Cuervo, 2005; Renneboog and Spaenjers,
2012). McClelland (1961) suggests that all these attributes may be significantly influenced
by the ethical principles inherent in Protestantism and Catholicism. In this paper we test
this hypothesis and we ask whether and to what extent religious beliefs affect the decision of
becoming an entrepreneur.
The most relevant problem we see as inherent to this research question is that it is difficult
to determine how deeply individuals internalise religious ethical principles. Whatever their
formal affiliation to a particular confession, individuals can differ substantially in the degree to
which they adhere to their religion’s ethics and in the degree to which they take their religious
affiliations seriously. Typically, people tend to report the confession in which they were raised,
regardless of their current degree of adhesion. Therefore, religious affiliation is often a poor
proxy for the canons, ethics, and codes of conduct that each individual abides by.1
We propose a novel strategy to overcome such difficulty and, more generally, to identify the
causal effect of religious ethics on economic outcomes. Our research design exploits the fact that
religious minorities tend to adhere more strongly to their confessions’ ethical principles than
do those who practice the majority religion (see Nunziata and Rocco, 2014 and the references
therein) because religion is an important component of their identity that is worth defending
against the influence of the majority. In addition, ministers of minority religions must work
hard to preserve their herd, and minorities are subject to the pressure of the dominant religion
(or, more generally, of the dominant culture) that only the more observant are able to resist.
In comparing Catholic and Protestant minorities, we extract the differential effects of these
diverse ethical principles on the propensity for entrepreneurship, under the hypothesis that
religious minorities are alike in all other dimensions relevant to entrepreneurship.2
1For example, only 20 percent of western Europeans believe in life after death, although 70 percent areself-declared Christians (International Social Survey Programme Religion II data, 1998).
2Unlike Weber and other authors, we do not investigate the historical process that led to the development
3
Our analysis focuses on Switzerland to take advantage of a number of favourable factors.
First, Switzerland is homogeneous as regards its general economic conditions. It is one of the
richest and most prosperous countries in the world, a sort of miniature of Western Europe that
includes most of its linguistic groups, cultures and religions. In Switzerland entrepreneurs rep-
resent the upper-end of the occupational distribution.3 Second, Switzerland’s peculiar historical
and religious background led Swiss cantons to host a variety of combinations of Protestant and
Catholic minorities and majorities. Third, the confessions’ geographical distribution is histor-
ically determined with an almost perfect persistence over time. Fourth, Swiss Protestantism,
represented by the Swiss Reformed Church, is relatively homogeneous in terms of its ethical
principles, even though it derives from the Zwinglian tradition in the German cantons and from
the Calvinist tradition in the French cantons.
Our analysis of Swiss Census data from 1970 to 2000 shows that religious ethics significantly
affects economic behaviour and outcomes. Our findings indicate that adherence to Protestant
ethical principles increases the probability that an individual will be an entrepreneur by be-
tween 1.5 and 3.6 percentage points with respect to Catholics (compared to a proportion of
entrepreneurs equal to about 12 percent of all active individuals), after controlling for a number
of individual-level characteristics, including education and native language; geographical con-
trols, including local activity rate and the proportion of active people involved in agriculture;
and regional-by-time unobservable heterogeneity. Our results survive a long series of robustness
checks, including a placebo test, where religious affiliation is randomly assigned.
The paper is organised as follows. Section 2 provides a background discussion of the dif-
ferences between Protestantism and Catholicism in terms of their articles of faith and those
differences’ implications for entrepreneurship. The data are presented in section 3, the identi-
fication strategy in section 4, and our empirical results and robustness checks, respectively, in
sections 5, 6 and 7. Finally section 8 concludes.
of capitalism. Instead, we provide an empirical investigation of the religious ethical determinants of economicbehaviour in a contemporary economy.
3The proportion of entrepreneurs who engage in petty trades and ventures is minor: less than 2 percent areinvolved in elementary occupation according to the ISCO classification.
4
2 Background
In this section we compare Catholicism and Protestantism in terms of their basic theolog-
ical tenets and their key implications for their believers’ psychology, work ethic, and position
towards mundane success.
2.1 Catholicism and Protestantism
Catholicism and Protestantism share the same fundamental articles of faith, but they differ
substantially in how religion should be practically lived. According to the thirteen-volume The
New Schaff-Herzog Encyclopedia of Religious Knowledge by religious historians Johann Jakob
Herzog and Phillip Shaff, Protestantism:
retained from the Roman Catholic system all the objective doctrines of Chris-
tianity concerning the Trinity and the divine human character and work of Christ,
in fact, all the articles of faith contained in the Apostles’ and other ecumenical
creeds of the early church. But it joined issue with the prevailing soteriology, that
is, the application of the doctrines relating to Christianity [...]. It brought the be-
liever into direct relation and union with Christ as the one and all-sufficient source
of salvation, and set aside the doctrines of sacerdotal and saintly mediation and
intercession. [...] From this general principle of Evangelical freedom [...] proceed
the three fundamental doctrines of Protestantism—the absolute supremacy of (1)
the Word and of (2) the grace of Christ, and (3) the general priesthood of believers.
(“Protestantism” in Herzog and Schaff, 1908, vol. IX).
The Protestant Supremacy of the Word states that the scriptures are the only source of faith
and establishes the right to individual interpretation. This is in sharp contrast with Catholicism
which grounds faith on both the Bible and tradition and makes tradition, especially the decrees
of Popes and Councils, the only legitimate interpreter of the Word.
The Protestant supremacy of the grace of Christ affirms that salvation comes only and
directly from Christ and that it requires no mediation from the Church or the clergy, so it is a
5
“free” grace. The sinner is saved solely on the grounds of the merits of Christ. In Catholicism,
salvation depends instead on both faith and good works, stressing the role of works.
The Protestant universal priesthood of believers states that all Christians have the right
and the duty to read the Bible, proclaim it in public, and to take part in the government and
all public affairs of the Church. This contrasts with Catholicism, which is based on exclusive
priesthood authority, with priests being the necessary mediators between God and the people
(Herzog and Schaff, 1908).
The psychology of believers, the work ethic, and the appreciation of worldly success of each
confession are all influenced by these principles.
From a psychological perspective, the Catholic should have a more “collectivistic” personality
that values social connections and group affiliation, given that Catholicism emphasises the sense
of community and group rituality. As a result, Catholics should feel a deep sense of obligation
toward the community, which might induce them to subordinate individual desires to the
benefit of the collective good (Cohen and Hill, 2007 and references therein). Conversely, the
principles of personal relation with God and that of being the unique legitimate interpreter
of the Scriptures imply that the Protestant should have an individualistic personality, so the
Protestant worldview emphasizes personal goals, uniqueness, and personal control (Cohen and
Hill, 2007). The Protestant believes in the autonomy of his or her conscience, which is the
ultimate judge of his or her actions, even if they are in contrast with established political or
religious institutions. Protestantism is conducive to self-reflection, research, and investigations
and is less inclined to mysticism than Catholicism is.
As regards the work ethic, the two confessions differ markedly. According to the medieval
Catholic theology, Christianity is divided into two parts: those who have received the “calling”,
that is, the devout and the holy, whose life is to be monastic, focused on prayer and meditation
and entirely turned to God; and those who have not received the “calling”, who must live out
their lives as best they can in the secular world (Bonhoeffer, 1959).4
4The superiority of meditation over work derives from the ancient Greeks and Romans, who viewed workas dishonourable. (See, e.g., Canfora, 1989).
6
In medieval times work was seen as a punishment for man’s original sin (Tilgher, 1958).
This view has changed over the centuries, but work remains associated with toil and difficulty
in the Catholic tradition. Its merit is only that of allowing man to share Christ’s suffering on
the Cross:
“Sweat and toil, which work necessarily involves in the present condition of the
human race, present the Christian and everyone who is called to follow Christ with
the possibility of sharing lovingly in the work that Christ came to do” (John Paul
II, 1981, Laborem Exercens: Encyclical Letter of the Supreme Pontiff John Paul II
on Human Work).
In contrast, Protestantism, in both its streams of Calvinism and Lutheranism, perceives
work of whatever kind as honourable, necessary, and a service to God. Luther dismissed the
separation between the “called” and others and contended that all persons should see their
labour as their vocation; just as some are called to serve God in the religious ministry, others
are called to serve God through secular labours, and there is no spiritual distinction between
the two (Eaton, 2013).5
Catholicism and Protestantism differ also in their attitude towards the worldly success. The
monolithic and traditional Catholic Church tends to orient its members toward the hereafter,
so successful performance in the marketplace and the acquisition of the symbols of economic
achievement are of relatively little importance as an indication of the Catholic’s status after
death. On the other hand, Protestants are more concerned with worldly success, the attainment
of material possession, status, and the prestige that is associated with upward social mobility,
since these achievements are often viewed as signals of salvation (Mayer and Sharp, 1962).6
Acknowledging these differences, Weber thought that the “communitarian” ethic of the
Catholics impeded educational and economic achievement, while the “inner worldly asceti-
5Luther’s and Calvin’s views differed regarding the morality of trade activity. Luther looked at trade as away to take advantage of the needs of the others, while Calvin considered trade and commerce useful and thatthose engaged in trade provide a service to society at a risk to themselves.
6This is especially the case in Calvinism. According to the Calvinist concept of predestination, God decidesa person’s salvation or damnation before his or her birth, but it is hidden to the person, who can do nothing toalter his or her fate. Worldly success is regarded as a sign of being among the select group that will be savedfrom damnation by God (Becker and Woessmann, 2009; Arrunada, 2010).
7
cism” of the Protestants, with its emphasis on individual achievement facilitated their success
(Greeley, 1989). According to McClelland (1961) the Protestant work ethic’s ideas and val-
ues determine the practices of teaching independence, delayed gratification and mastery, which
lead to strong motivations to achieve. These high achievers are likely to become successful
entrepreneurs (Furnham, 1987).
2.2 Implications for Entrepreneurship
In summary, the tenets of Protestantism should lead adherent Protestants to be more de-
termined to achieve success, more willing to work hard, more disciplined, and more focused
on their own self-realisation than are Catholics. Are these character traits favourable to en-
trepreneurship? Parker, 2004, 2005 summarises the current state of research on entrepreneur-
ship in economics, pointing out that we still do not have a clear answer to this question. The
decision to become an entrepreneur might depend on the individual’s exogenously distributed
entrepreneurship ability (Lucas, 1978), on the probability that a particular new venture will
survive (Holmes and Schmitz, 1990), or on the individual’s level of risk aversion, which influ-
ences how the trade-off between risk and returns is resolved (Kilhstrom and Laffont, 1979).
Character traits might be accommodated by all these models and might contribute to improv-
ing the models’ assumptions. For instance, the probability of a new venture’s survival might
depend on individual determination and willingness to succeed, or the individual disposition to
work hard might be central in the decision to adopt strategies of self-insurance, such as long
hours of work to limit the risk of failure (Parker and Belghitar, 2006).
The purpose of this paper is to provide an empirical answer to whether Protestantism,
because of its work ethic, its appreciation of worldly achievements, and its emphasis on indi-
vidualism, is more favourable to entrepreneurship than Catholicism is.
8
3 Data
We use four waves of the Swiss census carried out every ten years between 1970 and 2000
from the Swiss Federal Statistical Office (SFSO, 2013). Data include detailed information on
respondents’ education, occupation, household composition, place of residence, country of birth,
and religious affiliation.
In the dataset, which accumulates data from the four census waves and includes about 26
million observations, 89 percent of the Swiss respondents reported being Christian, 6 percent
atheist, and 2 percent Muslim. Among the Christians, 52 percent are Roman Catholic and 45
percent are Protestant (or, more precisely, members of the Reformed Church). Other Protestant
churches and communities account for another 2 percent, while Orthodox count for 1 percent.
The proportion of Christians dropped from 98 percent in 1970 to 94 percent in 1980, 88
percent in 1990, and 79 percent in 2000. At the same time, the proportion of atheists steadily
increased from 1 percent in 1970 to 11 percent in 2000. Similarly, the proportion of members of
other religions increased from 1 percent in 1970 to 10 percent in 2000 as a result of immigration,
especially from Muslim countries.
The proportion of Catholics, Protestants, and atheists, averaged across the sample period
between 1970 and 2000, is described in Table 1. In some urban cantons, such as Basel-Stadt,
Geneve, and to a lesser extent, Neuchatel, atheism markedly increased in 1990 and 2000 com-
pared to the previous census waves. In most of the other cantons the share of atheists remained
at around 5 percent or less, even in the most recent waves. Protestantism and Catholicism are
represented in all cantons. In most cases one or the other confession clearly prevails. In Aargau,
Basel-Landschaft, Basel-Stadt, Geneve, Glarus, Graubunden, Neuchatel, Thurgau, Vaud and
Zurich the distribution is more even.
TABLE 1 AROUND HERE
We define majority Protestant (resp. Catholic) as those Protestants who reside in a dis-
trict where at least 60 percent of the residents follow the same religion. We define minority
Protestants (resp. Catholic) as those Protestants who reside in a district where less than 25
9
percent follow the same religion.7 However, in our empirical analysis we check how alternative
definitions of majorities and minorities affect our estimates.
In most districts the presence of religious majorities and minorities was stable between 1970
and 2000. However, given that the proportions of Protestants and Catholics were declining in
those years, in the districts where the proportion of believers was close to the critical thresholds,
religious majorities and minorities are observed only in some census waves.
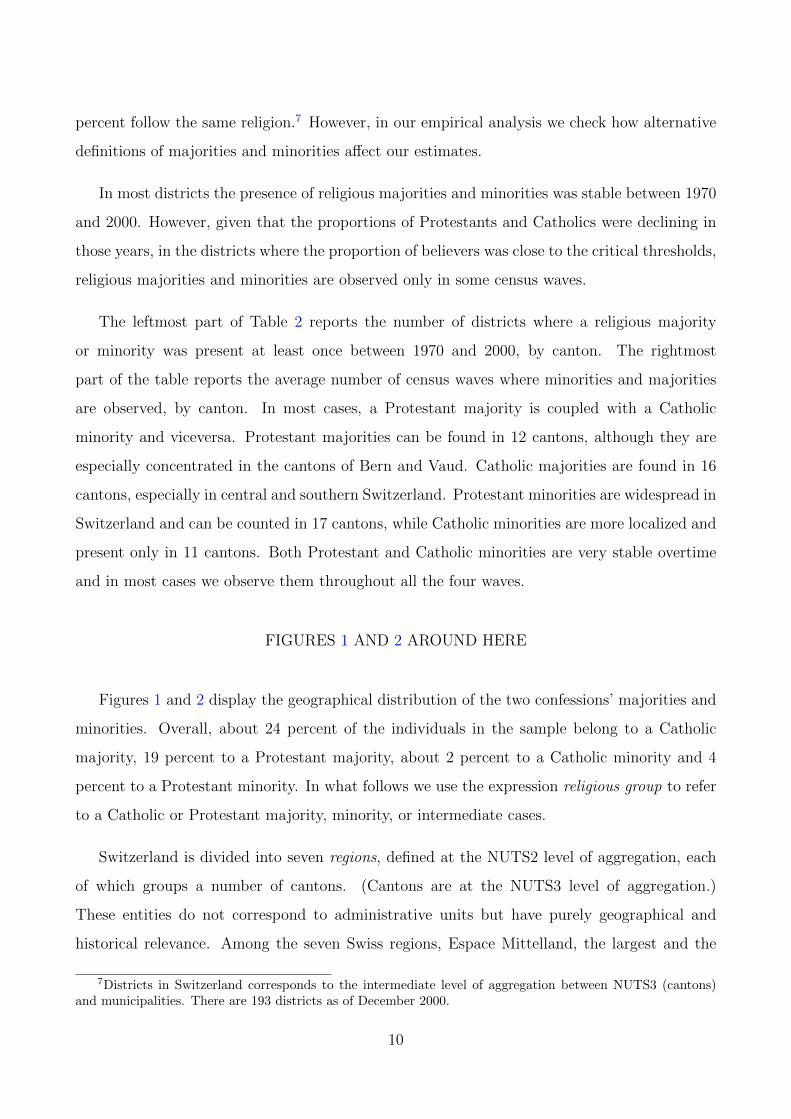
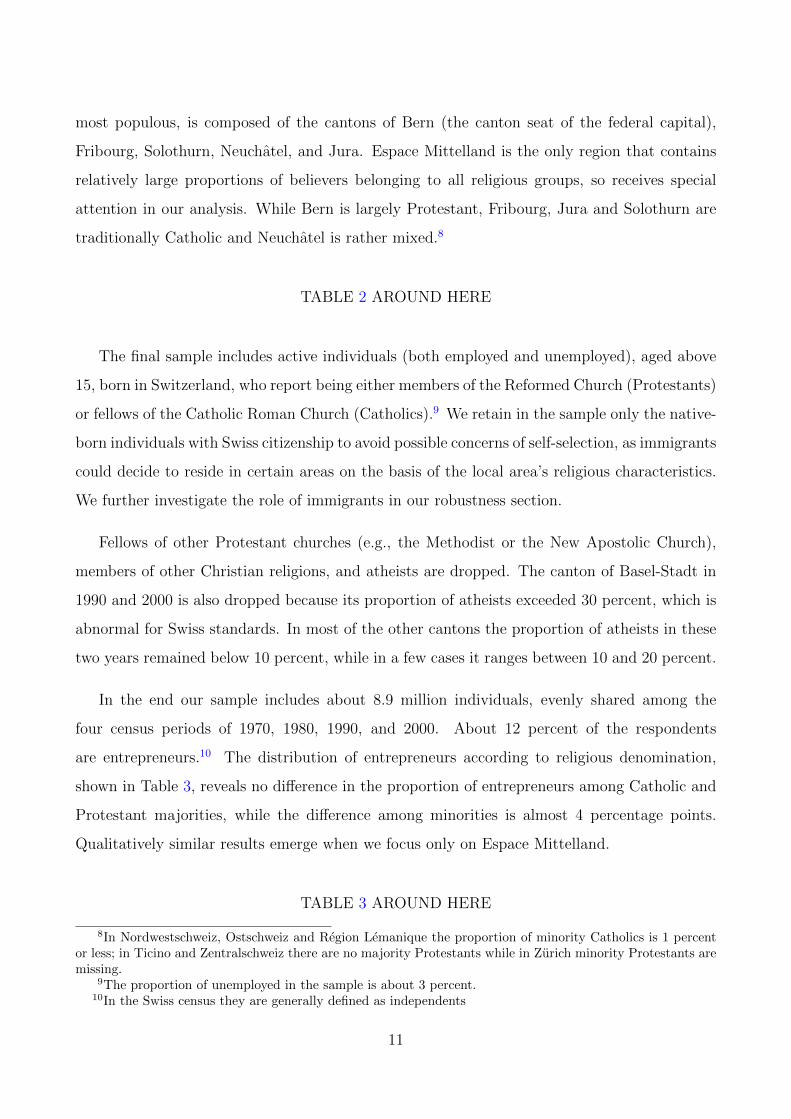
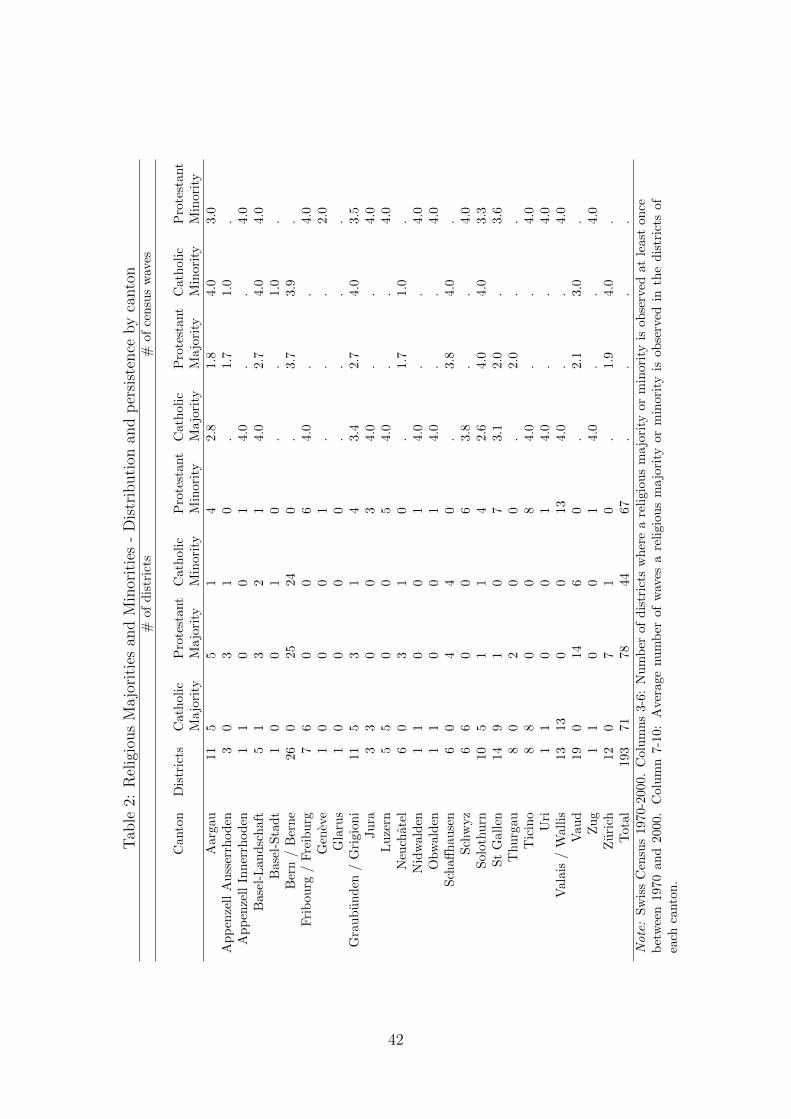
The leftmost part of Table 2 reports the number of districts where a religious majority
or minority was present at least once between 1970 and 2000, by canton. The rightmost
part of the table reports the average number of census waves where minorities and majorities
are observed, by canton. In most cases, a Protestant majority is coupled with a Catholic
minority and viceversa. Protestant majorities can be found in 12 cantons, although they are
especially concentrated in the cantons of Bern and Vaud. Catholic majorities are found in 16
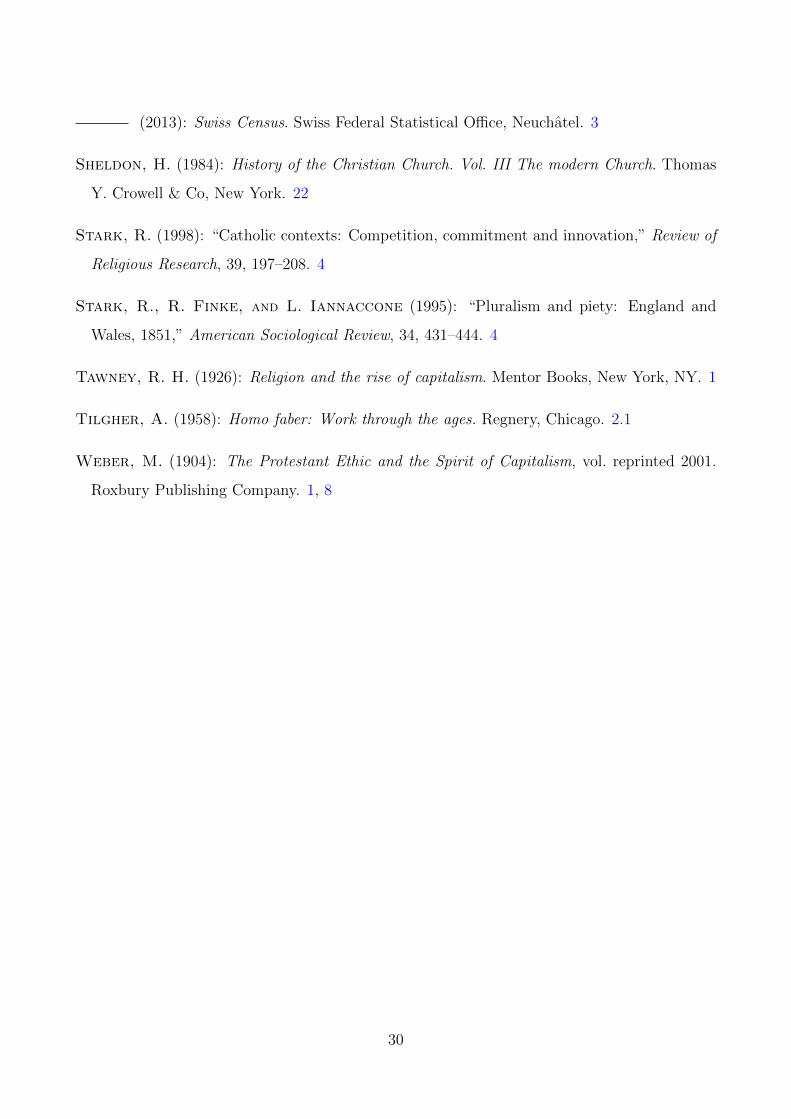
cantons, especially in central and southern Switzerland. Protestant minorities are widespread in
Switzerland and can be counted in 17 cantons, while Catholic minorities are more localized and
present only in 11 cantons. Both Protestant and Catholic minorities are very stable overtime
and in most cases we observe them throughout all the four waves.
FIGURES 1 AND 2 AROUND HERE
Figures 1 and 2 display the geographical distribution of the two confessions’ majorities and
minorities. Overall, about 24 percent of the individuals in the sample belong to a Catholic
majority, 19 percent to a Protestant majority, about 2 percent to a Catholic minority and 4
percent to a Protestant minority. In what follows we use the expression religious group to refer
to a Catholic or Protestant majority, minority, or intermediate cases.
Switzerland is divided into seven regions, defined at the NUTS2 level of aggregation, each
of which groups a number of cantons. (Cantons are at the NUTS3 level of aggregation.)
These entities do not correspond to administrative units but have purely geographical and
historical relevance. Among the seven Swiss regions, Espace Mittelland, the largest and the
7Districts in Switzerland corresponds to the intermediate level of aggregation between NUTS3 (cantons)and municipalities. There are 193 districts as of December 2000.
10
most populous, is composed of the cantons of Bern (the canton seat of the federal capital),
Fribourg, Solothurn, Neuchatel, and Jura. Espace Mittelland is the only region that contains
relatively large proportions of believers belonging to all religious groups, so receives special
attention in our analysis. While Bern is largely Protestant, Fribourg, Jura and Solothurn are
traditionally Catholic and Neuchatel is rather mixed.8
TABLE 2 AROUND HERE
The final sample includes active individuals (both employed and unemployed), aged above
15, born in Switzerland, who report being either members of the Reformed Church (Protestants)
or fellows of the Catholic Roman Church (Catholics).9 We retain in the sample only the native-
born individuals with Swiss citizenship to avoid possible concerns of self-selection, as immigrants
could decide to reside in certain areas on the basis of the local area’s religious characteristics.
We further investigate the role of immigrants in our robustness section.
Fellows of other Protestant churches (e.g., the Methodist or the New Apostolic Church),
members of other Christian religions, and atheists are dropped. The canton of Basel-Stadt in
1990 and 2000 is also dropped because its proportion of atheists exceeded 30 percent, which is
abnormal for Swiss standards. In most of the other cantons the proportion of atheists in these
two years remained below 10 percent, while in a few cases it ranges between 10 and 20 percent.
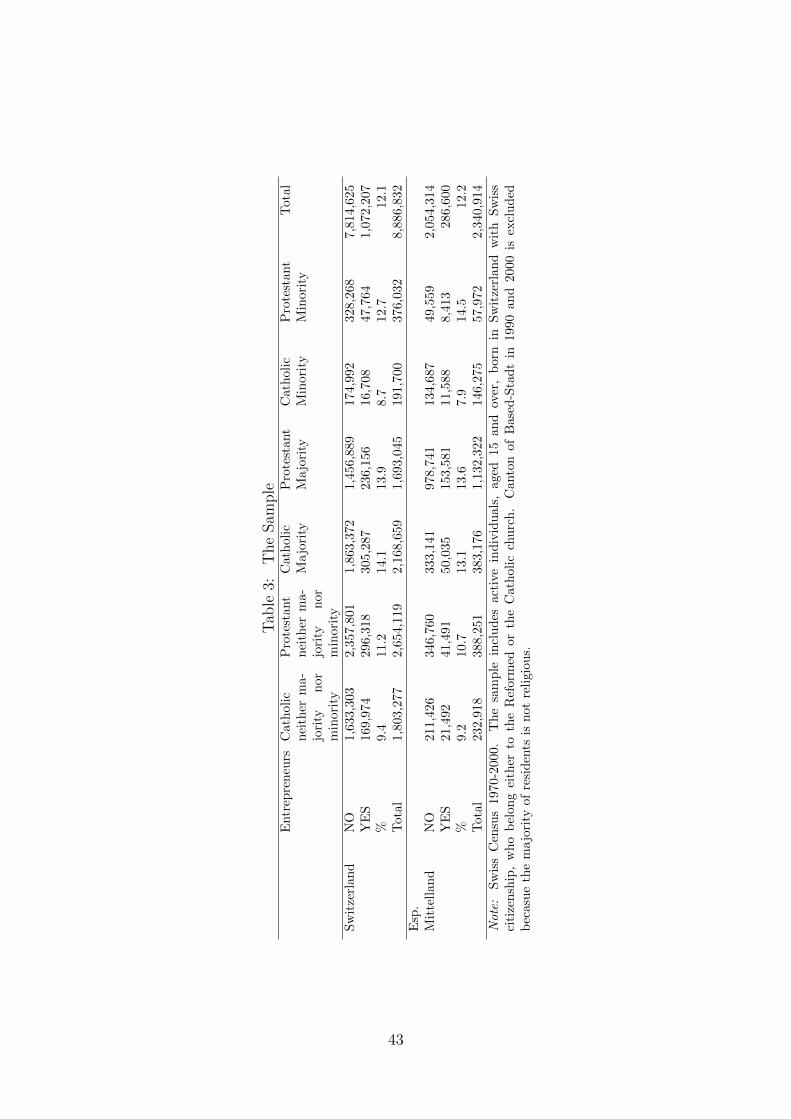
In the end our sample includes about 8.9 million individuals, evenly shared among the
four census periods of 1970, 1980, 1990, and 2000. About 12 percent of the respondents
are entrepreneurs.10 The distribution of entrepreneurs according to religious denomination,
shown in Table 3, reveals no difference in the proportion of entrepreneurs among Catholic and
Protestant majorities, while the difference among minorities is almost 4 percentage points.
Qualitatively similar results emerge when we focus only on Espace Mittelland.
TABLE 3 AROUND HERE
8In Nordwestschweiz, Ostschweiz and Region Lemanique the proportion of minority Catholics is 1 percentor less; in Ticino and Zentralschweiz there are no majority Protestants while in Zurich minority Protestants aremissing.
9The proportion of unemployed in the sample is about 3 percent.10In the Swiss census they are generally defined as independents
11
Further summary statistics regarding the respondents’ gender, age, native language, marital
status, and education are reported in Table 4 by religious group.
TABLE 4 AROUND HERE
Overall, the differences across religious groups in terms of age and gender are small. There
is some imbalance in respondents’ native languages since Protestantism is more frequent among
German speakers and less frequent among Italian and, to a smaller extent, French speakers.
University and secondary education degrees are more frequent among minorities than among
majorities, with only slight differences between the two confessions implying that the propor-
tion of individuals with at least a secondary degree is higher among minority Catholics (resp.
Protestants) than among majority Protestants (resp. Catholics) dismissing the concern that
minorities are economically or socially underprivileged compared to the majorities they live
close to.
4 Identification Strategy and the Model
A major issue that arises in investigating the economic implications of religious ethics is
that self-identification with a certain confession does not necessarily imply internalisation of its
ethical content, so the indications derived from a simple comparison of individuals’ reported
affiliations may be misleading. Indeed, self reported Protestant or Catholic individuals may not
represent the correct comparison groups in order to assess the economic consequences of adher-
ing to Protestant versus Catholic ethical principles simply because we have no certainty that
those individuals really adhere to their religious affiliation’s precepts and their denomination
may be simply a label without any ethical content.
Several religiousness-intensity indicators have been proposed in the literature to resolve this
inconsistency (McCleary and Barro, 2006), including the frequency of attendance at religious
services, weekly prayers, and donation of money and time to religious organisations, but most
are likely to be endogenous to labour market outcomes and cannot be used in our setting.
Our approach to identify the effect of Protestant ethics on entrepreneurship exploits two
12
facts: 1) the adhesion to religious norms and ethics is inversely related to the relative size of
the individual’s own religious group and 2) the geographic distribution of religious groups is
historically determined.
Concerning the first fact, there is evidence that minorities’ attachment to religious princi-
ples is particularly strong. Nunziata and Rocco (2014) document that members of religious
minorities in Europe declare themselves to be more religious, are more likely to believe in life
after death and heaven and hell, have more confidence in churches, pray more, and pray more
regularly than their non-minority counterparts do. In addition, minority Protestants tend to
agree more with the principles of the individual’s direct and unmediated relationship with God
(one tenet of Protestantism) than other Protestants do. As for Catholics, minority Catholics
believe more than other Catholics do that salvation can be achieved by means of good works
and that individual fate is not predetermined, which is a tenet of Catholicism. Finally, while
practically non-existent among majority denominations, transitions from one denomination to
another are more frequent among minorities. The pressure of the majority religion selects out
the less fervent, leaving only those with strong attachments to their religions in the minority.
At least three justifications rationalize this evidence. First, according to Bisin and Verdier
(2000), Bisin and Verdier (2001), and Bisin, Topa, and Verdier (2004), religion, along with
language, history and culture, is an important element of people’s identity, which may explain
the willingness of minorities to defend their religious identities against the influence of the
majority. Second, Stark, Finke, and Iannaccone (1995), Finke and Stark (1998), and Stark
(1998) suggest that a minority religion’s clergy works harder to preserve its followers than
does the clergy of a majority religion. Third, given that following a minority religion implies
continuous pressure from surrounding dominant religions, membership can be justified only if
the attachment to the faith is particularly strong.
As regards the second fact, the distribution of religious minorities and majorities in Switzer-
land between 1970 and 2000 closely follows the equilibrium found at the end of the religious
wars of the sixteenth and seventeenth centuries, which depended mainly on contingent histor-
ical conditions. (See the discussion on the history of the Swiss Reformation in Appendix A,
as well as in Cantoni, 2010 and Cantoni, 2011). Indeed, according to Schaff, the Swiss born
historian of the Christian Church, at the end of the religious wars
13
Seven Cantons —Luzern, Uri, Schwyz, Unterwalden, Zug, Fribourg, and So-
luthurn — remained firm to the faith of their ancestors [Catholicism]. Four Cantons,
including the two strongest —Zurich, Bern, Basel, and Schaffhausen— adopted the
Reformed faith. Five Cantons —Glarus, St. Gallen, Appenzell, Thurgau, and Aar-
gau— are nearly equally divided between the two Confessions. Of the twenty-three
subject towns and districts, only Morat and Granson became wholly Protestant,
sixteen retained their former religion, and five were divided. In the Graubunden
nearly two-thirds of the population adopted the Zwinglian Reformation [...]. Ti-
cino and Valais are Roman Catholic. In the French Cantons —Geneve, Vaud,
and Neuchatel— the Reformation achieved a complete victory, chiefly through the
labours of Calvin. Since the middle of the sixteenth century the numerical relation
of the two Churches has undergone no material change (Schaff, 1882, p. 118).
In addition, within-canton religious heterogeneity characterized Switzerland since the six-
teenth century for a number of reasons. The first and more important is the way Protestantism
spread in the country. According to Gordon (2003) “[...] the evangelical party was always a
minority movement; in every case its success was dependent on winning over the magistrates,
who would then impose the new religion. [...] The reform movement was neither broad-based
nor popular, and the reformers did not ever wish it to be. The evangelical movement spread
in the Swiss land though small networks of friends, most of humanist disposition, who saw
themselves as a fraternity committed to the reform of religion and society (ibidem, p. 86)”.
This implied that the penetration of Protestantism depended on the support of local powers
and on the reach of their authority: hence, even in the cantons that imposed religious uni-
formity, nonconforming religious minorities loyal to a different confession survived, at least in
those areas where authorities’ grip was looser. Second, the outcome of religious struggles in
the East, part of North and part of the West was the “de facto” adoption of the principle
of coexistence of Protestant and Catholic enclaves, although disputes continued until the late
Seventeen Century (Head, 1998). Third, Catholic counter-reformation was rather successful in
re-introducing Catholicism in early-converted Protestant areas. As a result, larger or smaller
religious minorities coexisted everywhere with religious majorities under different arrangements
(Pettegree, 2000).
14
FIGURES 3 AND 4 AROUND HERE
The historical persistence of the geographical distribution of confessions is evident in the
comparison of Figures 1 and 2 with Figures 3 and 4 which depict Protestant and Catholic areas
in Switzerland during the Reformation period (1536) and in the seventeenth century and the
eighteenth century. Persistence is neither surprising nor a Swiss-specific phenomenon, given
that minorities deliberately act to preserve their identity, a strategy that leads to “culturally
heterogeneous stationary populations” within a given territory as shown by Bisin and Verdier
(2000).11 These evidences suggest that the geographical distribution of religious groups observed
in recent times can be considered as historically determined, independent of current economic
conditions and local situations which can favor or discourage entrepreneurship.12
Exploiting the two facts discussed above, we suggest that if any differential effect of Protes-
tant ethics on entrepreneurship exists, it should be detected by comparing Protestant and
Catholic minorities. Possible effects specific to the status of minority per se will be wiped out
in the comparision.13
The empirical implementation of our research design can be illustrated by the diagram in
Figure 5. The probability that an individual will be an entrepreneur is measured on the vertical
axis, and the degree of adhesion to a religious ethic lies on the horizontal axis. The degree of
adhesion is a latent variable that is not directly observed.
FIGURE 5 AROUND HERE
In Figure 5, when the degree of adhesion is zero, the probability that an individual chooses
to be an entrepreneur is independent of religious ethics, whatever the religious affiliation. In
this case, the reported religious affiliation is merely a label that carries no specific religious
or ethical content. As the degree of adhesion increases, how Protestantism and Catholicism
11For instance within minorities, parents push their offsprings to privilege same-religion friends and individ-uals are pressed to marry same-religion partners.
12In the following sections we provide ample evidence on how entrepreneurship does not depend on thelocalization of Protestant and Catholic minorities in specific areas.
13Nunziata and Rocco (2014) provide ample evidence in support of the comparability of religious minorities.
15
influence entrepreneurship differs, and the full differential effect of Protestant ethics is found
between individuals with maximum religious attachment.14
Since the individual’s degree of adhesion is not observable, we turn to the share of resi-
dents who follow the individual’s religion. In particular, we focus on minorities among whom
we expect to find relatively large proportions of individuals with strong attachments to their
faiths, and on majorities among whom we expect to find the opposite. Thus, by comparing
Protestant and Catholic minorities (resp. majorities), we consider samples of individuals with
relatively high (resp. low) average degree of adhesion. If present, the differential effect of
Protestantism should emerge from the comparison of minorities. Conversely, the differential
effect of Protestantism versus Catholicism among majorities should be small or absent.
We operationalise the comparison of religious minorities (resp. majorities) by estimating
the following model:
Entridt = π0 + π1Pidt + π2Midt + π3midt + π4Midt × Pidt + π5midt × Pidt +Xidtβ + εidt (1)
where Entr is a dummy taking the value of 1 if individual i residing in district d at time
t is an entrepreneur; P is a dummy that takes the value of 1 if i is Protestant and 0 if i is
Catholic; M and m are dummies that take the value of 1 if i belongs to any majority confession
or any minority confession, respectively;15 and M ×P and m×P are interactions between the
majority/minority dummies and the Protestant dummy. The vector X includes the individual-
level controls of age, gender, education level, native language, and marital status, as well
as canton controls (activity rate and the proportion of active people involved in agriculture)
and region-by-time fixed effects. The error term εidt is allowed to be clustered within each
combination of canton/denomination.
The difference in the propensity for entrepreneurship among Protestant and Catholic mi-
14The relationship between entrepreneurship and religious attachment is assumed to be linear for expositionpurposes only, but linearity is not required.
15More precisely, these dummies take the value of 1 if the market share of individual i’s religion in i’s districtof residence at time t is larger than 60 percent or smaller than 25 percent, respectively. The majority/minoritydummies vary at the individual level since they depend on the individual’s particular religion. See the robustnesschecks in section 7 for results that adopt alternative thresholds and an alternative model specification.
16
norities, conditional to X, is our quantity of interest and can be written as:
E(Entridt|Pidt = 1,midt = 1, Xidt)− E(Entridt|Pidt = 0,midt = 1, Xidt) = π1 + π5 (2)
In what follows we refer to it as the differential effect of Protestantism on entrepreneurship
or the effect of Protestantism. The difference in the propensity for entrepreneurship among
Protestant and Catholic majorities, conditional to X, can be written as:
E(Entridt|Pidt = 1,Midt = 1, Xidt)− E(Entridt|Pidt = 0,Midt = 1, Xidt) = π1 + π4 (3)
This quantity represents a specification test statistic for our theory. Since our model predicts
that there is little internalisation of ethical principles among majorities, we should observe little
or no difference between the propensity for entrepreneurship between Protestant and Catholic
majorities. In what follows we refer to this quantity as the specification test.
5 Main Empirical Findings
Panel A in Table (5) reports our main results, that is, the estimated effect of Protestantism
on entrepreneurship and the specification test obtained when model (1) is estimated on four
alternative samples.16
Column (1) shows the full sample estimation, our baseline case, while column (2) refers to
Espace Mittelland, the region where all religious groups can be simultaneously observed and we
can estimate our effect of interest within a smaller and even more homogeneous area. Column
(3) focuses on German-speaking residents only in order to filter out broad cultural traits that
might differ among linguistic communities. Finally, column (4) drops the cantons of Basel-
Stadt and Geneve from the sample because of their relatively high proportion of atheists. In all
cases we find that Protestantism increases the propensity for entrepreneurship by an amount
between 1.5 and 3.6 percentage points. This is a sizeable effect considering that the share
of entrepreneurs in Switzerland is 12 percent. The specification test, given by the difference
16Appendix B provides a table of all main estimated coefficients.
17
in the propensity for entrepreneurship between Protestant and Catholic majorities, always
displays estimates that are not significantly different from zero. In other words, religious
ethics affects entrepreneurship only among minorities, that is, those who adhere closely to their
confessions’ ethical principles. No significant differences emerge when considering individuals
whose attachment to their confession is weak.
TABLE 5 AROUND HERE
These results are not driven by low-skill occupations (such as street vendors or shoe clean-
ers). When low-skill occupations—defined as ISCO categories 5 (service workers and shop
and market sale workers) and 9 (Elementary occupation)—are removed from the sample (see
Table 6), estimates actually slightly increase, ranging now from 1.7 to 4.6 percentage points.
This is consistent with the main difference between Protestantism’s and Catholicism’s work
ethic—that is, the emphasis on individuals’ achievements. In this case, too, our specification
tests always pass.
TABLES 6 AROUND HERE
6 Empirical Findings Under Alternative Definitions of
Minorities
Our main empirical findings are estimated under the assumption that religious minorities
and majorities are defined at the district level. Generally speaking, an individual belongs to
a religious minority when his or her denomination differs from the denomination prevailing in
the geographic area that he considers as salient. For instance, a Catholic residing at the heart
of the firmly Protestant canton of Bern will feel to belong to a minority if he or she considers
the canton as his or her area of reference. On the contrary he would not feel to belong to
a minority if his or her area of reference was Switzerland, where Catholicism is the largest
religious denomination.
18
Unfortunately, we do not know how wide is the geographical area that individuals consider
as salient in this context. The latter likely depends on their degree of mobility, on the number,
type and geographic distribution of their social ties, and on historical considerations. However,
since Switzerland is a federation of cantons which are jealous of their large autonomy and since
the historical diffusion of Protestantism initially followed a cantonal pattern (see Appendix B),
we believe we can safely exclude the national or the regional level as areas of reference.17
FIGURES 6 AND 7 AROUND HERE
Figures 6 and 7 show the geographical distribution of Protestant and Catholic minorities
and majorities when defined at different levels of sub-regional geographical aggregation, i.e. at
the canton, district and municipality level. Table A2 in the appendix displays some additional
information on the population shares of minorities and majorities defined at different levels
of geographical aggregation. We notice that the historical religious distribution represented
in Figures 3 and 4 compares very well with the current religious distribution when the latter
is represented by using districts as geographical units of reference. At the district level we
probably classify more correctly the condition of a number of religious enclaves, both Protestant
and Catholic, that are majority if taken at the district level and neither majority nor minority
if taken at the canton level, such as are those located in the cantons of Graubunden (Eastern
Swizerland), and Aargau, Zurich, Appenzell, Thurgau, St. Gallen (North-Eastern). The figures
reveal that a few of the areas that at the canton level are defined as neither majority nor
minority, at the district level are classified as minority or majority. At the municipality level
the classification becomes even finer, although it is harder to imagine that the geographical
area of reference of a Swiss citizen may be confined to his or her town or village only.18
Since we cannot exclude with certainty that the correct space of reference is the canton
or the municipality, we have then re-defined minorities and majorities at these geographical
levels and re-estimated model (1) to check whether our findings are robust to adopting a
more aggregate or a more disaggregate perspective. Results are reported in Panels B and
C of Table 5, respectively. As in Panel A (district level, the baseline), we find a significant
17Most Swiss residents were educated (77.6%) or work (54.2%) in the same municipality they reside. Only2.4% were educated and 8.9% work in a different Canton.
18The median municipality population in 2000 was 870.
19
effect of Protestantism among minorities and no effect among majorities, in all specifications.
Interestingly, the point estimates are larger (ranging between 2.8 and 5.7 percentage points)
when minorities and majorities are defined at the Canton level and smaller (between 1.1 and
3.1 percentage points) when minorities and majorities are defined at the municipality level.
FIGURE 8 AROUND HERE
A second aspect to consider are the thresholds we adopt to define minorities and majori-
ties. These thresholds influence the pool of districts we include when we compare Protestant
and Catholic minorities (resp. majorities), the number of observations that are classified as
minorities (resp. majorities) and the average degree of adhesion to religious principles, which,
according to our hypothesis, should decrease as the relative size of religious groups gets larger.
Figure (8) displays the differential effect of Protestantism versus Catholicism on entrepreneur-
ship among minorities, estimated from model (1) by moving the minority threshold 1 percent
by 1 percent from 5 to 49 percent, with majorities and minorities defined at the district level,
and the majority threshold set at 60 percent. The figure also reports the proportions of the
sample observations which are defined as Protestant and Catholic minorities respectively at
each minority threshold.
Apart from some instability at the threshold levels between 5 and 10 percent, due to the very
small number of minority Catholics for all thresholds below 10 percent, the differential effect
of Protestantism initially displays a plateau at about 3 percentage points and then decreases
and converges to zero as the minority threshold increases. The threshold at 25 percent, our
baseline, is conservative (it yields an estimated differential effect of Protestantism of about 2
percentage points) and corresponds to relatively large proportions of religious minorities which
warrant stable results.
TABLE 7 AROUND HERE
Further details are reported in Table 7, where we show the number of districts-year that host
majorities and minorities19 and the absolute number of observations belonging to each religious
19We consider the combinations of districts and year because in some districts we do not observe a religiousminority or majority in all waves.
20
group for alternative thresholds defining majorities and minorities, in addition to the usual
estimates. The differential effect of Protestantism between minorities remains almost unchanged
by moving the majority threshold from 55 percent to 65 percent. Similarly, the differential effect
of Protestantism between majorities is also very stable. By increasing the minority threshold,
the number of district-year combinations where a minority is registered increases steadily and
particularly so the number of district-year combinations that host Catholic minorities. This
is clearly visible in Figures 9 and 10 that display, respectively, the Protestant and Catholic
minority districts at alternative minority thresholds.
FIGURES 9 AND 10 AROUND HERE
One last relevant question regarding religious minorities in Switzerland is whether minority
individuals perceive themselves differently depending on the area they are located. For example,
minorities residing close to the border of areas where their religious denomination is majority
may perceive themselves differently from minorities surrounded by the opposite majority. In
this case, minority Protestants may feel less isolated if they are located on the border of a
majority Protestant area, and the same could apply to minority Catholics who live close to
majority Catholics. This may in turn affect their degree of adhesion to the ethical principles
of their denomination. Given that we assume those two types of minority to be homogeneous,
it is important to check whether this assumption holds. To this purpose, we test whether the
effect of Protestantism is heterogeneous when we differentiate between minority municipalities
confining with areas where their religion is majority and those located in internal enclaves.
Table 8 reports a battery of tests of heterogeneity between alternative sets of municipalities
located on and off the border. The first column focuses on two cantons that are characterized by
clear religious majorities and minorities, i.e. the Catholic canton of Lucerne and the Protestant
canton of Bern. We test whether the religion’s effect on entrepreneurship for minority Protestant
(resp. Catholic) individuals residing in the municipalities of Lucerne (resp. Bern) located on
the border with Bern (resp. Lucerne) is different from the effect estimated in the same cantons’
internal areas. In both cases our test fails to reject the null of homogeneity, indicating that
minorities on the border do not significantly differ from internal minorities. In the remaining
columns we perform similar tests on the whole territory of Switzerland comparing minority
21
individuals residing in municipalities located up to a certain distance from majority areas, and
minority individuals residing in the remaining minority areas. The municipalities considered in
each test are displayed in Figures A.1 and A.2 in the appendix. All tests show that the effects
of minority Protestantism and Catholicism are homogeneous, suggesting that the attitude of a
minority is not affected by the fact of living close to its own denomination’s majority.
TABLE 8 AROUND HERE
7 Robustness Checks
(A) Placebo Test
An important concern regarding the validity of our results is that the model may not pick
up the effect of religious ethics so much as the effect of some confounding factor, such as the
characteristics of the territories where the religious groups reside, which could be more or less
favorable to entrepreneurship. We have partly addressed this issue by focusing on Espace
Mittelland, a relatively homogeneous region that hosts all religious groups.
Furthermore, to determine whether the effect of Protestantism on entrepreneurship is spu-
rious, we performed a placebo test which randomly reshuffles individual religious affiliation for
each district and year. This reshuffling preserves the market shares of the religions and does not
alter the geographic distribution of majorities and minorities that is given. We have estimated
model (1) on the reshuffled data and checked whether a significant effect of religion results. The
presence of an effect would be an indication that the supposed influence of religious ethics on
entrepreneurship is in fact due to confounders, and not to religion. We repeated this operation
500 times, and the effect of Protestantism was significantly different from zero only in 2 percent
of the repetitions. We then repeated the placebo test, focusing on Espace Mittelland and on the
sample of German-speaking respondents only and found a significant effect of Protestantism
in less than 1 percent and less than 3 percent of the repetitions, respectively. Therefore, in
all cases we can reject the possibility of a spurious effect due to the fact that Protestant and
Catholic minorities are historically located in territories with different entrepreneurial vocation.
22
The same conclusion can be indirectly derived by contrasting the differential entrepreneurship
between minorities with that between majorities as obtained from our baseline model. The fact
that, systematically, the difference between minorities is significant and that between majori-
ties is not, contradicts the hypothesis that our results may be driven by underlying differences
in the territories where Protestants and Catholics are located, especially considering that the
geographic distribution of minorities and majorities overlaps almost perfectly, as discussed in
Section (3).
(B) Alternative Parametric Specification
To avoid specifying minority and majority thresholds altogether, we considered the following
alternative model specification:
Entridt = π0 + π1Pidt + π2Sidt + π3Pidt × Sidt +Xidtβ + εidt (4)
For this model, besides the usual Protestant vs Catholic dummy Pidt, we included Sidt, which
is the share of individuals who follow i’s religion in district d at time t, and the interaction
between the two. Based on our theory, we should observe a decline in the effect of Protestantism
compared to Catholicism as Sidt increases, and this prediction is confirmed by the estimates.
The effect of Protestantism is given by:
E(Entridt|Pidt = 1, Sidt = s,Xidt)− E(Entridt|Pidt = 0, Sidt = s,Xidt) =
= π1 + π3s = 0.0169− 0.0244s
(0.005) (0.011)
which is significantly different from zero for all s < 0.51. The point estimate at s = 0.51 is
quite small, i.e. 0.0044, while it is 0.011 at s = 0.25 and 0.014 at s = 0.10.
23
(C) Alternative Specifications and Samples.
One question that needs further investigation regards the implications of internal mobility.
We showed how today’s geographical distribution of religious denominations in Switzerland
is the clear result of the peculiar history of the country. However, it is important to check
whether our estimates are affected by internal mobility in order to respond to the concern of
the potential endogeneity of internal migration.
We find that internal mobility does not affect our results. When we limit the sample either
to those individuals residing in the same canton where they were born and to those residing in
the same canton for at least 5 years, results are very similar to the baseline (see column 1 and 2
of Panel A in Table 9). We also note that Protestants and Catholics have the same probability
to move across cantons and that mobility rate among entrepreneurs is slightly lower than in
the rest of the active population.20
Another issue to check is whether our results are driven by the fact that the pool of dis-
tricts hosting religious majorities and minorities partly changed over time due to the process of
secularization and immigration from non-christian countries. We have redefined religious ma-
jorities and minorities as follows. Majority Protestants (resp. Catholics) are those individual
who declare to be Protestant (resp. Catholic) and resides in districts where a Protestant (resp.
Catholic) majority was recorded in 1970 regardless of the subsequent evolution. The same is
done for minorities. Results are reported in column (3) and are again in line with those in the
baseline.
We also estimate an alternative model where the differences between Protestant and Catholic
majorities (resp. minorites) are captured by a more flexible specification of model (1), where
a set of interactions of Midt and midt with age, gender, marital status, education and mother
tongue are included. Again, our results, reported in column (4), are unchanged compared to
20By considering only native individuals with Swiss citizenship, we have almost completely removed the issueof mobility from abroad and especially from the Catholic countries of Southern Europe. However, due to datalimitations, our sample still includes second generation immigrants, who might have inherited a lower socialstatus by their parents. To evaluate the influence of second generation immigrants on our estimates, we haveestimated model (1) for 1970 only, i.e. when we expect the prevalence of second generation migrants to benegligible given that the most important immigration wave from Catholic countries to Switzerland took placeafter World War II (SFSO, 1998). Also in this case our results are almost identical to the baseline.
24
the baseline.
TABLE 9 AROUND HERE
In Panel B of Table 9 we have estimated our baseline model separately for the year 2000
alone, when the proportion of atheists is highest, and on the sample subsets of males, females
and adult males aged 30 and over. The estimates reported in column 1, i.e. when the analysis
focuses only on year 2000, are identical to the baseline. Estimates by gender (colums 2 and
3) show that the effect of Protestantism is significantly larger among males and stronger when
the sample is limited to adults males.21
(D) Former Holy Roman Empire Regions Estimates
Finally, in a companion paper (Nunziata and Rocco, 2014) we use European Social Survey
data to estimate the same model on the regions of the former Holy Roman Empire, i.e. Austria,
Belgium, the Czech Republic, Germany, Luxemburg, Slovenia, Trentino, the eastern part of
France, and the western Polish regions of Pomerania, Lubuskie, and Dolnoslaskie. Similarly to
Switzerland, religious traditions in the former Holy Roman Empire are historically determined
as a result of the establishment of the “cuius regio eius religio” (whose realm, his religion) rule,
which granted the rulers the right to decide the official and unique religion of their territories
after the Peace of Augsburg in 1555. After analysing the geographical persistence of religious
majorities and minorities in these regions, we estimate similar coefficients, even when we restrict
the sample to German regions only. Our estimated effects range between 3.6 (whole former
Holy Roman Empire sample) and 5.5 percentage points (German regions only).
8 Conclusions
This paper presents a novel methodology with which to determine the causal effect of
religious ethics on economic behaviour by investigating the implications of Protestantism versus
21About 10 percent of the entrepreneurs are 15-30 years of age.
25
Catholicism on entrepreneurship. Our research design on Swiss data is based on the minority
status of religious denominations across Swiss districts, exploiting the assumption that religious
minorities have a strong degree of attachment to religious ethics than do religious majorities.
The focus on Switzerland is motivated by its comparatively small size and homogeneous
economic environment where entrepreneurs represent the upper-end of the occupational distri-
bution; its variety of combinations of Protestant and Catholic minorities and majorities; the
confessions’ geographical distribution, which reflects an historically determined equilibrium; the
homogeneous ethical principles of Swiss Protestantism.
We find that that religious ethics play a significant role in explaining economic outcomes,
with Protestants being 1.5 to 3.6 percentage points more likely than Catholics to be en-
trepreneurs. These results stand after controlling for individual-level socio-economic charac-
teristics (including education and native language), local economic development and sectoral
composition, as well as institutions at the cantonal and regional level. They are also robust
across alternative specifications and to a number of robustness checks, including a placebo test.
We find no effect when Protestant and Catholic majorities are compared, suggesting that the
implications of religious ethical norms on economic outcomes emerge only when such norms are
fully internalized, as they tend to be among minority religions. Protestantism is found to signif-
icantly affect the probability that an individual will be an entrepreneur even when we exclude
low skilled occupations or we focus on German speakers or on the Espace Mittelland region
only, and our results do not depend on immigration patterns. In addition, our results stand
when we adopt different definitions of religious minority and majority and under an alternative
parametric specification that does not require to define any minority threshold.
Overall, our analysis shows that religious ethical principles may influence individual be-
haviour in the economic domain, providing empirical evidence in support of Weber (1904)’s
original thesis.
26
References
Andersen, T. B., J. Bentzen, C.-J. Dalgaard, and P. Sharp (2013): “Pre-Reformation
Roots of the Protestant Ethic,” Centre for Competitive Advantage in the Global Economy,
Department of Economics, The University of Warwick 137. 1
Arrunada, B. (2010): “Protestants and Catholics: Similar Work Ethic, Different Social
Ethic,” Economic Journal, 120, 890–918. 1, 6
Basten, C., and F. Betz (2013): “Beyond Work Ethic: Religion, Individual, and Political
Preferences,” American Economic Journal: Economic Policy, 5(3), 67–91. 1
Becker, S., and L. Woessmann (2009): “Was Weber Wrong? A Human Capital Theory of
Protestant Economic History,” The Quarterly Journal of Economics, 124(2), 531–596. 1, 6
Bisin, A., G. Topa, and T. Verdier (2004): “Religious Intermarriage and Socialization in
the United States,” Journal of Political Economy, 112(3), 615–664. 4
Bisin, A., and T. Verdier (2000): “Beyond The Melting Pot: Cultural Transmission, Mar-
riage, And The Evolution Of Ethnic And Religious Traits,” Quarterly Journal of Economics,
115(3), 955–988. 4
(2001): “The economics of cultural transmission and the dynamics of preferences,”
Journal of Economic Theory, 97, 298–319. 4
Bonhoeffer, D. (1959): The cost of discipleship. Collier Books, New York. 2.1
Canfora, L. (1989): Una societa premoderna. Lavoro, morale, scrittura in Grecia. Dedalo. 4
Cantoni, D. (2010): “The economic effects of the Protestant Reformation: Testing the We-
ber hypothesis in the German Lands,” Discussion paper, Economics Working Papers 1260,
Department of Economics and Business, Universitat Pompeu Fabra. 1, 4
(2011): “Adopting a new religion: The case of Protestantism in 16th Century Ger-
many,” Economics Working Papers 1265, Department of Economics and Business, Univer-
sitat Pompeu Fabra. 4
27
Cohen, A., and P. Hill (2007): “Religion as Culture: Religious Individualism and Collec-
tivism Among American Catholics, Jews, and Protestants,” Journal of Personality, 75(4),
709–742. 2.1
Cuervo, A. (2005): “Individual and Environmental Determinants of Entrepreneurship,” Inter-
national Entrepreneurship and Management Journal, 1, 293–311, 10.1007/s11365-005-2591-7.
1
Eaton, D. (2013): “The Economists of the Reformation: An Overview of Reformation Teach-
ing Concerning Work, Wealth, and Interest,” SAGE Open, pp. 1–9. 2.1
Finke, R., and R. Stark (1998): “Reply to Olson: Religious choice and competition,”
American Sociological Review, 63, 761–766. 4
Furnham, A. (1987): “The protestant work ethic: a review of the psychological literature,”
European Journal of Social Psychology, 14, 87–104. 2.1
Gordon, B. (2003): The Swiss Reformation. Manchester University Press. 4
Greeley, A. (1989): “Protestant and Catholic: Is the Analogical Imagination Extinct?,”
American Sociological Review, 54(4), 485–502. 2.1
Head, R. (1998): “Religious Coexistence and Confessional Conflict in the Vier Dorfer. Prac-
tices of Toleration in Eastern Switzerland, 1525-1615,” in Beyond the Persecuting Society:
Religious Toleration before the Enlightenment, ed. by J. C. Laursen, and C. J. Nederman.
University of Pennsylvania Press, Philadelphia. 4
Herzog, J. J., and P. Schaff (1908): The New Schaff-Herzog Encyclopedia of Religious
Knowledge. Funk and Wagnalls Company. 2.1
Holmes, T. J., and J. A. Schmitz (1990): “A theory of entrepreneurship and its application
to the study of business transfers,” Journal of Political Economy, 87, 265–294. 2.2
John Paul II (1981): Laborem Exercens: Encyclical Letter of the Supreme Pontif John Paul
II on Human Work. Catholic Truth Society. 2.1
Kilhstrom, R. E., and J. Laffont (1979): “A general equilibrium entrepreneurial theory
of firm formation based on risk aversion,” Journal of Political Economy, 87, 719–749. 2.2
28
Lucas, R. (1978): “On the size distribution of business firms,” Bell Journal of Economics, 9,
508–523. 2.2
Mayer, A., and H. Sharp (1962): “Religious Preference and Worldly Success,” American
Sociological Review, 27(2), 218–227. 2.1
McCleary, R. M., and R. J. Barro (2006): “Religion and Economy,” Journal of Economic
Perspectives, 20(2), 49–72. 4
McClelland, D. (1961): The Achieving Society. D. Van Nostrand, reprinted in 2010 by
Martino Fine Books, New York. 1, 2.1
Meyer, H. (1976): Der zweite kappeler Krieg: Die Krise der schweizerischen Reformation.
Hans Rohr, Zurich. 8
Nunziata, L., and L. Rocco (2014): “The Protestant Ethic and Entrepreneurship: Evidence
from Religious Minorities in the Former Holy Roman Empire,” Discussion Paper 53566,
MPRA. 1, 4, 13, 7
Parker, S. (2005): ““The Economics of Entrepreneurship: What We Know and What We
Don’t,” Foundations and Trends in Entrepreneurship, 1(1), 1–54. 1, 2.2
Parker, S., and Y. Belghitar (2006): “What happens to nascent entrepreneurs? An
econometric analysis of the PSED,” Small Business Economics, 27, 81–101. 2.2
Parker, S. C. (2004): The Economics of Self-Employment and Entrepreneurship. Cambridge
University Press, Cambridge, MA. 2.2
Pettegree, A. (2000): The Reformation World. Routledge. 4
Renneboog, L., and C. Spaenjers (2012): “Religion, Economic Attitudes, and Household
Finance,” Oxford Economic Papers, 64(1). 1
Schaff, P. (1882): History of the Christian Church. Vol. VIII: Modern Christianity. The
Swiss Reformation. Grand Rapids, MI: Christian Classics Ethereal Library. 4, 8
SFSO (1998): Two centuries of Swiss demographic history. Swiss Federal Statistical Office,
Neuchatel. 20
29
(2013): Swiss Census. Swiss Federal Statistical Office, Neuchatel. 3
Sheldon, H. (1984): History of the Christian Church. Vol. III The modern Church. Thomas
Y. Crowell & Co, New York. 22
Stark, R. (1998): “Catholic contexts: Competition, commitment and innovation,” Review of
Religious Research, 39, 197–208. 4
Stark, R., R. Finke, and L. Iannaccone (1995): “Pluralism and piety: England and
Wales, 1851,” American Sociological Review, 34, 431–444. 4
Tawney, R. H. (1926): Religion and the rise of capitalism. Mentor Books, New York, NY. 1
Tilgher, A. (1958): Homo faber: Work through the ages. Regnery, Chicago. 2.1
Weber, M. (1904): The Protestant Ethic and the Spirit of Capitalism, vol. reprinted 2001.
Roxbury Publishing Company. 1, 8
30
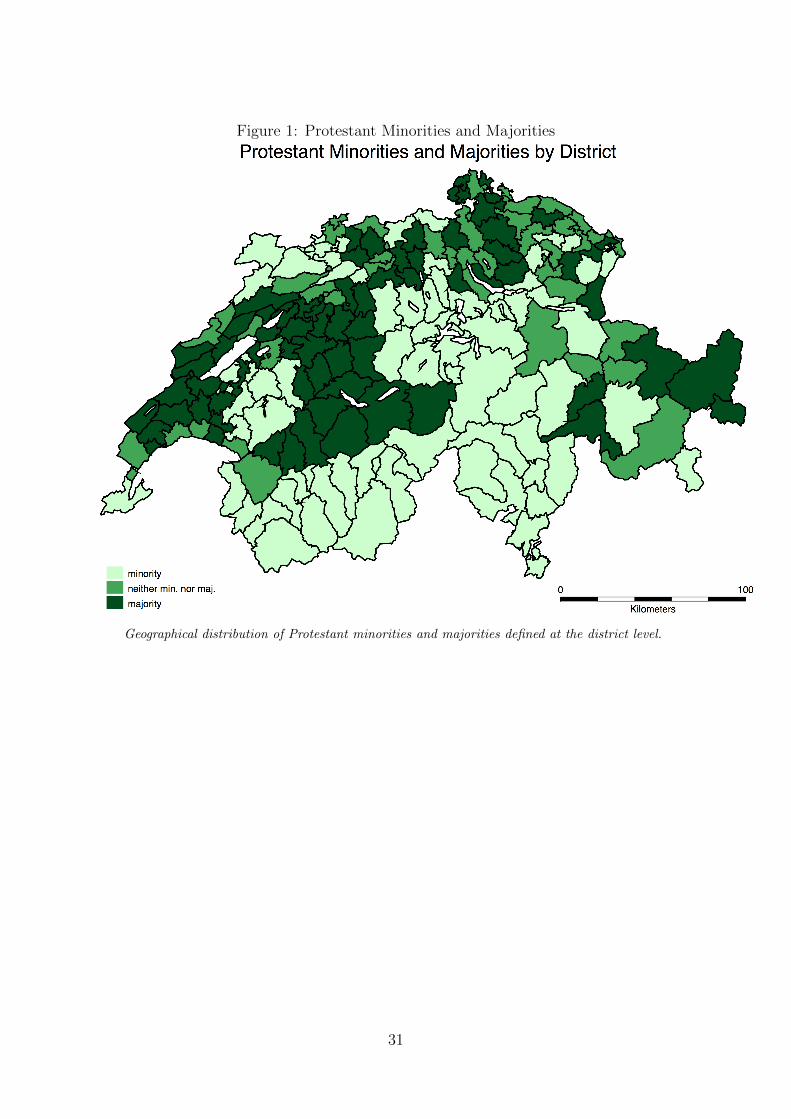
Figure 1: Protestant Minorities and Majorities
Geographical distribution of Protestant minorities and majorities defined at the district level.
31
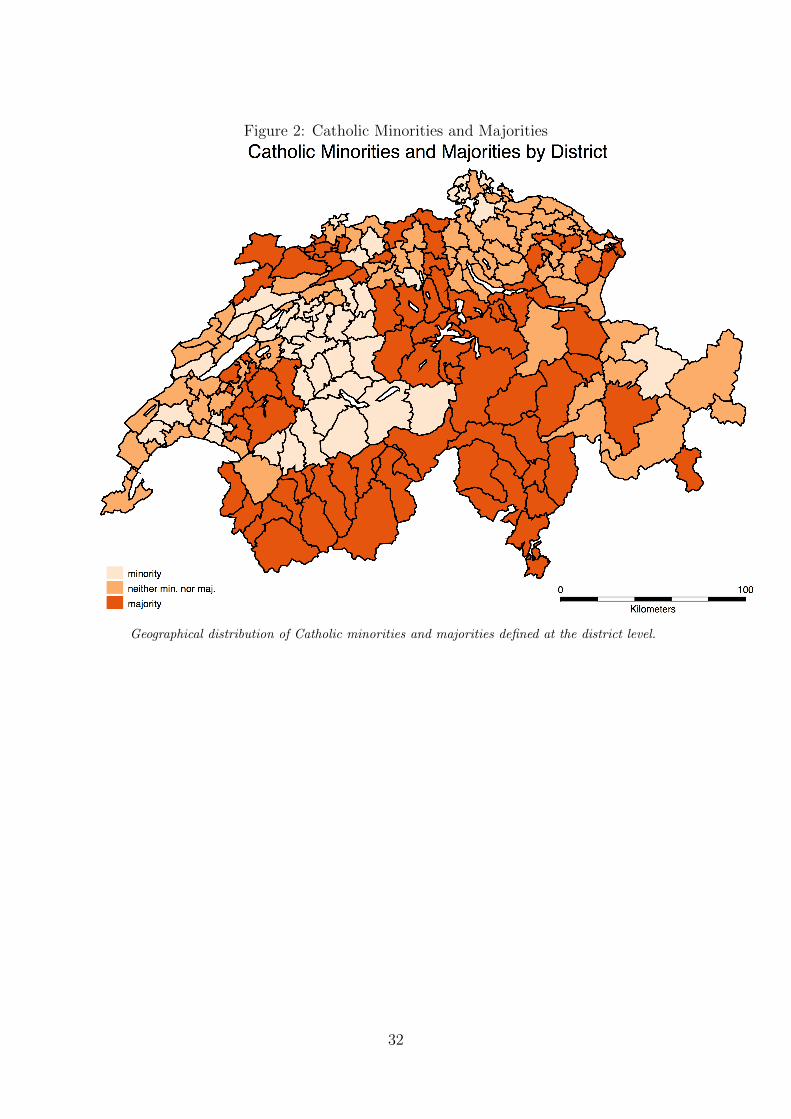
Figure 2: Catholic Minorities and Majorities
Geographical distribution of Catholic minorities and majorities defined at the district level.
32
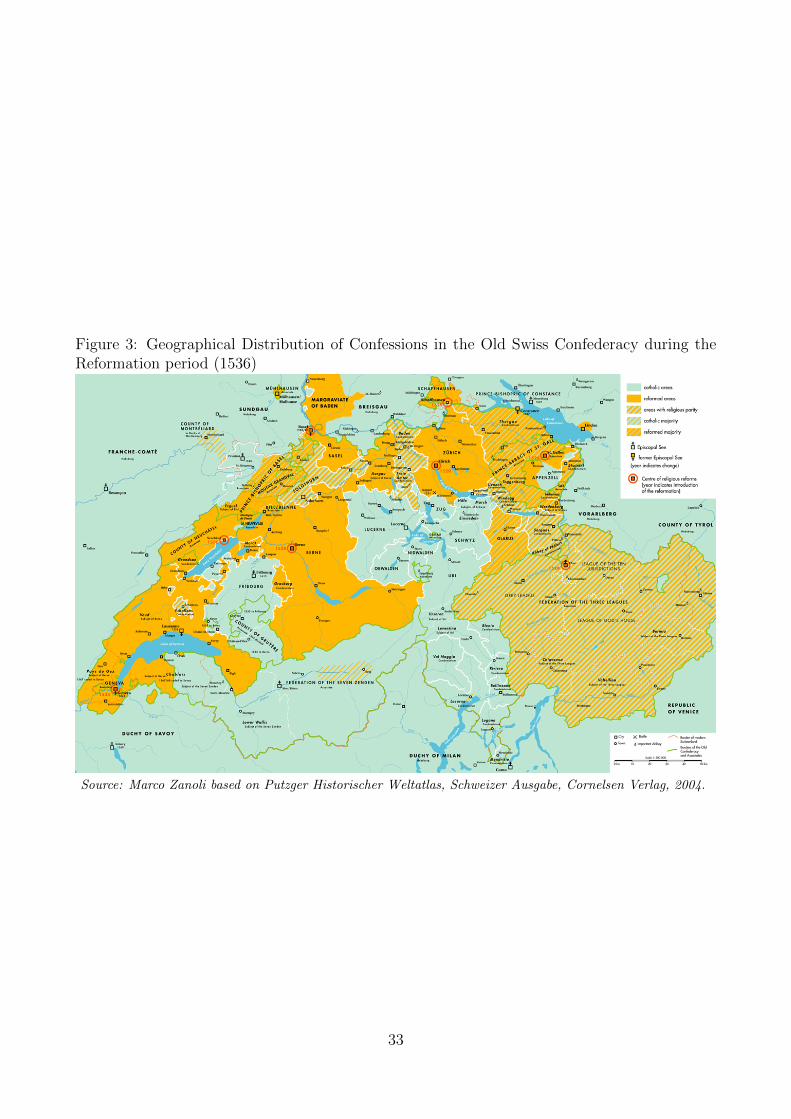
Figure 3: Geographical Distribution of Confessions in the Old Swiss Confederacy during theReformation period (1536)
Source: Marco Zanoli based on Putzger Historischer Weltatlas, Schweizer Ausgabe, Cornelsen Verlag, 2004.
33
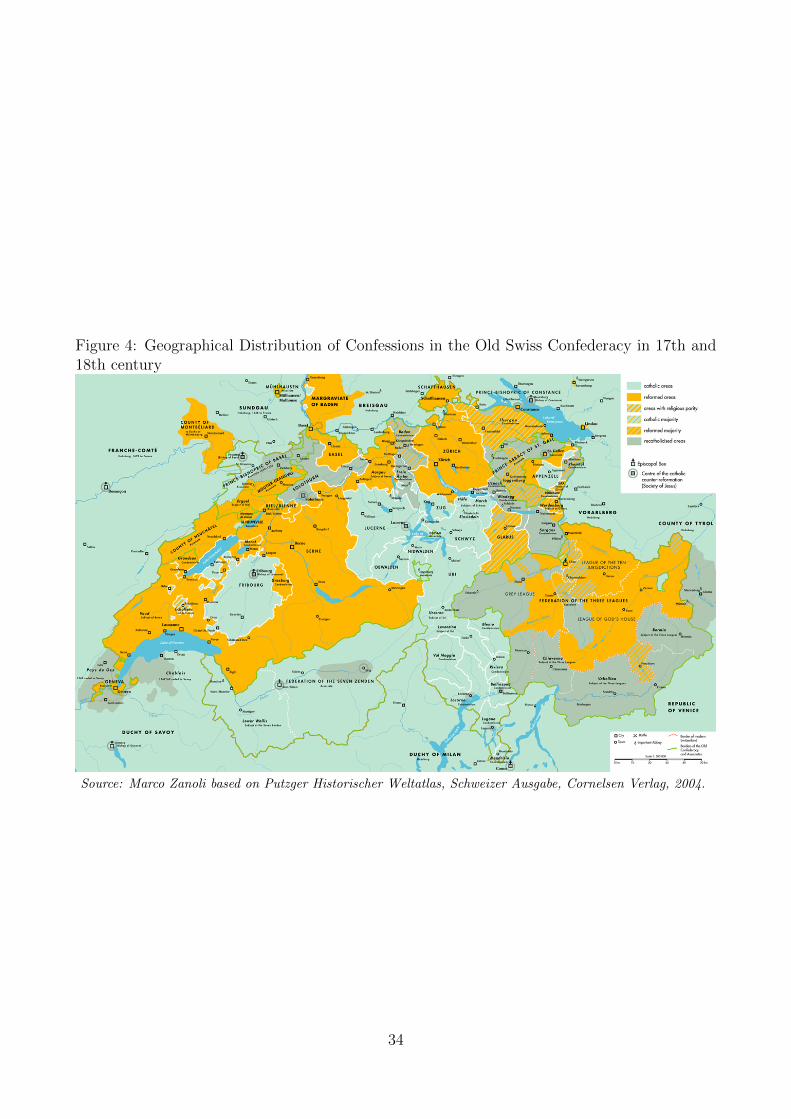
Figure 4: Geographical Distribution of Confessions in the Old Swiss Confederacy in 17th and18th century
Source: Marco Zanoli based on Putzger Historischer Weltatlas, Schweizer Ausgabe, Cornelsen Verlag, 2004.
34
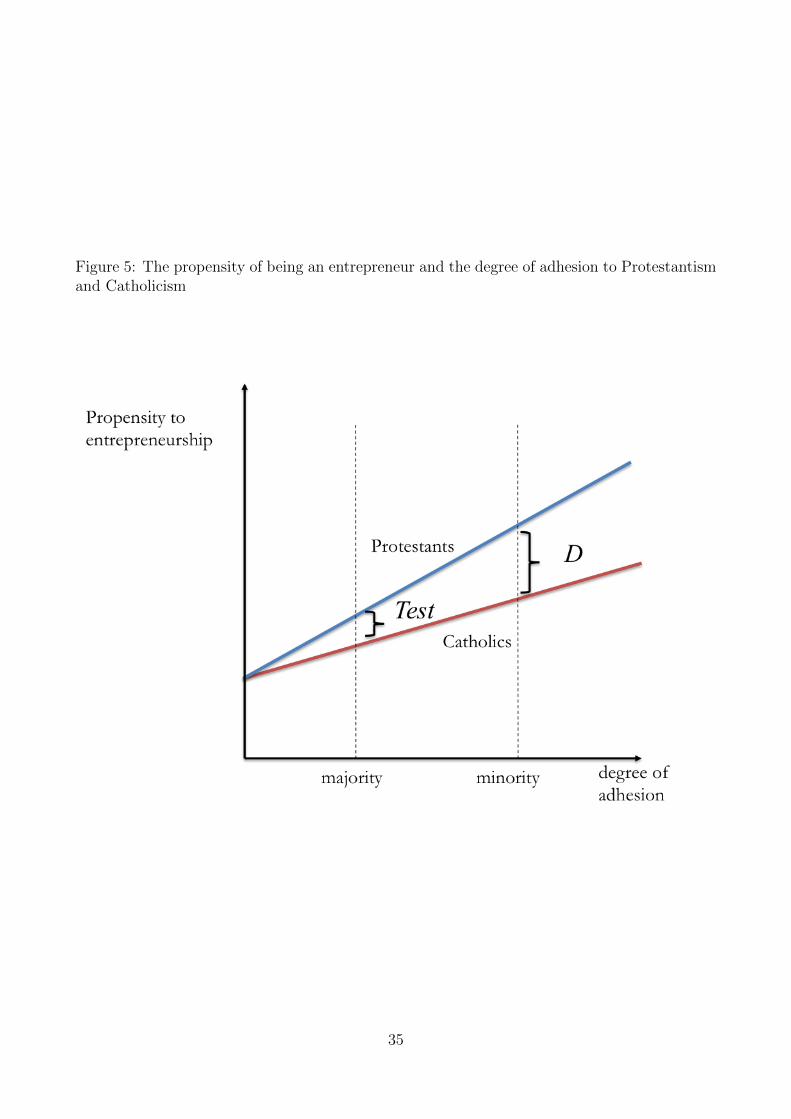
Figure 5: The propensity of being an entrepreneur and the degree of adhesion to Protestantismand Catholicism
35
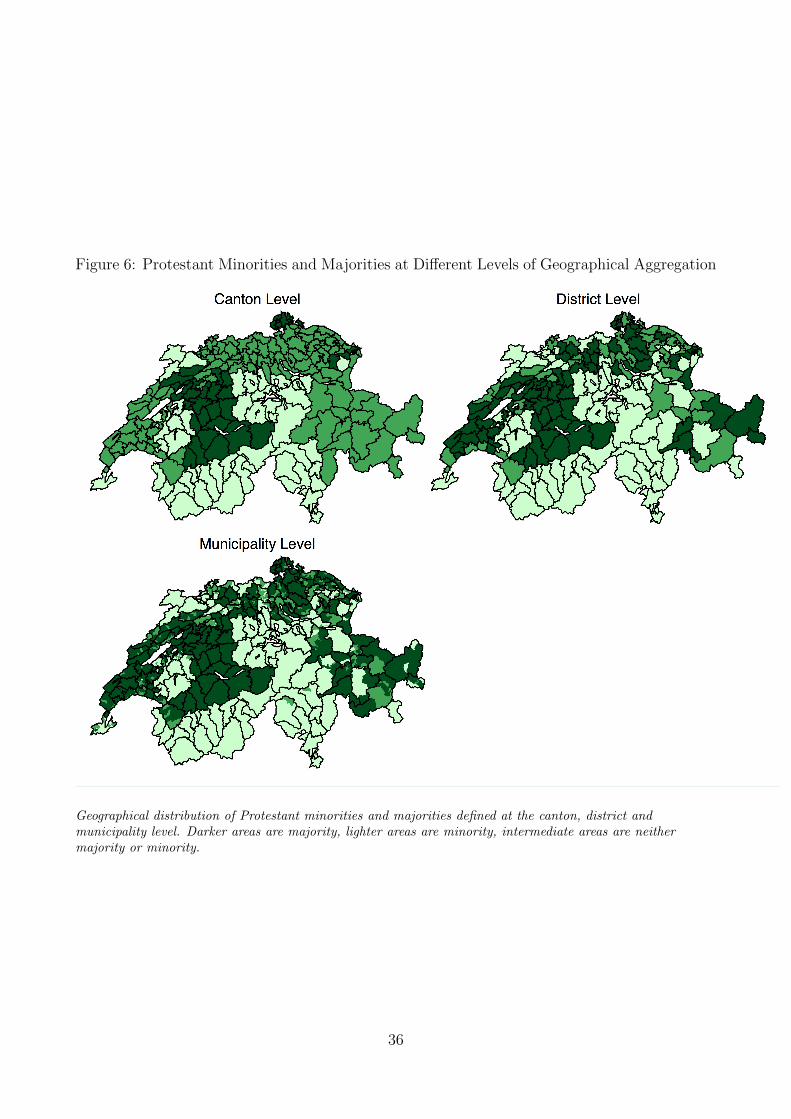
Figure 6: Protestant Minorities and Majorities at Different Levels of Geographical Aggregation
Geographical distribution of Protestant minorities and majorities defined at the canton, district andmunicipality level. Darker areas are majority, lighter areas are minority, intermediate areas are neithermajority or minority.
36
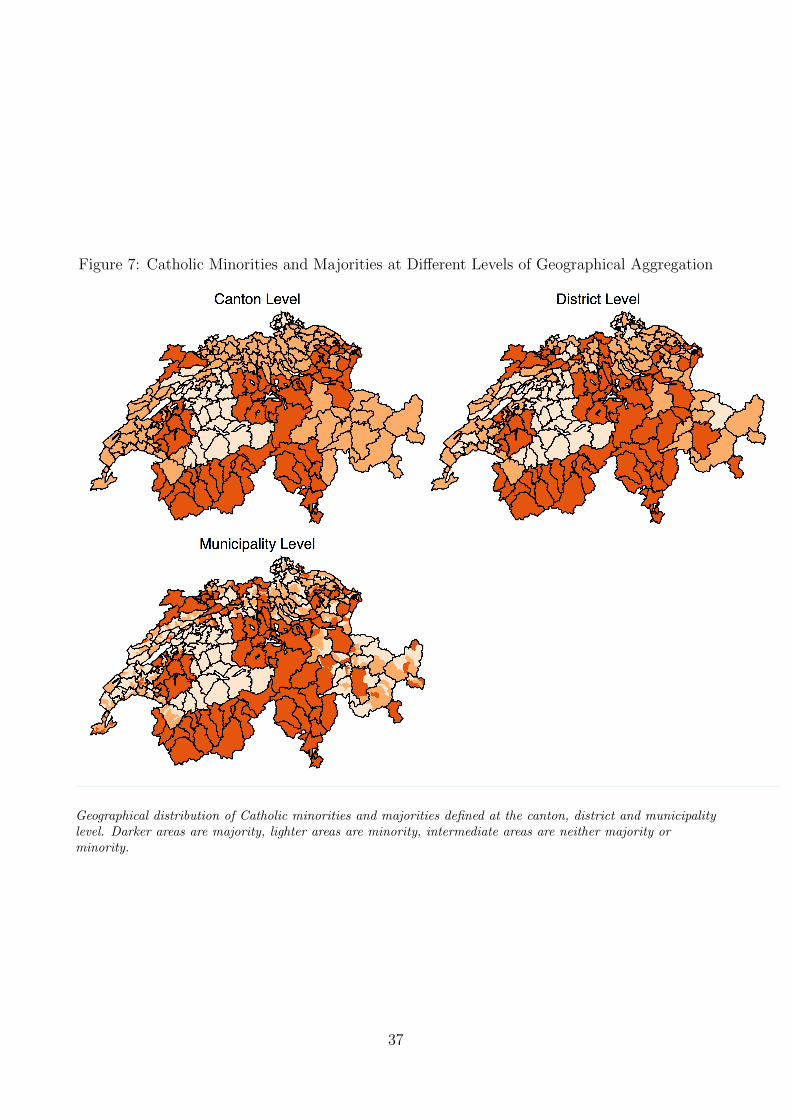
Figure 7: Catholic Minorities and Majorities at Different Levels of Geographical Aggregation
Geographical distribution of Catholic minorities and majorities defined at the canton, district and municipalitylevel. Darker areas are majority, lighter areas are minority, intermediate areas are neither majority orminority.
37
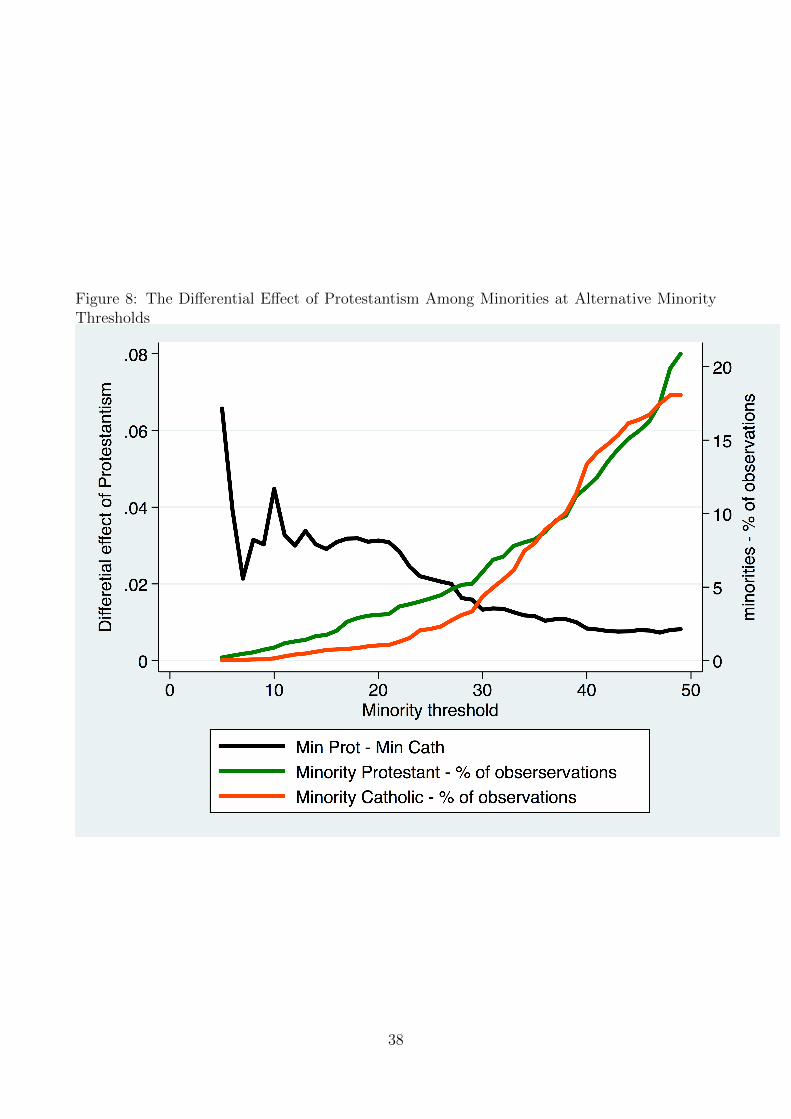
Figure 8: The Differential Effect of Protestantism Among Minorities at Alternative MinorityThresholds
38
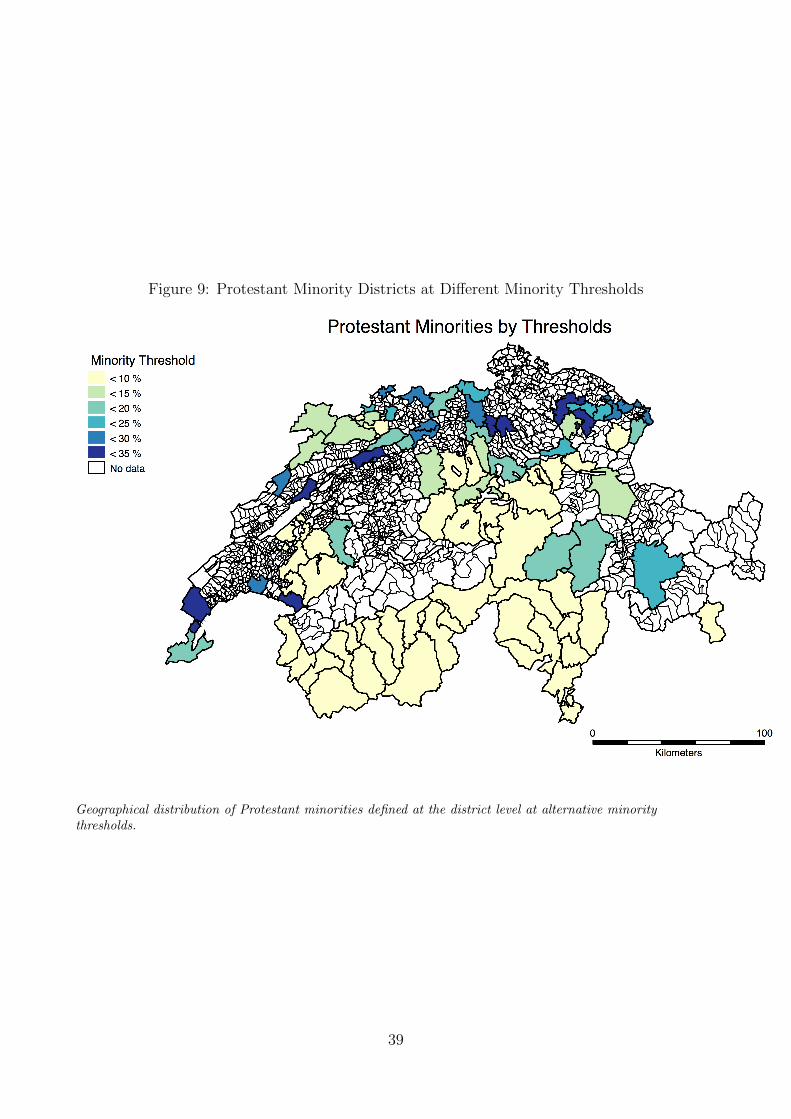
Figure 9: Protestant Minority Districts at Different Minority Thresholds
Geographical distribution of Protestant minorities defined at the district level at alternative minoritythresholds.
39
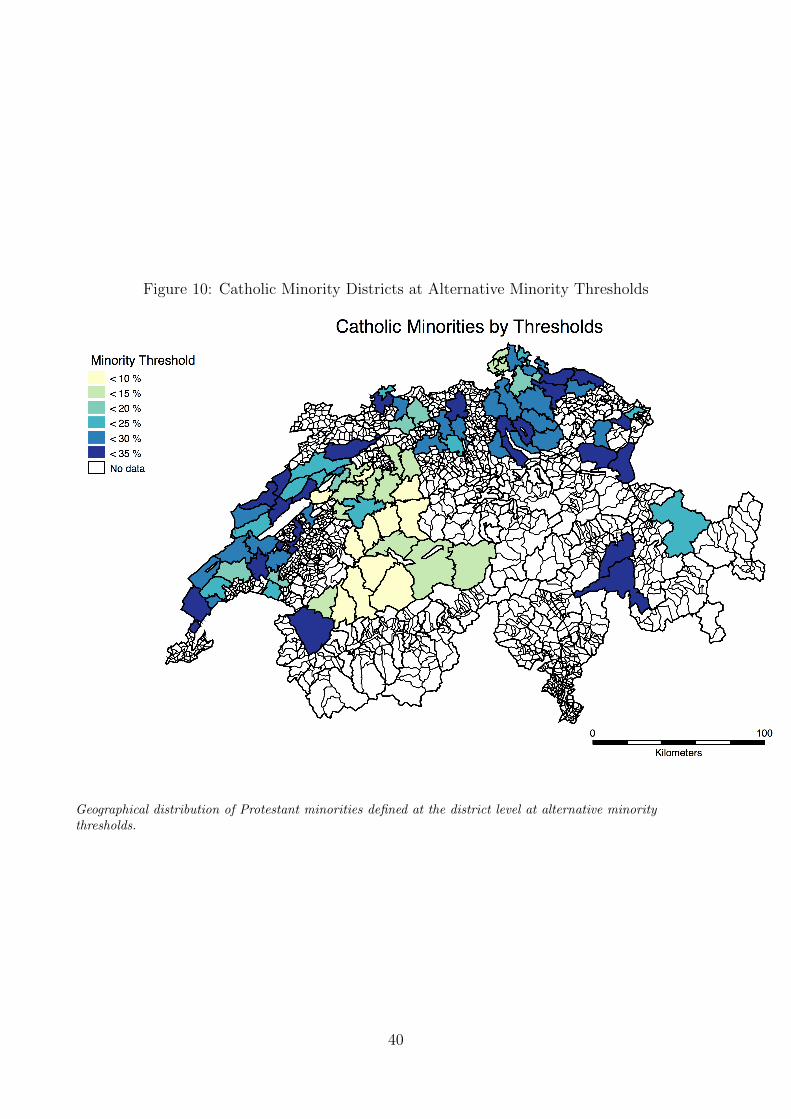
Figure 10: Catholic Minority Districts at Alternative Minority Thresholds
Geographical distribution of Protestant minorities defined at the district level at alternative minoritythresholds.
40
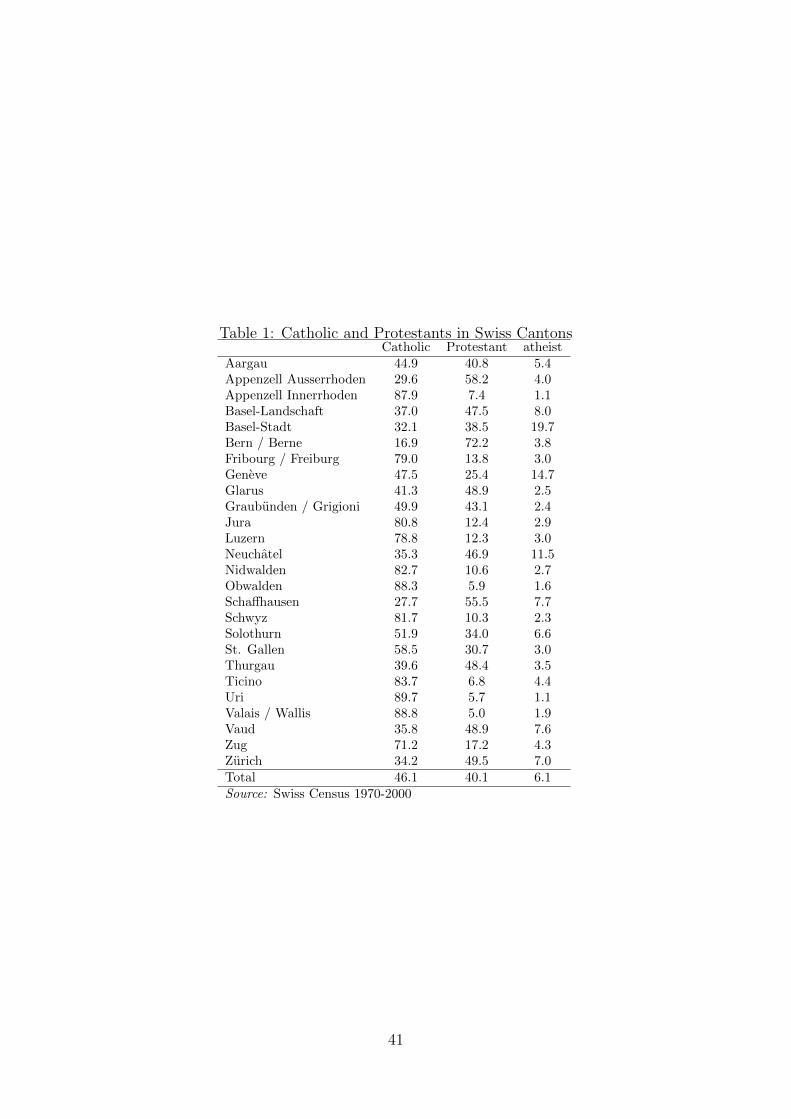
Table 1: Catholic and Protestants in Swiss CantonsCatholic Protestant atheist
Aargau 44.9 40.8 5.4Appenzell Ausserrhoden 29.6 58.2 4.0Appenzell Innerrhoden 87.9 7.4 1.1Basel-Landschaft 37.0 47.5 8.0Basel-Stadt 32.1 38.5 19.7Bern / Berne 16.9 72.2 3.8Fribourg / Freiburg 79.0 13.8 3.0Geneve 47.5 25.4 14.7Glarus 41.3 48.9 2.5Graubunden / Grigioni 49.9 43.1 2.4Jura 80.8 12.4 2.9Luzern 78.8 12.3 3.0Neuchatel 35.3 46.9 11.5Nidwalden 82.7 10.6 2.7Obwalden 88.3 5.9 1.6Schaffhausen 27.7 55.5 7.7Schwyz 81.7 10.3 2.3Solothurn 51.9 34.0 6.6St. Gallen 58.5 30.7 3.0Thurgau 39.6 48.4 3.5Ticino 83.7 6.8 4.4Uri 89.7 5.7 1.1Valais / Wallis 88.8 5.0 1.9Vaud 35.8 48.9 7.6Zug 71.2 17.2 4.3Zurich 34.2 49.5 7.0Total 46.1 40.1 6.1Source: Swiss Census 1970-2000
41
Tab
le2:
Rel
igio
us
Majo
riti
esan
dM
inor
itie
s-
Dis
trib
uti
onan
dp
ersi
sten
ceby
canto
n#
of
dis
tric
ts#
of
cen
sus
wav
es
Can
ton
Dis
tric
tsC
ath
olic
Ma
jori
tyP
rote
stant
Ma
jori
tyC
ath
oli
cM
inori
tyP
rote
stant
Min
ori
tyC
ath
oli
cM
ajo
rity
Pro
test
ant
Ma
jori
tyC
ath
oli
cM
inori
tyP
rote
stant
Min
ori
tyA
arga
u11
55
14
2.8
1.8
4.0
3.0
Ap
pen
zell
Au
sser
rhod
en3
03
10
.1.7
1.0
.A
pp
enze
llIn
ner
rhod
en1
10
01
4.0
..
4.0
Bas
el-L
and
sch
aft
51
32
14.0
2.7
4.0
4.0
Bas
el-S
tad
t1
00
10
..
1.0
.B
ern
/B
ern
e26
025
24
0.
3.7
3.9
.F
rib
ourg
/F
reib
urg
76
00
64.0
..
4.0
Gen
eve
10
00
1.
..
2.0
Gla
rus
10
00
0.
..
.G
rau
bu
nd
en/
Gri
gion
i11
53
14
3.4
2.7
4.0
3.5
Ju
ra3
30
03
4.0
..
4.0
Lu
zern
55
00
54.0
..
4.0
Neu
chat
el6
03
10
.1.7
1.0
.N
idw
ald
en1
10
01
4.0
..
4.0
Obw
ald
en1
10
01
4.0
..
4.0
Sch
affh
ause
n6
04
40
.3.8
4.0
.S
chw
yz
66
00
63.8
..
4.0
Sol
othu
rn10
51
14
2.6
4.0
4.0
3.3
St
Gal
len
149
10
73.1
2.0
.3.6
Thu
rgau
80
20
0.
2.0
..
Tic
ino
88
00
84.0
..
4.0
Uri
11
00
14.0
..
4.0
Val
ais
/W
alli
s13
130
013
4.0
..
4.0
Vau
d19
014
60
.2.1
3.0
.Z
ug
11
00
14.0
..
4.0
Zu
rich
120
71
0.
1.9
4.0
.T
otal
193
7178
44
67
..
..
Note
:S
wis
sC
ensu
s19
70-2
000.
Col
um
ns
3-6:
Nu
mb
erof
dis
tric
tsw
her
ea
reli
gio
us
majo
rity
or
min
ori
tyis
ob
serv
edat
least
on
ceb
etw
een
1970
and
2000
.C
olu
mn
7-10
:A
ver
age
nu
mb
erof
wav
esa
reli
gio
us
ma
jori
tyor
min
ori
tyis
ob
serv
edin
the
dis
tric
tsof
each
canto
n.
42
Tab
le3:
The
Sam
ple
Entr
epre
neu
rsC
ath
olic
nei
ther
ma-
jori
tyn
or
min
orit
y
Pro
test
ant
nei
ther
ma-
jori
tyn
or
min
ori
ty
Cath
oli
cM
ajo
rity
Pro
test
ant
Ma
jori
tyC
ath
oli
cM
inori
tyP
rote
stant
Min
ori
tyT
ota
l
Sw
itze
rlan
dN
O1,
633,
303
2,3
57,8
01
1,8
63,3
72
1,4
56,8
89
174,9
92
328,2
68
7,8
14,6
25
YE
S16
9,97
4296,3
18
305,2
87
236,1
56
16,7
08
47,7
64
1,0
72,2
07
%9.
411.2
14.1
13.9
8.7
12.7
12.1
Tot
al1,
803,
277
2,6
54,1
19
2,1
68,6
59
1,6
93,0
45
191,7
00
376,0
32
8,8
86,8
32
Esp
.M
itte
llan
dN
O21
1,42
6346,7
60
333,1
41
978,7
41
134,6
87
49,5
59
2,0
54,3
14
YE
S21
,492
41,4
91
50,0
35
153,5
81
11,5
88
8,4
13
286,6
00
%9.
210.7
13.1
13.6
7.9
14.5
12.2
Tot
al23
2,91
8388,2
51
383,1
76
1,1
32,3
22
146,2
75
57,9
72
2,3
40,9
14
Note
:S
wis
sC
ensu
s19
70-2
000.
Th
esa
mp
lein
clu
des
act
ive
ind
ivid
uals
,aged
15
and
over
,b
orn
inS
wit
zerl
an
dw
ith
Sw
iss
citi
zen
ship
,w
ho
bel
ong
eith
erto
the
Ref
orm
edor
the
Cath
oli
cch
urc
h.
Canto
nof
Base
d-S
tad
tin
1990
an
d2000
isex
clu
ded
bec
asu
eth
em
ajo
rity
ofre
sid
ents
isn
otre
ligio
us.
43

Table 4: Summary Statisticsvariable Catholic
neithermajor-ity norminor-ity
Protestantneithermajor-ity norminor-ity
CatholicMajor-ity
ProtestantMajor-ity
CatholicMinor-ity
ProtestantMinor-ity
Total
age (years) 37.7 39.6 37.8 39.3 36.8 39.3 38.7female 41.1 39.9 35.9 35.8 43.1 40.5 38.5german speaking 74.9 77.4 64.1 90.1 86.0 72.2 76.1married 52.3 55.8 54.5 58.6 52.5 57.5 55.3
unknown education 2.6 2.3 2.1 2.5 2.6 1.5 2.3primary education andless
24.1 22.7 34.0 30.9 20.4 21.9 27.2
secondary education 67.5 69.1 60.2 63.4 69.4 69.6 65.6tertiary education 5.8 5.9 3.7 3.2 7.6 7.0 4.9Note: Swiss Census 1970-2000. The sample includes active individuals, aged 15 and over, bornin Switzerland with Swiss citizenship, who belong either to the Reformed or the Catholic church.Canton of Based-Stadt in 1990 and 2000 is excluded becasue the majority of residents is notreligious.
44
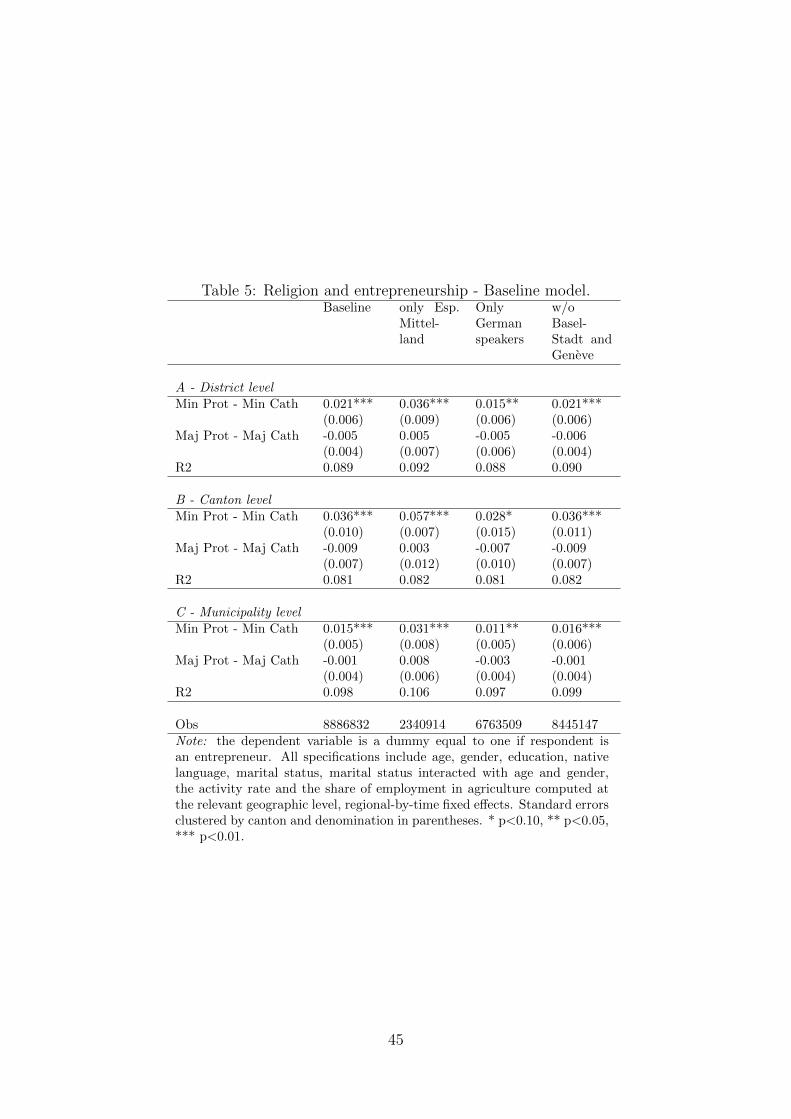
Table 5: Religion and entrepreneurship - Baseline model.Baseline only Esp.
Mittel-land
OnlyGermanspeakers
w/oBasel-Stadt andGeneve
A - District levelMin Prot - Min Cath 0.021*** 0.036*** 0.015** 0.021***
(0.006) (0.009) (0.006) (0.006)Maj Prot - Maj Cath -0.005 0.005 -0.005 -0.006
(0.004) (0.007) (0.006) (0.004)R2 0.089 0.092 0.088 0.090
B - Canton levelMin Prot - Min Cath 0.036*** 0.057*** 0.028* 0.036***
(0.010) (0.007) (0.015) (0.011)Maj Prot - Maj Cath -0.009 0.003 -0.007 -0.009
(0.007) (0.012) (0.010) (0.007)R2 0.081 0.082 0.081 0.082
C - Municipality levelMin Prot - Min Cath 0.015*** 0.031*** 0.011** 0.016***
(0.005) (0.008) (0.005) (0.006)Maj Prot - Maj Cath -0.001 0.008 -0.003 -0.001
(0.004) (0.006) (0.004) (0.004)R2 0.098 0.106 0.097 0.099
Obs 8886832 2340914 6763509 8445147Note: the dependent variable is a dummy equal to one if respondent isan entrepreneur. All specifications include age, gender, education, nativelanguage, marital status, marital status interacted with age and gender,the activity rate and the share of employment in agriculture computed atthe relevant geographic level, regional-by-time fixed effects. Standard errorsclustered by canton and denomination in parentheses. * p<0.10, ** p<0.05,*** p<0.01.
45
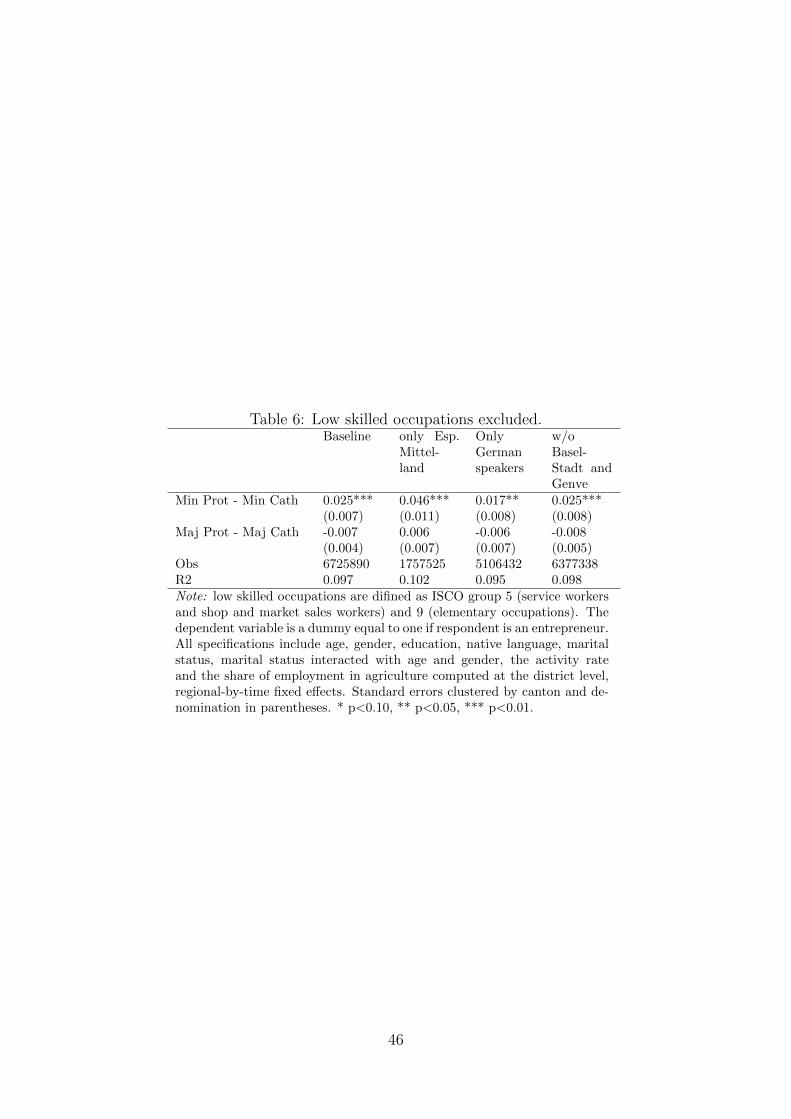
Table 6: Low skilled occupations excluded.Baseline only Esp.
Mittel-land
OnlyGermanspeakers
w/oBasel-Stadt andGenve
Min Prot - Min Cath 0.025*** 0.046*** 0.017** 0.025***(0.007) (0.011) (0.008) (0.008)
Maj Prot - Maj Cath -0.007 0.006 -0.006 -0.008(0.004) (0.007) (0.007) (0.005)
Obs 6725890 1757525 5106432 6377338R2 0.097 0.102 0.095 0.098Note: low skilled occupations are difined as ISCO group 5 (service workersand shop and market sales workers) and 9 (elementary occupations). Thedependent variable is a dummy equal to one if respondent is an entrepreneur.All specifications include age, gender, education, native language, maritalstatus, marital status interacted with age and gender, the activity rateand the share of employment in agriculture computed at the district level,regional-by-time fixed effects. Standard errors clustered by canton and de-nomination in parentheses. * p<0.10, ** p<0.05, *** p<0.01.
46
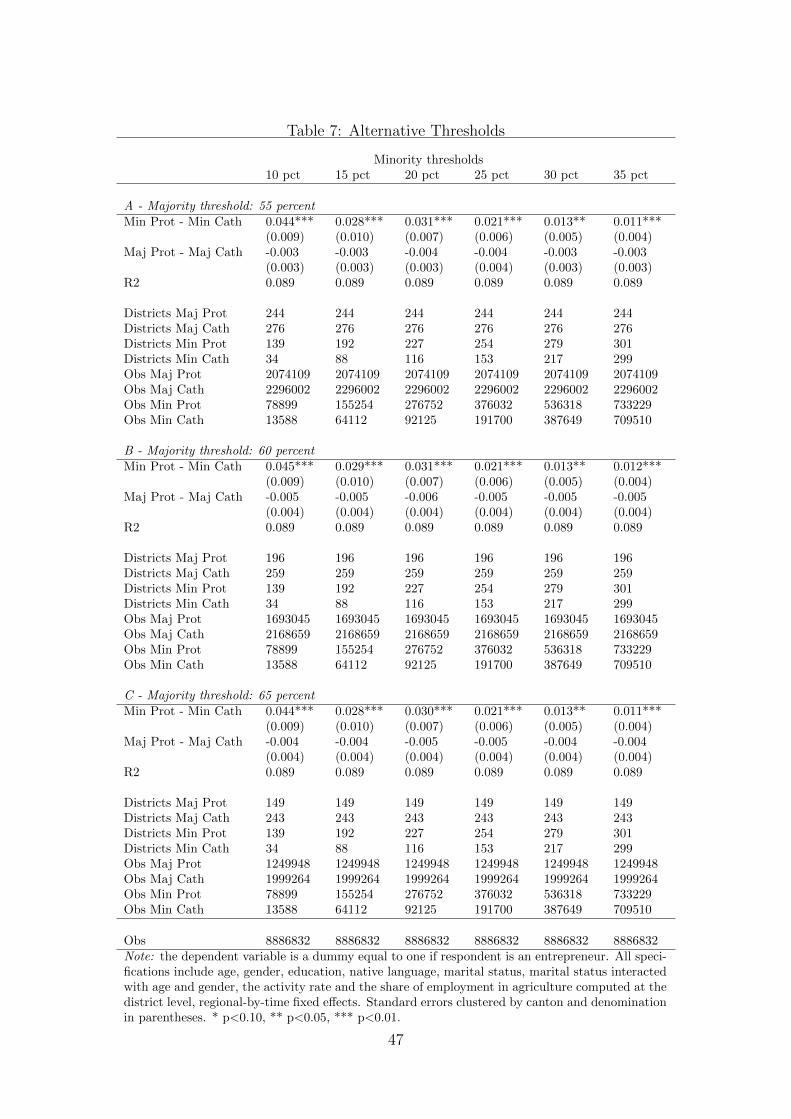
Table 7: Alternative Thresholds
Minority thresholds10 pct 15 pct 20 pct 25 pct 30 pct 35 pct
A - Majority threshold: 55 percentMin Prot - Min Cath 0.044*** 0.028*** 0.031*** 0.021*** 0.013** 0.011***
(0.009) (0.010) (0.007) (0.006) (0.005) (0.004)Maj Prot - Maj Cath -0.003 -0.003 -0.004 -0.004 -0.003 -0.003
(0.003) (0.003) (0.003) (0.004) (0.003) (0.003)R2 0.089 0.089 0.089 0.089 0.089 0.089
Districts Maj Prot 244 244 244 244 244 244Districts Maj Cath 276 276 276 276 276 276Districts Min Prot 139 192 227 254 279 301Districts Min Cath 34 88 116 153 217 299Obs Maj Prot 2074109 2074109 2074109 2074109 2074109 2074109Obs Maj Cath 2296002 2296002 2296002 2296002 2296002 2296002Obs Min Prot 78899 155254 276752 376032 536318 733229Obs Min Cath 13588 64112 92125 191700 387649 709510
B - Majority threshold: 60 percentMin Prot - Min Cath 0.045*** 0.029*** 0.031*** 0.021*** 0.013** 0.012***
(0.009) (0.010) (0.007) (0.006) (0.005) (0.004)Maj Prot - Maj Cath -0.005 -0.005 -0.006 -0.005 -0.005 -0.005
(0.004) (0.004) (0.004) (0.004) (0.004) (0.004)R2 0.089 0.089 0.089 0.089 0.089 0.089
Districts Maj Prot 196 196 196 196 196 196Districts Maj Cath 259 259 259 259 259 259Districts Min Prot 139 192 227 254 279 301Districts Min Cath 34 88 116 153 217 299Obs Maj Prot 1693045 1693045 1693045 1693045 1693045 1693045Obs Maj Cath 2168659 2168659 2168659 2168659 2168659 2168659Obs Min Prot 78899 155254 276752 376032 536318 733229Obs Min Cath 13588 64112 92125 191700 387649 709510
C - Majority threshold: 65 percentMin Prot - Min Cath 0.044*** 0.028*** 0.030*** 0.021*** 0.013** 0.011***
(0.009) (0.010) (0.007) (0.006) (0.005) (0.004)Maj Prot - Maj Cath -0.004 -0.004 -0.005 -0.005 -0.004 -0.004
(0.004) (0.004) (0.004) (0.004) (0.004) (0.004)R2 0.089 0.089 0.089 0.089 0.089 0.089
Districts Maj Prot 149 149 149 149 149 149Districts Maj Cath 243 243 243 243 243 243Districts Min Prot 139 192 227 254 279 301Districts Min Cath 34 88 116 153 217 299Obs Maj Prot 1249948 1249948 1249948 1249948 1249948 1249948Obs Maj Cath 1999264 1999264 1999264 1999264 1999264 1999264Obs Min Prot 78899 155254 276752 376032 536318 733229Obs Min Cath 13588 64112 92125 191700 387649 709510
Obs 8886832 8886832 8886832 8886832 8886832 8886832Note: the dependent variable is a dummy equal to one if respondent is an entrepreneur. All speci-fications include age, gender, education, native language, marital status, marital status interactedwith age and gender, the activity rate and the share of employment in agriculture computed at thedistrict level, regional-by-time fixed effects. Standard errors clustered by canton and denominationin parentheses. * p<0.10, ** p<0.05, *** p<0.01.
47
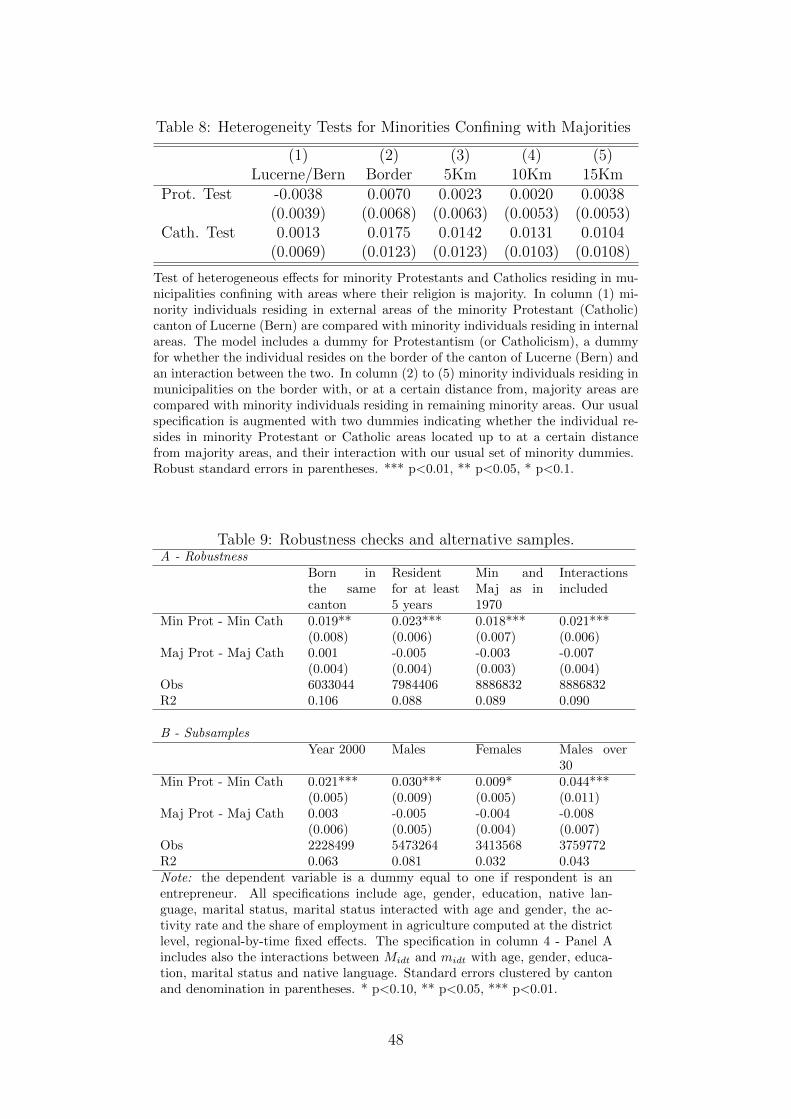
Table 8: Heterogeneity Tests for Minorities Confining with Majorities
(1) (2) (3) (4) (5)Lucerne/Bern Border 5Km 10Km 15Km
Prot. Test -0.0038 0.0070 0.0023 0.0020 0.0038(0.0039) (0.0068) (0.0063) (0.0053) (0.0053)
Cath. Test 0.0013 0.0175 0.0142 0.0131 0.0104(0.0069) (0.0123) (0.0123) (0.0103) (0.0108)
Test of heterogeneous effects for minority Protestants and Catholics residing in mu-nicipalities confining with areas where their religion is majority. In column (1) mi-nority individuals residing in external areas of the minority Protestant (Catholic)canton of Lucerne (Bern) are compared with minority individuals residing in internalareas. The model includes a dummy for Protestantism (or Catholicism), a dummyfor whether the individual resides on the border of the canton of Lucerne (Bern) andan interaction between the two. In column (2) to (5) minority individuals residing inmunicipalities on the border with, or at a certain distance from, majority areas arecompared with minority individuals residing in remaining minority areas. Our usualspecification is augmented with two dummies indicating whether the individual re-sides in minority Protestant or Catholic areas located up to at a certain distancefrom majority areas, and their interaction with our usual set of minority dummies.Robust standard errors in parentheses. *** p<0.01, ** p<0.05, * p<0.1.
Table 9: Robustness checks and alternative samples.A - Robustness
Born inthe samecanton
Residentfor at least5 years
Min andMaj as in1970
Interactionsincluded
Min Prot - Min Cath 0.019** 0.023*** 0.018*** 0.021***(0.008) (0.006) (0.007) (0.006)
Maj Prot - Maj Cath 0.001 -0.005 -0.003 -0.007(0.004) (0.004) (0.003) (0.004)
Obs 6033044 7984406 8886832 8886832R2 0.106 0.088 0.089 0.090
B - SubsamplesYear 2000 Males Females Males over
30Min Prot - Min Cath 0.021*** 0.030*** 0.009* 0.044***
(0.005) (0.009) (0.005) (0.011)Maj Prot - Maj Cath 0.003 -0.005 -0.004 -0.008
(0.006) (0.005) (0.004) (0.007)Obs 2228499 5473264 3413568 3759772R2 0.063 0.081 0.032 0.043Note: the dependent variable is a dummy equal to one if respondent is anentrepreneur. All specifications include age, gender, education, native lan-guage, marital status, marital status interacted with age and gender, the ac-tivity rate and the share of employment in agriculture computed at the districtlevel, regional-by-time fixed effects. The specification in column 4 - Panel Aincludes also the interactions between Midt and midt with age, gender, educa-tion, marital status and native language. Standard errors clustered by cantonand denomination in parentheses. * p<0.10, ** p<0.05, *** p<0.01.
48
Appendix A: The Reform in Switzerland
At the beginning of the sixteenth century, Switzerland was composed of thirteen can-
tons—Uri, Schwytz, Unterwalden, and Lucerne (the four so-called Forest Cantons), Zug, Solothurn,
Zurich, Glarus, Bern, Fribourg, Basel, Schaffhausen, and Appenzell—and a number of allied
cities and dependent territories. Dependent territories were jointly administered by several
cantons.
The Reformation in Switzerland is linked to the name of Ulrich Zwingli, a pastor in Zurich
with an humanistic approach that was largely influenced by Erasmus’ ideas, and to a number of
other leaders (e.g., Bucer, Bullinger, Calvin, Farel, Oecolampadius). Zwingli started preaching
the need for reform of the Catholic Church at nearly the same time (1518) as Luther nailed his
ninety-five theses to the doors of the Wittenberg Cathedral (1517). Zwingli’s ethical and moral
criticisms of the Church where linked to the condemnation of the Swiss practice of serving as
mercenaries for the European powers (Schaff, 1882).
Although Zwingli’s and Luther’s theologies developed independently, they have many sim-
ilarities, including the primacy of the scriptures over tradition, justification by faith alone and
not good works, and universal priesthood without requiring the mediation of the clergy.
However, in several respects, Zwingli’s theology is the more radical. While Luther accepted
Catholic tradition if it does not contrast with the scriptures, Zwingli wanted to quit any practice
that was not explicitly grounded in the New Testament.22
While in Luther’s view the new religion should be brought to the masses by the state, for
Zwingli conversion should be achieved by means of persuasion and discussion, in line with his
humanistic approach, as only reason should induce people to convert.23
22This difference implies that Zwingli did not recognise the only two sacraments retained by Luther, Baptismand the Eucharist, and that he considered even these two only symbols of a spiritual reality that is internalto the human being. Zwingli’s view also saw the liturgy and churches’ decorations as much more essentialand rejected the conception of natural sin (contrary to Luther), as he believed that only awareness impliesresponsibility, so only people who are aware can sin (Sheldon, 1984).
23Zwingli and Luther differed in their conception of the state as well. For Luther there is a separationbetween spiritual and worldly matters (the theory of the two kingdoms), with the latter administered by thestate and commanded by God himself as remediation for human evil, and for this reason to be obeyed underall circumstances, a conception that leads to a form of absolutism. For Zwingli the state is instrumental inensuring people’s welfare, so individuals should be sympathetic to the state and their fellow citizens. Therefore,Zwingli’s ideal state is a republic. However, the state also has the right to defend and preserve morality and
49
Reformation spread from Zurich to many cantons, including St. Gallen (a former Catholic
Prince-Abbacy), Basel, Bern, and Geneva. The Forest Cantons and Zug opposed it fiercely,
creating the league of the Five cantons, and called for the emperor’s support. War broke out in
1529 (the first War of Kappel), when Zurich and Bern attacked. A peace treaty favourable to
Zurich and its allies was signed even before the war was fought, and Reformation was declared
free to spread in the dependent territories. In 1531 a second War of Kappel broke out, in which
the five cantons attacked and eventually defeated the Reformed army and Zwingli, serving as a
military chaplain, died in battle. Anticipating the Peace of Augsburg of 1555, the peace treaty
established a principle similar to the “cuius regio eius religio”, where each canton was free to
set its own religion. The primacy of Catholicism was favoured in the dependent territories and
the Prince-Abbacy of St. Gallen was restored (Meyer, 1976).
Figure 3 displays the geographic distribution of confessions during the Reformation period
(1536).
After Zwingli’s death, Calvin systematised and formalised the Swiss Reformed theology.
Geneve, Zurich, Bern, and Basel defined and agreed upon the common traits of their faith by
means of the mutual consensus (1549), attenuating the more extreme spikes of Zwinglian doc-
trine. Next, in 1566 Bullinger prepared the (second) Helvetic Confession, which was published
by the Elector Palatinate and adopted not only in the entire Reformed Switzerland but also in
Scotland, France, Hungary, and Poland.24
Religious tension continued in Switzerland until the eighteenth century but without major
conflicts. The Catholic cantons promoted the re-catholicisation of the dependent territories that
had previously turned to reformation. Glarus had two religions and two legislative assemblies,
one representing each religious community, and Appenzell was split into two cantons according
to religious lines. The Duchy of Savoy continued the war to reconquer Geneve, but the city of
Geneve remained a Reformed enclave.
ethics, so the state and religion are interlinked, a conception that will be brought to the extreme by Calvin,who transformed Geneve into a sort of intolerant theocracy with his “ordonnances ecclesiastiques”.
24The Helvetic confession, which defines the common traits of the Reformed churches, parallels the AugsburgConfession (1530). The Augsburg Confession, the cornerstone of Lutheranism, defines the common traits of theevangelical churches. Practically, the adoption of the Helvetic Confession established the division between thereformed and the evangelical churches.
50
Catholicism was restored also in the Valais and in Solothurn. The Prince-Bishop of Basel
regained some territories southwest of Basel, which turned to Reformation in 1529. The Ca-
puchins and the Jesuits, expressive of the Catholic counter-Reformation, established schools
and convents and largely favoured the process of re-catholicisation (Schaff, 1882). Figure 4
displays the geographic distribution of confessions in 1700.
Hence following the application of the cuius regio eius religio principle, which aimed to
establish a religious uniformity at least within each of the historically thirteen cantons, counter-
reformation was effective in reintroducing Catholicism also in parts of the reformed cantons.
Furthermore, the initial effort of conversion to reformation and the subsequent re-catholicization
determined the creation of a more mixed religious distribution in the dependent territories.
Both phenomena favored the formation of religious enclaves and minorities in most parts of
the country. According to (Schaff, 1882), Glarus, St. Gallen, Appenzell, Thurgau, and Aargau
were nearly equally divided between the two Confessions. Of the twenty-three subject towns
and districts, only two became wholly Protestant, sixteen remained Catholic, and five were
divided. In the Graubunden nearly two-thirds of the population adopted Reformation.
Today the Reformed churches in Switzerland remain separate, cantonal units. The German
churches are more in the Zwinglian tradition, the French more in the Calvinist tradition, but the
differences are minor. All cantonal churches are federated in the Federation of Swiss Protestant
Churches, which represents the common interests of its member churches on the national and
international levels. Theologically the fundamental principles of the federation coincide with
the cornerstones of Protestantism that we have already discussed: the primacy of the scriptures,
salvation by faith alone, and universal priesthood.
The Federation of Swiss Protestant Churches reports five key tenets on its website25:
1. solus Christus (By Christ alone): The love of Almighty God is evident in Jesus Christ, in
his birth in poverty, his life, his preaching and healing, his crucifixion and resurrection.
Jesus Christ opens the door to God, His and our Father in Heaven. He calls us to follow
in His footsteps.
2. sola gratia (By grace alone) and sola fide (By faith alone): God’s salvation does not have
25See http://www.kirchenbund.ch/en.
51

to be earned; it is freely given to mankind (sola gratia). The only demand on us is that
we accept it and receive the gift in faith (sola fide).
3. sola scriptura (By scripture alone): In questions of a Christian life and faith, the Reformed
Churches are not guided by doctrines. They also have no authority to decree any binding
directives. Their only guideline and source of knowledge are the scriptures of the Old and
New Testaments.
4. soli Deo gloria (Glory to God alone): In praising God, we express the fact that we have
Him to thank for everything. His mighty deeds and works are behind everything on earth.
And so by praising God, we can move beyond ourselves and experience ourselves as part
of a reality that transcends us.
5. The priesthood of all believers: everyone is received into the priesthood through baptism.
The Reformed Churches do not differentiate between clergy and laymen but between
general and official practice of work as a priest. Clergy are officially legitimised for
this, meaning they are officially authorised to perform official duties for everything and
everyone. Their office holds the specific task with which all who have been baptised are
familiar: making the Gospel seen and heard throughout the world by word and deed.
52
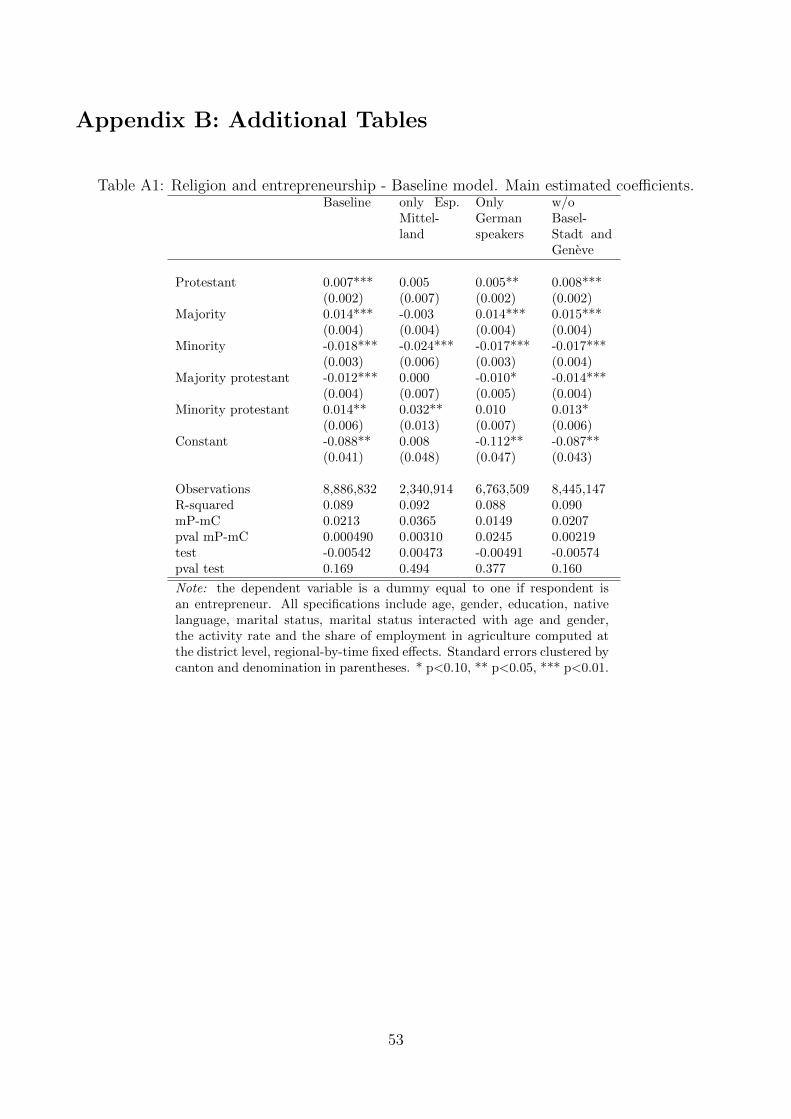
Appendix B: Additional Tables
Table A1: Religion and entrepreneurship - Baseline model. Main estimated coefficients.Baseline only Esp.
Mittel-land
OnlyGermanspeakers
w/oBasel-Stadt andGeneve
Protestant 0.007*** 0.005 0.005** 0.008***(0.002) (0.007) (0.002) (0.002)
Majority 0.014*** -0.003 0.014*** 0.015***(0.004) (0.004) (0.004) (0.004)
Minority -0.018*** -0.024*** -0.017*** -0.017***(0.003) (0.006) (0.003) (0.004)
Majority protestant -0.012*** 0.000 -0.010* -0.014***(0.004) (0.007) (0.005) (0.004)
Minority protestant 0.014** 0.032** 0.010 0.013*(0.006) (0.013) (0.007) (0.006)
Constant -0.088** 0.008 -0.112** -0.087**(0.041) (0.048) (0.047) (0.043)
Observations 8,886,832 2,340,914 6,763,509 8,445,147R-squared 0.089 0.092 0.088 0.090mP-mC 0.0213 0.0365 0.0149 0.0207pval mP-mC 0.000490 0.00310 0.0245 0.00219test -0.00542 0.00473 -0.00491 -0.00574pval test 0.169 0.494 0.377 0.160
Note: the dependent variable is a dummy equal to one if respondent isan entrepreneur. All specifications include age, gender, education, nativelanguage, marital status, marital status interacted with age and gender,the activity rate and the share of employment in agriculture computed atthe district level, regional-by-time fixed effects. Standard errors clustered bycanton and denomination in parentheses. * p<0.10, ** p<0.05, *** p<0.01.
53
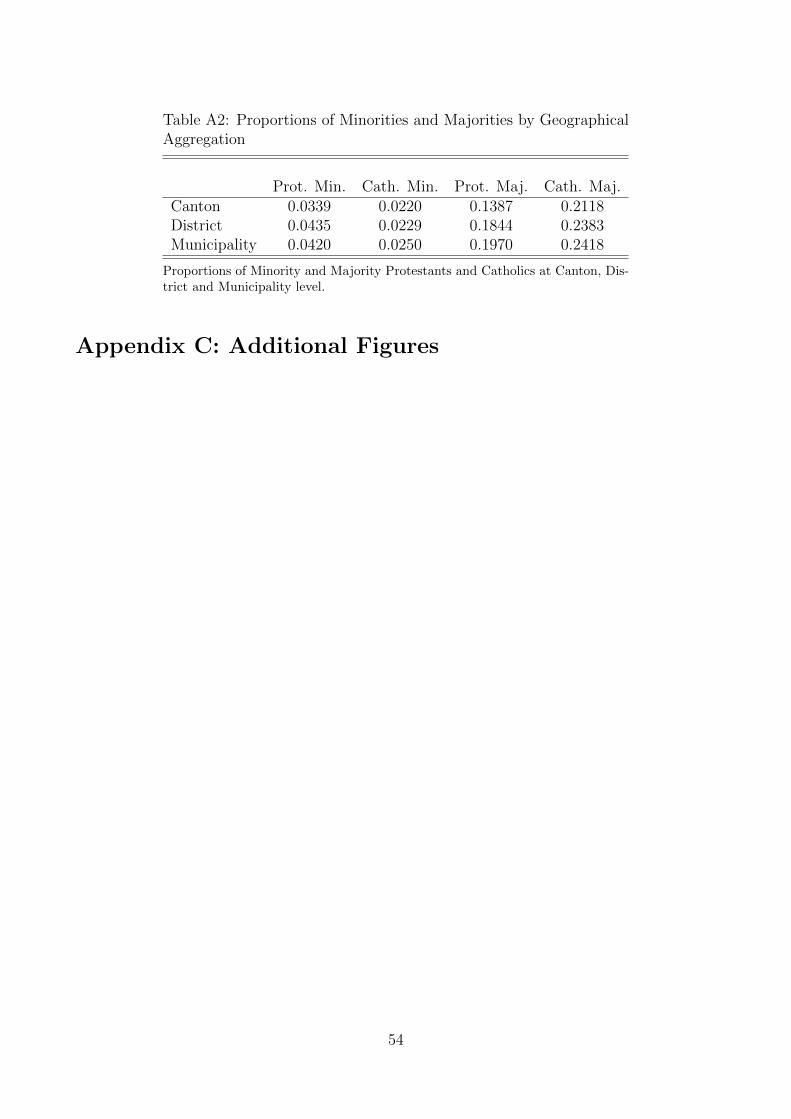
Table A2: Proportions of Minorities and Majorities by GeographicalAggregation
Prot. Min. Cath. Min. Prot. Maj. Cath. Maj.Canton 0.0339 0.0220 0.1387 0.2118District 0.0435 0.0229 0.1844 0.2383Municipality 0.0420 0.0250 0.1970 0.2418
Proportions of Minority and Majority Protestants and Catholics at Canton, Dis-trict and Municipality level.
Appendix C: Additional Figures
54
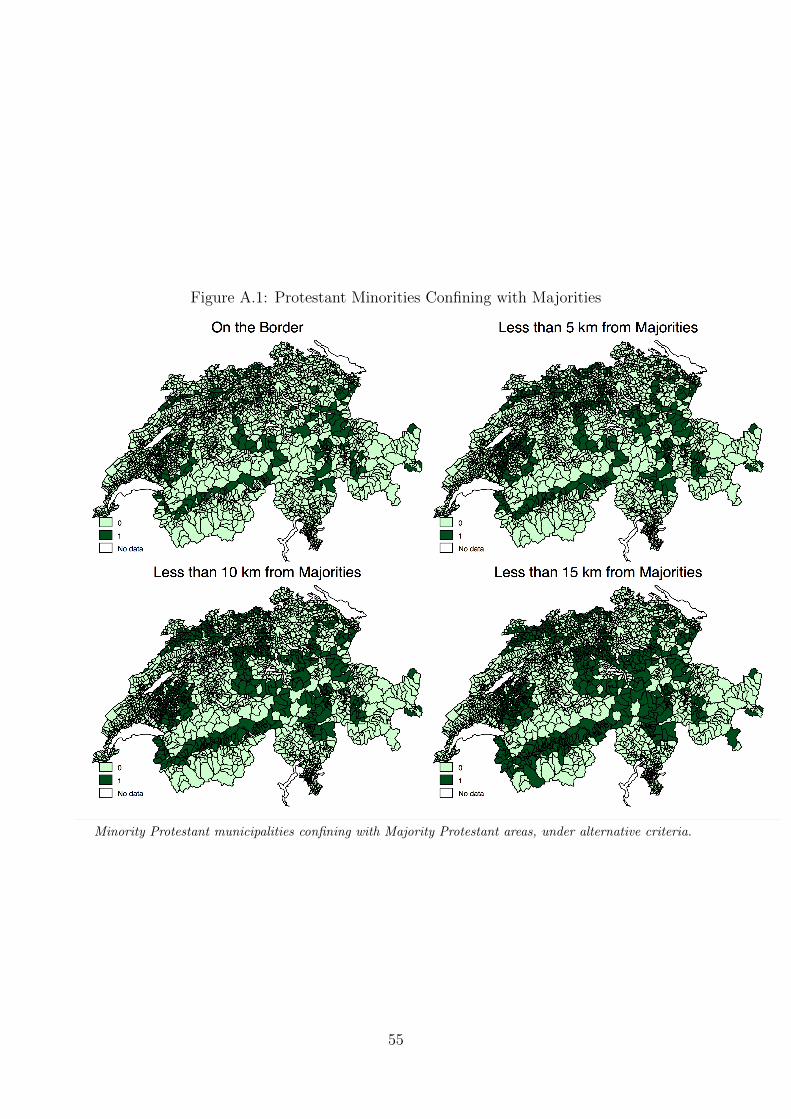
Figure A.1: Protestant Minorities Confining with Majorities
Minority Protestant municipalities confining with Majority Protestant areas, under alternative criteria.
55
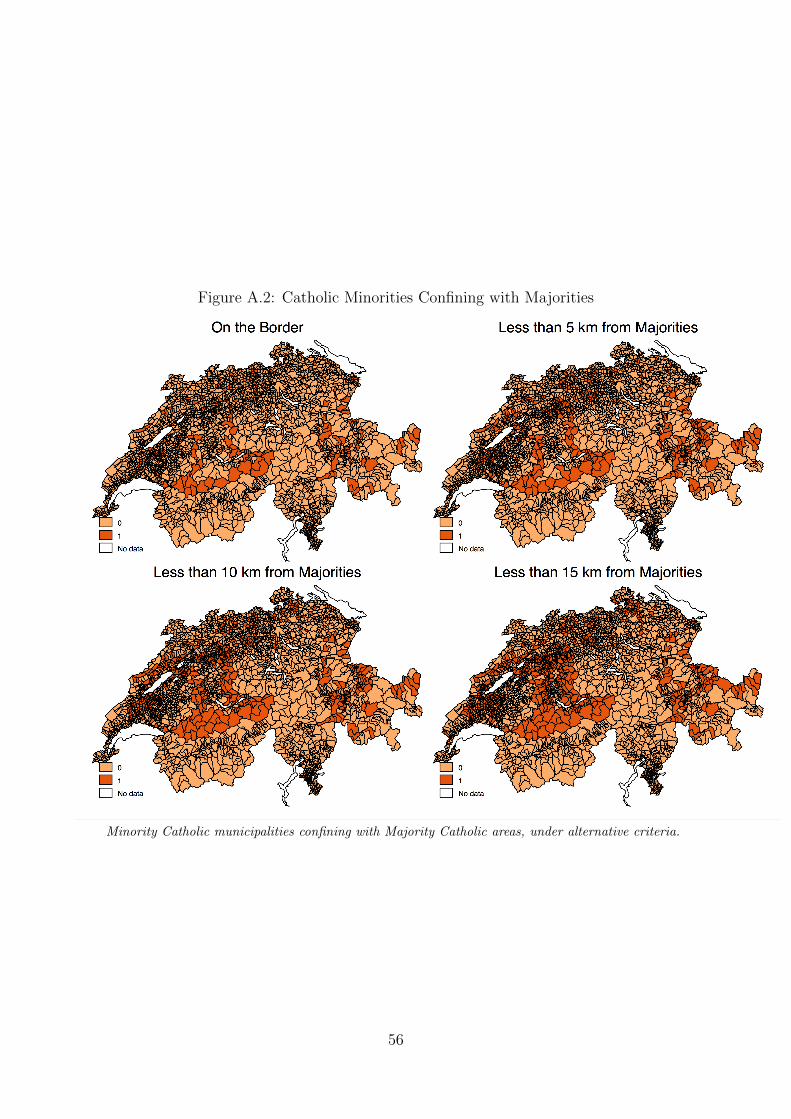
Figure A.2: Catholic Minorities Confining with Majorities
Minority Catholic municipalities confining with Majority Catholic areas, under alternative criteria.
56