Embed Size (px)
Citation preview
A Three-Dimensional Human Atrial Model with FiberOrientation. Electrograms and Arrhythmic ActivationPatterns RelationshipCatalina Tobon1, Carlos A. Ruiz-Villa2,5, Elvio Heidenreich3, Lucia Romero1, Fernando Hornero4,
Javier Saiz1*
1 Instituto Interuniversitario de Investigacion en Bioingenierıa y Tecnologıa Orientada al Ser Humano (I3BH), Universitat Politecnica de Valencia, Valencia, Spain,
2 Departamento de Sistemas, Universidad de Caldas, Manizales, Caldas, Colombia, 3 Universidad Nacional de Lomas de Zamora, Buenos Aires, Argentina, 4 Servicio Cirugıa
Cardiaca, Hospital General de Valencia, Valencia, Spain, 5 Departamento de Informatica y Computacion, Universidad Nacional de Colombia Sede Manizales, Manizales,
Caldas, Colombia
Abstract
The most common sustained cardiac arrhythmias in humans are atrial tachyarrhythmias, mainly atrial fibrillation. Areas ofcomplex fractionated atrial electrograms and high dominant frequency have been proposed as critical regions formaintaining atrial fibrillation; however, there is a paucity of data on the relationship between the characteristics ofelectrograms and the propagation pattern underlying them. In this study, a realistic 3D computer model of the human atriahas been developed to investigate this relationship. The model includes a realistic geometry with fiber orientation,anisotropic conductivity and electrophysiological heterogeneity. We simulated different tachyarrhythmic episodes applyingboth transient and continuous ectopic activity. Electrograms and their dominant frequency and organization index valueswere calculated over the entire atrial surface. Our simulations show electrograms with simple potentials, with little or nocycle length variations, narrow frequency peaks and high organization index values during stable and regular activity as theobserved in atrial flutter, atrial tachycardia (except in areas of conduction block) and in areas closer to ectopic activity duringfocal atrial fibrillation. By contrast, cycle length variations and polymorphic electrograms with single, double andfragmented potentials were observed in areas of irregular and unstable activity during atrial fibrillation episodes. Our resultsalso show: 1) electrograms with potentials without negative deflection related to spiral or curved wavefronts that pass overthe recording point and move away, 2) potentials with a much greater proportion of positive deflection than negative inareas of wave collisions, 3) double potentials related with wave fragmentations or blocking lines and 4) fragmentedelectrograms associated with pivot points. Our model is the first human atrial model with realistic fiber orientation used toinvestigate the relationship between different atrial arrhythmic propagation patterns and the electrograms observed atmore than 43000 points on the atrial surface.
Citation: Tobon C, Ruiz-Villa CA, Heidenreich E, Romero L, Hornero F, et al. (2013) A Three-Dimensional Human Atrial Model with Fiber Orientation. Electrogramsand Arrhythmic Activation Patterns Relationship. PLoS ONE 8(2): e50883. doi:10.1371/journal.pone.0050883
Editor: Alexandre J. Kabla, University of Cambridge, United Kingdom
Received July 6, 2012; Accepted October 25, 2012; Published February 11, 2013
Copyright: � 2013 Tobon et al. This is an open-access article distributed under the terms of the Creative Commons Attribution License, which permitsunrestricted use, distribution, and reproduction in any medium, provided the original author and source are credited.
Funding: This work was partially supported by the Plan Nacional de Investigacion Cientıfica, Desarrollo e Innovacion Tecnologica, Ministerio de Ciencia eInnovacion of Spain (TEC2008-02090), by the Plan Avanza (Accion Estrategica de Telecomunicaciones y Sociedad de la Informacion), Ministerio de IndustriaTurismo y Comercio of Spain (TSI-020100-2010-469), by the Programa Prometeo 2012 of the Generalitat Valenciana and by the Programa de Apoyo a laInvestigacion y Desarrollo de la Universitat Politecnica de Valencia (PAID-06-11-2002). The funders had no role in study design, data collection and analysis,decision to publish, or preparation of the manuscript.
Competing Interests: The authors have declared that no competing interests exist.
* E-mail: [email protected]
Introduction
The most common sustained cardiac arrhythmias in humans
are related to the atria. Different atrial arrhythmias, mainly atrial
fibrillation (AF), often provoke disabling symptoms and severe
complications such as heart failure and stroke [1]. There are
several experimental observations regarding the important role of
the anatomical structure and electrophysiological heterogeneity on
atrial electrical activity both in physiological and pathological
conditions [2–4]. Additionally, it has been shown that atrial
tachyarrhythmias produce a set of changes in atrial properties that
lead to their perpetuation. These changes, denoted atrial
remodeling, include alterations in the electrical cellular activity
and in the anatomical structure. They have been described in
several animal models [5] and in humans [6,7]. Changes in
electrical activity cause a decrease in refractoriness subsequent to a
significant action potential duration (APD) shortening [6–8],
which may help the initiation and maintenance of multiple
reentrant waves, as suggested by experimental studies [5,6].
It is well known that atrial tachyarrhythmias can be caused by
various mechanisms, including rapid local ectopic activity, single-
circuit reentry and multiple-circuit reentry [9–12]. It is important
to know the fundamental mechanisms underlying atrial arrhyth-
mias since they have implications in antiarrhythmic therapy. It is
thought that different mechanisms lead to changes in the
characteristics of spatiotemporal organization of atrial tachyar-
rhythmias. For the study of the spatiotemporal organization of
atrial tachyarrhythmias, different signal analysis techniques are
PLOS ONE | www.plosone.org 1 February 2013 | Volume 8 | Issue 2 | e50883
currently being used to analyze the electrograms (EGM) recorded
at different points of the atrial surface. These include the analysis
of EGM morphology [13–15], dominant frequency (DF) [16–21]
and regularity [19] or organization index (OI) [22,23].
Experimental and clinical studies have shown various degrees of
spatiotemporal organization during sustained AF [10,18,24].
Recent evidence from high-density mapping and spectral analysis
has shown that AF is associated with rotors and regular repetitive
activation in a portion of the atrium. In addition, areas of complex
fractionated atrial electrograms (CFAE) and high DF have been
proposed as critical regions for maintaining AF [10,24,25]. Thus,
identification of areas with these features may allow targeted
ablation procedures to improve success rates. The OI, defined by
Everett et al [22] for the quantification of the organization of atrial
activity from spectral analysis of EGM is another parameter that is
used to identify critical areas for maintaining atrial arrhythmias.
However, there is a paucity of data on the relationship between
CFAE, DF and OI. Even more, despite the important experi-
mental and clinical evidence obtained in recent years, the
relationship between the different characteristics of EGM and
the propagation pattern that underlies them are still far from being
completely understood.
In this study, a realistic three-dimensional (3D) computer model
of the human atria is used to investigate the relationship between
different atrial arrhythmic propagation patterns and the EGM
observed at different points on the atrial surface. Firstly, an
anatomically accurate 3D model of human atria was developed.
Our model includes a realistic geometry with fiber orientation,
anisotropic conductivity and electrophysiological heterogeneity for
different atrial tissues. Then, different tachyarrhythmic episodes in
the electrically remodeled model of human atria were simulated
and the EGM were analyzed to characterize the arrhythmic
patterns. This model is one of the most complete 3D human atrial
models ever developed and it provides a useful tool for
investigating the complex phenomena involved in atrial tachyar-
rhythmias by simulating experimental and clinical situations
difficult to perform in vitro or in vivo.
Methods
3D model of human atriaAn anatomically realistic 3D model of human atria that includes
fiber orientation was developed. Our model comprises the
following main anatomical structures: left atrium (LA) and right
atrium (RA), twenty pectinate muscles (PM) in the RA free wall,
the fossa ovalis (FO) in the septum with its limbus, Bachmann’s
bundle (BB), the crista terminalis (CT), left and right appendages
(LAPG and RAPG), left and right pulmonary veins (LPV and
RPV), superior and inferior caval veins (SCV and ICV), the
isthmus of RA, atrioventricular rings (AVR) and the coronary
sinus (CS). The sinoatrial node (SAN) is situated near the ostium of
the SCV. The CT layer originates next to the SAN and crosses the
RA towards the ICV while the BB starts in a region next to the
SCV and extends through the LA. The CS starts in the RA and
extends along the posterior atrioventricular sulcus. The model also
includes three different pathways for the inter-atrial conduction of
electrical propagation: the BB, the limbus of the FO and discrete
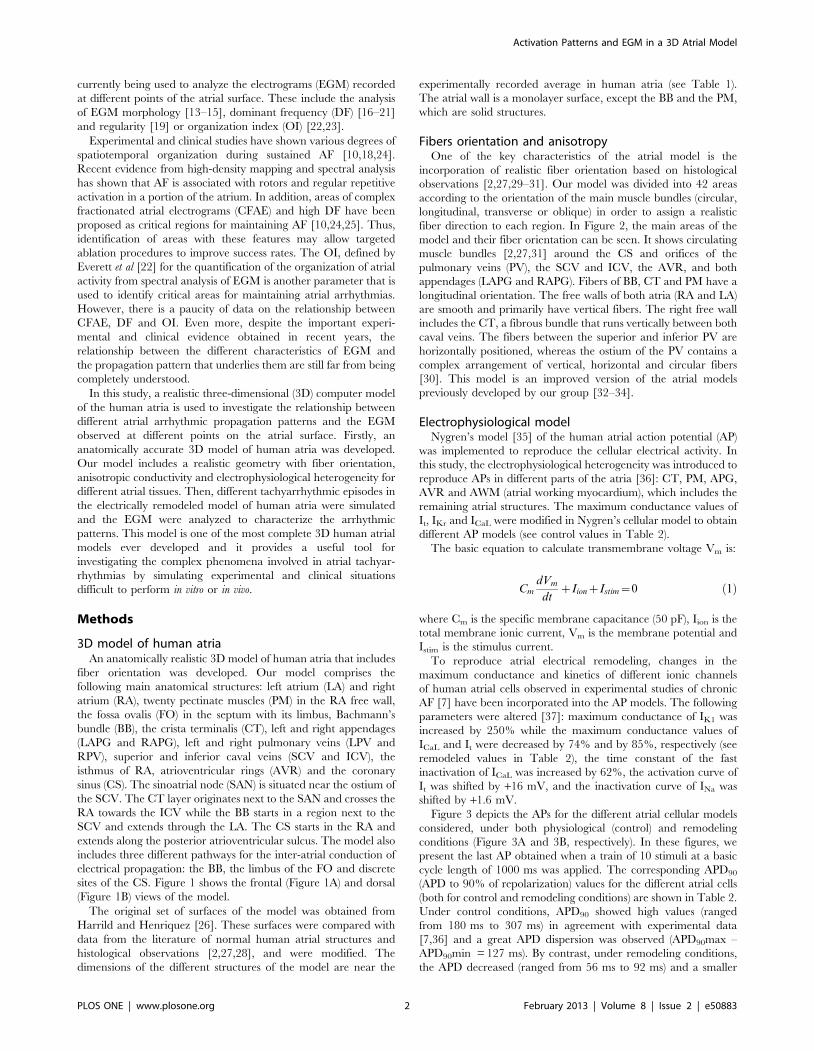
sites of the CS. Figure 1 shows the frontal (Figure 1A) and dorsal
(Figure 1B) views of the model.
The original set of surfaces of the model was obtained from
Harrild and Henriquez [26]. These surfaces were compared with
data from the literature of normal human atrial structures and
histological observations [2,27,28], and were modified. The
dimensions of the different structures of the model are near the
experimentally recorded average in human atria (see Table 1).
The atrial wall is a monolayer surface, except the BB and the PM,
which are solid structures.
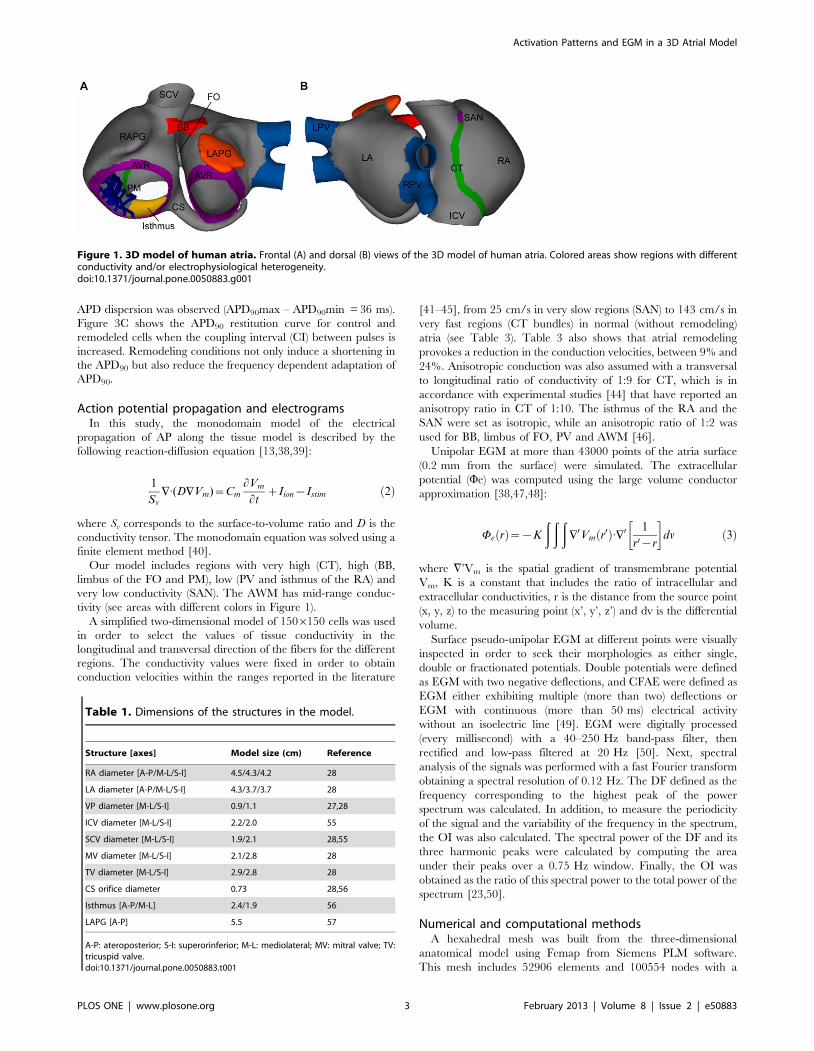
Fibers orientation and anisotropyOne of the key characteristics of the atrial model is the
incorporation of realistic fiber orientation based on histological
observations [2,27,29–31]. Our model was divided into 42 areas
according to the orientation of the main muscle bundles (circular,
longitudinal, transverse or oblique) in order to assign a realistic
fiber direction to each region. In Figure 2, the main areas of the
model and their fiber orientation can be seen. It shows circulating
muscle bundles [2,27,31] around the CS and orifices of the
pulmonary veins (PV), the SCV and ICV, the AVR, and both
appendages (LAPG and RAPG). Fibers of BB, CT and PM have a
longitudinal orientation. The free walls of both atria (RA and LA)
are smooth and primarily have vertical fibers. The right free wall
includes the CT, a fibrous bundle that runs vertically between both
caval veins. The fibers between the superior and inferior PV are
horizontally positioned, whereas the ostium of the PV contains a
complex arrangement of vertical, horizontal and circular fibers
[30]. This model is an improved version of the atrial models
previously developed by our group [32–34].
Electrophysiological modelNygren’s model [35] of the human atrial action potential (AP)
was implemented to reproduce the cellular electrical activity. In
this study, the electrophysiological heterogeneity was introduced to
reproduce APs in different parts of the atria [36]: CT, PM, APG,
AVR and AWM (atrial working myocardium), which includes the
remaining atrial structures. The maximum conductance values of
It, IKr and ICaL were modified in Nygren’s cellular model to obtain
different AP models (see control values in Table 2).
The basic equation to calculate transmembrane voltage Vm is:
CmdVm
dtzIionzIstim~0 ð1Þ
where Cm is the specific membrane capacitance (50 pF), Iion is the
total membrane ionic current, Vm is the membrane potential and
Istim is the stimulus current.
To reproduce atrial electrical remodeling, changes in the
maximum conductance and kinetics of different ionic channels
of human atrial cells observed in experimental studies of chronic
AF [7] have been incorporated into the AP models. The following
parameters were altered [37]: maximum conductance of IK1 was
increased by 250% while the maximum conductance values of
ICaL and It were decreased by 74% and by 85%, respectively (see
remodeled values in Table 2), the time constant of the fast
inactivation of ICaL was increased by 62%, the activation curve of
It was shifted by +16 mV, and the inactivation curve of INa was
shifted by +1.6 mV.
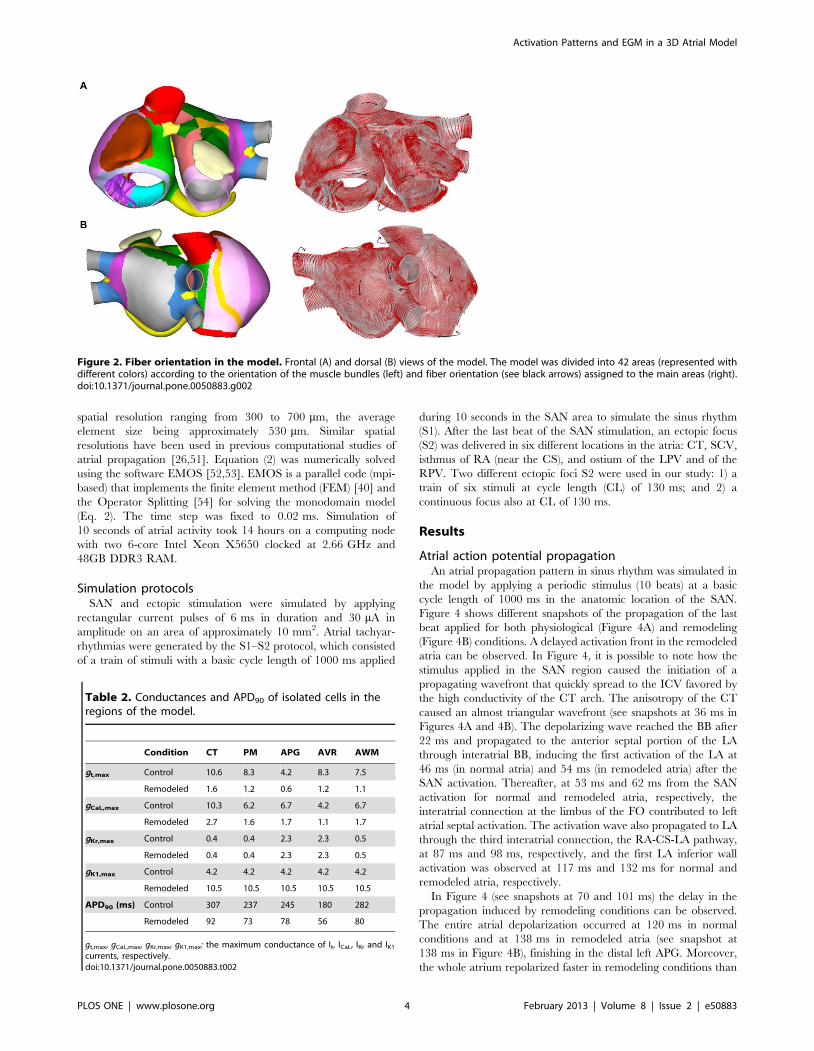
Figure 3 depicts the APs for the different atrial cellular models
considered, under both physiological (control) and remodeling
conditions (Figure 3A and 3B, respectively). In these figures, we
present the last AP obtained when a train of 10 stimuli at a basic
cycle length of 1000 ms was applied. The corresponding APD90
(APD to 90% of repolarization) values for the different atrial cells
(both for control and remodeling conditions) are shown in Table 2.
Under control conditions, APD90 showed high values (ranged
from 180 ms to 307 ms) in agreement with experimental data
[7,36] and a great APD dispersion was observed (APD90max –
APD90min = 127 ms). By contrast, under remodeling conditions,
the APD decreased (ranged from 56 ms to 92 ms) and a smaller
Activation Patterns and EGM in a 3D Atrial Model
PLOS ONE | www.plosone.org 2 February 2013 | Volume 8 | Issue 2 | e50883
APD dispersion was observed (APD90max – APD90min = 36 ms).
Figure 3C shows the APD90 restitution curve for control and
remodeled cells when the coupling interval (CI) between pulses is
increased. Remodeling conditions not only induce a shortening in
the APD90 but also reduce the frequency dependent adaptation of
APD90.
Action potential propagation and electrogramsIn this study, the monodomain model of the electrical
propagation of AP along the tissue model is described by the
following reaction-diffusion equation [13,38,39]:
1
Sv
+:(D+Vm)~Cm
LVm
LtzIion{Istim ð2Þ
where Sv corresponds to the surface-to-volume ratio and D is the
conductivity tensor. The monodomain equation was solved using a
finite element method [40].
Our model includes regions with very high (CT), high (BB,
limbus of the FO and PM), low (PV and isthmus of the RA) and
very low conductivity (SAN). The AWM has mid-range conduc-
tivity (see areas with different colors in Figure 1).
A simplified two-dimensional model of 1506150 cells was used
in order to select the values of tissue conductivity in the
longitudinal and transversal direction of the fibers for the different
regions. The conductivity values were fixed in order to obtain
conduction velocities within the ranges reported in the literature
[41–45], from 25 cm/s in very slow regions (SAN) to 143 cm/s in
very fast regions (CT bundles) in normal (without remodeling)
atria (see Table 3). Table 3 also shows that atrial remodeling
provokes a reduction in the conduction velocities, between 9% and
24%. Anisotropic conduction was also assumed with a transversal
to longitudinal ratio of conductivity of 1:9 for CT, which is in
accordance with experimental studies [44] that have reported an
anisotropy ratio in CT of 1:10. The isthmus of the RA and the
SAN were set as isotropic, while an anisotropic ratio of 1:2 was
used for BB, limbus of FO, PV and AWM [46].
Unipolar EGM at more than 43000 points of the atria surface
(0.2 mm from the surface) were simulated. The extracellular
potential (Fe) was computed using the large volume conductor
approximation [38,47,48]:
We rð Þ~{K
ð ð ð+0Vm r0ð Þ:+0 1
r0{r
� �dv ð3Þ
where =’Vm is the spatial gradient of transmembrane potential
Vm, K is a constant that includes the ratio of intracellular and
extracellular conductivities, r is the distance from the source point
(x, y, z) to the measuring point (x’, y’, z’) and dv is the differential
volume.
Surface pseudo-unipolar EGM at different points were visually
inspected in order to seek their morphologies as either single,
double or fractionated potentials. Double potentials were defined
as EGM with two negative deflections, and CFAE were defined as
EGM either exhibiting multiple (more than two) deflections or
EGM with continuous (more than 50 ms) electrical activity
without an isoelectric line [49]. EGM were digitally processed
(every millisecond) with a 40–250 Hz band-pass filter, then
rectified and low-pass filtered at 20 Hz [50]. Next, spectral
analysis of the signals was performed with a fast Fourier transform
obtaining a spectral resolution of 0.12 Hz. The DF defined as the
frequency corresponding to the highest peak of the power
spectrum was calculated. In addition, to measure the periodicity
of the signal and the variability of the frequency in the spectrum,
the OI was also calculated. The spectral power of the DF and its
three harmonic peaks were calculated by computing the area
under their peaks over a 0.75 Hz window. Finally, the OI was
obtained as the ratio of this spectral power to the total power of the
spectrum [23,50].
Numerical and computational methodsA hexahedral mesh was built from the three-dimensional
anatomical model using Femap from Siemens PLM software.
This mesh includes 52906 elements and 100554 nodes with a
Figure 1. 3D model of human atria. Frontal (A) and dorsal (B) views of the 3D model of human atria. Colored areas show regions with differentconductivity and/or electrophysiological heterogeneity.doi:10.1371/journal.pone.0050883.g001
Table 1. Dimensions of the structures in the model.
Structure [axes] Model size (cm) Reference
RA diameter [A-P/M-L/S-I] 4.5/4.3/4.2 28
LA diameter [A-P/M-L/S-I] 4.3/3.7/3.7 28
VP diameter [M-L/S-I] 0.9/1.1 27,28
ICV diameter [M-L/S-I] 2.2/2.0 55
SCV diameter [M-L/S-I] 1.9/2.1 28,55
MV diameter [M-L/S-I] 2.1/2.8 28
TV diameter [M-L/S-I] 2.9/2.8 28
CS orifice diameter 0.73 28,56
Isthmus [A-P/M-L] 2.4/1.9 56
LAPG [A-P] 5.5 57
A-P: ateroposterior; S-I: superorinferior; M-L: mediolateral; MV: mitral valve; TV:tricuspid valve.doi:10.1371/journal.pone.0050883.t001
Activation Patterns and EGM in a 3D Atrial Model
PLOS ONE | www.plosone.org 3 February 2013 | Volume 8 | Issue 2 | e50883
spatial resolution ranging from 300 to 700 mm, the average
element size being approximately 530 mm. Similar spatial
resolutions have been used in previous computational studies of
atrial propagation [26,51]. Equation (2) was numerically solved
using the software EMOS [52,53]. EMOS is a parallel code (mpi-
based) that implements the finite element method (FEM) [40] and
the Operator Splitting [54] for solving the monodomain model
(Eq. 2). The time step was fixed to 0.02 ms. Simulation of
10 seconds of atrial activity took 14 hours on a computing node
with two 6-core Intel Xeon X5650 clocked at 2.66 GHz and
48GB DDR3 RAM.
Simulation protocolsSAN and ectopic stimulation were simulated by applying
rectangular current pulses of 6 ms in duration and 30 mA in
amplitude on an area of approximately 10 mm2. Atrial tachyar-
rhythmias were generated by the S1–S2 protocol, which consisted
of a train of stimuli with a basic cycle length of 1000 ms applied
during 10 seconds in the SAN area to simulate the sinus rhythm
(S1). After the last beat of the SAN stimulation, an ectopic focus
(S2) was delivered in six different locations in the atria: CT, SCV,
isthmus of RA (near the CS), and ostium of the LPV and of the
RPV. Two different ectopic foci S2 were used in our study: 1) a
train of six stimuli at cycle length (CL) of 130 ms; and 2) a
continuous focus also at CL of 130 ms.
Results
Atrial action potential propagationAn atrial propagation pattern in sinus rhythm was simulated in
the model by applying a periodic stimulus (10 beats) at a basic
cycle length of 1000 ms in the anatomic location of the SAN.
Figure 4 shows different snapshots of the propagation of the last
beat applied for both physiological (Figure 4A) and remodeling
(Figure 4B) conditions. A delayed activation front in the remodeled
atria can be observed. In Figure 4, it is possible to note how the
stimulus applied in the SAN region caused the initiation of a
propagating wavefront that quickly spread to the ICV favored by
the high conductivity of the CT arch. The anisotropy of the CT
caused an almost triangular wavefront (see snapshots at 36 ms in
Figures 4A and 4B). The depolarizing wave reached the BB after
22 ms and propagated to the anterior septal portion of the LA
through interatrial BB, inducing the first activation of the LA at
46 ms (in normal atria) and 54 ms (in remodeled atria) after the
SAN activation. Thereafter, at 53 ms and 62 ms from the SAN
activation for normal and remodeled atria, respectively, the
interatrial connection at the limbus of the FO contributed to left
atrial septal activation. The activation wave also propagated to LA
through the third interatrial connection, the RA-CS-LA pathway,
at 87 ms and 98 ms, respectively, and the first LA inferior wall
activation was observed at 117 ms and 132 ms for normal and
remodeled atria, respectively.
In Figure 4 (see snapshots at 70 and 101 ms) the delay in the
propagation induced by remodeling conditions can be observed.
The entire atrial depolarization occurred at 120 ms in normal
conditions and at 138 ms in remodeled atria (see snapshot at
138 ms in Figure 4B), finishing in the distal left APG. Moreover,
the whole atrium repolarized faster in remodeling conditions than
Figure 2. Fiber orientation in the model. Frontal (A) and dorsal (B) views of the model. The model was divided into 42 areas (represented withdifferent colors) according to the orientation of the muscle bundles (left) and fiber orientation (see black arrows) assigned to the main areas (right).doi:10.1371/journal.pone.0050883.g002
Table 2. Conductances and APD90 of isolated cells in theregions of the model.
Condition CT PM APG AVR AWM
gt,max Control 10.6 8.3 4.2 8.3 7.5
Remodeled 1.6 1.2 0.6 1.2 1.1
gCaL,max Control 10.3 6.2 6.7 4.2 6.7
Remodeled 2.7 1.6 1.7 1.1 1.7
gKr,max Control 0.4 0.4 2.3 2.3 0.5
Remodeled 0.4 0.4 2.3 2.3 0.5
gK1,max Control 4.2 4.2 4.2 4.2 4.2
Remodeled 10.5 10.5 10.5 10.5 10.5
APD90 (ms) Control 307 237 245 180 282
Remodeled 92 73 78 56 80
gt,max, gCaL,max, gKr,max, gK1,max: the maximum conductance of It, ICaL, IKr and IK1
currents, respectively.doi:10.1371/journal.pone.0050883.t002
Activation Patterns and EGM in a 3D Atrial Model
PLOS ONE | www.plosone.org 4 February 2013 | Volume 8 | Issue 2 | e50883
under physiological conditions, at 234 ms and 432 ms after SAN
activation, respectively.
After the 10th stimulus was applied in the SAN zone, two
different ectopic foci (S2) were applied at six different points of the
atria (see methods): 1) a burst of six beats, and 2) a continuous
ectopic focus, both with a CL of 130 ms. When we applied the
burst of six beats, we observed either atrial flutter (AFL) or
reentrant tachycardia in five of the six locations tested (isthmus of
RA near the CS, SCV, CT, ostium of the LPV and center of the
LA posterior wall), and AF when the ectopic focus was applied in
the ostium of the RPV. Different AF patterns were also observed
when a continuous ectopic focus was applied in the six locations.
Atrial flutter and reentrant tachycardiaFigure 5A depicts an example of AFL obtained by applying the
burst of six ectopic beats in the isthmus of RA (near the CS),
231 ms after the last sinus stimulus. When the burst was applied, a
conduction block was observed in the CS area which induced a
macroreentry rotating counterclockwise around the tricuspid
annulus (see the arrow in snapshot at 4100 ms in Figure 5A), that
was maintained during the whole simulation (<8 seconds). The
activation pattern of this macroreentry resembles an AFL (see
video S1 in the Supporting Information). The direction of the
reentrant circuit can also be observed when comparing the APs of
the sites 1, 2 and 3 in Figure 5A (see dotted arrows). The
macrorentrant wavefront depolarized the rest of the atria,
including the posterior wall of the LA (see site 4 in Figure 5A)
with a 1:1 activation pattern. The CL of this arrhythmic pattern
was almost constant (<200 ms) in the whole atria, a characteristic
of AFL. The EGM in different points of the atria (see sites 2 and 4
in Figure 5A) only displayed single potentials, showing a stable and
regular atrial activation, which is also characteristic of AFL. This
regularity is reflected as a single narrow DF peak of 5.0 Hz and
high OI values, close to unity, in sites 2 and 4. Similar DF and OI
values were observed in the entire atrial tissue.
Figure 5B shows an example of reentrant tachycardia (see
snapshots at 3760 ms and 3840 ms) obtained by applying a burst
of six ectopic beats approximately in the middle of the CT, 160 ms
after the last sinus stimulus. In this case, the ectopic focus initiated
a reentry anchored to the RA, that propagated between the center
and the top areas of the CT (see video S2 in the Supporting
Information). This propagation pattern was favored by the greater
anisotropy, fiber orientation and heterogeneity in the CT region.
In fact, the CT area acts as a blocking line (see the dashed line in
snapshot at 3840 ms in Figure 5B), maintaining the reentry
activity and keeping the rest of the tissue in a reentrant tachycardia
pattern. The blocking line is a source of electrotonic APs where
functional conduction blocks are observed. The APs during
tachycardia at five sites are also shown in Figure 5B. It is
important to note that in the CT region, where the reentry turns,
two impulses arrive to site 2 from sites 1 and 3 in each cycle. Site 3
shows electrotonic APs when the reentry passes through the region
of site 1 and 2, but it is blocked before arriving to site 3. Likewise,
site 1 shows electrotonic APs when the reentry turns and passes
through site 3 and 2, but it is blocked before arriving to site 1. This
reentrant activity spreads to the rest of the atria (see APs at sites 4
and 5 in Figure 5B).
The EGM observed in areas of conduction-block (see EGM at
site 2) are characterized by double potentials, one short negative
component associated with the electrotonic APs elicited when the
reentry is passing at a close distance, and another larger and
steeper negative component generated when the reentry passing
through the electrode area. The EGM at site 5 displays single
potentials with only negative deflections of short-time when the
curved front passes on this site (see EGM at site 5 in Figure 5B).
The EGM observed in the rest of the atria (out of the blocking line
area) showed single potentials.
Only slight variations in the CL of APs were observed between
different points, which suggest a periodic and regular reentrant
activity. The entire atrial tissue presents similar DF (around
Figure 3. AP for different atrial areas and APD90 restitution curve for AWM under physiological and remodeling conditions. AP timecourses for the considered atrial cellular models (CT, PM, APG, AVR and AWM) under physiological (A) and remodeling conditions (B). APD90
restitution curve for AWM under physiological (control) and remodeling conditions (C).doi:10.1371/journal.pone.0050883.g003
Table 3. Conductivities and conduction velocities in the regions of the model.
CT BB, PM, and FO rim PV Isthmus SAN AWM
Longitudinal conductivity (S/m) 0.7 0.5 0.15 0.1 0.05 0.2
CV in control (cm/s) 143 120 54 44 25 69
CV in remodeled (cm/s) 130 107 46 37 19 61
CV: conduction velocity.doi:10.1371/journal.pone.0050883.t003
Activation Patterns and EGM in a 3D Atrial Model
PLOS ONE | www.plosone.org 5 February 2013 | Volume 8 | Issue 2 | e50883
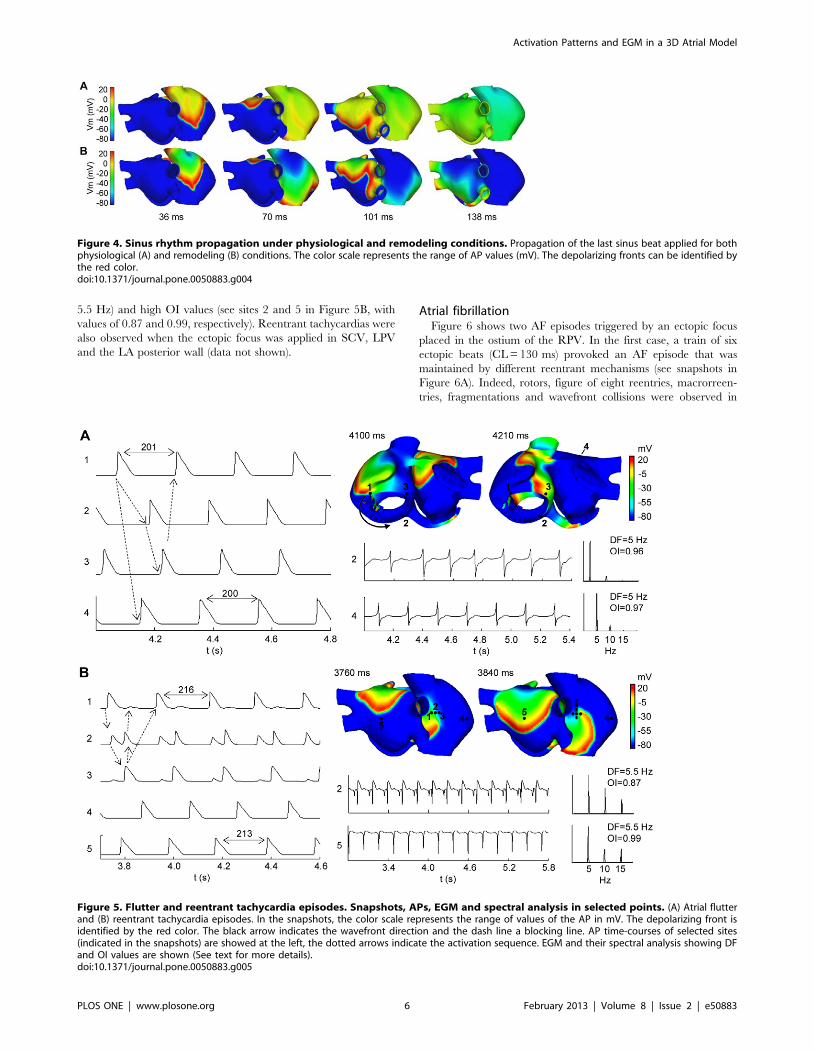
5.5 Hz) and high OI values (see sites 2 and 5 in Figure 5B, with
values of 0.87 and 0.99, respectively). Reentrant tachycardias were
also observed when the ectopic focus was applied in SCV, LPV
and the LA posterior wall (data not shown).
Atrial fibrillationFigure 6 shows two AF episodes triggered by an ectopic focus
placed in the ostium of the RPV. In the first case, a train of six
ectopic beats (CL = 130 ms) provoked an AF episode that was
maintained by different reentrant mechanisms (see snapshots in
Figure 6A). Indeed, rotors, figure of eight reentries, macrorreen-
tries, fragmentations and wavefront collisions were observed in
Figure 4. Sinus rhythm propagation under physiological and remodeling conditions. Propagation of the last sinus beat applied for bothphysiological (A) and remodeling (B) conditions. The color scale represents the range of AP values (mV). The depolarizing fronts can be identified bythe red color.doi:10.1371/journal.pone.0050883.g004
Figure 5. Flutter and reentrant tachycardia episodes. Snapshots, APs, EGM and spectral analysis in selected points. (A) Atrial flutterand (B) reentrant tachycardia episodes. In the snapshots, the color scale represents the range of values of the AP in mV. The depolarizing front isidentified by the red color. The black arrow indicates the wavefront direction and the dash line a blocking line. AP time-courses of selected sites(indicated in the snapshots) are showed at the left, the dotted arrows indicate the activation sequence. EGM and their spectral analysis showing DFand OI values are shown (See text for more details).doi:10.1371/journal.pone.0050883.g005
Activation Patterns and EGM in a 3D Atrial Model
PLOS ONE | www.plosone.org 6 February 2013 | Volume 8 | Issue 2 | e50883
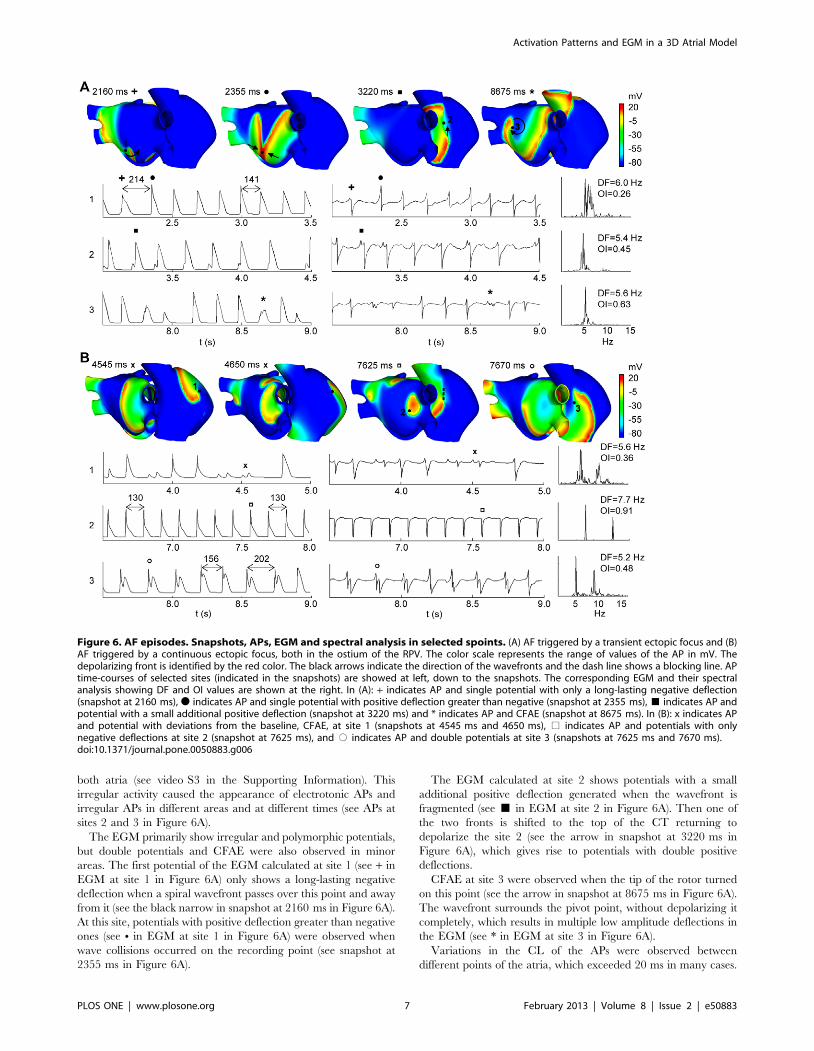
both atria (see video S3 in the Supporting Information). This
irregular activity caused the appearance of electrotonic APs and
irregular APs in different areas and at different times (see APs at
sites 2 and 3 in Figure 6A).
The EGM primarily show irregular and polymorphic potentials,
but double potentials and CFAE were also observed in minor
areas. The first potential of the EGM calculated at site 1 (see + in
EGM at site 1 in Figure 6A) only shows a long-lasting negative
deflection when a spiral wavefront passes over this point and away
from it (see the black narrow in snapshot at 2160 ms in Figure 6A).
At this site, potentials with positive deflection greater than negative
ones (see N in EGM at site 1 in Figure 6A) were observed when
wave collisions occurred on the recording point (see snapshot at
2355 ms in Figure 6A).
The EGM calculated at site 2 shows potentials with a small
additional positive deflection generated when the wavefront is
fragmented (see & in EGM at site 2 in Figure 6A). Then one of
the two fronts is shifted to the top of the CT returning to
depolarize the site 2 (see the arrow in snapshot at 3220 ms in
Figure 6A), which gives rise to potentials with double positive
deflections.
CFAE at site 3 were observed when the tip of the rotor turned
on this point (see the arrow in snapshot at 8675 ms in Figure 6A).
The wavefront surrounds the pivot point, without depolarizing it
completely, which results in multiple low amplitude deflections in
the EGM (see * in EGM at site 3 in Figure 6A).
Variations in the CL of the APs were observed between
different points of the atria, which exceeded 20 ms in many cases.
Figure 6. AF episodes. Snapshots, APs, EGM and spectral analysis in selected spoints. (A) AF triggered by a transient ectopic focus and (B)AF triggered by a continuous ectopic focus, both in the ostium of the RPV. The color scale represents the range of values of the AP in mV. Thedepolarizing front is identified by the red color. The black arrows indicate the direction of the wavefronts and the dash line shows a blocking line. APtime-courses of selected sites (indicated in the snapshots) are showed at left, down to the snapshots. The corresponding EGM and their spectralanalysis showing DF and OI values are shown at the right. In (A): + indicates AP and single potential with only a long-lasting negative deflection(snapshot at 2160 ms), N indicates AP and single potential with positive deflection greater than negative (snapshot at 2355 ms), & indicates AP andpotential with a small additional positive deflection (snapshot at 3220 ms) and * indicates AP and CFAE (snapshot at 8675 ms). In (B): x indicates APand potential with deviations from the baseline, CFAE, at site 1 (snapshots at 4545 ms and 4650 ms), % indicates AP and potentials with onlynegative deflections at site 2 (snapshot at 7625 ms), and # indicates AP and double potentials at site 3 (snapshots at 7625 ms and 7670 ms).doi:10.1371/journal.pone.0050883.g006
Activation Patterns and EGM in a 3D Atrial Model
PLOS ONE | www.plosone.org 7 February 2013 | Volume 8 | Issue 2 | e50883
This fact is reflected in the appearance of multiple frequency peaks
and low OI values in the spectral analysis. Heterogeneity in DF
values and low OI values were observed in the entire atrial tissue
(see spectral analysis of EGM at sites 1, 2 and 3 in Figure 6A).
Figure 6B shows an example of a focal AF episode triggered by
a continuous ectopic focus applied in the ostium of the RPV. This
ectopic activity also induced multiple reentrant waves that collided
and fragmented with each other (see snapshots in Figure 6B and
video S4 in the Supporting Information). Rotors with irregular
trajectories that collided and fragmented creating new activation
fronts were mainly observed in the RA. Although LA also
presented fragmentation and collisions in the superior and anterior
walls, the posterior wall near RPV was activated at a higher
frequency by the wavefront generated by the ectopic focus.
In site 1 of Figure 6B, a reentry turns around a functional block
for several milliseconds. Electrotonic APs reflected as deviations
from the baseline at the EGM, CFAE, (see x in EGM at site 1 in
Figure 6B) were observed when the reentry turned very close to
site 1 (see snapshots at 4545 ms and 4650 ms in Figure 6B). In
other instants, the spiral wavefront moved over the site 1
generating potentials with a single negative deflection in the
EGM (snapshots not shown).
The APs and the EGM calculated in site 2, near the ectopic
focus, show a rapid and regular atrial activation with similar CL
values. The EGM has potentials with only negative deflections
when the curved wavefront passes through this point (see snapshot
at 7625 ms and % in EGM at site 2 in Figure 6B). The stable and
regular activity in this site is reflected in the spectral analysis as a
single narrow DF peak of 7.7 Hz (value of the ectopic focus
frequency) and high OI value close to unity.
Site 3 in Figure 6B shows APs and EGM for a point on the
blocking line, which induced reentry anchored to the CT in
certain instants (see the dashed line in snapshot at 7625 ms in
Figure 6B). The reentry propagates between the center and the top
areas of the CT, similarly to that observed during reentrant
tachycardia in Figure 5B. Site 3 is depolarized by the wavefront
and it is again activated, before repolarizing, by the front turning
on line blocking. This behavior is reflected in EGM with double
potentials (see # in EGM at site 3 in Figure 6B).
The only zone of the atria that shows a high frequency of
activation (similar to the focus) and high OI values is the region of
the posterior wall of LA near to the ectopic focus. The remaining
tissue is unable to depolarize at this high frequency and it shows
irregular CL, which is reflected in the spectral analysis with
multiple frequency peaks and lower DF and OI values (DF of
5.6 Hz and OI of 0.36, and DF of 5.2 Hz and OI of 0.48, at sites 1
and 2, respectively, in Figure 6B). Every AF rhythms simulated
when the continuous focus was applied in the other five locations
(not shown) displayed stable and regular activity near the area of
the ectopic focus and high DF values similar to the focus
frequency. In the rest of the tissue, multiple reentrant waves
generating irregular activity were observed.
Discussion
Validation of 3D model of human atria with completefiber orientation
A 3D model of the human atria with realistic anatomy and fiber
orientation was developed. Our model also includes real
anisotropy characteristics and electrophysiological heterogeneities
in the main atrial structures. To our knowledge, this model is one
of the most complete 3D human atrial models ever developed.
Our model is based on the surfaces provided by Harrild and
Henriquez [26] that were improved using detailed anatomical and
histological observations [2,27–31,55–58]. We modified the
geometry and dimensions of the PV, APG, PM and AVR rings,
and the CS was created, in accordance with human data
[27,28,55–58]. Specifically, the diameters antero-posterior and
medial-lateral of our model are 4.5 cm and 4.3 cm for the RA,
respectively, and 4.3 cm and 3.7 cm for the LA, respectively.
These values fall within the ranges reported by Cohen et al [28] in
humans (2.8–5.2 cm and 2.9–5.3 cm for RA; and 2.0–5.2 cm and
2.4–5.2 cm for LA). In addition, the diameters for PV (1.1 cm), CS
(0.7 cm), SCV (1.9 cm), mitral valve (2.1 cm) and tricuspid valve
(2.9 cm) are also within the ranges reported by Cohen et al (0.7–
1.6 cm for PV, 0.4–1.0 cm for CS, 0.8–2.0 cm for SCV, 2.0–
3.8 cm for mitral valve, and 2.0–4.0 cm for tricuspid valve).
Our model also includes anisotropy and fiber orientation. It has
been observed that atrial anatomy, anisotropy and fiber orienta-
tion are critically important in determining the spread and
direction of the activating wave front [2,3,4,29,31]. There are a
number of well-defined bundles in the atrial muscle where the AP
propagates faster [29,41–43]. These bundles include the CT, BB,
the PM and the limbus of the FO. All of them are considered in
our model. The atrial model was divided into 42 regions and a
detailed fiber orientation was included in each region based on
histological observations [2,27–31,59,60]. This model goes beyond
previous models, as it not only considers a detailed atrial anatomy,
regional heterogeneity and anisotropy, but also accurate fiber
orientation for the whole atria. Jacquement et al [13] developed an
atrial model of simple geometry with a coarse fiber structure,
which was manually introduced. Seeman et al [61] and recently
Aslanidi et al [62] included only the fiber orientation of the main
bundles (BB, PM and CT) in their human atrial model. Krogh-
Madsen et al implemented the Harrild and Herriquez human
atrial model [26] without structural modifications, anisotropy and
fiber orientation to simulate arrhythmic episodes [63]. Ho et al
[31] argued that the heterogeneous myoarchitecture of RA and
LA and the inter-atrial septum must be considered in computer
models that seek to investigate mechanisms of atrial arrhythmias,
as our model does. An image-based anatomical model of the sheep
atrial fiber orientation has been recently presented [64]. The
model reproduces the whole atria with highly detailed myofiber
architecture while our model simplifies the complex myocardial
structure by dividing the whole atria into 42 regions. Fiber
orientation in both models has some similarities, for example fibers
at the base of SVC and around PV have circumferential
orientation or highly organized tracts in the CT and PM.
However, it is not clear how similar are fiber architecture in the
whole atria between sheets and human.
Our model also includes a realistic RA-CS-LA interatrial
connection; where the CS connects electrically the RA and the LA
through some fiber tracks. Different anatomic studies [65] have
shown that the CS musculature is continuous with LA myocar-
dium in the proximal portion of the CS and with RA myocardium
at the CS orifice. Therefore, the CS musculature may form an
electrical connection between the RA and the LA.
The electrophysiological heterogeneity also plays an important
role during atrial conduction. In order to reproduce the AP
morphologies in different parts of the atria, the human atrial
model developed by Nygren was modified based on the
electrophysiological heterogeneity observed in canine atria [36]
as previously suggested [61]. The effect of electrical remodeling
was introduced by altering different currents (IK1, ICaL, It and INa)
in accordance with experimental studies of chronic AF [7]. In this
study, under normal conditions, AP showed morphological
differences in the different electrophysiological zones, consistent
with those reported experimentally [36]. It is noteworthy that,
Activation Patterns and EGM in a 3D Atrial Model
PLOS ONE | www.plosone.org 8 February 2013 | Volume 8 | Issue 2 | e50883
under electrical remodeling conditions, the APs showed similar
morphologies for different atrial zones with only slight APD
variations between them.
Atrial action potential propagation. Our model reproduc-
es the normal atrial activation originated in the SAN, both under
physiological and remodeling conditions. Under physiological
conditions, the activation initiated in the SAN region reached the
BB after 22 ms, which follows experimental studies that have
reported the first activation of BB at approximately 19 ms [59].
The propagating wavefront quickly spreads to the ICV, becoming
almost triangular, favored by the high conductivity of the
longitudinal fiber orientation of the CT. These characteristics of
the wavefronts have been reported for normal sinus rhythm in
humans [43].
In our simulation study, the RA free wall was completely
depolarized after 60 ms. This result is in agreement with
experimental observations of the complete RA wall activation at
57 ms [43]. Interestingly, the LA was also activated through the
limbus of FO at 53 ms, and through the RA-CS-LA connection at
117 ms, which is consistent with recent studies that have suggested
that the activation of the posterior epicardial LA takes place at
54610 ms [66] and that a third interatrial electrical connection
exists in the region of the CS [65,66].
The complete LA activation was observed in the distal LAPG at
120 ms, which is also in agreement with experimental results.
Canavan et al [67] showed that the last activation in the atrial
tissue occurs just before 120 ms. Lemery et al [66] reported the
latest LA activation at 116618 ms. In addition, it has also been
documented that atrial activation ends at the LAPG [68].
Under remodeling conditions, the latest atrial activation also
occurs in our model in the distal LAPG, but after 138 ms, showing
a conduction delay. The delay is due to an overall reduction of the
conduction velocity that changes from 9% to 24% depending on
the zone [7,69]. Experimental studies in dogs [70] observed a
mean reduction of 25% in conduction velocity values measured in
remodeling conditions. Even more, under remodeling conditions a
faster repolarization of the whole atria was observed due to a
reduced APD.
Simulated tachyarrhythmic episodes resulted from the applica-
tion of ectopic foci with both transient and continuous activity. It
has been demonstrated that extrastimuli, either both transitory or
continuous, can act as triggers and, in some cases, they may be
responsible for the initiation and maintenance of AF episodes
[9,71]. In our study, the foci were applied in six different locations
in the atria: CT, SCV, isthmus of RA (near the CS), center of the
LA posterior wall and ostium of the LPV and RPV. Although
tachyarrhythmic episodes are initiated by focal triggers most
commonly localized in areas near the PV [9,71], ectopic foci have
also been recorded in other regions. In an extensive cases report
[72] the ectopic foci were located in the posterior wall of the LA
including VP (38.3%), in the SCV (37%), in the CT (3.7%) in the
ligament of Marshall (8.2%), in the CS (1.4%) and in the
interatrial septum (1.4%).
In our simulations, one AFL, four reentrant tachycardias and
one AF episode were obtained by applying transient ectopic foci,
but only AF episodes were observed when a continuous ectopic
focus was applied in the same locations.
Flutter and reentrant tachycardiaThe application of the train of six ectopic beats in the isthmus of
RA (near the CS) triggered an episode of AFL. It was maintained
by a macroreentry located in the RA, turning counterclockwise
around the tricuspid annulus. In patients, it has been observed that
a high percentage (85%) of AFL is due to reentrant excitation
travelling around the tricuspid valve ring [73]. Notably, our model
can reproduce this kind of AFL episode, where the circular fiber
orientation around the tricuspid annulus (as in the real atrial
musculature) plays an important role in the AFL reentrant circuit.
The macroreentrant circuit activated the rest of the atria with a
1:1 pattern of activation and functional block was not found in the
CT. This supports similar observations reached in a previous
analysis of human AFL [74], where the atrial activation in the
right lateral wall was uniform, without blocking in the region of the
CT. In our simulation of AFL, no variation was observed in the
CL (<200 ms) in the different regions of the atria. This result is
also consistent with the mean values of CL (238 ms and 245 ms)
obtained in experimental and clinical studies [75,76].
The EGM recorded in different points of the atria presented
high organization, with uniform and regular single potentials,
which reflected in the spectral analysis as a single narrow DF peak.
This is in agreement with EGM recorded in vivo [77] in both LA
and RA which also showed uniform and regular potentials. In our
model, the spectral analysis showed DF of 5 Hz during AFL,
which falls within the range reported in humans (4.2–5.8 Hz) [78].
Additionally, EGM also showed high OI values according to the
high regularity in the atrial activation [23].
Application of the ectopic focus in the CT, SCV, ostium of LPV
and the center of the LA posterior wall triggered reentrant
tachycardia episodes. When the ectopic focus was applied in the
CT, the reentrant tachycardia was maintained by a reentry
anchored to the CT. The reentry moved between the central and
the superior part of the CT, showing a block line in this region.
Experimental studies have shown a great number of the reentrant
tachycardias in absence of structural heart diseases occurring
along the CT [60,79], due to the anisotropy in this region that
favors the role of CT as a natural barrier to the atrial activation.
Even more, it has also been demonstrated in experimental and
clinical studies that the CT is an anatomical substrate underlying
atrial arrhythmias [74,80].
The reentrant tachycardia produced EGM with mostly single,
uniform and regular potentials, linked to stable and regular atrial
activation. This organized activity is reflected in the spectral
analysis with a single narrow DF peak (consistent with the CL of
atrial tachycardia) and a high OI value in most areas of the atria.
A 1:1 uniform activation pattern across both atria and a high
regularity in the atrial activation were observed. Experimental and
clinical studies [77,79] have shown stable and regular atrial
activation with mostly single and regular EGM during reentrant
tachycardias. Everett et al [23] have linked high OI values with
high regularity in atrial activation. It is noteworthy that double
potentials were observed in the EGM along the CT when it acts as
a blocking line. Interestingly, our results also confirm that double
potentials (or at least part of them) could be related to electrotonic
potentials provoked by sequential activation on both sides of the
blocking line. In an experimental study on atrial EGM during AF,
Konings et al [15] registered double potentials along the lines of
conduction block, similar to the results of our simulations.
Atrial fibrillationWhen a train of six ectopic beats in the ostium of the RVP was
applied, an episode of AF was initiated (Figure 6A). Multiple
reentrant waves, rotors, fragmented fronts and collisions were
observed, which are characteristic of fibrillatory activity
[10,15,77]. CL variations and EGM with single potentials double
potentials and CFAE were observed. Experimental and clinical
studies of AF [16,17,77] have recorded intracardiac polymorphic
EGM, and irregular and disorganized activation patterns in areas
with fibrillatory conduction.
Activation Patterns and EGM in a 3D Atrial Model
PLOS ONE | www.plosone.org 9 February 2013 | Volume 8 | Issue 2 | e50883
In our study, EGM showed only a long-lasting negative
deflection when a spiral wavefront passed over the recording
point, and potentials with positive deflection greater than the
negative ones when wave collisions occurred. These results are
consistent with previous studies [13,81] which have shown that the
EGM morphology is related to the shape of the wavefront and to
its curvature, suggesting that single potentials may have different
morphologies. Our results confirm the results obtained by
Jacquemet et al [13] in simulation studies using a model with
simplified fiber structure. He observed potentials with a positive
deflection much lower than the negative deflection during either
curved or spiral fronts. He also obtained potentials with a much
larger positive deflection than negative deflection during a collision
between two wavefronts. However, Konings et al [15] reported
short-double potentials along either side of the line of collision,
unlike observations in our study. The differences could be due to
the collisions between several wavefronts (.2) observed by
Konings et al, whereas in our study the collisions occur mainly
between two wavefronts.
In our study, CFAE were observed when the tip of the rotors
turned on the recording point (pivot point). During the last
decades experimental and clinical studies have demonstrated that
the maintenance of the AF in many cases depends on these rotors
[17,82,83]. Recent observational studies have demonstrated that
substrates serving as ‘‘AF perpetuators’’ can be identified by
searching for areas that have CFAE, but the underlying etiology of
CFAE and their relationship with rotors has not yet been
elucidated [84]. Konings et al [15] recorded CFAE during AF in
humans, suggesting that CFAE can indicate pivot points, slow
conduction and complex reentrant patterns. Zlochiver et al [14]
demonstrated that rotor meandering might also underlie, at least
in part, the CFAE that they observed close to the driver. Our
results reveal a direct relationship between the tip of the rotor
(pivot point) and the CFAE.
The spectral analyses display multiple frequency peaks around
the DF peaks and lower OI values than those observed during
either reentrant tachycardia or AFL. These results are in
agreement with experimental studies [15–17,77], reporting that
spectral analysis of the EGM recorded during AF episodes shows
multiple frequency peaks in areas with irregular and unstable
activation. Indeed, conduction blocks and wave collisions increase
the irregularity and variability in the frequency [15,16,82,85].
Everett et al [23] associated low OI values with the presence of
EGM with double and fragmented potentials in canine models of
AF.
In our study, the focal AF triggered by an ectopic focus with
continuous activity between RPV showed substantial differences
from the previous AF. Nearby zones and the location of the
ectopic focus showed APs and EGM with rapid and regular
activation with single potentials and similar CL values between
them. This electrical activity gives rise to a single frequency peak
with the highest DF value, similar to the frequency of the ectopic
focus and with the highest OI values, in accordance with
experimental observations. Lin et al [16] have reported that
EGM recorded near the ectopic sources show rapid, regular and
stable activity. The frequency spectrum obtained from sources
maintaining AF usually shows a single frequency peak with a
narrow morphological base [85]. Moreover, Takahashi et al [50],
in a study with 25 patients, associated high OI values with sources
that maintain the arrhythmia. Due to the high frequency of the
ectopic focus, the rest of the atria cannot follow a 1:1 activation,
therefore, the conduction block results in a reduction of DF in
remote areas of the focal source, as suggested by different authors
[16,19,20]. Additionally, several studies in which AF is maintained
by a focal source in the LA have reported higher DF values in the
LA than in the RA [16,18,25].
Our results show EGM with potentials that display a
pronounced negative deflection when the curved front passes on
the recorded points. Jacquemet et al [13] also obtained potentials
with a negative deflection much larger than the positive deflection
in the presence of curved fronts.
In areas of the atria away from the ectopic focus, multiple
reentrant waves that collided and fragmented were observed,
which produced irregular and polymorphic EGM with single,
double and CFAE; a hallmark of fibrillatory conduction
[10,15,77]. Indeed, double potentials are related with wave
fragmentations and conduction block and CFAE are related with
pivot points, as previously mentioned. Finally, CL variations are
reflected in the spectrum as multiple frequency peaks and low OI
values, indicating an irregular conduction pattern with high
frequency variability.
Limitations of the studySome of the limitations of this study include:
The Nygren model, despite being a fairly complex and detailed
model, has some limitations. It lacks a detailed dynamic
intracellular Ca2+ cycling, which can play a relevant role in some
cardiac arrhythmias. Several electrophysiologically detailed hu-
man atrial cell models have been developed. Although all of them
resemble the AP of human atria, they have different morphologies
(see [86] for review). We used the modifications on IK1, ICaL and It
reported by Zhang et al [37] to obtain electrically remodeled atrial
cells models. In that work, the authors modified two atrial cellular
models (Nygren et al [35] and Courtemanche et al [87]) and
observed that the remodeling conditions (called in this work AF-1)
provoked similar APD90 reductions (62% versus 68%). In another
study, Sanchez et al [88] compared the results of two atrial cell
models (Courtemanche et al [87] and Maleckar et al [89]) using
slightly different remodeling conditions. They observed that the
APD90 reduction was also similar in both models. Even more,
although the restitution curve in control presented some differ-
ences between the cellular models, under remodeling conditions
both restitution curves flattened and were qualitatively very
similar. They concluded that their study of AF dynamics was
independent of the model used. The aforementioned results
suggest that the main findings of our work are also independent of
the cellular model used.
The remodeling conditions used in our study are based on the
experimental work of Bosh et al [7]. However, another experi-
mental study [6] has reported shorter reductions of APD during
AF (around 50%) and several computational studies [37,88,90]
have introduced the effect of electrical remodeling mainly using
quantitatively different modifications in the same channels. These
different remodeling conditions may produce different patterns of
atrial arrhythmias and requires further investigation. Another
limitation is that the heterogeneity of our model is based on canine
atria data [36]. New experimental data about the effect of atrial
electrical remodeling on the anatomical structures of human atria
would allow more realistic simulations of AF dynamic under
chronic AF. Although the used remodeling conditions can
reproduce the action potential phenotype observed in patients
with permanent AF, electrical remodeling is not the only process
accompanying permanent AF. Indeed, many of these patients
have significant structural remodeling with fibrosis, which
contributes to short APD [91,92] and increases the complexity
of the arrhythmia [93].
Our 3D anatomical model of human atria does not take into
account the real thickness of the atrial walls. Several studies have
Activation Patterns and EGM in a 3D Atrial Model
PLOS ONE | www.plosone.org 10 February 2013 | Volume 8 | Issue 2 | e50883
shown very complex fiber structures in areas of human atria
[2,27,30,31]. Our results were obtained using a specific virtual
atria model. Although our model includes a great number of
anatomical and morphological details, it corresponds to a
particular set of parameters (electrophysiology, anatomy, fiber
direction, anisotropy and heterogeneity, among others). For
example, our model includes four pulmonary veins, which is the
most common anatomical structure in humans though other
patterns have been observed [94]. In addition, although there are
also inter-subject differences in fiber orientation, we have tried to
model the most common fiber orientation observed experimen-
tally for the different parts of the atrial model. The influence of
aging on the anatomy of the atria is also relevant [95]. Therefore,
more comprehensive results could be obtained when considering
inter-subject variability. Indeed, Romero et al [96] analyzed the
impact of the ionic current variability in line with biological inter-
subject differences, on the APD90 in a model of human ventricular
cells. Recently, a semi-automatic method to incorporate atrial
anisotropy, heterogeneities and fiber orientation into patient
specific models has been developed [97]. Although the fiber
orientation was also based on data from literature and from
different human atria preparations, the specific anatomy of
patients is reproduced in 3D models using data from CT and
MRI. This method could be used to further extend this study for
personalized anatomical models.
Finally, the mesh used in the present study is relatively coarse. It
comprises of 100554 nodes with a spatial resolution ranging from
300 to 700 mm (530 mm in average). Although this discretization is
similar to the used in previous simulation studies of AF [26,51]
recent works have used higher resolutions. Aslanidi et al [62] used
a spatial resolution of 33063306300 mm3 and showed that
decreasing the space step form 330 mm to 250 mm resulted in
very small (,3%) changes of the conduction velocity of AP.
Although a higher spatial resolution could slightly affect to AF
dynamics observed in our study, we would expect similar patterns
of activation. Moreover, these changes would not affect the
relationship between atrial activation patterns and simulated
EGMs.
Conclusions
We have developed a realistic 3D model of human atria with a
very detailed fiber orientation, real anisotropy and electrophysi-
ological properties. Additionally, it includes all main interatrial
connections. To our knowledge, this model is one of the most
complete human atrial models developed.
In our study using an electrically remodeled atria model, a
transient focus induced atrial flutter, reentrant tachycardias and
AF; whereas a continuous ectopic focus provoked AF in all of the
tested sites.
Our model can reproduce the stability and regularity that cause
arrhythmias as AFL, reentrant tachycardia and areas with focal
activity. This electrical activity is reflected in EGM with single
potentials and spectra with a narrow frequency peak and high OI
values. Our model can also reproduce characteristic patterns of
AF, which were maintained by multiple reentrant waves, rotors,
fragmentation and wave collision, which are reflected in
polymorphic EGM and spectra with multiple frequency peaks
and low OI values. Interestingly, EGM potentials with only a
negative deflection are related to spiral and curved wavefronts that
pass and move away. In addition, potentials with a much greater
positive deflection are related with wave collisions. Moreover,
double potentials are related with either wave fragmentations or
blocking lines, while CFAE are related to pivot points.
Finally, this is the first work that uses a 3D human atrial to
investigate the relationship between different atrial arrhythmic
propagation patterns and the EGM observed at more than 43000
points on the atrial surface.
Supporting Information
Video S1 Atrial Flutter (supplements Fig. 5A in themanuscript). Simulation of an AFL episode, triggered by six
ectopic beats applied at the isthmus of the RA (near the CS), and
maintained by a macroreentry rotating counterclockwise around
the tricuspid annulus.
(AVI)
Video S2 Reentrant tachycardia (supplements Fig. 5Bin the manuscript). Simulation of reentrant tachycardia
episode, triggered by six ectopic beats applied at the middle of
the CT, and maintained by a reentry anchored to the RA, moving
between the center and the top areas of the CT.
(AVI)
Video S3 Atrial fibrillation induced by a transitoryfocus (supplements Fig. 6A in the manuscript). Simulation
of AF episode, triggered by six ectopic beats applied in the ostium
of the RPV, and maintained by multiple reentrant waves. Rotors,
figure of eight reentries, macrorreentries, fragmentations and
wavefront collisions can be observed in both atria.
(AVI)
Video S4 Atrial fibrillation induced by a continuousfocus (supplements Fig. 6B in the manuscript). Simulation
of focal AF episode, triggered by a continuous ectopic focus
applied in the ostium of the RPV. Multiple reentrant waves are
observed in the RA and in the superior and anterior walls of LA.
Posterior wall near to RPV show stable activity at high frequency
due to the wavefront generated by the ectopic focus.
(AVI)
Acknowledgments
We would like to thank Felipe Atienza MD, Ph.D, from the Cardiology
Department, Hospital General Universitario Gregorio Maranon, Madrid,
Spain; for his invaluable comments.
Author Contributions
Conceived and developed the model: CT CR JS. Wrote the paper: CT JS.
Performed the experiments: CT EH. Analyzed the data: CT LR FH JS.
References
1. Wolf P, Benjamin E, Belanger A, Kannel W, Levy D, et al. (1996) Secular trends
in the prevalence of atrial fibrillation: The Framingham study. Am Heart J 113:
790–796.
2. Ho SY, Anderson RH, Sanchez-Quintana D (2002) Atrial structure and fibres:
morphologic bases of atrial conduction. Cardiovasc Res 54(2): 325–336.
3. Lesh MD, Kalman JM, Olgin JE, Ellis WS (1996) The role of atrial anatomy in
clinical atrial arrhythmias. J Electrocardiol 29(1): 101–113.
4. Wilders R, Wagner MB, Golod DA, Kumar R, Wang YG, et al. (2000) Effects of
anisotropy on the development of cardiac arrhythmias associated with focal
activity. Pflugers Arch 441: 301–312.
5. Nattel S (2002) New ideas about atrial fibrillation 50 years on. Nature 415(6868):
219–226.
6. Workman AJ, Kane AK, Rankin AC (2001) The contribution of ionic currents
to changes in refractoriness of human atrial myocytes associated with chronic
atrial fibrillation. Cardiovasc Res 52(2): 226–235.
Activation Patterns and EGM in a 3D Atrial Model
PLOS ONE | www.plosone.org 11 February 2013 | Volume 8 | Issue 2 | e50883
7. Bosch RF, Zeng X, Grammer JB, Popovic CM, Mewis C, et al. (1999) Ionic
mechanisms of electrical remodeling in human atrial fibrillation. Cardiovasc Res
44: 121–231.
8. Wijffels MCEF, Kirchhof CJHJ, Dorland R, Allessie MA (1995) Atrial-
fibrillation begets atrial-fibrillation – a study in awake chronically instrumented
goats. Circulation 92(7): 1954–1968.
9. Haissaguerre M, Jais P, Shah DC, Takahashi A, Hocini M, et al. (1998)
Spontaneous initiation of atrial fibrillation by ectopic beats originating in the
pulmonary veins. N Engl J Med 339(10): 659–666.
10. Mandapati R, Skanes A, Chen J, Berenfeld O, Jalife J (2000) Stable
microreentrant sources as a mechanism of atrial fibrillation in the isolated
sheep heart. Circulation 101(2): 194–199.
11. Allessie MA, Bonke FI, Schopman FJ (1977) Circus movement in rabbit atrial
muscle as a mechanism of tachycardia. III. The ‘‘leading circle’’ concept: a new
model of circus movement in cardiac tissue without the involvement of an
anatomical obstacle. Circ Res 41(1): 9–18.
12. Moe GK (1962) On the multiple wavelet hypothesis of atrial fibrillation. Arch Int
Pharmacodyn 140: 183–188.
13. Jacquemet V, Virag N, Ihara Z, Dang L, Blanc O, et al. (2003) Study of unipolar
electrogram morphology in a computer model of atrial fibrillation. J Cardiovasc
Electrophysiol 14: S172–S179.
14. Zlochiver S, Yamazaki M, Kalifa J, Berenfeld O (2008) Rotor meandering
contributes to irregularity in electrograms during atrial fibrillation. Heart
Rhythm 5(6): 846–854.
15. Konings KT, Smeets JL, Penn OC, Wellens HJ, Allessie MA (1997)
Configuration of unipolar atrial electrograms during electrically induced atrial
fibrillation in humans. Circulation 95(5): 1231–1241.
16. Lin YJ, Tai CT, Chen SA (2006) Can mapping and ablation of atrial fibrillation
be guided by frequency analysis of fibrillatory waves? J Cardiovasc Electro-
physiol 17(3): S44–S49.
17. Kalifa J, Tanaka K, Zaitsev AV, Warren M, Vaidyanathan R, et al. (2006)
Mechanisms of wave fractionation at boundaries of high-frequency excitation in
the posterior left atrium of the isolated sheep heart during atrial fibrillation.
Circulation 113(5): 626–633.
18. Berenfeld O, Mandapati R, Dixit S, Skanes AC, Chen J, et al. (2000) Spatially
distributed dominant excitation frequencies reveal hidden organization in atrial
fibrillation in the Langendorff-perfused sheep heart. J Cardiovasc Electrophysiol
11(8): 869–879.
19. Sanders P, Berenfeld O, Hocini M, Jais P, Vaidyanathan R, et al. (2005)
Spectral analysis identifies sites of high-frequency activity maintaining atrial
fibrillation in humans. Circulation 112(6): 789–797.
20. Lazar S, Dixit S, Marchlinski FE, Callans DJ, Gerstenfeld EP (2004) Presence of
left-to-right atrial frequency gradient in paroxysmal but not persistent atrial
fibrillation in humans. Circulation 110(20): 3181–3186.
21. Sanders P, Nalliah CJ, Dubois R, Takahashi Y, Hocini M, et al. (2006)
Frequency mapping of the pulmonary veins in paroxysmal versus permanent
atrial fibrillation. J Cardiovasc Electrophysiol 17(9): 965–972.
22. Everett TH, Kok LC, Vaughn RH, Moorman JR, Haines DE (2001) Frequency
domain algorithm for quantifying atrial fibrillation organization to increase
defibrillation efficacy. IEEE Trans Biomed Eng 48(9): 969–978.
23. Everett TH, Wilson EE, Verheule S, Guerra JM, Foreman S, et al. (2006)
Structural atrial remodeling alters the substrate and spatiotemporal organization
of atrial fibrillation: a comparison in canine models of structural and electrical
atrial remodeling. Am J Physiol Heart Circ Physiol 291(6): H2911–H2923.
24. Skanes AC, Mandapati R, Berenfeld O, Davidenko JM, Jalife J (1998)
Spatiotemporal periodicity during atrial fibrillation in the isolated sheep heart.
Circulation 98(12): 1236–1248.
25. Mansour M, Mandapati R, Berenfeld O, Chen J, Samie FH, et al. (2001) Left-
to-right gradient of atrial frequencies during acute atrial fibrillation in the
isolated sheep heart. Circulation 103(21): 2631–2636.
26. Harrild D, Henriquez C (2000) A computer model of normal conduction in the
human atria. Circ Res 87(7): E25-E36.
27. Ho SY, Sanchez-Quintana D, Cabrera JA, Anderson RH (1999) Anatomy of the
left atrium: implications for radiofrequency ablation of atrial fibrillation. J
Cardiovasc Electrophysiol 10(11): 1525–1533.
28. Cohen GI, White M, Sochowski RA, Klein AL, Bridge PD, et al. (1995)
Reference values for normal adult transesophageal echocardiographic measure-
ments. J Am Soc Echocardiogr 8(3): 221–230.
29. Ho SY, Sanchez-Quintana D, Anderson RH (1998) Can anatomy define electric
pathways? In: International Workshop on Computer Simulation and Experi-
mental Assessment of Electrical Cardiac Function, Lausanne, Switzerland. 77–
86.
30. Nathan H, Eliakim M (1966) The Junction Between the Left Atrium and the
Pulmonary Veins: An Anatomic Study of Human Hearts. Circulation 34: 412–
422.
31. Ho S, Sanchez-Quintana D (2009) The importance of atrial structure and fibers.
Clinical Anatomy 22: 52–63.
32. Tobon C (2009) Evaluacion de factores que provocan fibrilacion auricular y de
su tratamiento mediante tecnicas quirurgicas. Estudio de simulacion. Master
Thesis Universitat Politecnica de Valencia.
33. Ruiz C (2010) Estudio de la vulnerabilidad a reentradas a traves de modelos
matematicos y simulacion de la aurıcula humana. Doctoral Thesis Universitat
Politecnica de Valencia.
34. Tobon C (2010) Modelizacion y evaluacion de factores que favorecen las
arritmias auriculares y su tratamiento mediante tecnicas quirurgicas. Estudio de
simulacion. Doctoral Thesis Universitat Politecnica de Valencia.
35. Nygren A, Fiset C, Firek L, Clark JW, Lindblad DS, et al. (1998) Mathematical
model of an adult human atrial cell: the role of K+ currents in repolarization.
Circ Res 82(1): 63–81.
36. Feng J, Yue L, Wang Z, Nattel S (1998) Ionic mechanisms of regional action
potential heterogeneity in the canine right atrium. Circ Res 83(5): 541–551.
37. Zhang H, Garratt CJ, Zhu J, Holden AV (2005) Role of up-regulation of IK1 in
action potential shortening associated with atrial fibrillation in humans.
Cardiovasc Res 66: 493–502.
38. Clayton RH, Holden AV (2004) Propagation of normal beats and re-entry in a
computational model of ventricular cardiac tissue with regional differences in
action potential shape and duration. Prog Biophys Mol Biol 85: 473–499.
39. Henriquez CS, Papazoglou AA (1996) Using computer models to understand the
roles of tissue structure and membrane dynamics in arrhythmogenesis
Proceedings of the IEEE 84(3): 334–354.
40. Rogers JM, McCulloch AD (1994) A collocation-Galerkin finite element model
of cardiac action potential propagation. IEEE Trans Biomed Eng 41: 743–757.
41. Dolber PC, Spach MS (1989) Structure of canine Bachmann’s bundle related to
propagation of excitation Am J Physiol. 257(5 Pt 2): H1446–H1457.
42. Hayashi H, Lux RL, Wyatt RF, Burgess MJ, Abildskov JA (1982) Relation of
canine atrial activation sequence to anatomic landmarks. Am J Physiol 242(3):
H421–H428.
43. Boineau JP, Canavan TE, Schuessler RB, Cain ME, Corr PB, et al. (1988)
Demonstration of a widely distributed atrial pacemaker complex in the human
heart. Circulation 77(6): 1221–1237.
44. Hansson A, Holm M, Blomstrom P, Johansson R, Luhrs C, et al. (1998) Right
atrial free wall conduction velocity and degree of anisotropy in patients with
stable sinus rhythm studied during open heart surgery. Eur Heart J 19(2): 293–
300.
45. Arora R, Verheule S, Scott L, Navarrete A, Katari V, et al. (2003)
Arrhythmogenic substrate of the pulmonary veins assessed by high-resolution
optical mapping. Circulation 107(13): 1816–1821.
46. Kleber AG, Rudy Y (2004) Basic mechanisms of cardiac impulse propagation
and associated arrhythmias. Physiol Rev 84(2): 431–488.
47. Gima K, Rudy Y (2002) Ionic current basis of electrocardiographic waveforms: a
model study. Circ Res 90: 889–896.
48. Saiz J, Gomis-Tena J, Monserrat M, Ferrero JM, Cardona K, Chorro J (2011)
Effects of the antiarrhythmic drug dofetilide on transmural dispersion of
repolarization in ventriculum. A computer modelling study. IEEE Trans Biomed
Eng 58(1): 43–53.
49. Nademanee K, McKenzie J, Kosar E, Schwab M, Sunsaneewitayakul B, et al.
(2004) A new approach for catheter ablation of atrial fibrillation: mapping of the
electrophysiologic substrate. J Am Coll Cardiol 43: 2044–2053.
50. Takahashi Y, Sanders P, Jais P, Hocini M, Dubois R, et al. (2006) Organization
of frequency spectra of atrial fibrillation: relevance to radiofrequency catheter
ablation. J Cardiovasc Electrophysiol 17(4): 382–388.
51. Gong Y, Xie F, Stein KM, Garfinkel A, Culianu CA, et al. (2007) Mechanism
underlying initiation of paroxysmal atrial flutter/atrial fibrillation by ectopic foci:
a simulation study. Circulation 115: 2094–2102.
52. Heidenreich EA, Ferrero JM, Doblare M, Rodriguez JF (2010) Adaptive macro
finite elements for the numerical solution of monodomain equations in cardiac
electrophysiology. Ann Biomed Eng 38: 2331–2345.
53. Niederer SA, Kerfoot E, Benson AP, Bernabeu MO, Bernus O, et al. (2011)
Verification of cardiac tissue electrophysiology simulators using an N-version
benchmark. Philos Transact A Math Phys Eng Sci 369: 4331–4351.
54. Strang G (1968) On the construction and comparison of difference schemes.
SIAM J. Numer Anal 5(3): 506–517.
55. Kholova I, Kautzner J (2004) Morphology of atrial myocardial extensions into
human caval veins: a postmortem study in patients with and without atrial
fibrillation. Circulation 110: 483–488.
56. Cabrera JA, Sanchez-Quintana D, Ho SY, Medina A, Anderson RH (1998) The
architecture of the atrial musculature between the orifice of the inferior caval
vein and the tricuspid valve: The anatomy of the isthmus. J Cardiovasc
Electrophysiol 9: 1186–1195.
57. Weigner MJ, Katz SE, Douglas PS, Manning WJ (1999) Left atrial appendage
anatomy and function: short term response to sustained atrial fibrillation. Heart
82: 555–558.
58. Wang K, Ho SY, Gibson DG, Anderson RH (1995) Architecture of Atrial
Musculature in Humans. British Heart J 73: 559–565.
59. Lemery R, Guiraudon G, Veinot JP (2003) Anatomic description of Bachmann’s
bundle and its relation to the atrial septum. Am J Cardiol 91(12): 1482–1485.
60. Sanchez-Quintana D, Anderson RH, Cabrera JA, Climent V, Martin R, et al.
(2002) The terminal crest: morphological features relevant to electrophysiology.
Heart 88(4): 406–411.
61. Seemann G, Hoper C, Sachse FB, Dossel O, Holden AV, et al. (2006)
Heterogeneous three-dimensional anatomical and electrophysiological model of
human atria. Philos Transact A Math Phys Eng Sci 364(1843): 1465–1481.
62. Aslanidi OV, Colman MA, Stott J, Dobrzynski H, Boyett MR, et al. (2011) 3D
virtual human atria: A computational platform for studying clinical atrial
fibrillation. Prog Biophys Mol Biol 107(1): 156–168.
Activation Patterns and EGM in a 3D Atrial Model
PLOS ONE | www.plosone.org 12 February 2013 | Volume 8 | Issue 2 | e50883
63. Krogh-Madsen T, Abbott GW, Christini DJ (2012) Effects of Electrical and
Structural Remodeling on Atrial Fibrillation Maintenance: A Simulation Study.PLoS Comput Biol 8(2): e1002390.
64. Zhao J, Butters TD, Zhang H, Pullan AJ, LeGrice IJ, et al. (2012) An image-
based model of atrial muscular architecture: effects of structural anisotropy onelectrical activation. Circ Arrhythm Electrophysiol 5: 361–370.
65. Antz M, Otomo K, Arruda M, Scherlag BJ, Pitha J, et al. (1998) Electricalconduction between the right atrium and the left atrium via the musculature of
the coronary sinus. Circulation 98(17): 1790–1795.
66. Lemery R, Birnie D, Tang AS, Green M, Gollob M, et al. (2007) Normal atrialactivation and voltage during sinus rhythm in the human heart: an endocardial
and epicardial mapping study in patients with a history of atrial fibrillation. JCardiovasc Electrophysiol 18(4): 402–408.
67. Canavan TE, Schuessler RB, Cain ME, Lindsay BD, Boineau JP, et al. (1988)Computerized global electrophysiological mapping of the atrium in a patient
with multiple supraventricular tachyarrhythmias. Ann Thorac Surg 46(2): 232–
235.68. Durrer D, van Dam RT, Freud GE, Janse MJ, Meijler FL, et al. (1970) Total
excitation of the isolated human heart. Circulation 41(6): 899–912.69. Franz MR, Karasik PL, Li C, Moubarak J, Chavez M (1997) Electrical
remodeling of the human atrium: similar effects in patients with chronic atrial
fibrillation and atrial flutter. J Am Coll Cardiol 30(7): 1785–1792.70. Gaspo R, Bosch RF, Talajic M, Nattel S (1997) Functional mechanisms
underlying tachycardia-induced sustained atrial fibrillation in a chronic dogmodel. Circulation 96(11): 4027–4035.
71. Chen SA, Hsieh MH, Tai CT, Tsai CF, Prakash VS, et al. (1999) Initiation ofatrial fibrillation by ectopic beats originating from the pulmonary veins:
electrophysiological characteristics, pharmacological responses, and effects of
radiofrequency ablation. Circulation 100(18): 1879–1886.72. Lin WS, Tai CT, Hsieh MH, Tsai CF, Lin YK, et al. (2003) Catheter ablation of
paroxysmal atrial fibrillation initiated by non-pulmonary vein ectopy. Circula-tion 107(25): 3176–3183.
73. Saoudi N, Cosıo F, Waldo A, Chen SA, Iesaka Y, et al. (2001) A classification of
atrial flutter and regular atrial tachycardia according to electrophysiologicalmechanisms and anatomical bases. Eur Heart J 22: 1162–1182.
74. Friedman PA, Luria D, Fenton AM, Munger TM, Jahangir A, et al. (2000)Global right atrial mapping of human atrial flutter: the presence of
posteromedial (sinus venosa region) functional block and double potentials: astudy in biplane fluoroscopy and intracardiac echocardiography. Circulation
101(13): 1568–1577.
75. Derejko P, Bodalski R, Szumowski LJ, Kozlowski D, Urbanek P, et al. (2010)Relationship between cycle length of typical atrial flutter and double potential
interval after achievement of complete isthmus block. Pacing Clin Electrophysiol33(12): 1518–1527.
76. Grimm RA, Chandra S, Klein AL, Stewart WJ, Black IW, et al. (1996)
Characterization of left atrial appendage Doppler flow in atrial fibrillation andflutter by Fourier analysis Am Heart J. 132(2 Pt 1): 286–296.
77. Ryu K, Sahadevan J, Khrestian CM, Stambler BS, Waldo AL (2006) Use of fastfourier transform analysis of atrial electrograms for rapid characterization of
atrial activation-implications for delineating possible mechanisms of atrialtachyarrhythmias. J Cardiovasc Electrophysiol 17(2): 198–206.
78. Olshansky B, Wilber DJ, Hariman RJ (1992) Atrial flutter – update on the
mechanism and treatment. Pacing Clin Electrophysiol 15(12): 2308–2335.79. Kalman JM, Olgin JE, Karch MR, Hamdan M, Lee RJ, et al. (1998) ‘‘Cristal
tachycardias’’: origin of right atrial tachycardias from the crista terminalisidentified by intracardiac echocardiography. J Am Coll Cardiol 31(2): 451–459.
80. Becker R, Bauer A, Metz S, Kinscherf R, Senges JC, et al. (2001) Intercaval
block in normal canine hearts: role of the terminal crest. Circulation 103(20):
2521–2526.
81. Chorro FJ, Ferrero A, Canoves J, Mainar L, Porres JC, et al. (2003) Significance
of the morphological patterns of electrograms recorded during ventricular
fibrillation: an experimental study. Pacing Clin Electrophysiol 26(5): 1262–1269.
82. Berenfeld O, Zaitsev AV, Mironov SF, Pertsov AM, Jalife J (2002) Frequency-
dependent breakdown of wave propagation into fibrillatory conduction across
the pectinate muscle network in the isolated sheep right atrium. Circ Res 90:
1173–1180.
83. Jalife J (2003) Rotors and spiral waves in atrial fibrillation. J Cardiovasc
Electrophysiol 14(7): 776–780.
84. Nademanee K, Lockwood E, Oketani N, Gidney B (2010) Catheter ablation of
atrial fibrillation guided by complex fractionated atrial electrogram mapping of
atrial fibrillation substrate. J Cardiology 55: 1–12.
85. Sahadevan J, Ryu K, Peltz L, Khrestian CM, Stewart RW, et al. (2004)
Epicardial mapping of chronic atrial fibrillation in patients: preliminary
observations. Circulation 110(21): 3293–3299.
86. Dossel O, Krueger MW, Weber FM, Wilhelms M, Seemann G (2012)
Computational modeling of the human atrial anatomy and electrophysiology.
Med Biol Eng Comput 50: 773–799.
87. Courtemanche M, Ramirez RJ, Nattel S (1999) Ionic targets for drug therapy
and atrial fibrillation-induced electrical remodeling: insights from a mathemat-
ical model. Cardiovasc Res 42: 477–489.
88. Sanchez C, Corrias A, Bueno-Orovio A, Davies M, Swinton J, et al. (2012) The
Na+/K+ pump is an important modulator of refractoriness and rotor dynamics
in human atrial tissue. Am J Physiol Heart Circ Physiol 302: H1146-H1159.
89. Maleckar MM, Greenstein JL, Giles WR, Trayanova NA (2009) K+ current
changes account for the rate dependence os the action potential in the human
atrial myocyte Am J Physiol Heart Circ Physiol 297: H1398–H1410.
90. Grandi E, Pandit SV, Voigt N, Workman AJ, Dobrev D, et al. (2011) Human
atrial action potential and Ca2+ model: sinus rhythm and chronic atrial
fibrillation. Circ Res 109(9): 1055–1066.
91. Maleckar MM, Greenstein JL, Giles WR, Trayanova NA (2009) Eletrotonic
coupling beteen human atrial myocytes and fibroblasts aters myocyte excitability
and repolarization. Biophys J 97:2179–2190.
92. Ashihara T, Haraguchi R, Nakazawa K, Namba T, Ikeda T, et al. (2012) The
role of fibroblasts in complex fractionated electrograms during persistent/
permanent atrial fibrillation: implications for electrogram-based catheter
ablation. Circ Res 110: 275–284.
93. Burstein B, Nattel S (2008) Atrial Fibrosis: Mechanisms and Clinical Relevance
in Atrial Fibrillation. J Am Coll Cardiol 51: 802–809.
94. Marom EM, Herndon JE, Kim YH, McAdams HP (2004) Variations in
pulmonary venous drainage to the left atrium: implications for radiofrequency
ablation. Radiology 230: 824–829.
95. Pan NH, Tsao HM, Chang NC, Chen YJ, Chen SA (2008) Aging dilates atrium
and pulmonary veins: implications for the genesis of atrial fibrillation. Chest 133:
190–196.
96. Romero L, Pueyo E, Fink M, Rodriguez B (2009) Impact of ionic current
variability on human ventricular cellular electrophysiology. Am J Physiol Heart
Circ Physiol 297: H1436–1445.
97. Krueger MW, Schmidt V, Tobon C, Weber FM, Lorenz C, et al. (2011)
Modeling Atrial Fiber Orientation in Patient-Specific Geometries: A Semi-
automatic Rule-Based Approach. Lecture Notes in Computer Science 6666:
223–232.
Activation Patterns and EGM in a 3D Atrial Model
PLOS ONE | www.plosone.org 13 February 2013 | Volume 8 | Issue 2 | e50883