Embed Size (px)
Citation preview
FOR RELEASE MARCH 1, 2018.
BY Aaron Smith and Monica Anderson
FOR MEDIA OR OTHER INQUIRIES:
Aaron Smith, Associate Director, Research
Monica Anderson, Research Associate
Tom Caiazza, Communications Manager
202.419.4372
www.pewresearch.org
RECOMMENDED CITATION
Pew Research Center, March 2018, “Social
Media Use in 2018”
1
PEW RESEARCH CENTER
www.pewresearch.org
About Pew Research Center
Pew Research Center is a nonpartisan fact tank that informs the public about the issues, attitudes
and trends shaping America and the world. It does not take policy positions. It conducts public
opinion polling, demographic research, content analysis and other data-driven social science
research. The Center studies U.S. politics and policy; journalism and media; internet, science and
technology; religion and public life; Hispanic trends; global attitudes and trends; and U.S. social
and demographic trends. All of the Center’s reports are available at www.pewresearch.org. Pew
Research Center is a subsidiary of The Pew Charitable Trusts, its primary funder.
© Pew Research Center 2018
2
PEW RESEARCH CENTER
www.pewresearch.org
0
20
40
60
80
2012 2013 2014 2015 2016 2017 2018
Facebook 68
Pinterest 29
Snapchat 27
WhatsApp 22
Instagram 35
LinkedIn 25
Twitter 24
YouTube 73%
Social Media Use in 2018
A new Pew Research Center
survey of U.S. adults finds that
the social media landscape in
early 2018 is defined by a mix
of long-standing trends and
newly emerging narratives.
Facebook and YouTube
dominate this landscape, as
notable majorities of U.S.
adults use each of these sites.
At the same time, younger
Americans (especially those
ages 18 to 24) stand out for
embracing a variety of
platforms and using them
frequently. Some 78% of 18- to
24-year-olds use Snapchat, and
a sizeable majority of these
users (71%) visit the platform
multiple times per day.
Similarly, 71% of Americans in
this age group now use
Instagram and close to half
(45%) are Twitter users.
As has been the case since the
Center began surveying about
the use of different social media in 2012, Facebook remains the primary platform for most
Americans. Roughly two-thirds of U.S. adults (68%) now report that they are Facebook users, and
roughly three-quarters of those users access Facebook on a daily basis. With the exception of those
65 and older, a majority of Americans across a wide range of demographic groups now use
Facebook.
Majority of Americans now use Facebook, YouTube
% of U.S. adults who say they use the following social media sites online or
on their cellphone
Note: Pre-2018 telephone poll data is not available for YouTube, Snapchat or WhatsApp.
Source: Survey conducted Jan. 3-10, 2018. Trend data from previous Pew Research Center
surveys.
“Social Media Use in 2018”
PEW RESEARCH CENTER
3
PEW RESEARCH CENTER
www.pewresearch.org
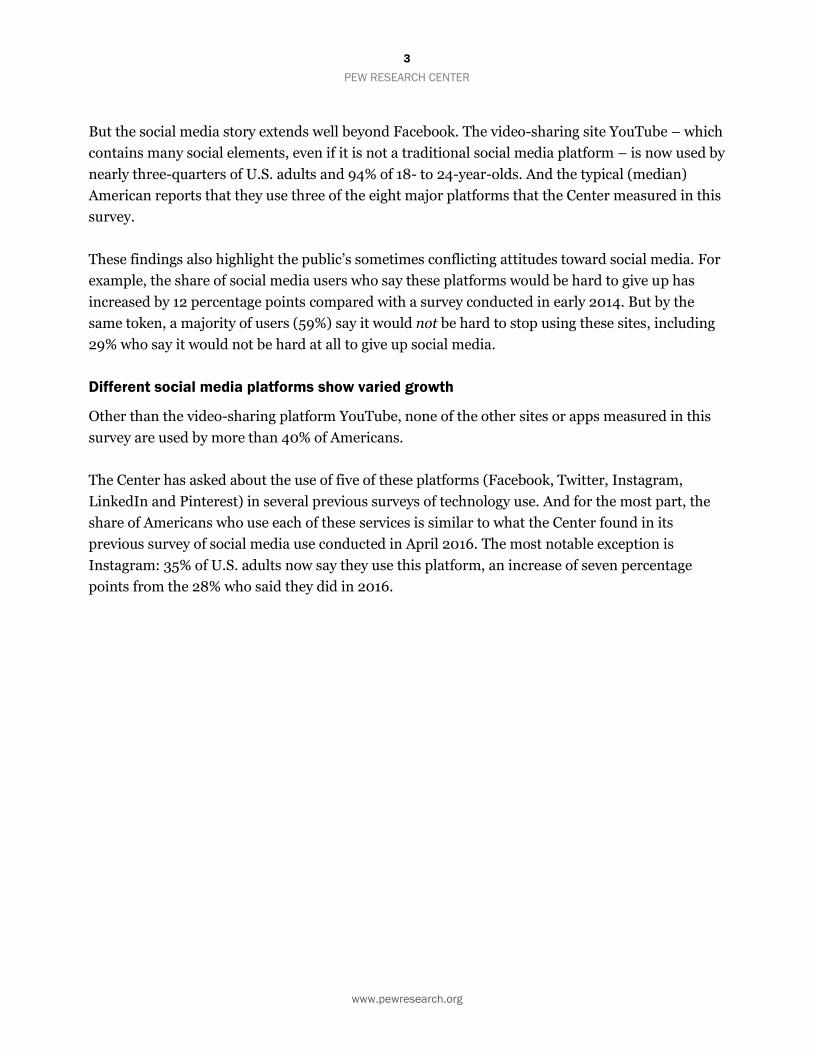
But the social media story extends well beyond Facebook. The video-sharing site YouTube – which
contains many social elements, even if it is not a traditional social media platform – is now used by
nearly three-quarters of U.S. adults and 94% of 18- to 24-year-olds. And the typical (median)
American reports that they use three of the eight major platforms that the Center measured in this
survey.
These findings also highlight the public’s sometimes conflicting attitudes toward social media. For
example, the share of social media users who say these platforms would be hard to give up has
increased by 12 percentage points compared with a survey conducted in early 2014. But by the
same token, a majority of users (59%) say it would not be hard to stop using these sites, including
29% who say it would not be hard at all to give up social media.
Different social media platforms show varied growth
Other than the video-sharing platform YouTube, none of the other sites or apps measured in this
survey are used by more than 40% of Americans.
The Center has asked about the use of five of these platforms (Facebook, Twitter, Instagram,
LinkedIn and Pinterest) in several previous surveys of technology use. And for the most part, the
share of Americans who use each of these services is similar to what the Center found in its
previous survey of social media use conducted in April 2016. The most notable exception is
Instagram: 35% of U.S. adults now say they use this platform, an increase of seven percentage
points from the 28% who said they did in 2016.
4
PEW RESEARCH CENTER
www.pewresearch.org
7
71
45
94%
78
14
56%
55
16
0 20 40 60 80 100
YouTube
Snapchat
80
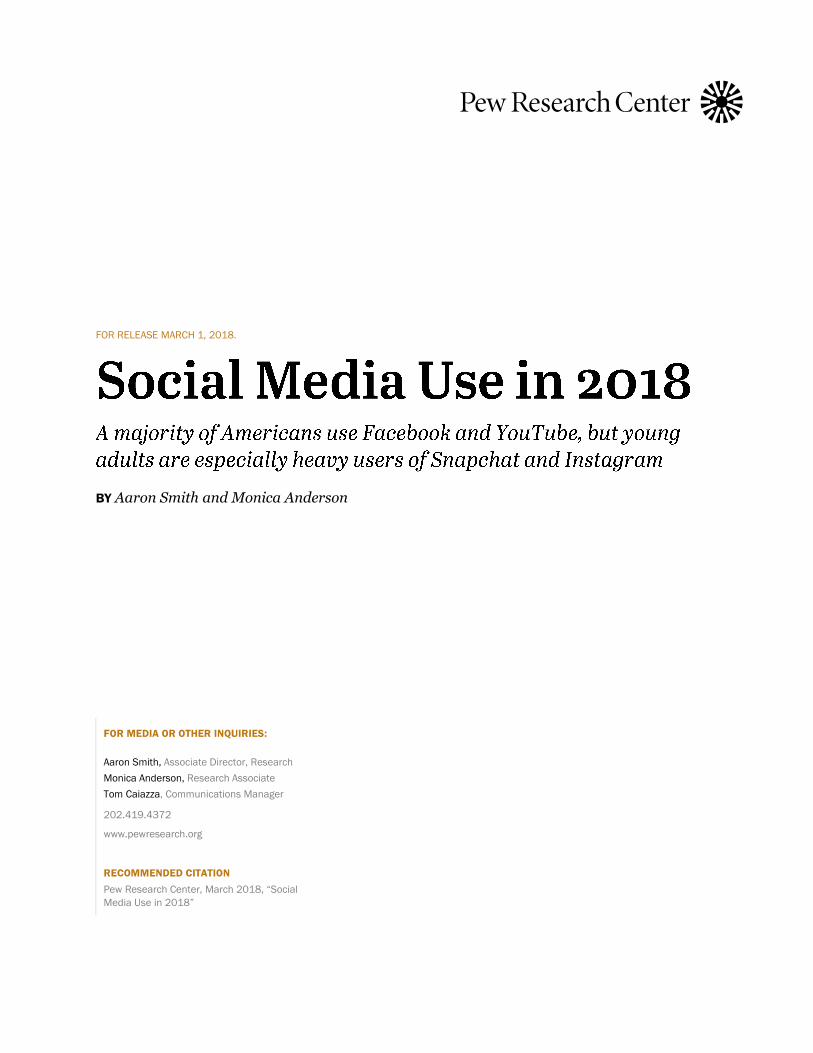
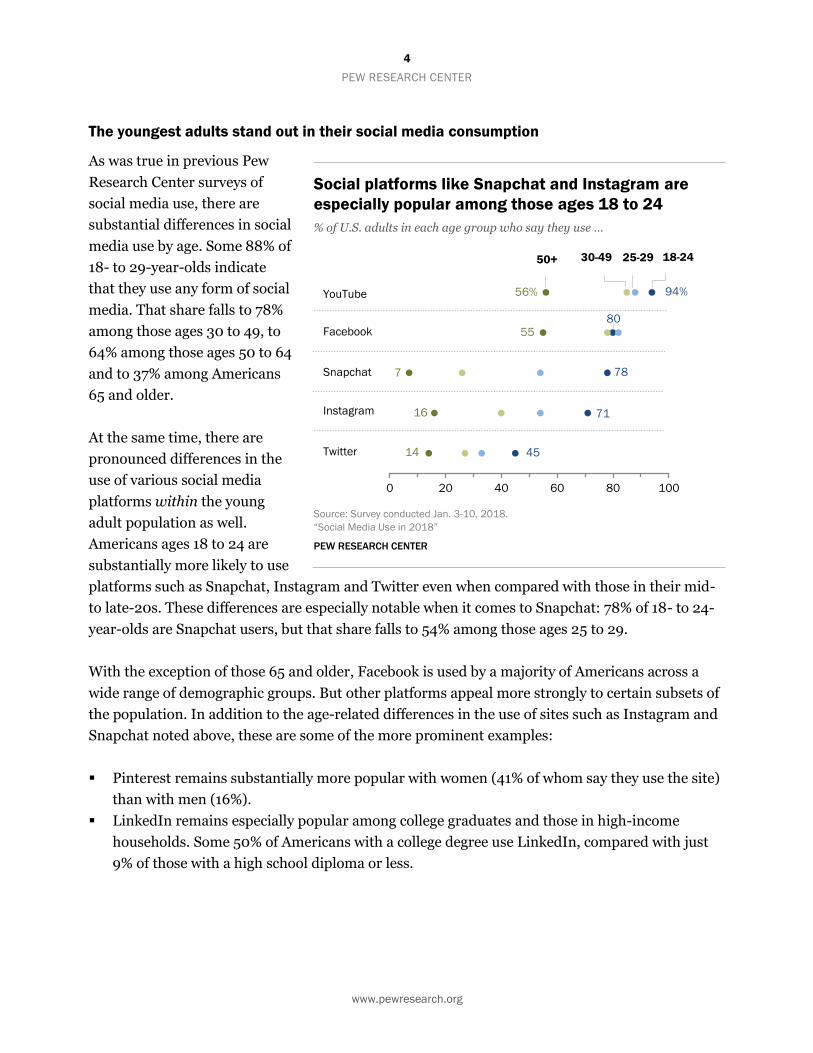
The youngest adults stand out in their social media consumption
As was true in previous Pew
Research Center surveys of
social media use, there are
substantial differences in social
media use by age. Some 88% of
18- to 29-year-olds indicate
that they use any form of social
media. That share falls to 78%
among those ages 30 to 49, to
64% among those ages 50 to 64
and to 37% among Americans
65 and older.
At the same time, there are
pronounced differences in the
use of various social media
platforms within the young
adult population as well.
Americans ages 18 to 24 are
substantially more likely to use
platforms such as Snapchat, Instagram and Twitter even when compared with those in their mid-
to late-20s. These differences are especially notable when it comes to Snapchat: 78% of 18- to 24-
year-olds are Snapchat users, but that share falls to 54% among those ages 25 to 29.
With the exception of those 65 and older, Facebook is used by a majority of Americans across a
wide range of demographic groups. But other platforms appeal more strongly to certain subsets of
the population. In addition to the age-related differences in the use of sites such as Instagram and
Snapchat noted above, these are some of the more prominent examples:
Pinterest remains substantially more popular with women (41% of whom say they use the site)
than with men (16%).
LinkedIn remains especially popular among college graduates and those in high-income
households. Some 50% of Americans with a college degree use LinkedIn, compared with just
9% of those with a high school diploma or less.
Social platforms like Snapchat and Instagram are
especially popular among those ages 18 to 24
% of U.S. adults in each age group who say they use …
Source: Survey conducted Jan. 3-10, 2018.
“Social Media Use in 2018”
PEW RESEARCH CENTER
18-24 25-29 30-49 50+
5
PEW RESEARCH CENTER
www.pewresearch.org
51%
49
38
26
29
23%
14
22
20
17
26%
36
39
53
55
Snapchat
YouTube
NET
Daily Several times a day
The messaging service WhatsApp is popular in Latin America, and this popularity also extends
to Latinos in the United States – 49% of Hispanics report that they are WhatsApp users,
compared with 14% of whites and 21% of blacks.
For more details on social media platform use by different demographic groups, see Appendix A.
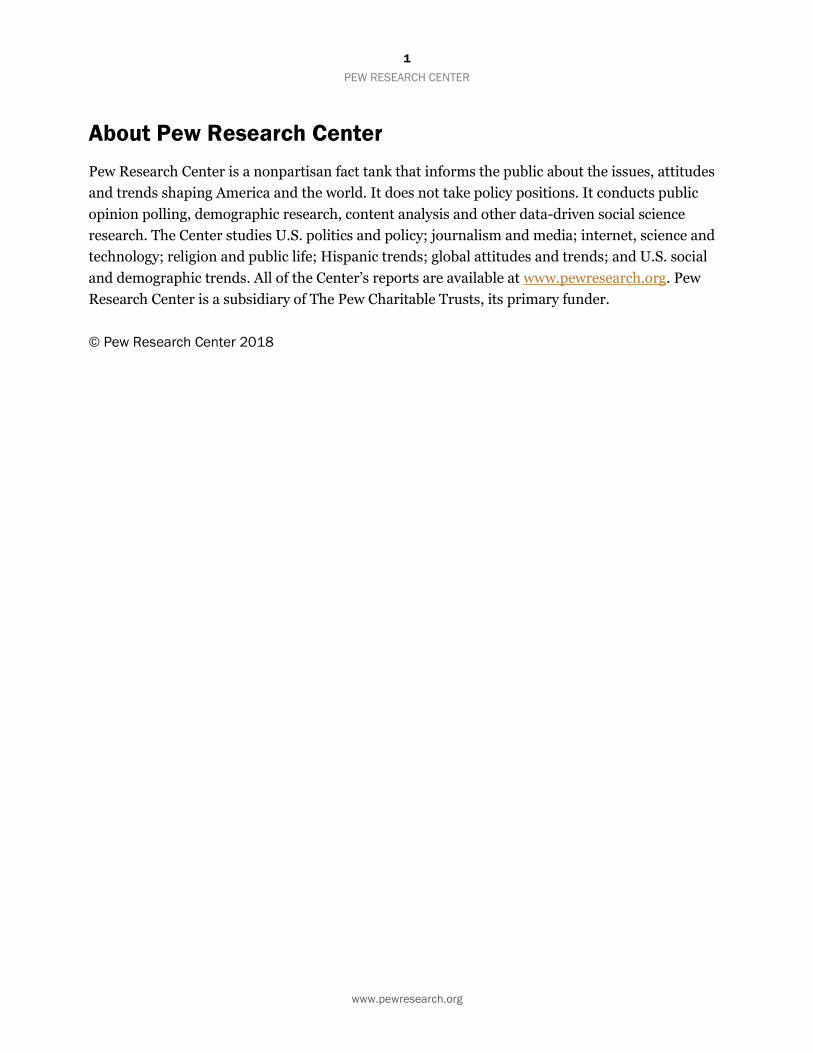
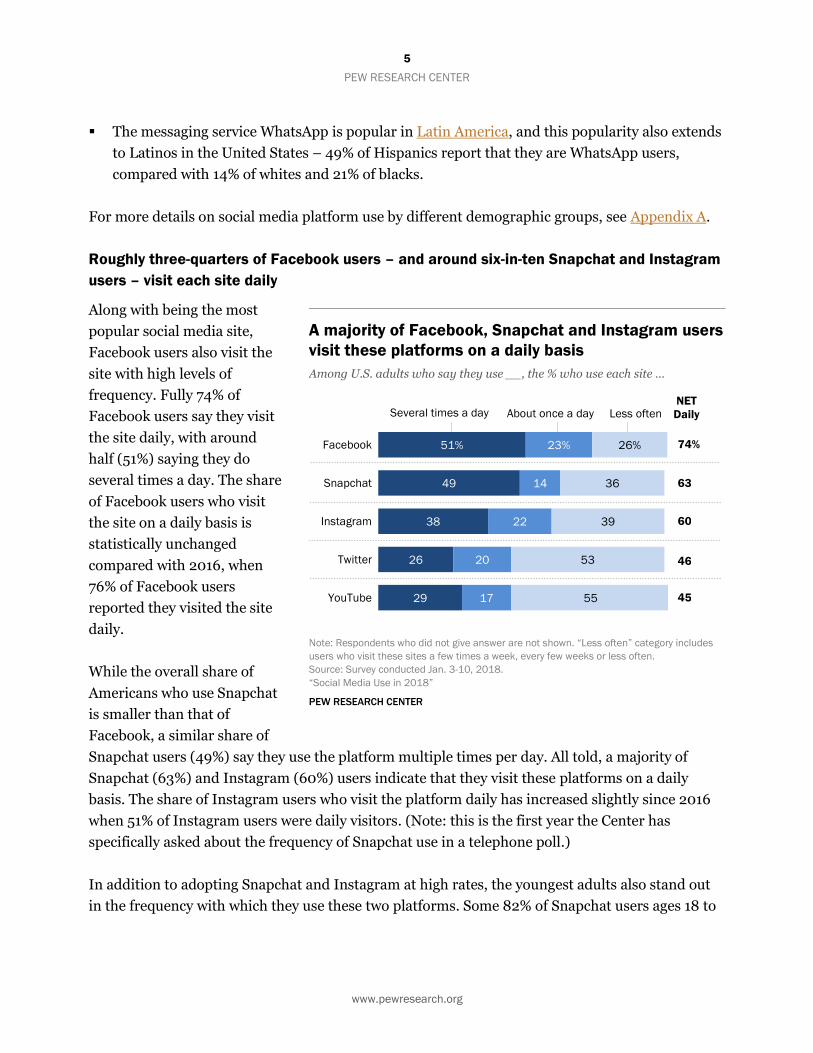
Roughly three-quarters of Facebook users – and around six-in-ten Snapchat and Instagram
users – visit each site daily
Along with being the most
popular social media site,
Facebook users also visit the
site with high levels of
frequency. Fully 74% of
Facebook users say they visit
the site daily, with around
half (51%) saying they do
several times a day. The share
of Facebook users who visit
the site on a daily basis is
statistically unchanged
compared with 2016, when
76% of Facebook users
reported they visited the site
daily.
While the overall share of
Americans who use Snapchat
is smaller than that of
Facebook, a similar share of
Snapchat users (49%) say they use the platform multiple times per day. All told, a majority of
Snapchat (63%) and Instagram (60%) users indicate that they visit these platforms on a daily
basis. The share of Instagram users who visit the platform daily has increased slightly since 2016
when 51% of Instagram users were daily visitors. (Note: this is the first year the Center has
specifically asked about the frequency of Snapchat use in a telephone poll.)
In addition to adopting Snapchat and Instagram at high rates, the youngest adults also stand out
in the frequency with which they use these two platforms. Some 82% of Snapchat users ages 18 to
A majority of Facebook, Snapchat and Instagram users
visit these platforms on a daily basis
Among U.S. adults who say they use __, the % who use each site …
Note: Respondents who did not give answer are not shown. “Less often” category includes
users who visit these sites a few times a week, every few weeks or less often.
Source: Survey conducted Jan. 3-10, 2018.
“Social Media Use in 2018”
PEW RESEARCH CENTER
74%
63
60
46
45
About once a day Less often
6
PEW RESEARCH CENTER
www.pewresearch.org
24 say they use the platform daily, with 71% indicating that they use it multiple times per day.
Similarly, 81% of Instagram users in this age group visit the platform on daily basis, with 55%
reporting that they do so several times per day.
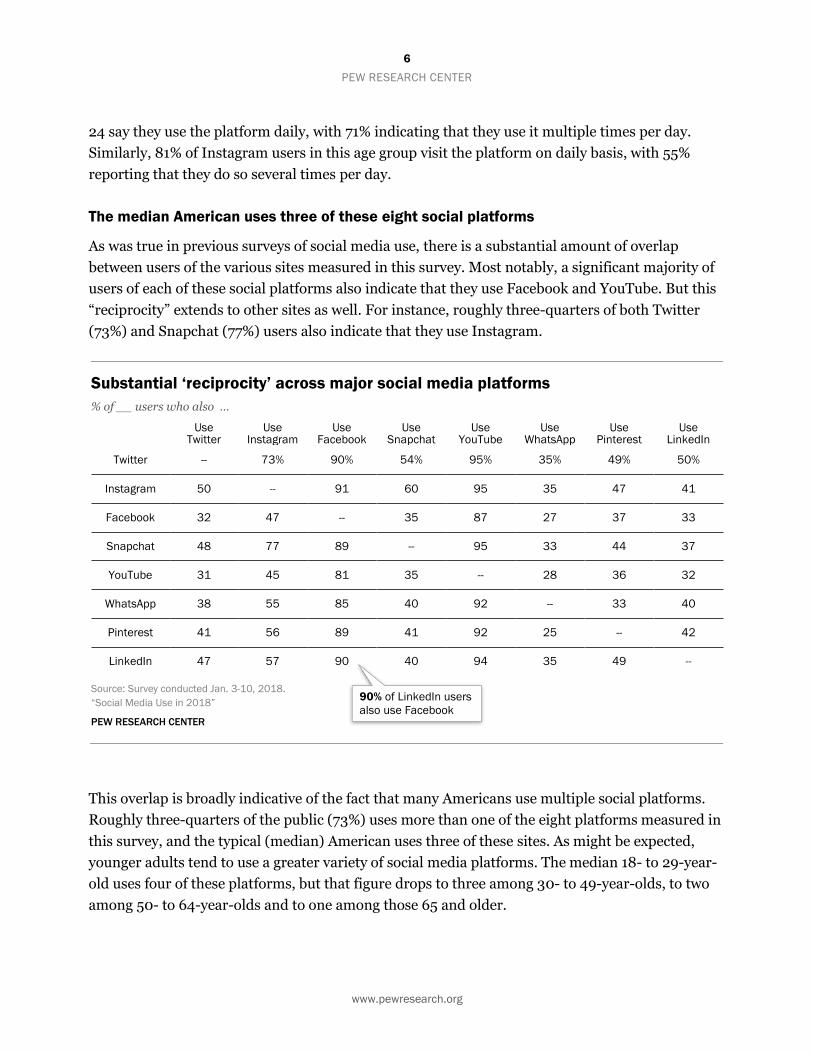
The median American uses three of these eight social platforms
As was true in previous surveys of social media use, there is a substantial amount of overlap
between users of the various sites measured in this survey. Most notably, a significant majority of
users of each of these social platforms also indicate that they use Facebook and YouTube. But this
“reciprocity” extends to other sites as well. For instance, roughly three-quarters of both Twitter
(73%) and Snapchat (77%) users also indicate that they use Instagram.
Substantial ‘reciprocity’ across major social media platforms
% of __ users who also …
Use
Twitter Use
Instagram Use
Facebook Use
Snapchat Use
YouTube Use
WhatsApp Use
Pinterest Use
Twitter -- 73% 90% 54% 95% 35% 49% 50%
Instagram 50 -- 91 60 95 35 47 41
Facebook 32 47 -- 35 87 27 37 33
Snapchat 48 77 89 -- 95 33 44 37
YouTube 31 45 81 35 -- 28 36 32
WhatsApp 38 55 85 40 92 -- 33 40
Pinterest 41 56 89 41 92 25 -- 42
LinkedIn 47 57 90 40 94 35 49 --
Source: Survey conducted Jan. 3-10, 2018.
“Social Media Use in 2018”
PEW RESEARCH CENTER
This overlap is broadly indicative of the fact that many Americans use multiple social platforms.
Roughly three-quarters of the public (73%) uses more than one of the eight platforms measured in
this survey, and the typical (median) American uses three of these sites. As might be expected,
younger adults tend to use a greater variety of social media platforms. The median 18- to 29-year-
old uses four of these platforms, but that figure drops to three among 30- to 49-year-olds, to two
among 50- to 64-year-olds and to one among those 65 and older.
90% of LinkedIn users
also use Facebook
90% of LinkedIn users
also use Facebook
7
PEW RESEARCH CENTER
www.pewresearch.org
59%
49
60
56
66
40%
51
40
43
33
Hard to give up
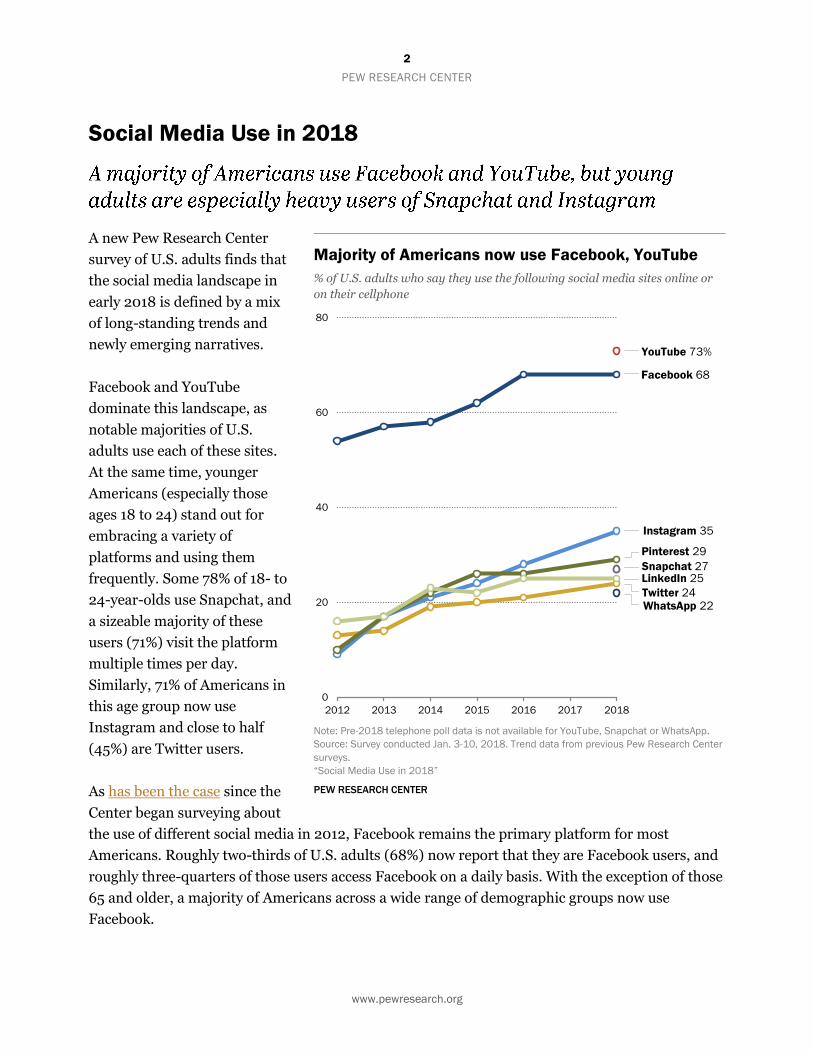
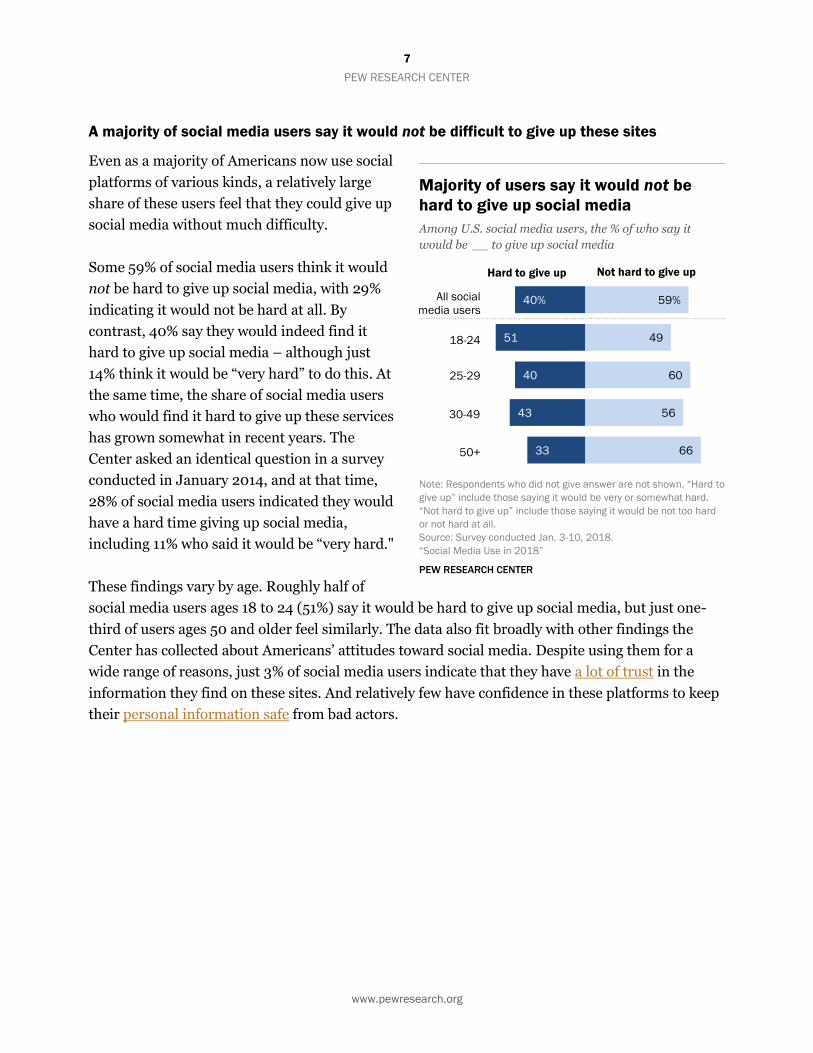
A majority of social media users say it would not be difficult to give up these sites
Even as a majority of Americans now use social
platforms of various kinds, a relatively large
share of these users feel that they could give up
social media without much difficulty.
Some 59% of social media users think it would
not be hard to give up social media, with 29%
indicating it would not be hard at all. By
contrast, 40% say they would indeed find it
hard to give up social media – although just
14% think it would be “very hard” to do this. At
the same time, the share of social media users
who would find it hard to give up these services
has grown somewhat in recent years. The
Center asked an identical question in a survey
conducted in January 2014, and at that time,
28% of social media users indicated they would
have a hard time giving up social media,
including 11% who said it would be “very hard."
These findings vary by age. Roughly half of
social media users ages 18 to 24 (51%) say it would be hard to give up social media, but just one-
third of users ages 50 and older feel similarly. The data also fit broadly with other findings the
Center has collected about Americans’ attitudes toward social media. Despite using them for a
wide range of reasons, just 3% of social media users indicate that they have a lot of trust in the
information they find on these sites. And relatively few have confidence in these platforms to keep
their personal information safe from bad actors.
Majority of users say it would not be
hard to give up social media
Among U.S. social media users, the % of who say it
would be __ to give up social media
Note: Respondents who did not give answer are not shown. “Hard to
give up” include those saying it would be very or somewhat hard.
“Not hard to give up” include those saying it would be not too hard
or not hard at all.
Source: Survey conducted Jan. 3-10, 2018.
“Social Media Use in 2018”
PEW RESEARCH CENTER
All social
media users
18-24
25-29
30-49
50+
Not hard to give up
Acknowledgments
This report is a collaborative effort based on the input and analysis of the following individuals.
Find related reports online at pewresearch.org/internet.
Primary researchers
Aaron Smith, Associate Director, Research
Monica Anderson, Research Associate
Jingjing Jiang, Research Analyst
Research team
Lee Rainie, Director, Internet and Technology Research
Kenneth Olmstead, Research Associate
Editorial and graphic design
Margaret Porteus, Information Graphics Designer
Shannon Greenwood, Copy editor
Communications and web publishing
Tom Caiazza, Communications Manager
Shannon Greenwood, Associate Digital Producer
1
PEW RESEARCH CENTER
www.pewresearch.org
Methodology
The analysis in this report is based on telephone interviews conducted Jan. 3-10, 2018, among a
national sample of 2,002 adults, 18 years of age or older, living in all 50 U.S. states and the District
of Columbia (500 respondents were interviewed on a landline telephone, and 1,502 were
interviewed on a cellphone, including 1,071 who had no landline telephone). The survey was
conducted by interviewers under the direction of Abt Associates. A combination of landline and
cellphone random-digit-dial samples were used; both samples were provided by Survey Sampling
International. Interviews were conducted in English and Spanish. Respondents in the landline
sample were selected by randomly asking for the youngest adult male or female who is now at
home. Interviews in the cell sample were conducted with the person who answered the phone, if
that person was an adult 18 years of age or older. For detailed information about our survey
methodology, see: http://www.pewresearch.org/methodology/u-s-survey-research/
The combined landline and cellphone sample are weighted using an iterative technique that
matches gender, age, education, race, Hispanic origin and nativity and region to parameters from
the 2016 Census Bureau’s American Community Survey one-year estimates and population
density to parameters from the Decennial Census. The sample also is weighted to match current
patterns of telephone status (landline only, cellphone only, or both landline and cellphone), based
on extrapolations from the 2016 National Health Interview Survey. The weighting procedure also
accounts for the fact that respondents with both landline and cellphones have a greater probability
of being included in the combined sample and adjusts for household size among respondents with
a landline phone. The margins of error reported and statistical tests of significance are adjusted to
account for the survey’s design effect, a measure of how much efficiency is lost from the weighting
procedures.
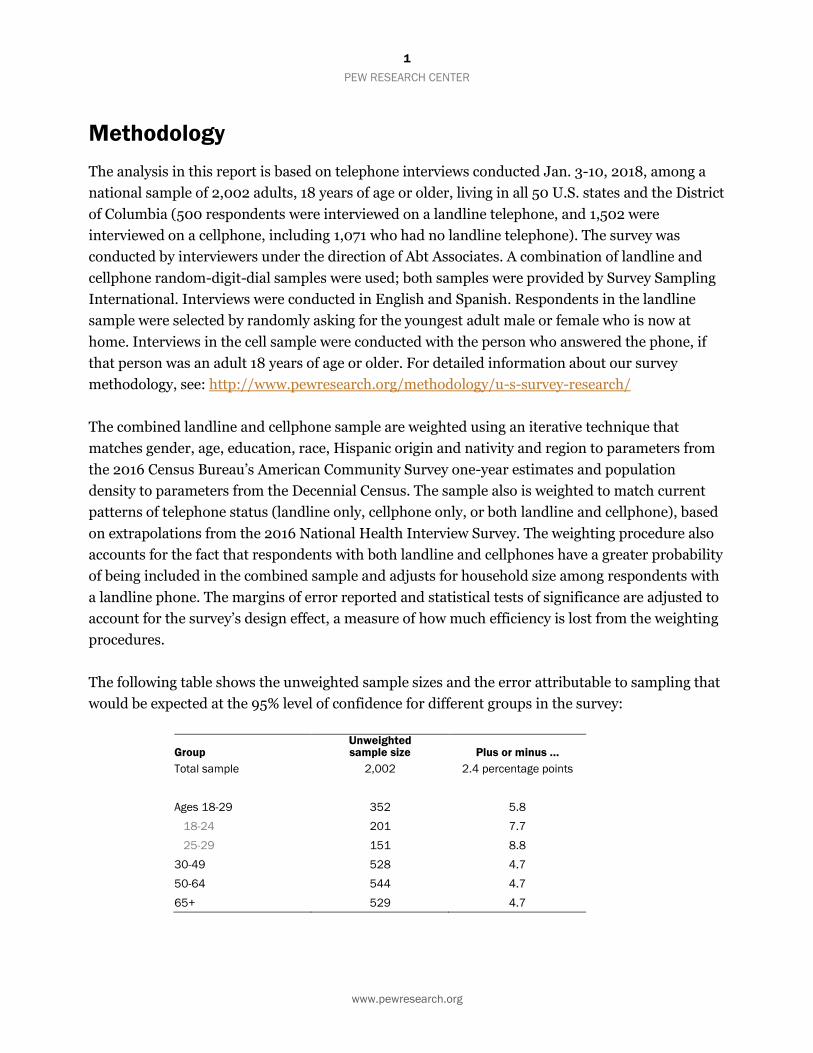
The following table shows the unweighted sample sizes and the error attributable to sampling that
would be expected at the 95% level of confidence for different groups in the survey:
Group Unweighted sample size Plus or minus …
Total sample 2,002 2.4 percentage points
Ages 18-29 352 5.8
18-24 201 7.7
25-29 151 8.8
30-49 528 4.7
50-64 544 4.7
65+ 529 4.7
2
PEW RESEARCH CENTER
www.pewresearch.org
Sample sizes and sampling errors for other subgroups are available upon request.
In addition to sampling error, one should bear in mind that question wording and practical
difficulties in conducting surveys can introduce error or bias into the findings of opinion polls.
Pew Research Center undertakes all polling activity, including calls to mobile telephone numbers,
in compliance with the Telephone Consumer Protection Act and other applicable laws.
Pew Research Center is a nonprofit, tax-exempt 501(c)(3) organization and a subsidiary of The
Pew Charitable Trusts, its primary funder.

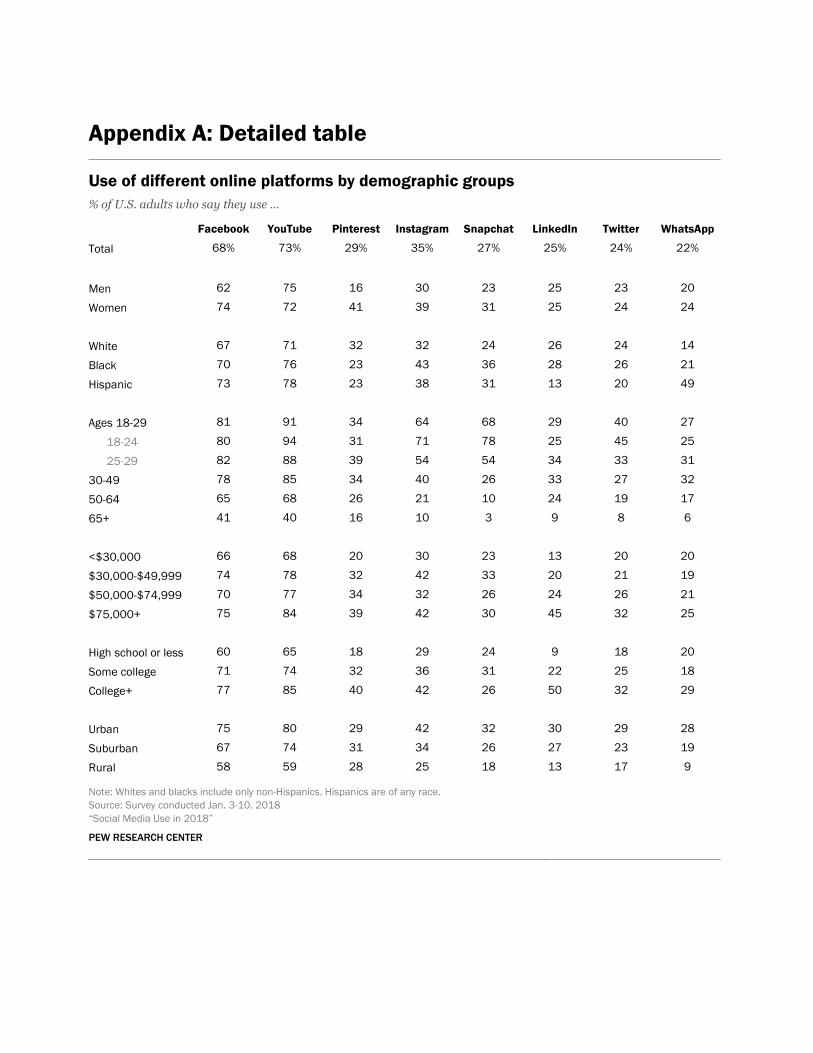
Appendix A: Detailed table
Use of different online platforms by demographic groups
% of U.S. adults who say they use …
Facebook YouTube Pinterest Instagram Snapchat LinkedIn Twitter WhatsApp
Total 68% 73% 29% 35% 27% 25% 24% 22%
Men 62 75 16 30 23 25 23 20
Women 74 72 41 39 31 25 24 24
White 67 71 32 32 24 26 24 14
Black 70 76 23 43 36 28 26 21
Hispanic 73 78 23 38 31 13 20 49
Ages 18-29 81 91 34 64 68 29 40 27
18-24 80 94 31 71 78 25 45 25
25-29 82 88 39 54 54 34 33 31
30-49 78 85 34 40 26 33 27 32
50-64 65 68 26 21 10 24 19 17
65+ 41 40 16 10 3 9 8 6
<$30,000 66 68 20 30 23 13 20 20
$30,000-$49,999 74 78 32 42 33 20 21 19
$50,000-$74,999 70 77 34 32 26 24 26 21
$75,000+ 75 84 39 42 30 45 32 25
High school or less 60 65 18 29 24 9 18 20
Some college 71 74 32 36 31 22 25 18
College+ 77 85 40 42 26 50 32 29
Urban 75 80 29 42 32 30 29 28
Suburban 67 74 31 34 26 27 23 19
Rural 58 59 28 25 18 13 17 9
Note: Whites and blacks include only non-Hispanics. Hispanics are of any race.
Source: Survey conducted Jan. 3-10. 2018
“Social Media Use in 2018”
PEW RESEARCH CENTER
1
PEW RESEARCH CENTER
www.pewresearch.org
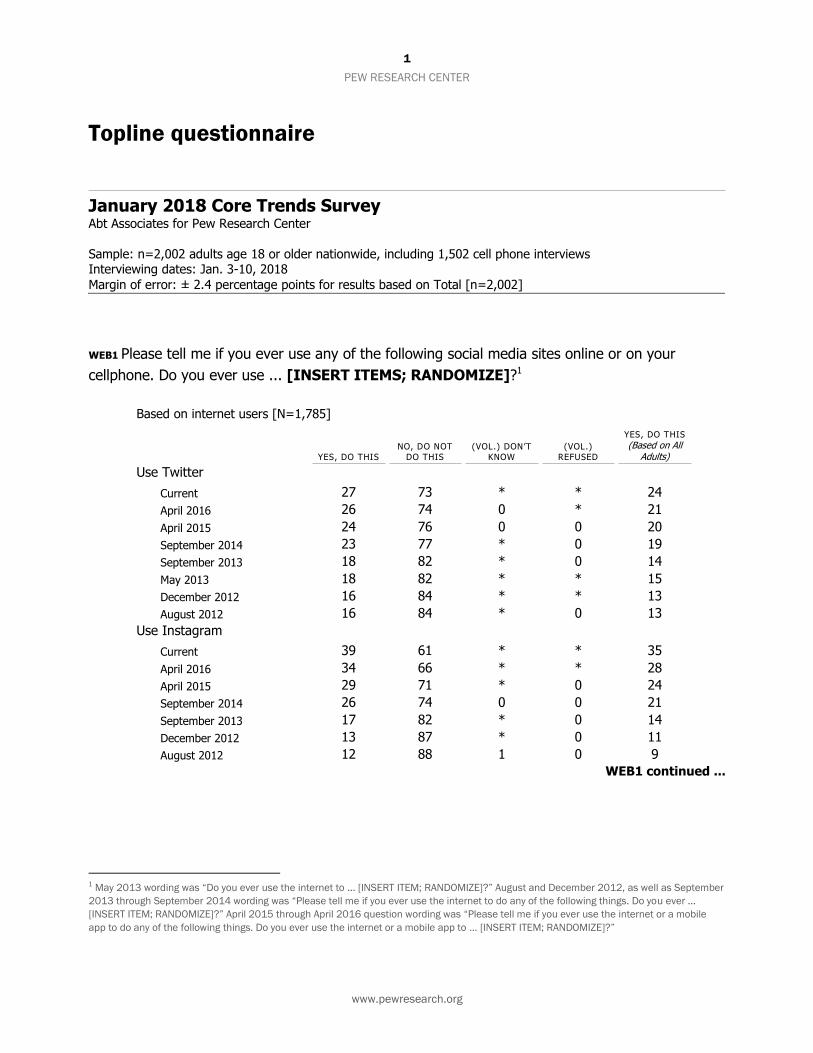
Topline questionnaire
WEB1 Please tell me if you ever use any of the following social media sites online or on your
cellphone. Do you ever use ... [INSERT ITEMS; RANDOMIZE]?1
Based on internet users [N=1,785]
YES, DO THIS
NO, DO NOT
DO THIS
(VOL.) DON’T
KNOW
(VOL.)
REFUSED
YES, DO THIS
(Based on All Adults)
Use Twitter
Current 27 73 * * 24
April 2016 26 74 0 * 21
April 2015 24 76 0 0 20
September 2014 23 77 * 0 19
September 2013 18 82 * 0 14
May 2013 18 82 * * 15
December 2012 16 84 * * 13
August 2012 16 84 * 0 13
Use Instagram
Current 39 61 * * 35
April 2016 34 66 * * 28
April 2015 29 71 * 0 24
September 2014 26 74 0 0 21
September 2013 17 82 * 0 14
December 2012 13 87 * 0 11
August 2012 12 88 1 0 9
WEB1 continued ...
1 May 2013 wording was “Do you ever use the internet to … [INSERT ITEM; RANDOMIZE]?” August and December 2012, as well as September
2013 through September 2014 wording was “Please tell me if you ever use the internet to do any of the following things. Do you ever …
[INSERT ITEM; RANDOMIZE]?” April 2015 through April 2016 question wording was “Please tell me if you ever use the internet or a mobile
app to do any of the following things. Do you ever use the internet or a mobile app to ... [INSERT ITEM; RANDOMIZE]?”
January 2018 Core Trends Survey
Abt Associates for Pew Research Center
Sample: n=2,002 adults age 18 or older nationwide, including 1,502 cell phone interviews Interviewing dates: Jan. 3-10, 2018
Margin of error: ± 2.4 percentage points for results based on Total [n=2,002]
2
PEW RESEARCH CENTER
www.pewresearch.org
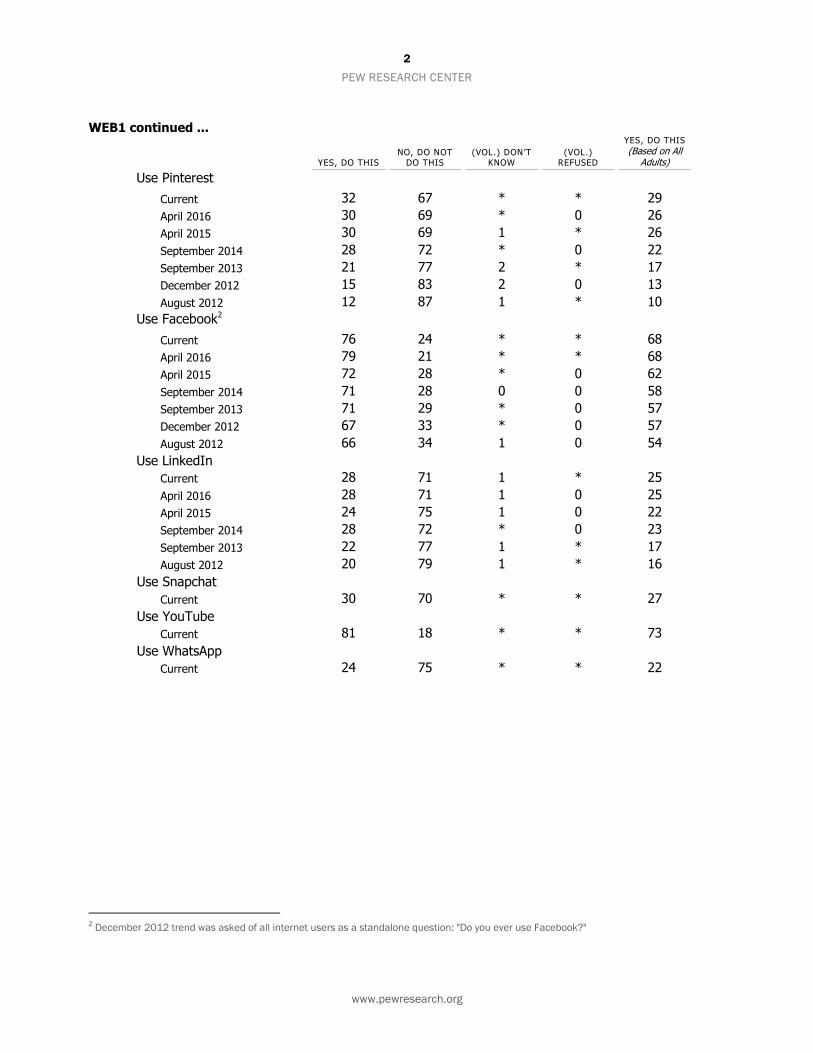
WEB1 continued ...
YES, DO THIS NO, DO NOT
DO THIS (VOL.) DON’T
KNOW (VOL.)
REFUSED
YES, DO THIS
(Based on All Adults)
Use Pinterest
Current 32 67 * * 29
April 2016 30 69 * 0 26
April 2015 30 69 1 * 26
September 2014 28 72 * 0 22
September 2013 21 77 2 * 17
December 2012 15 83 2 0 13
August 2012 12 87 1 * 10
Use Facebook2
Current 76 24 * * 68
April 2016 79 21 * * 68
April 2015 72 28 * 0 62
September 2014 71 28 0 0 58
September 2013 71 29 * 0 57
December 2012 67 33 * 0 57
August 2012 66 34 1 0 54
Use LinkedIn
Current 28 71 1 * 25
April 2016 28 71 1 0 25
April 2015 24 75 1 0 22
September 2014 28 72 * 0 23
September 2013 22 77 1 * 17
August 2012 20 79 1 * 16
Use Snapchat
Current 30 70 * * 27
Use YouTube
Current 81 18 * * 73
Use WhatsApp
Current 24 75 * * 22
2 December 2012 trend was asked of all internet users as a standalone question: "Do you ever use Facebook?"
3
PEW RESEARCH CENTER
www.pewresearch.org
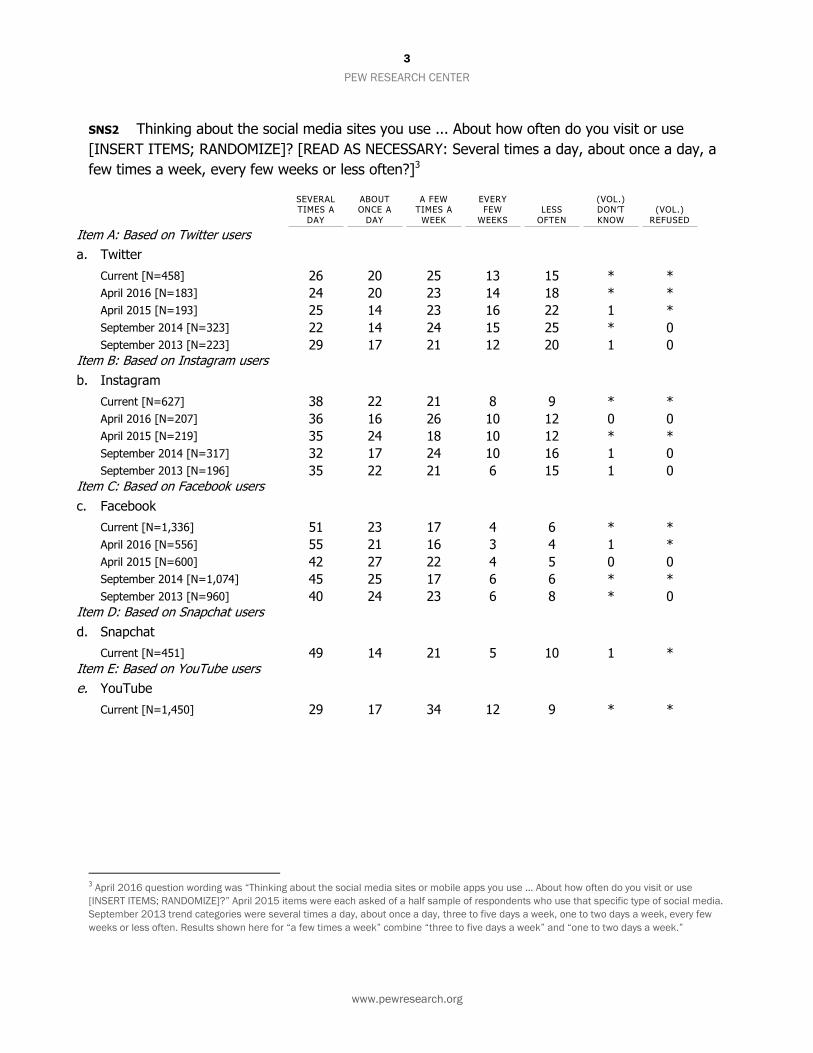
SNS2 Thinking about the social media sites you use ... About how often do you visit or use
[INSERT ITEMS; RANDOMIZE]? [READ AS NECESSARY: Several times a day, about once a day, a
few times a week, every few weeks or less often?]3
SEVERAL TIMES A
DAY
ABOUT ONCE A
DAY
A FEW TIMES A
WEEK
EVERY FEW
WEEKS
LESS
OFTEN
(VOL.) DON’T
KNOW
(VOL.)
REFUSED
Item A: Based on Twitter users a. Twitter
Current [N=458] 26 20 25 13 15 * *
April 2016 [N=183] 24 20 23 14 18 * *
April 2015 [N=193] 25 14 23 16 22 1 *
September 2014 [N=323] 22 14 24 15 25 * 0
September 2013 [N=223] 29 17 21 12 20 1 0 Item B: Based on Instagram users
b. Instagram
Current [N=627] 38 22 21 8 9 * *
April 2016 [N=207] 36 16 26 10 12 0 0
April 2015 [N=219] 35 24 18 10 12 * *
September 2014 [N=317] 32 17 24 10 16 1 0
September 2013 [N=196] 35 22 21 6 15 1 0 Item C: Based on Facebook users
c. Facebook
Current [N=1,336] 51 23 17 4 6 * *
April 2016 [N=556] 55 21 16 3 4 1 *
April 2015 [N=600] 42 27 22 4 5 0 0
September 2014 [N=1,074] 45 25 17 6 6 * *
September 2013 [N=960] 40 24 23 6 8 * 0 Item D: Based on Snapchat users
d. Snapchat
Current [N=451] 49 14 21 5 10 1 * Item E: Based on YouTube users
e. YouTube
Current [N=1,450] 29 17 34 12 9 * *
3 April 2016 question wording was “Thinking about the social media sites or mobile apps you use ... About how often do you visit or use
[INSERT ITEMS; RANDOMIZE]?” April 2015 items were each asked of a half sample of respondents who use that specific type of social media.
September 2013 trend categories were several times a day, about once a day, three to five days a week, one to two days a week, every few
weeks or less often. Results shown here for “a few times a week” combine “three to five days a week” and “one to two days a week.”
4
PEW RESEARCH CENTER
www.pewresearch.org
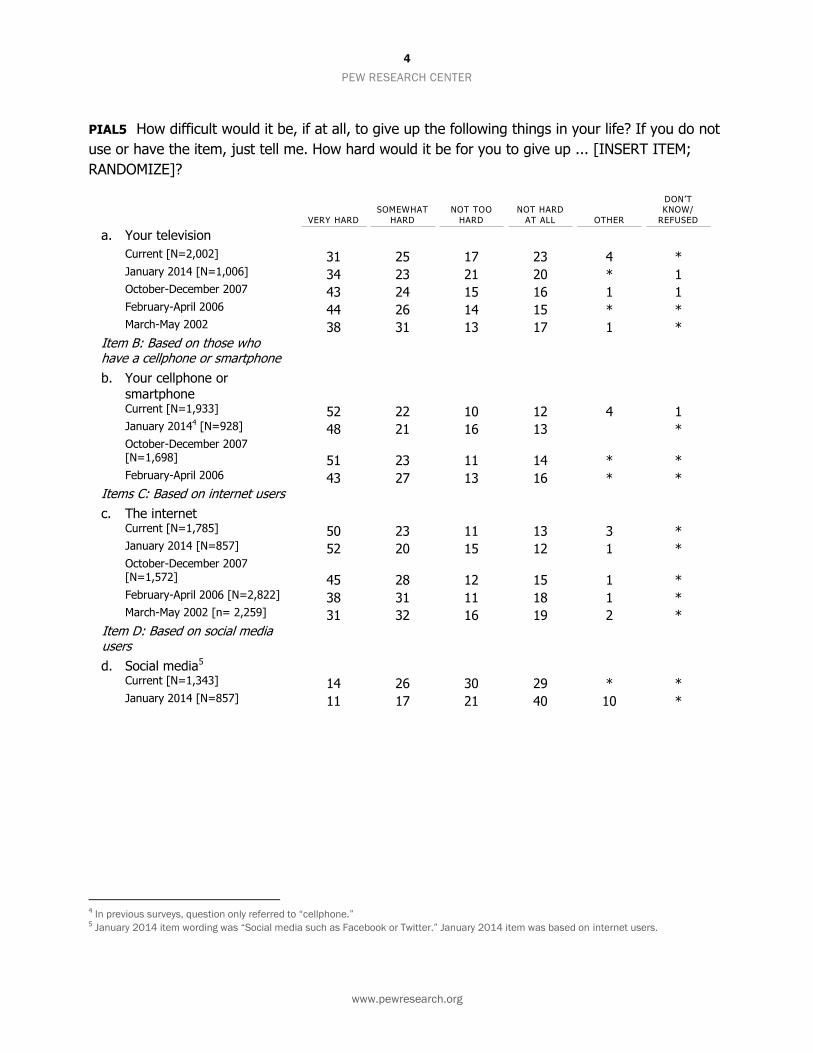
PIAL5 How difficult would it be, if at all, to give up the following things in your life? If you do not
use or have the item, just tell me. How hard would it be for you to give up ... [INSERT ITEM;
RANDOMIZE]?
VERY HARD
SOMEWHAT
HARD
NOT TOO
HARD
NOT HARD
AT ALL OTHER
DON’T KNOW/
REFUSED
a. Your television
Current [N=2,002] 31 25 17 23 4 * January 2014 [N=1,006] 34 23 21 20 * 1 October-December 2007 43 24 15 16 1 1 February-April 2006 44 26 14 15 * * March-May 2002 38 31 13 17 1 *
Item B: Based on those who have a cellphone or smartphone
b. Your cellphone or smartphone Current [N=1,933] 52 22 10 12 4 1 January 20144 [N=928] 48 21 16 13 * October-December 2007 [N=1,698] 51 23 11 14 * * February-April 2006 43 27 13 16 * *
Items C: Based on internet users
c. The internet Current [N=1,785] 50 23 11 13 3 * January 2014 [N=857] 52 20 15 12 1 * October-December 2007 [N=1,572] 45 28 12 15 1 * February-April 2006 [N=2,822] 38 31 11 18 1 * March-May 2002 [n= 2,259] 31 32 16 19 2 *
Item D: Based on social media users
d. Social media5
Current [N=1,343] 14 26 30 29 * * January 2014 [N=857] 11 17 21 40 10 *
4 In previous surveys, question only referred to “cellphone.” 5 January 2014 item wording was “Social media such as Facebook or Twitter.” January 2014 item was based on internet users.